

Dissipative Particle Dynamics: Simulation of Chitosan–Citral Microcapsules


Abstract
1. Introduction
2. Method
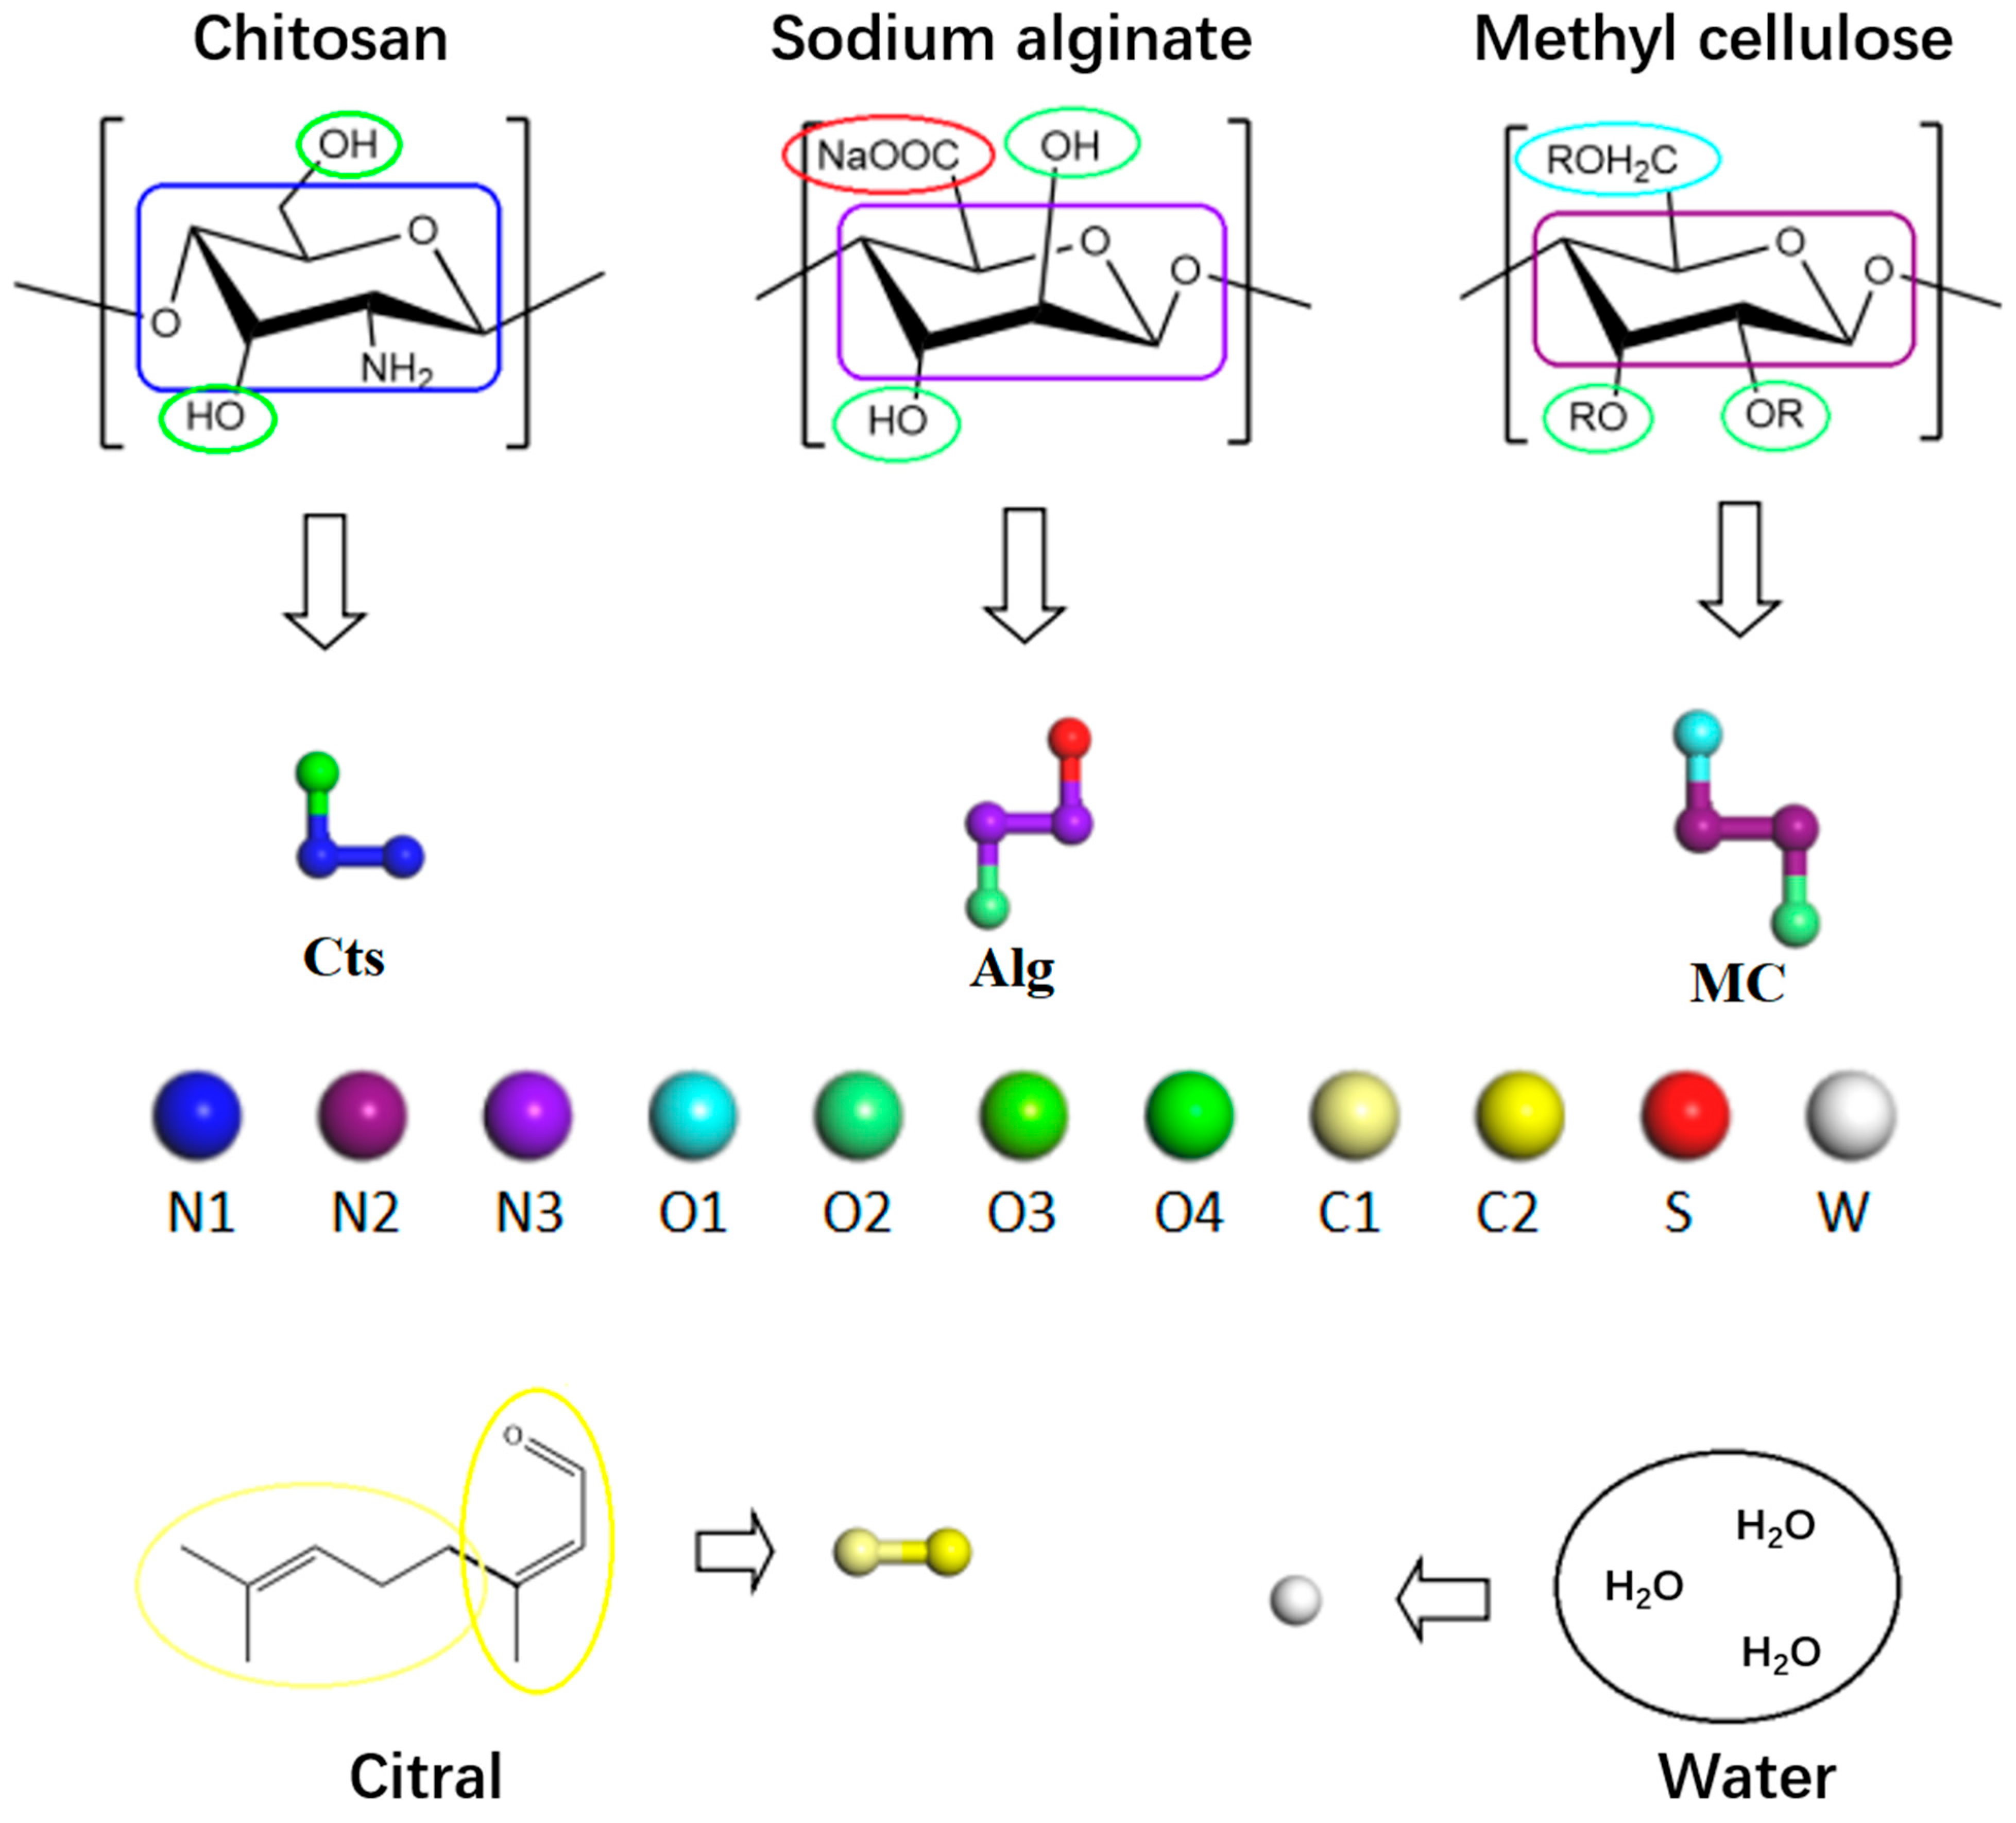
2.1. Coarse-Grained Model
2.2. Interaction Parameters Between Beads
2.3. Simulation System and Scheme
3. Results and Discussion
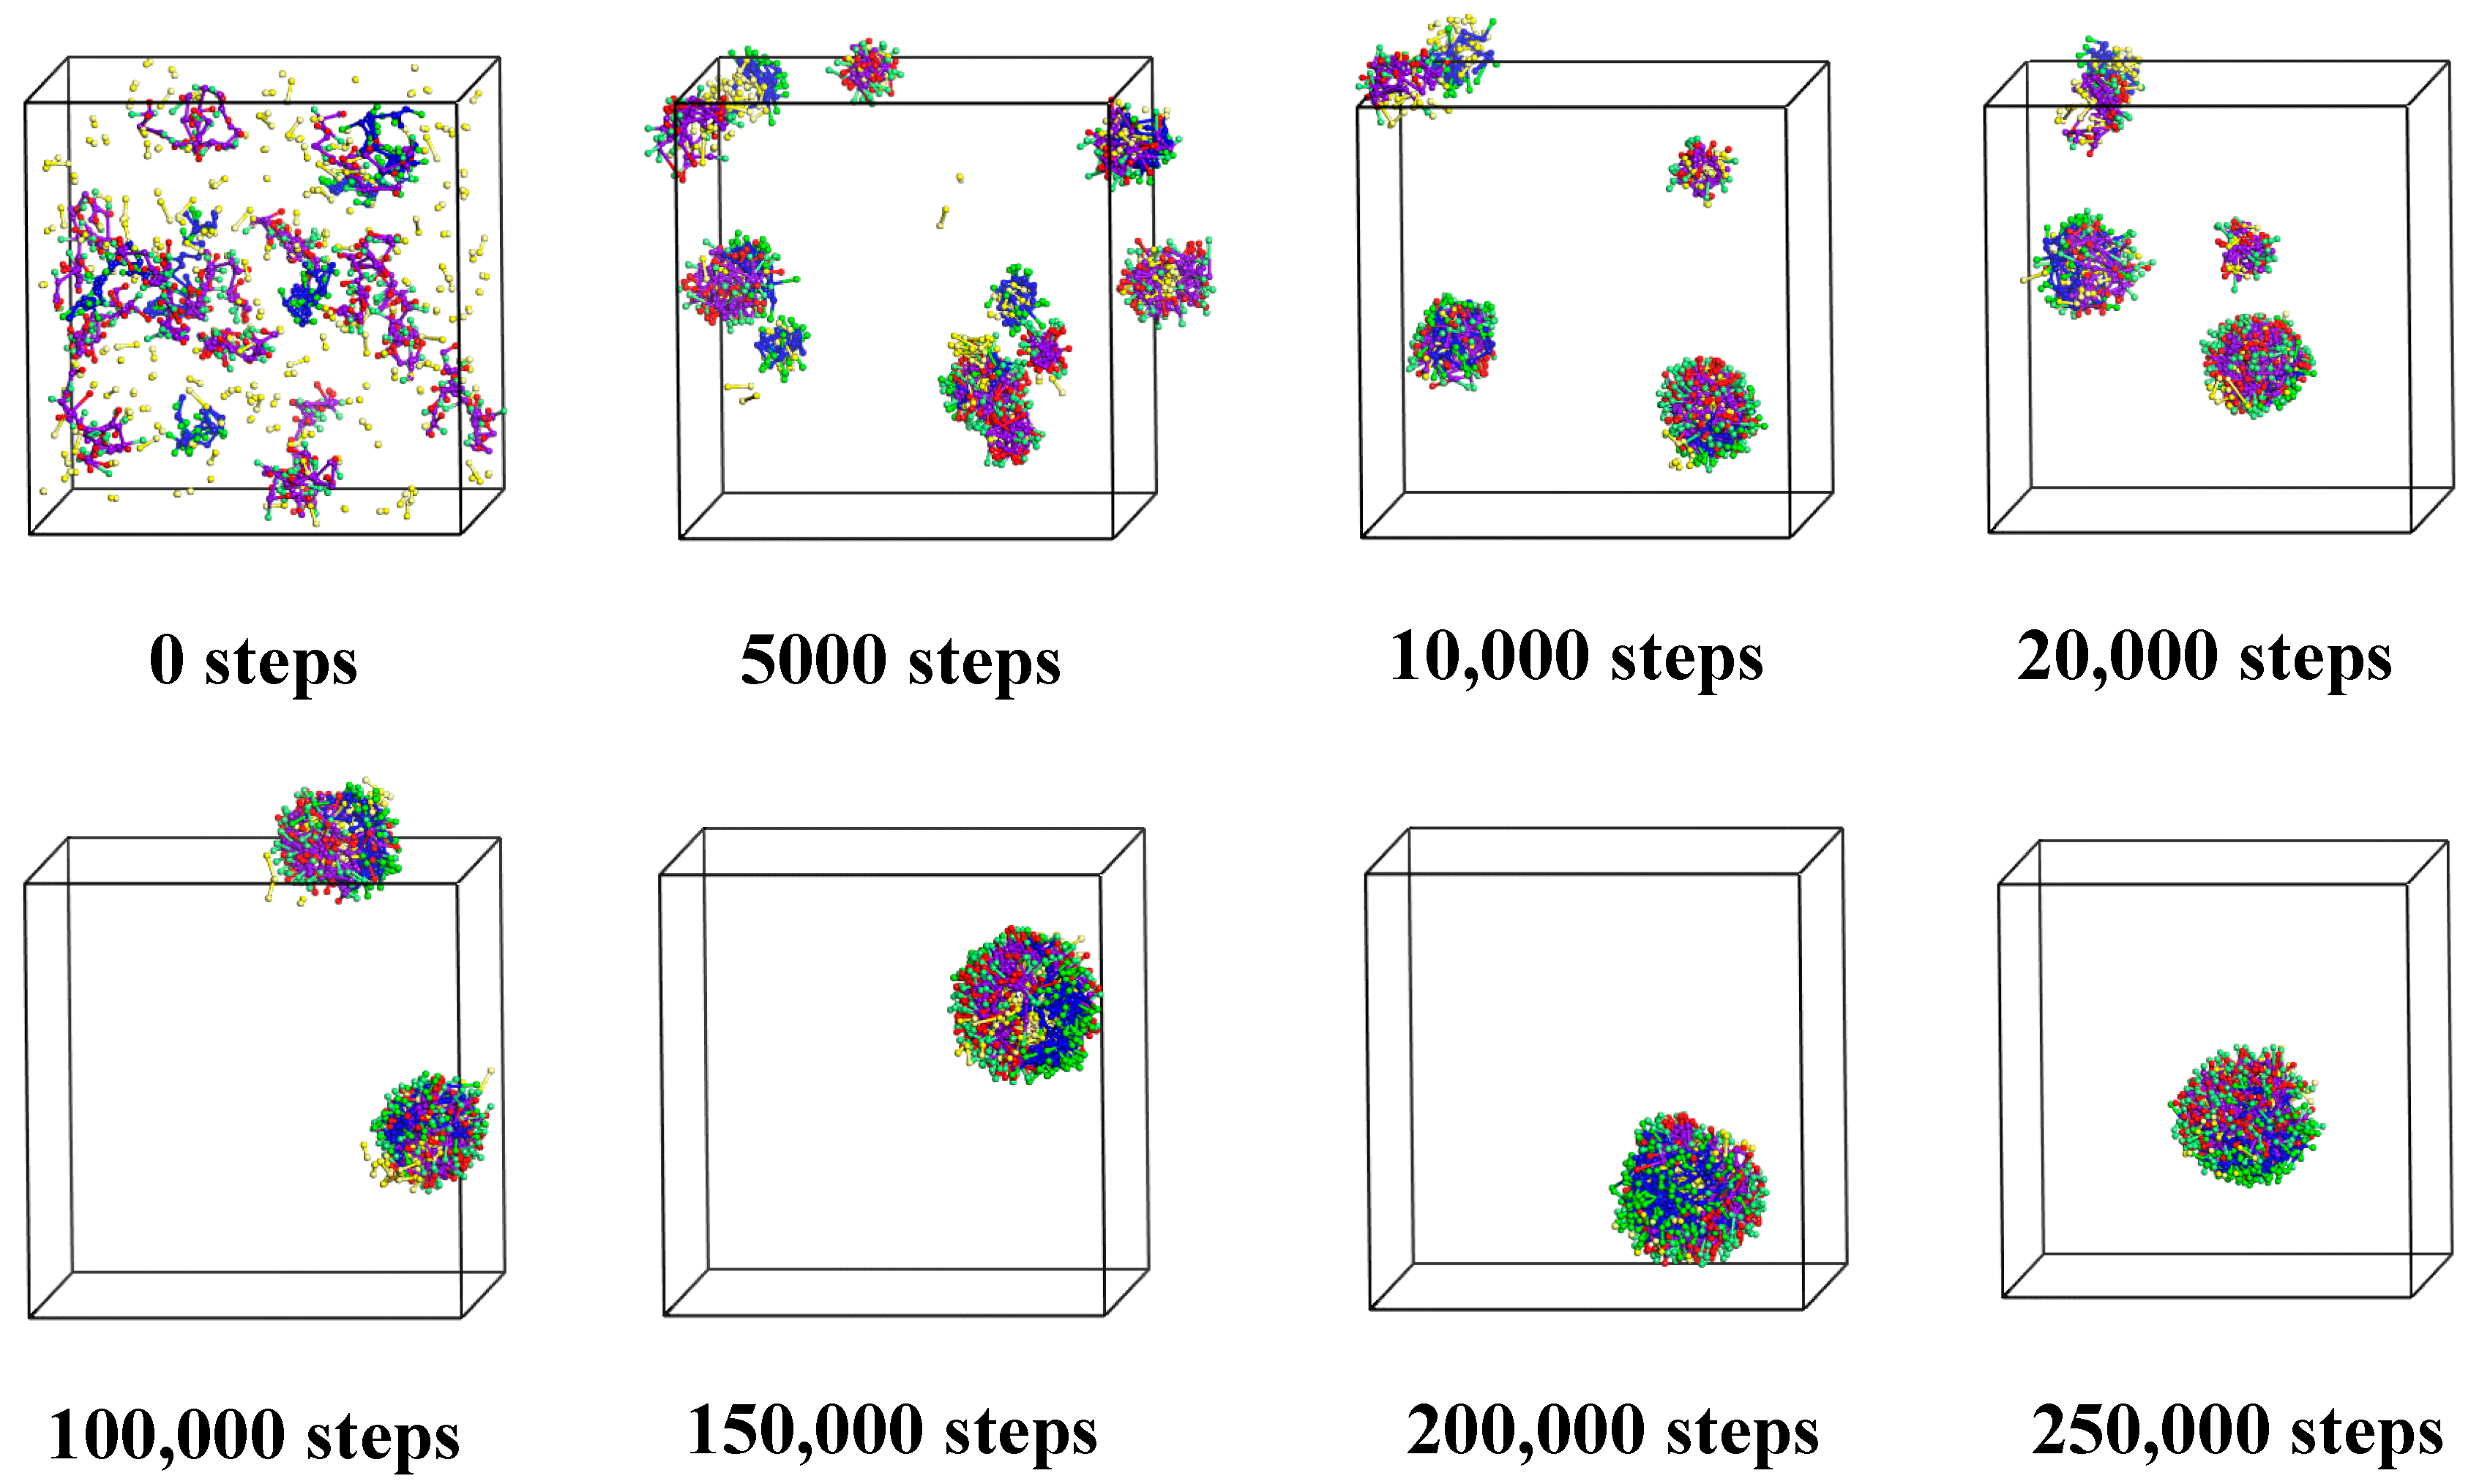
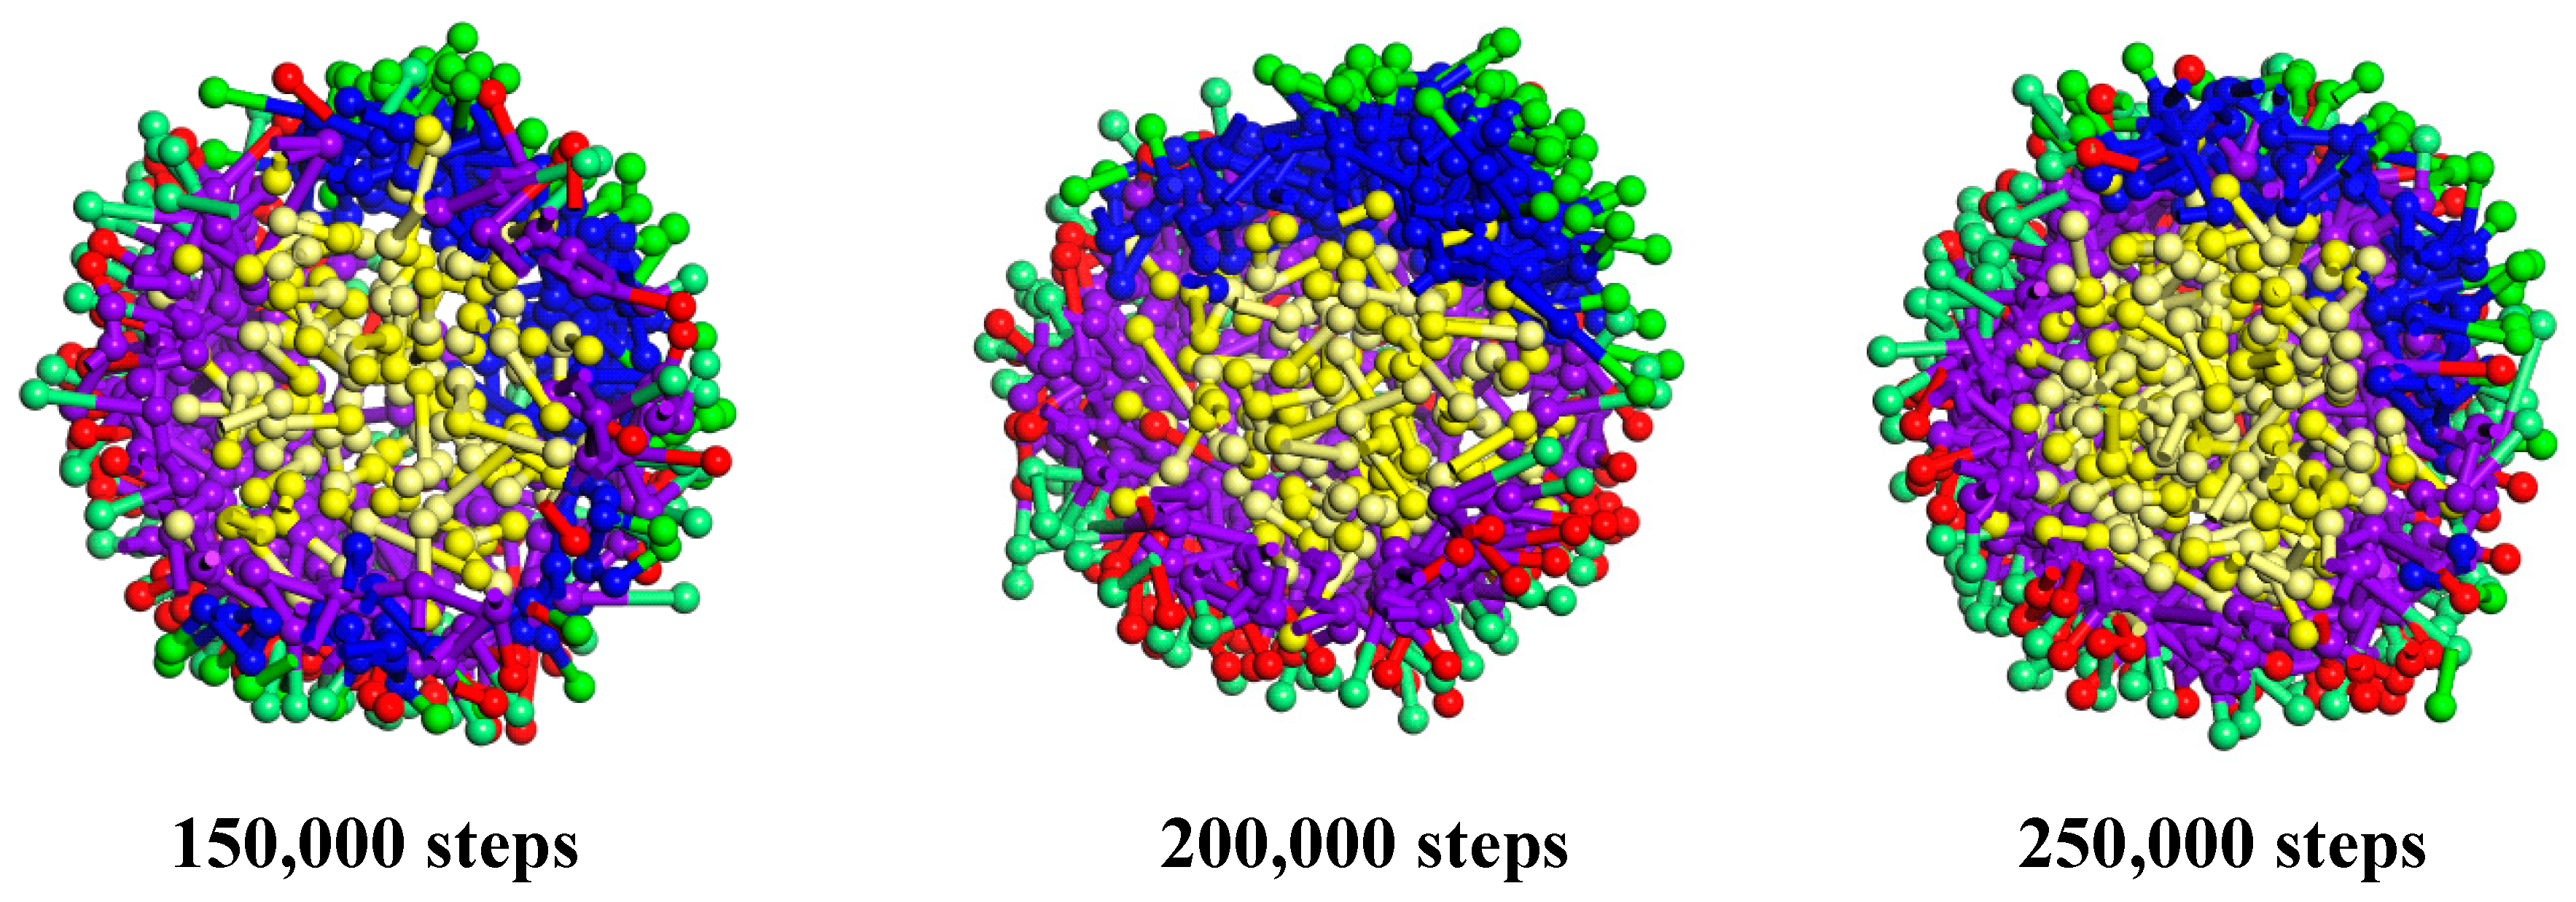
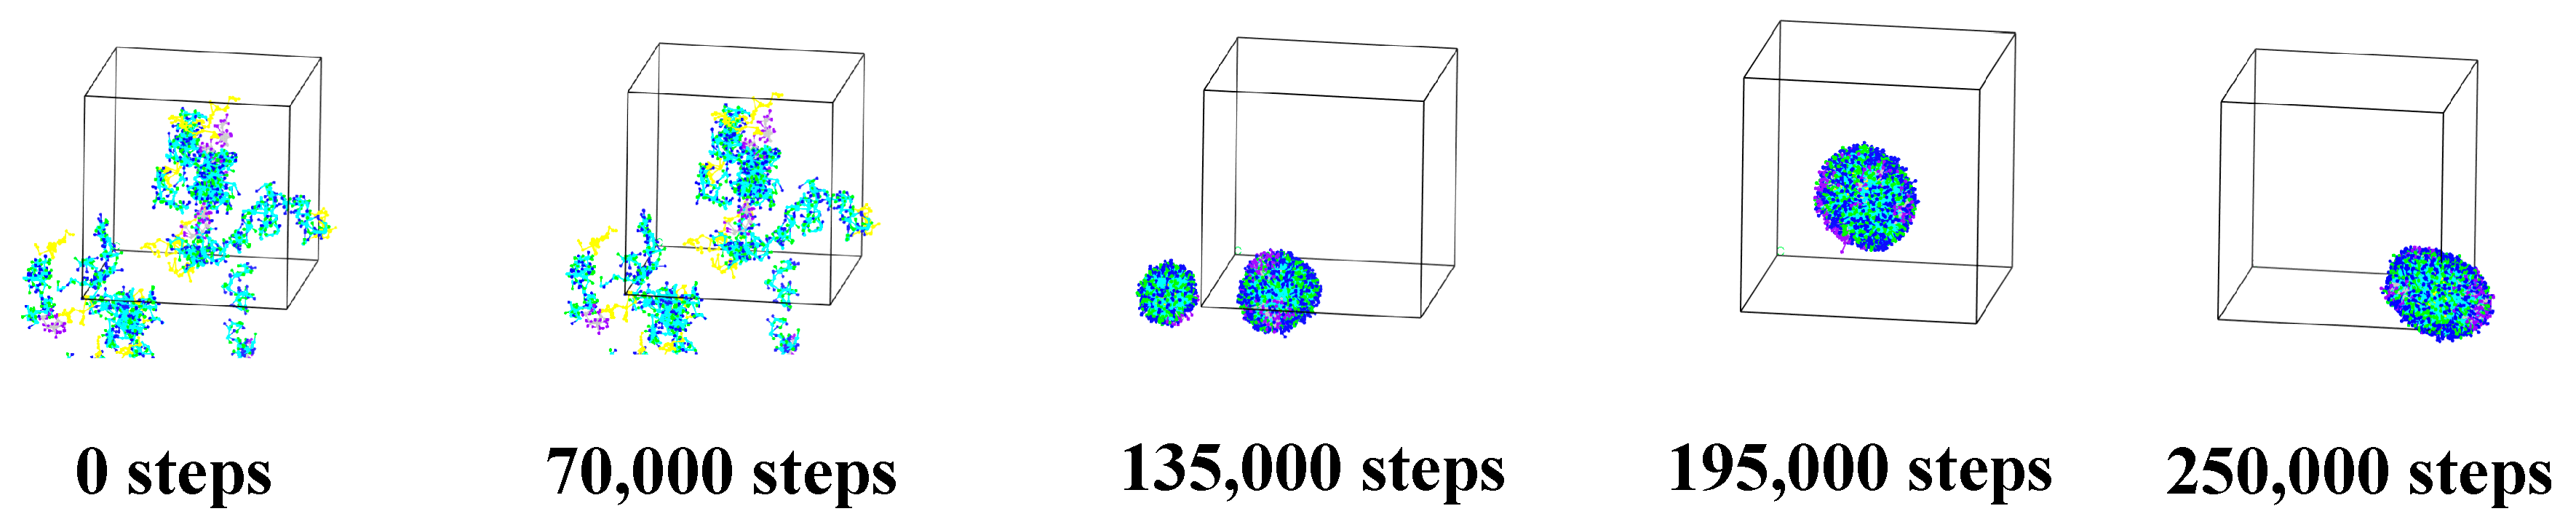
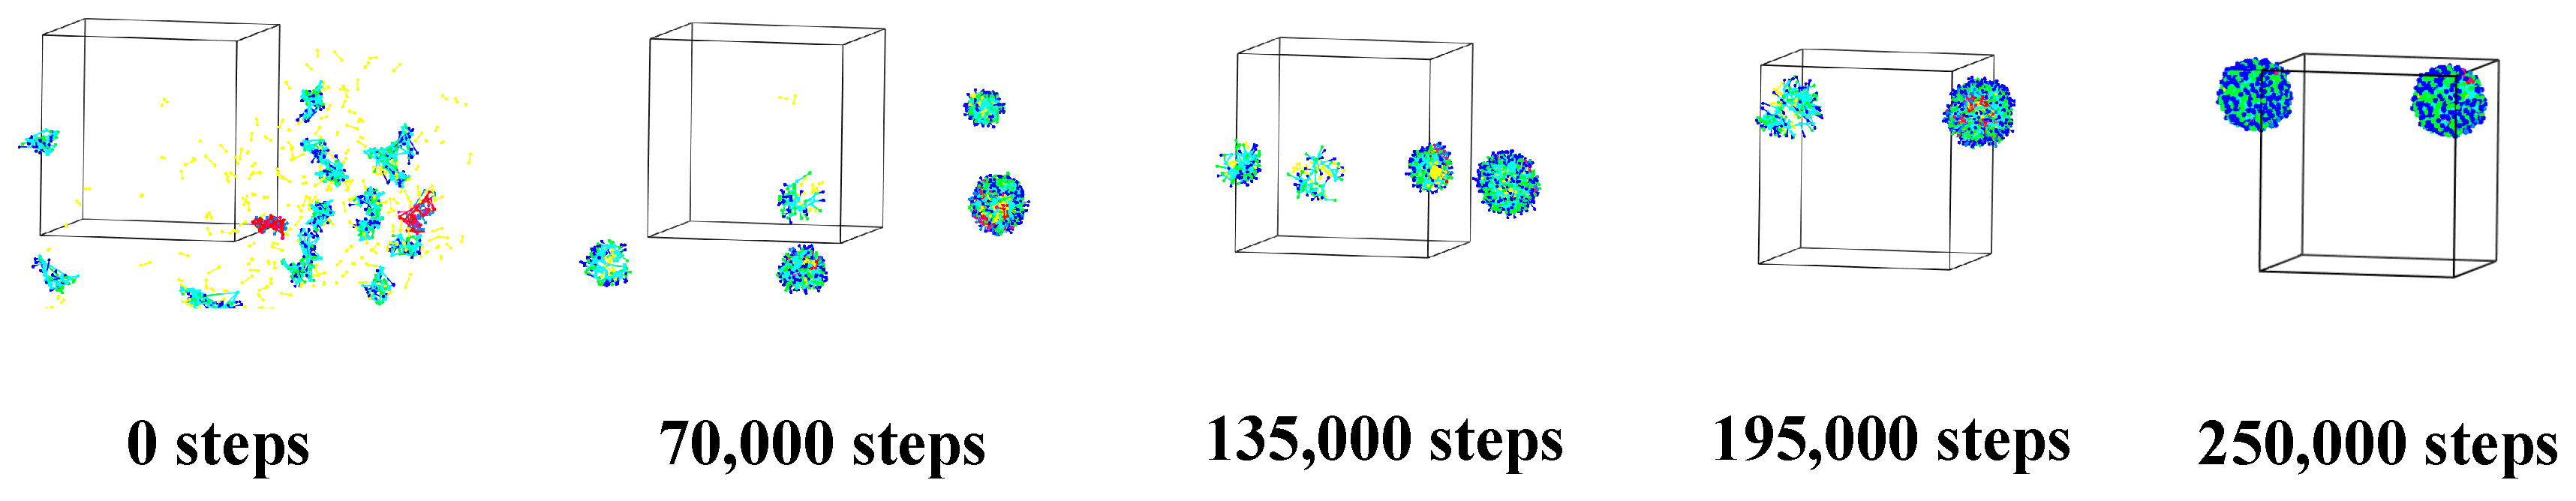
3.1. Self-Assembly Process of Microcapsules
3.1.1. Cts–Alg Double-Wall Microcapsule
3.1.2. Alg–Cts Double-Wall Material Microcapsule
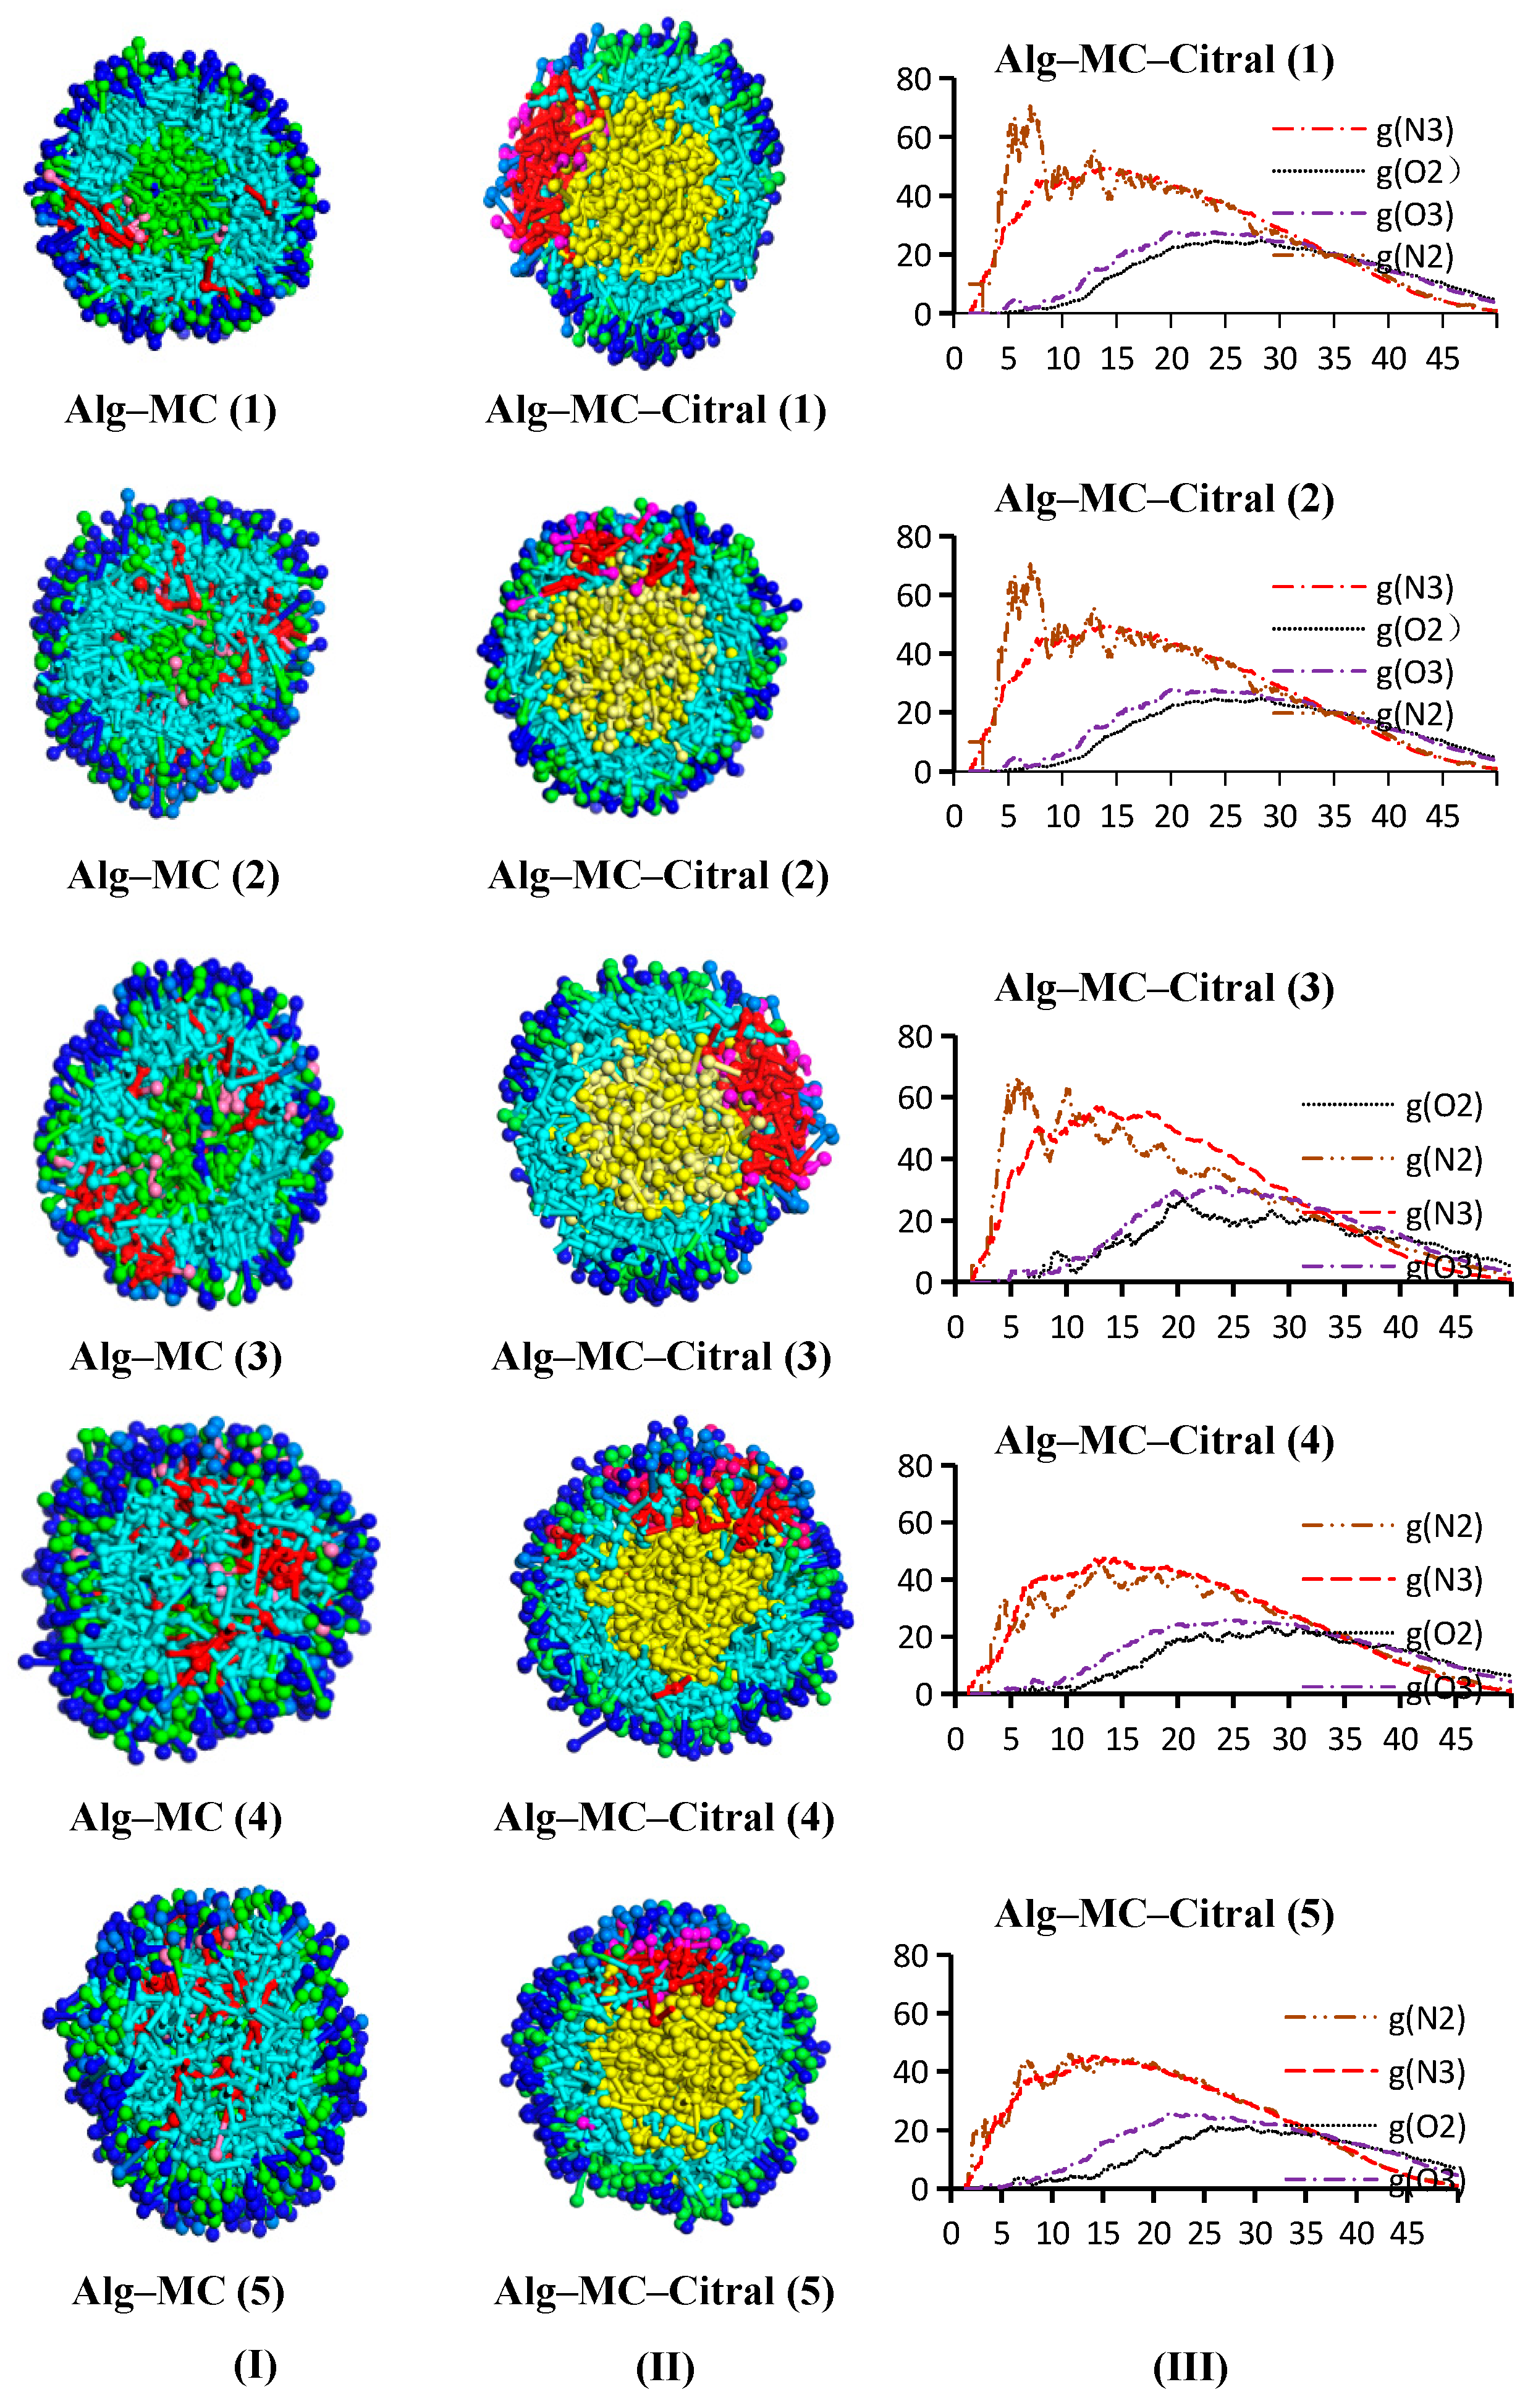
3.1.3. Alg–MC Double-Wall Microcapsule
3.2. Structure Analysis of Microcapsules
3.2.1. Single-Wall Material
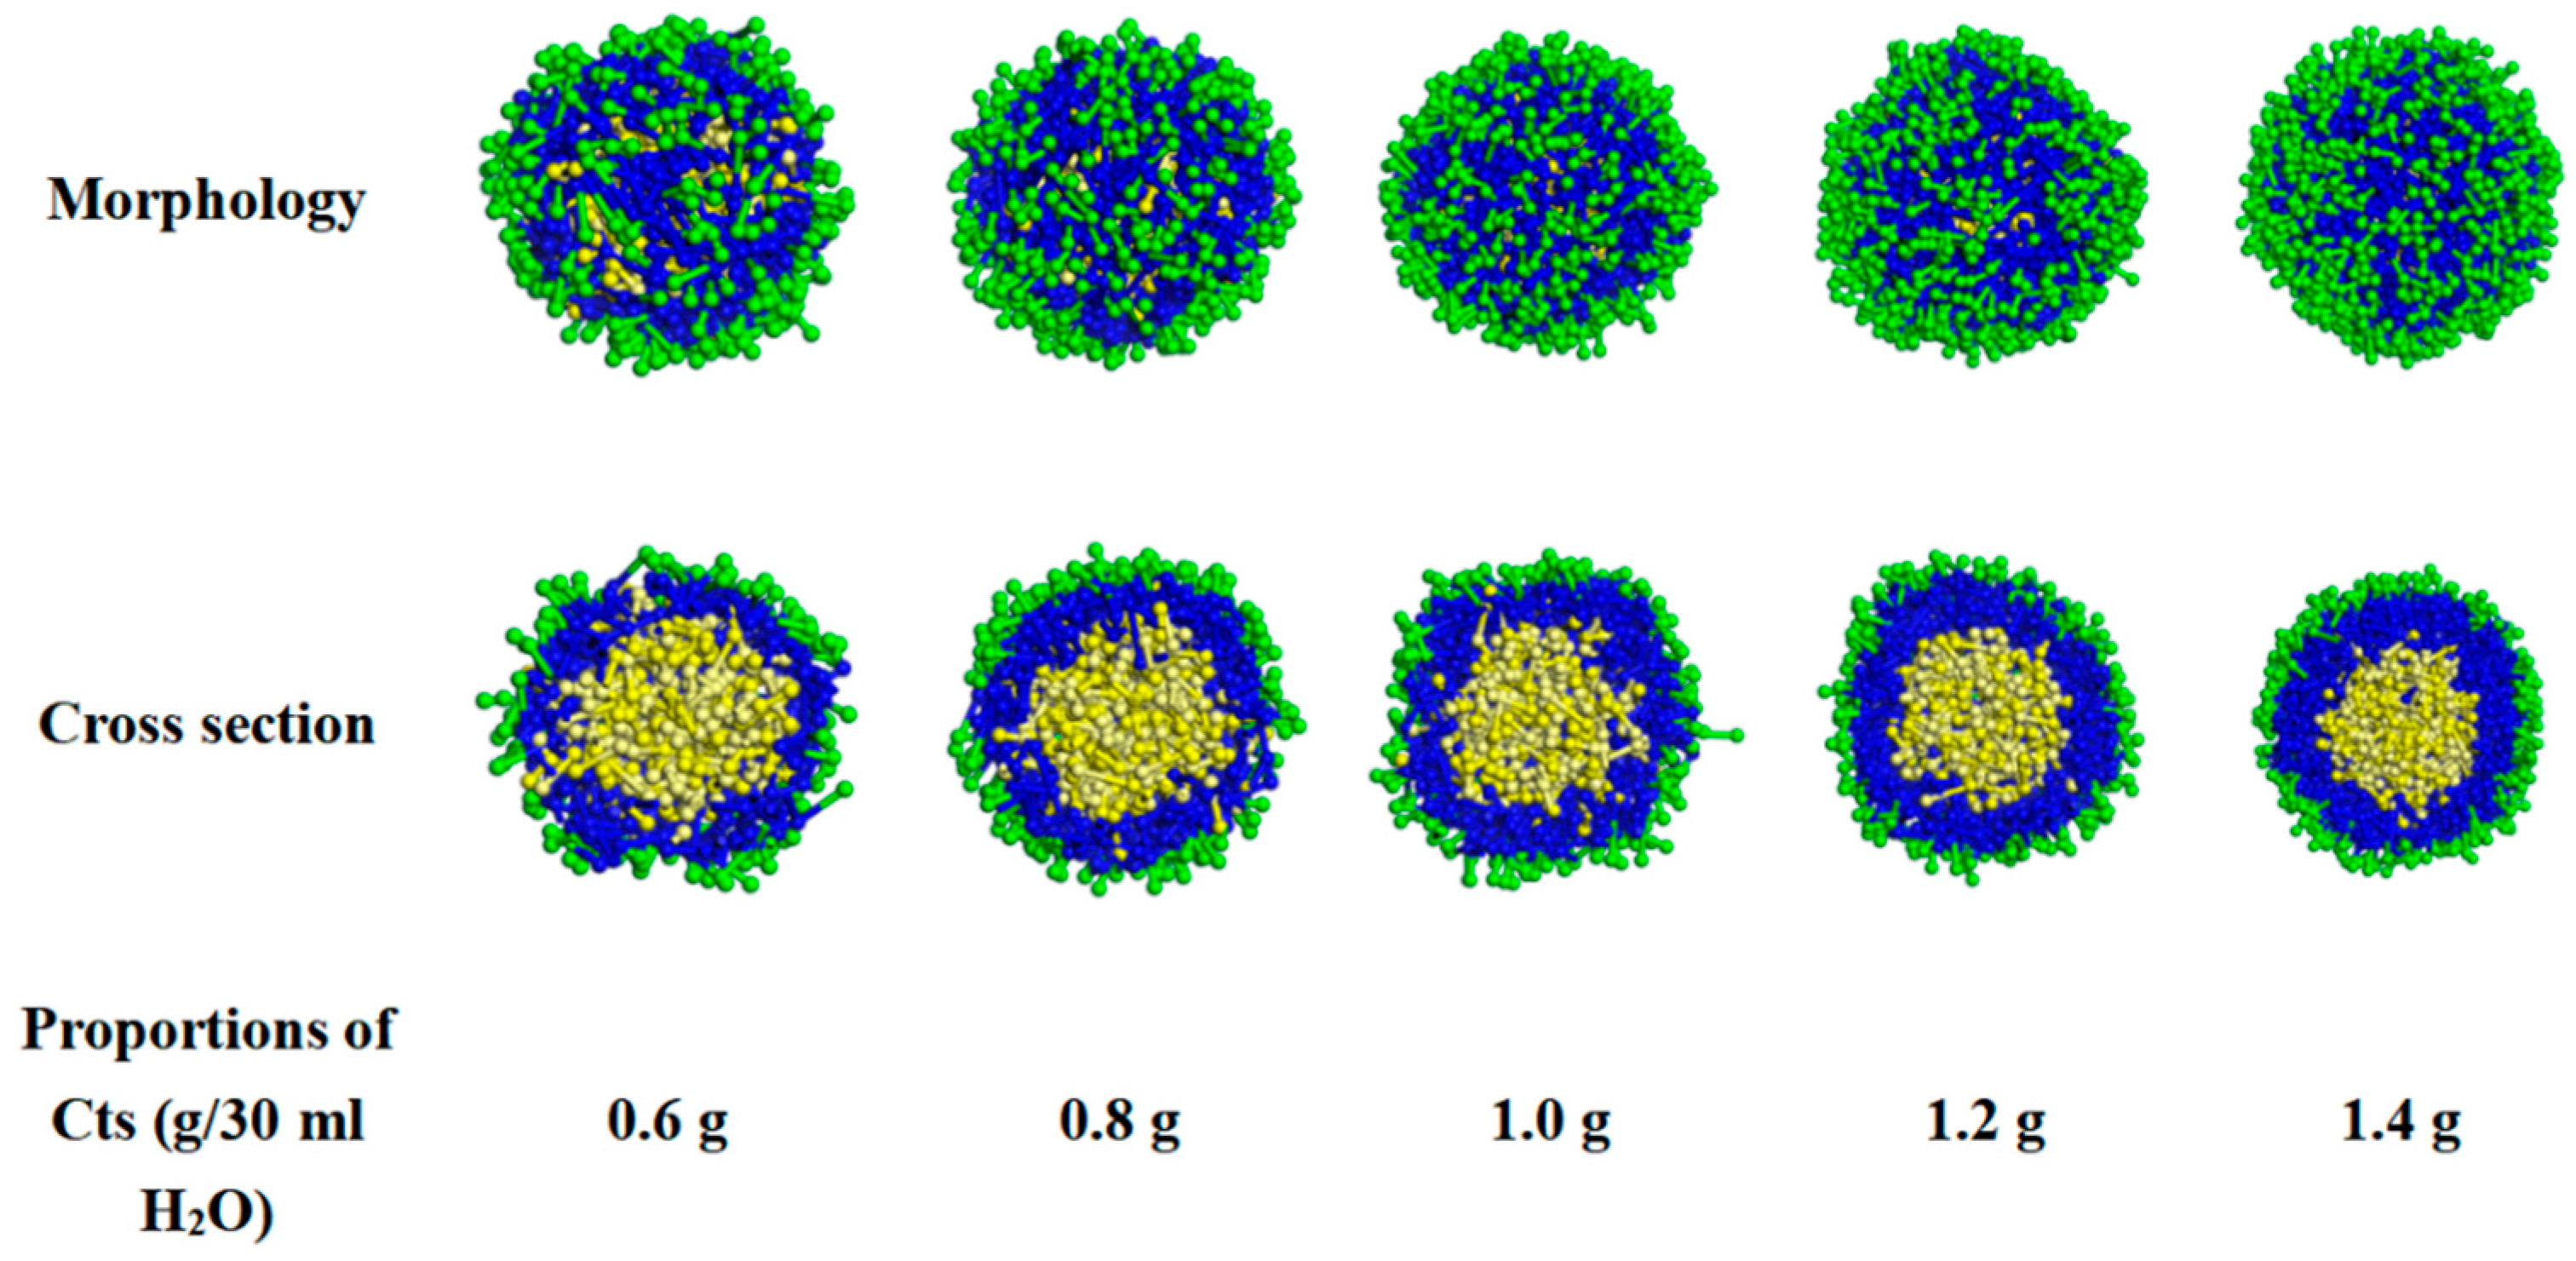
Cts–Citral Single-Wall Microcapsule
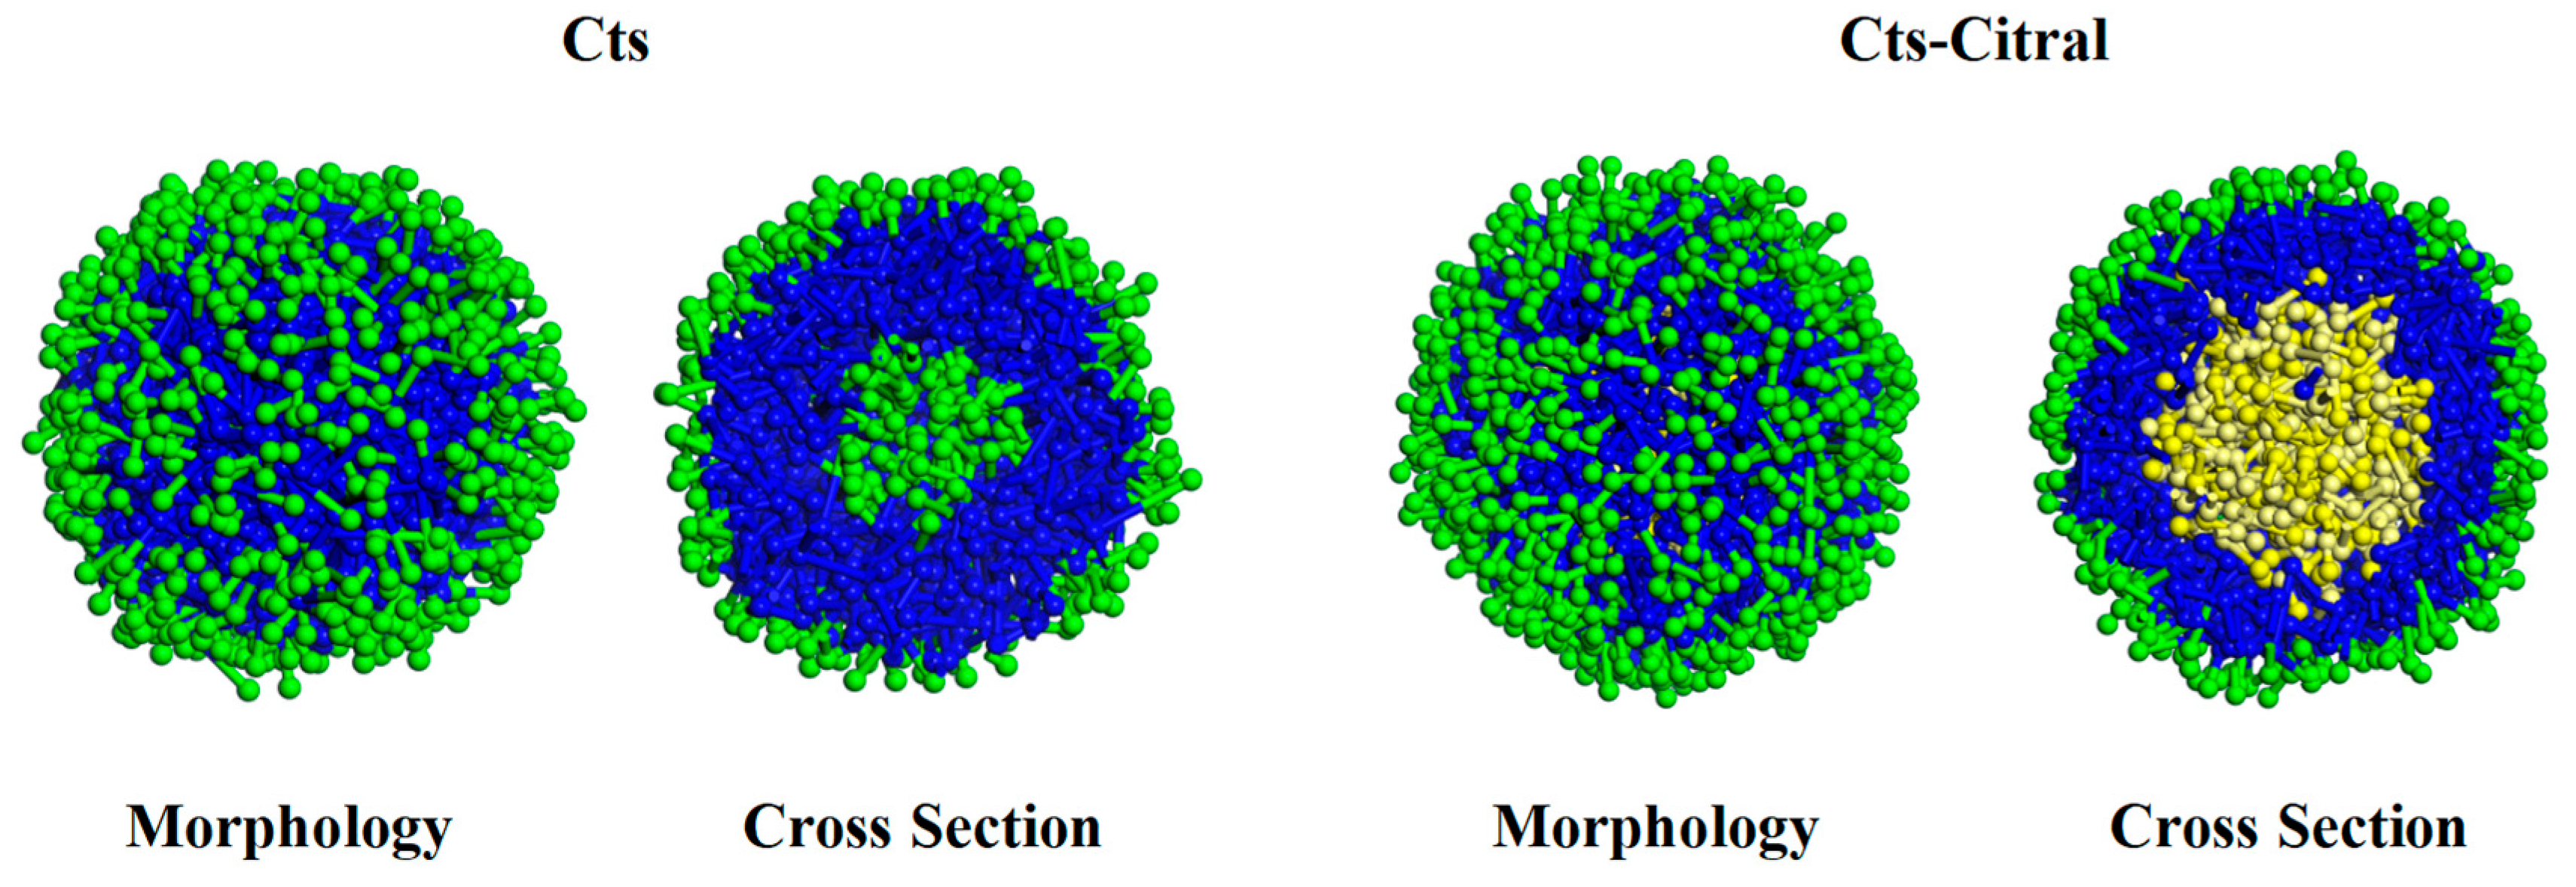
- (a)
- Effect of Cts content on the appearance and cross-section of Cts–Citral microcapsules
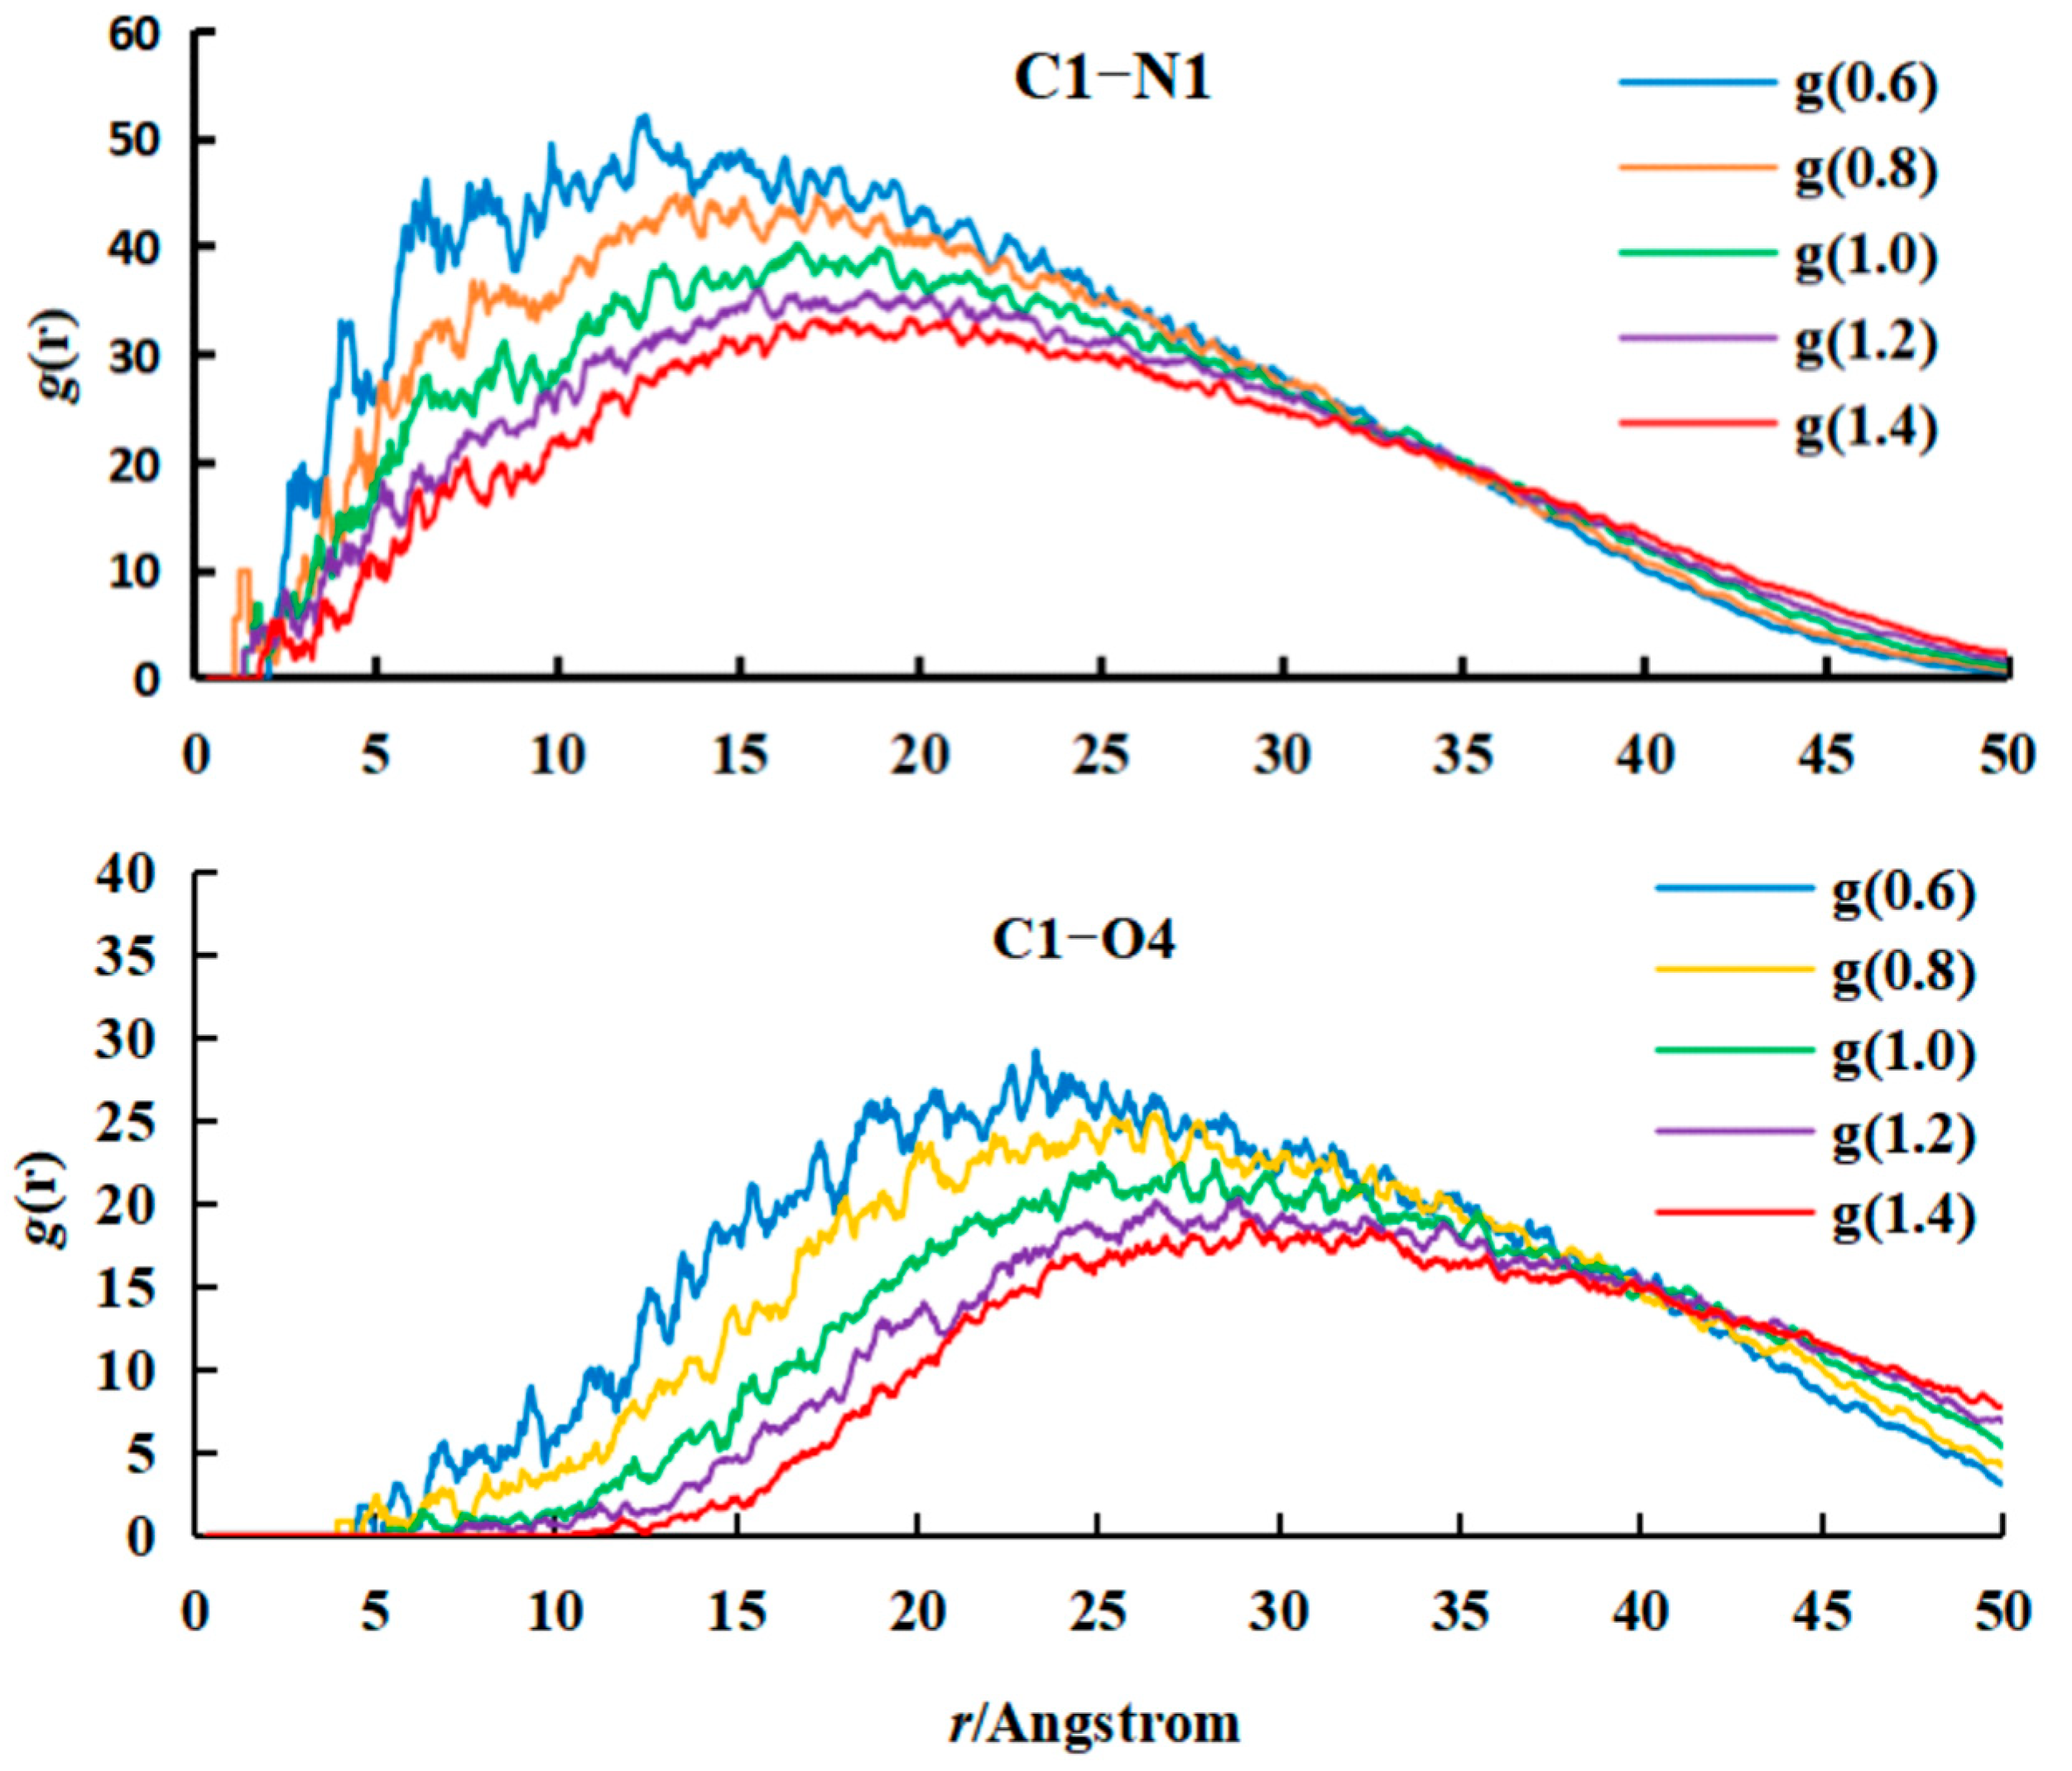
- (b)
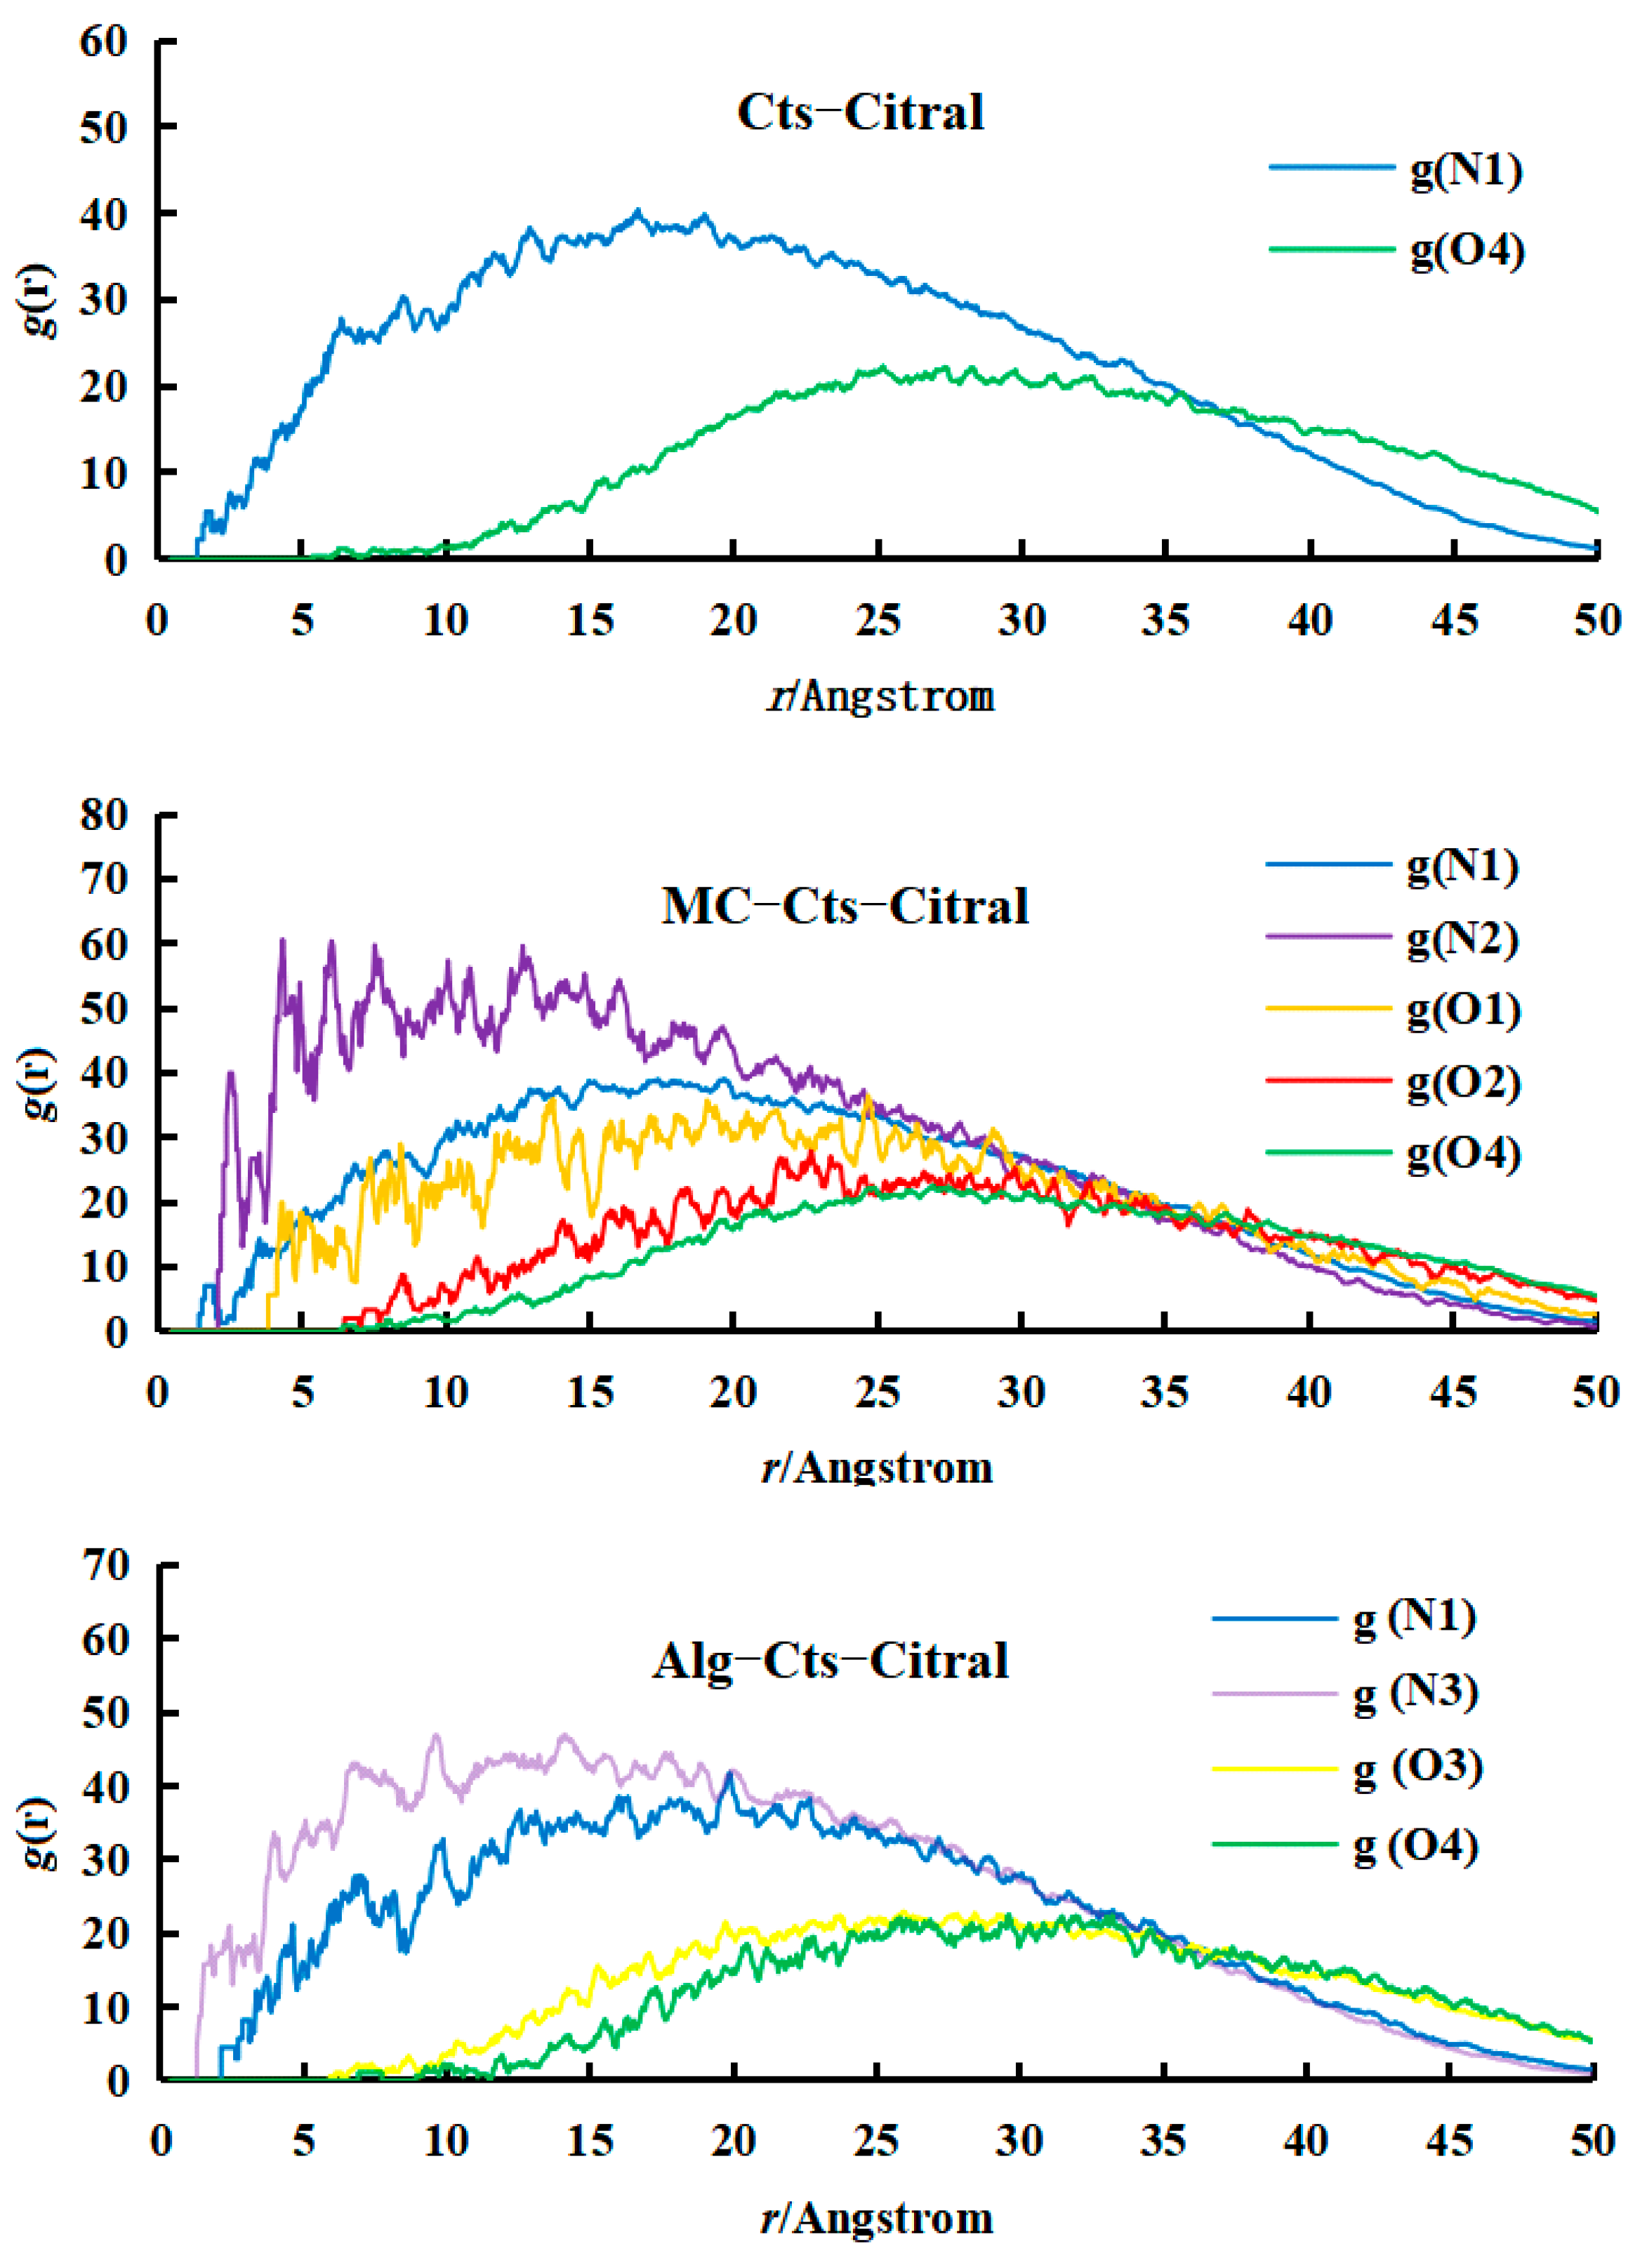
- Analysis of RDF
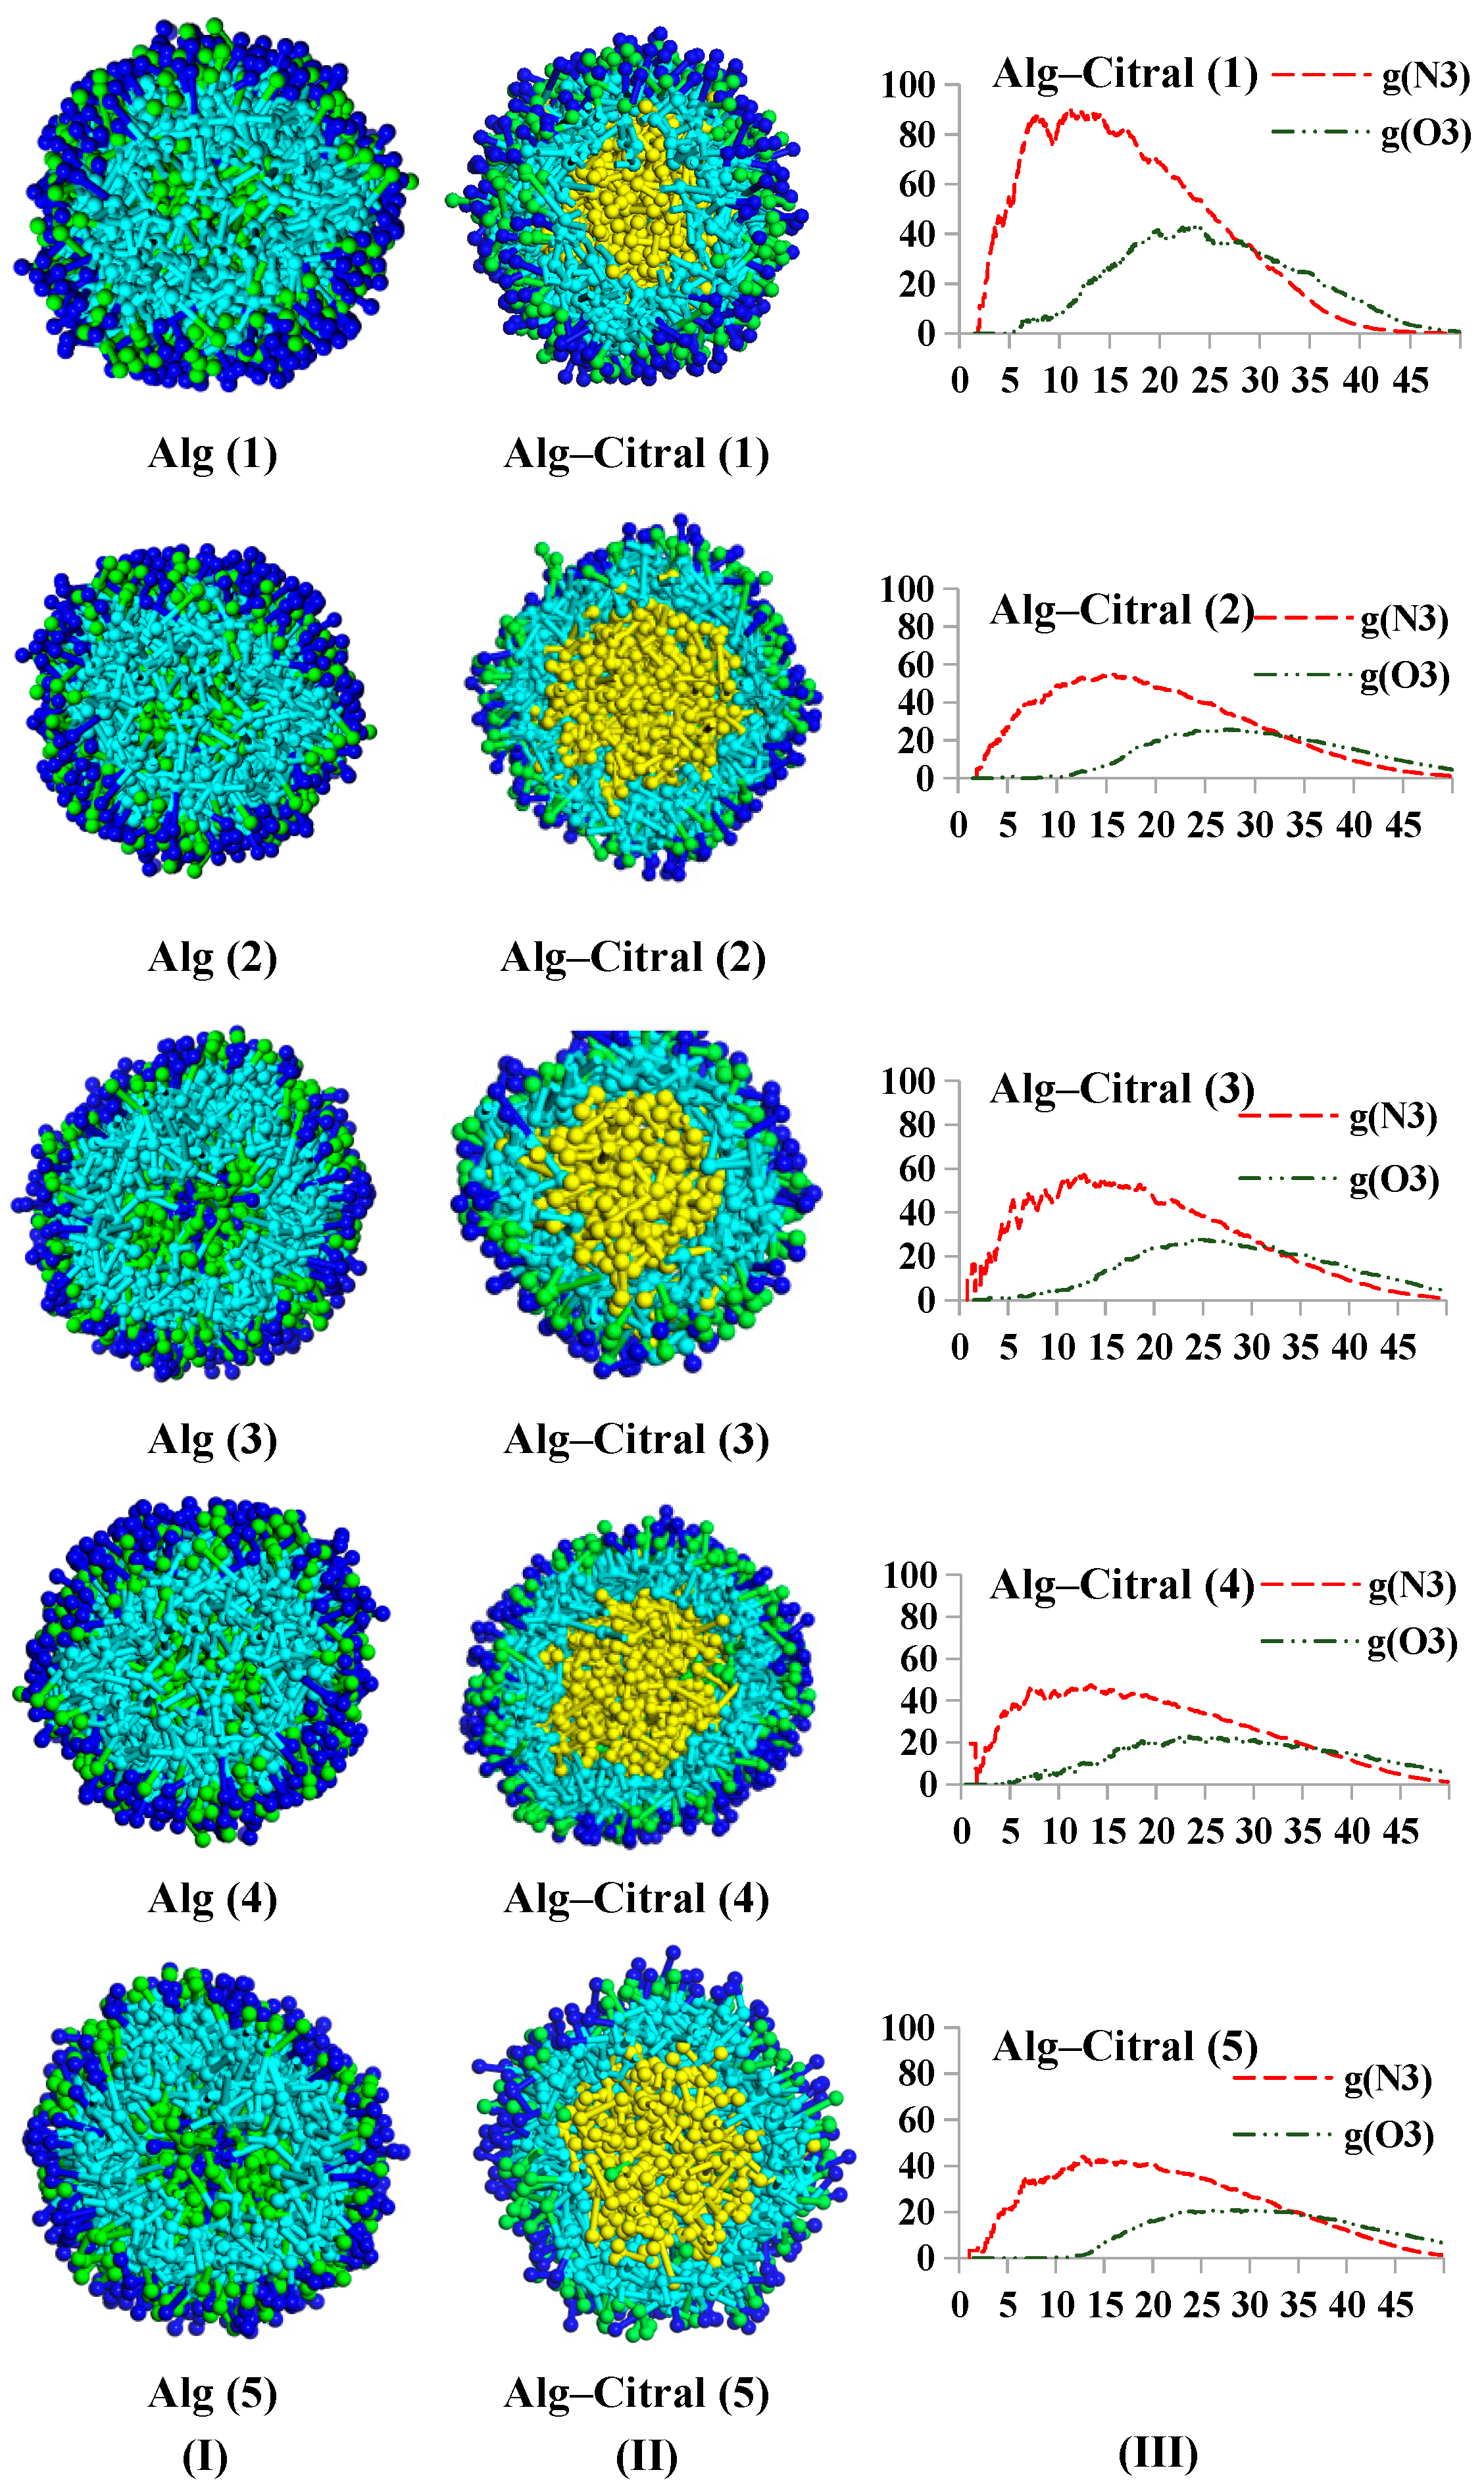
Alg–Citral Single-Wall Microcapsule
3.2.2. Double-Wall Material Microcapsule
Cts–Alg–Citral and Cts–MC–Citral Microcapsules
- (a)
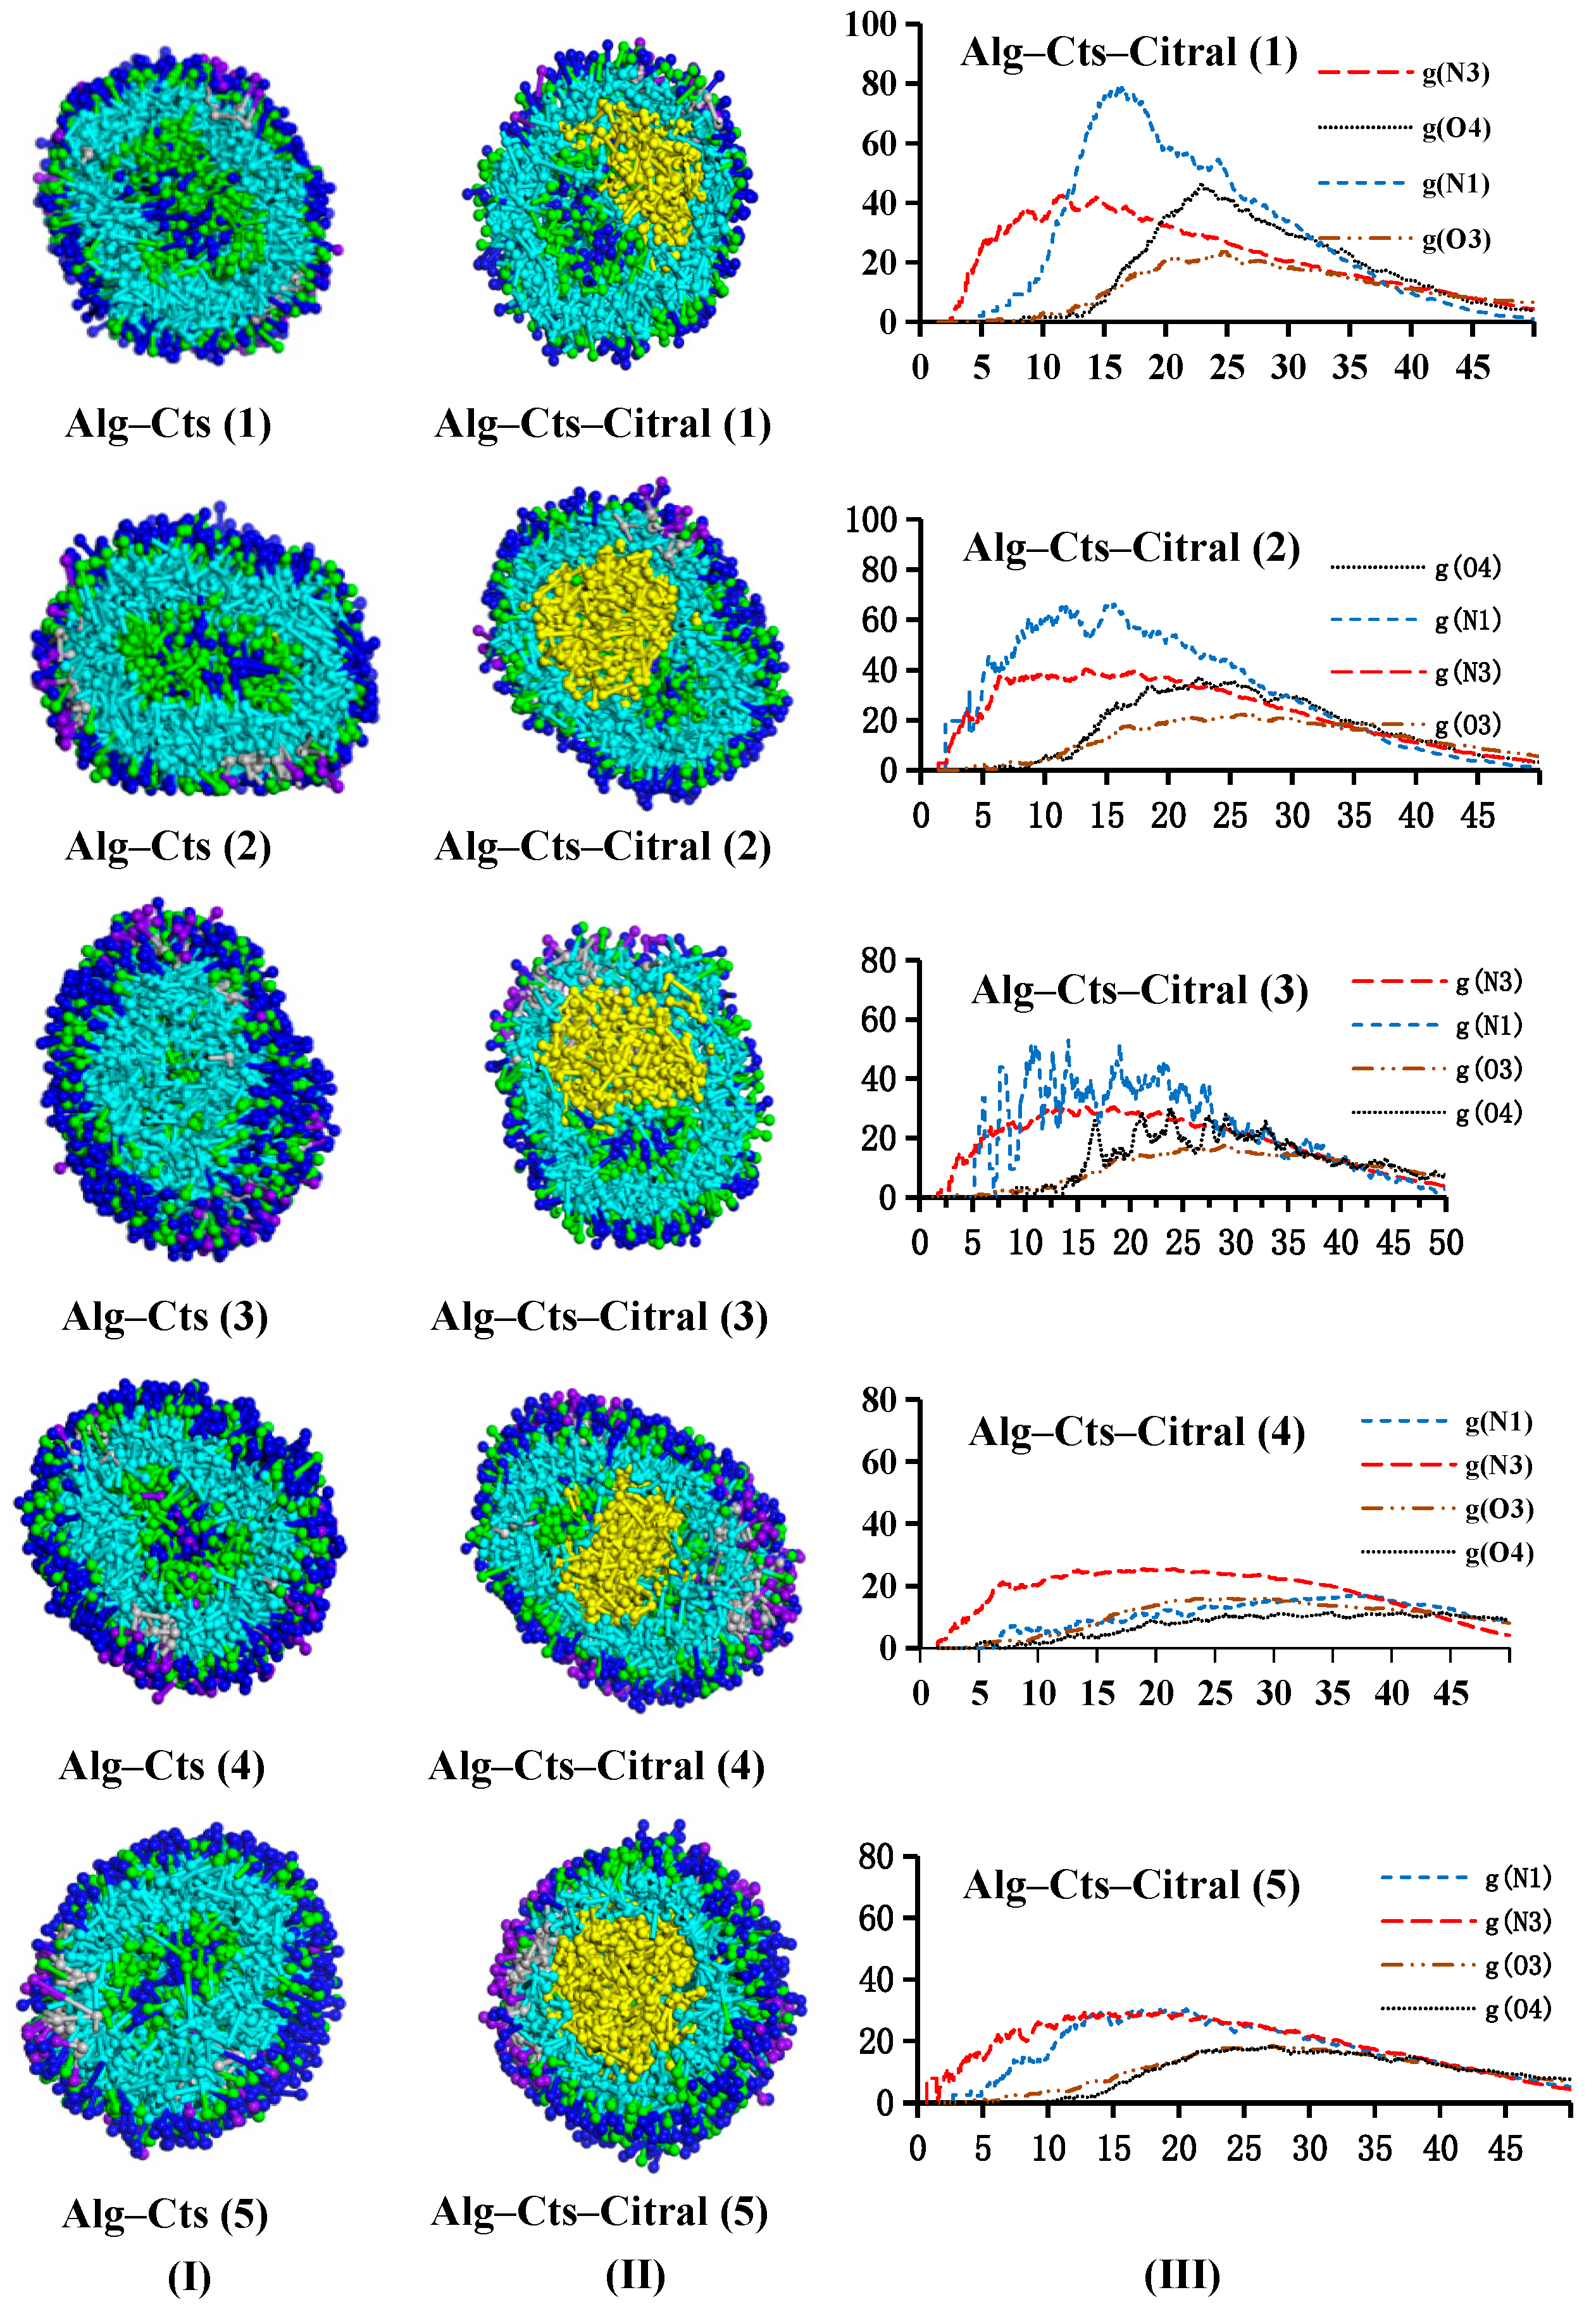
- Appearance and cross-section of microcapsules

- (b)
- Analysis of the RDF
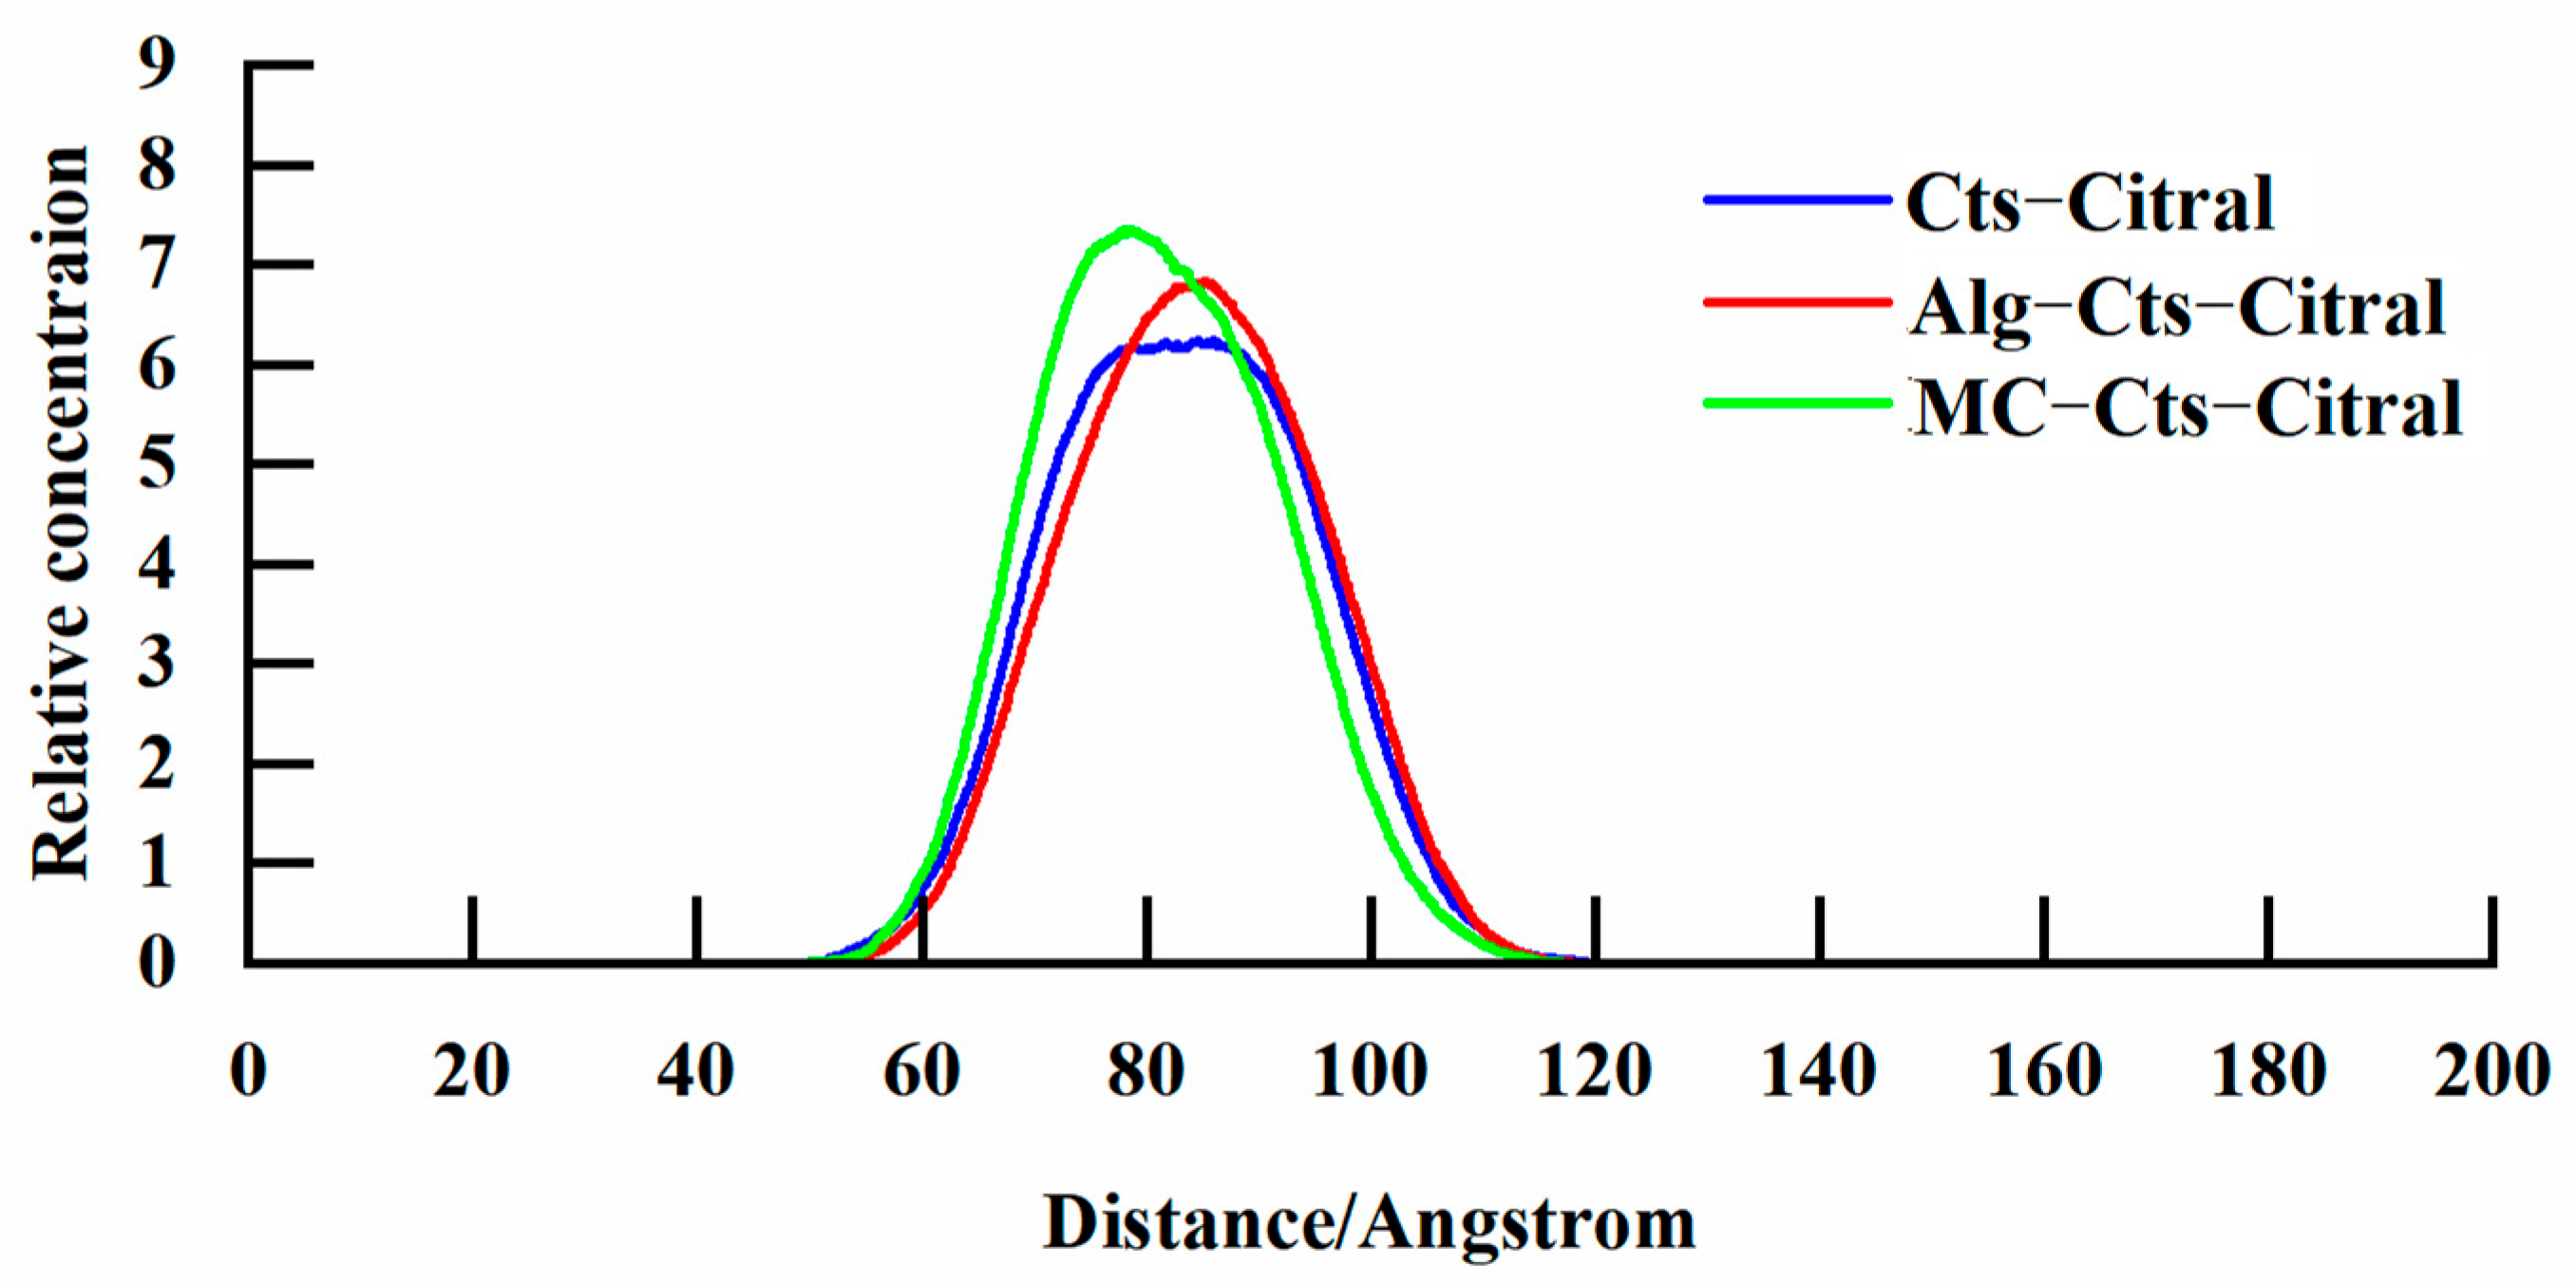
- (c)
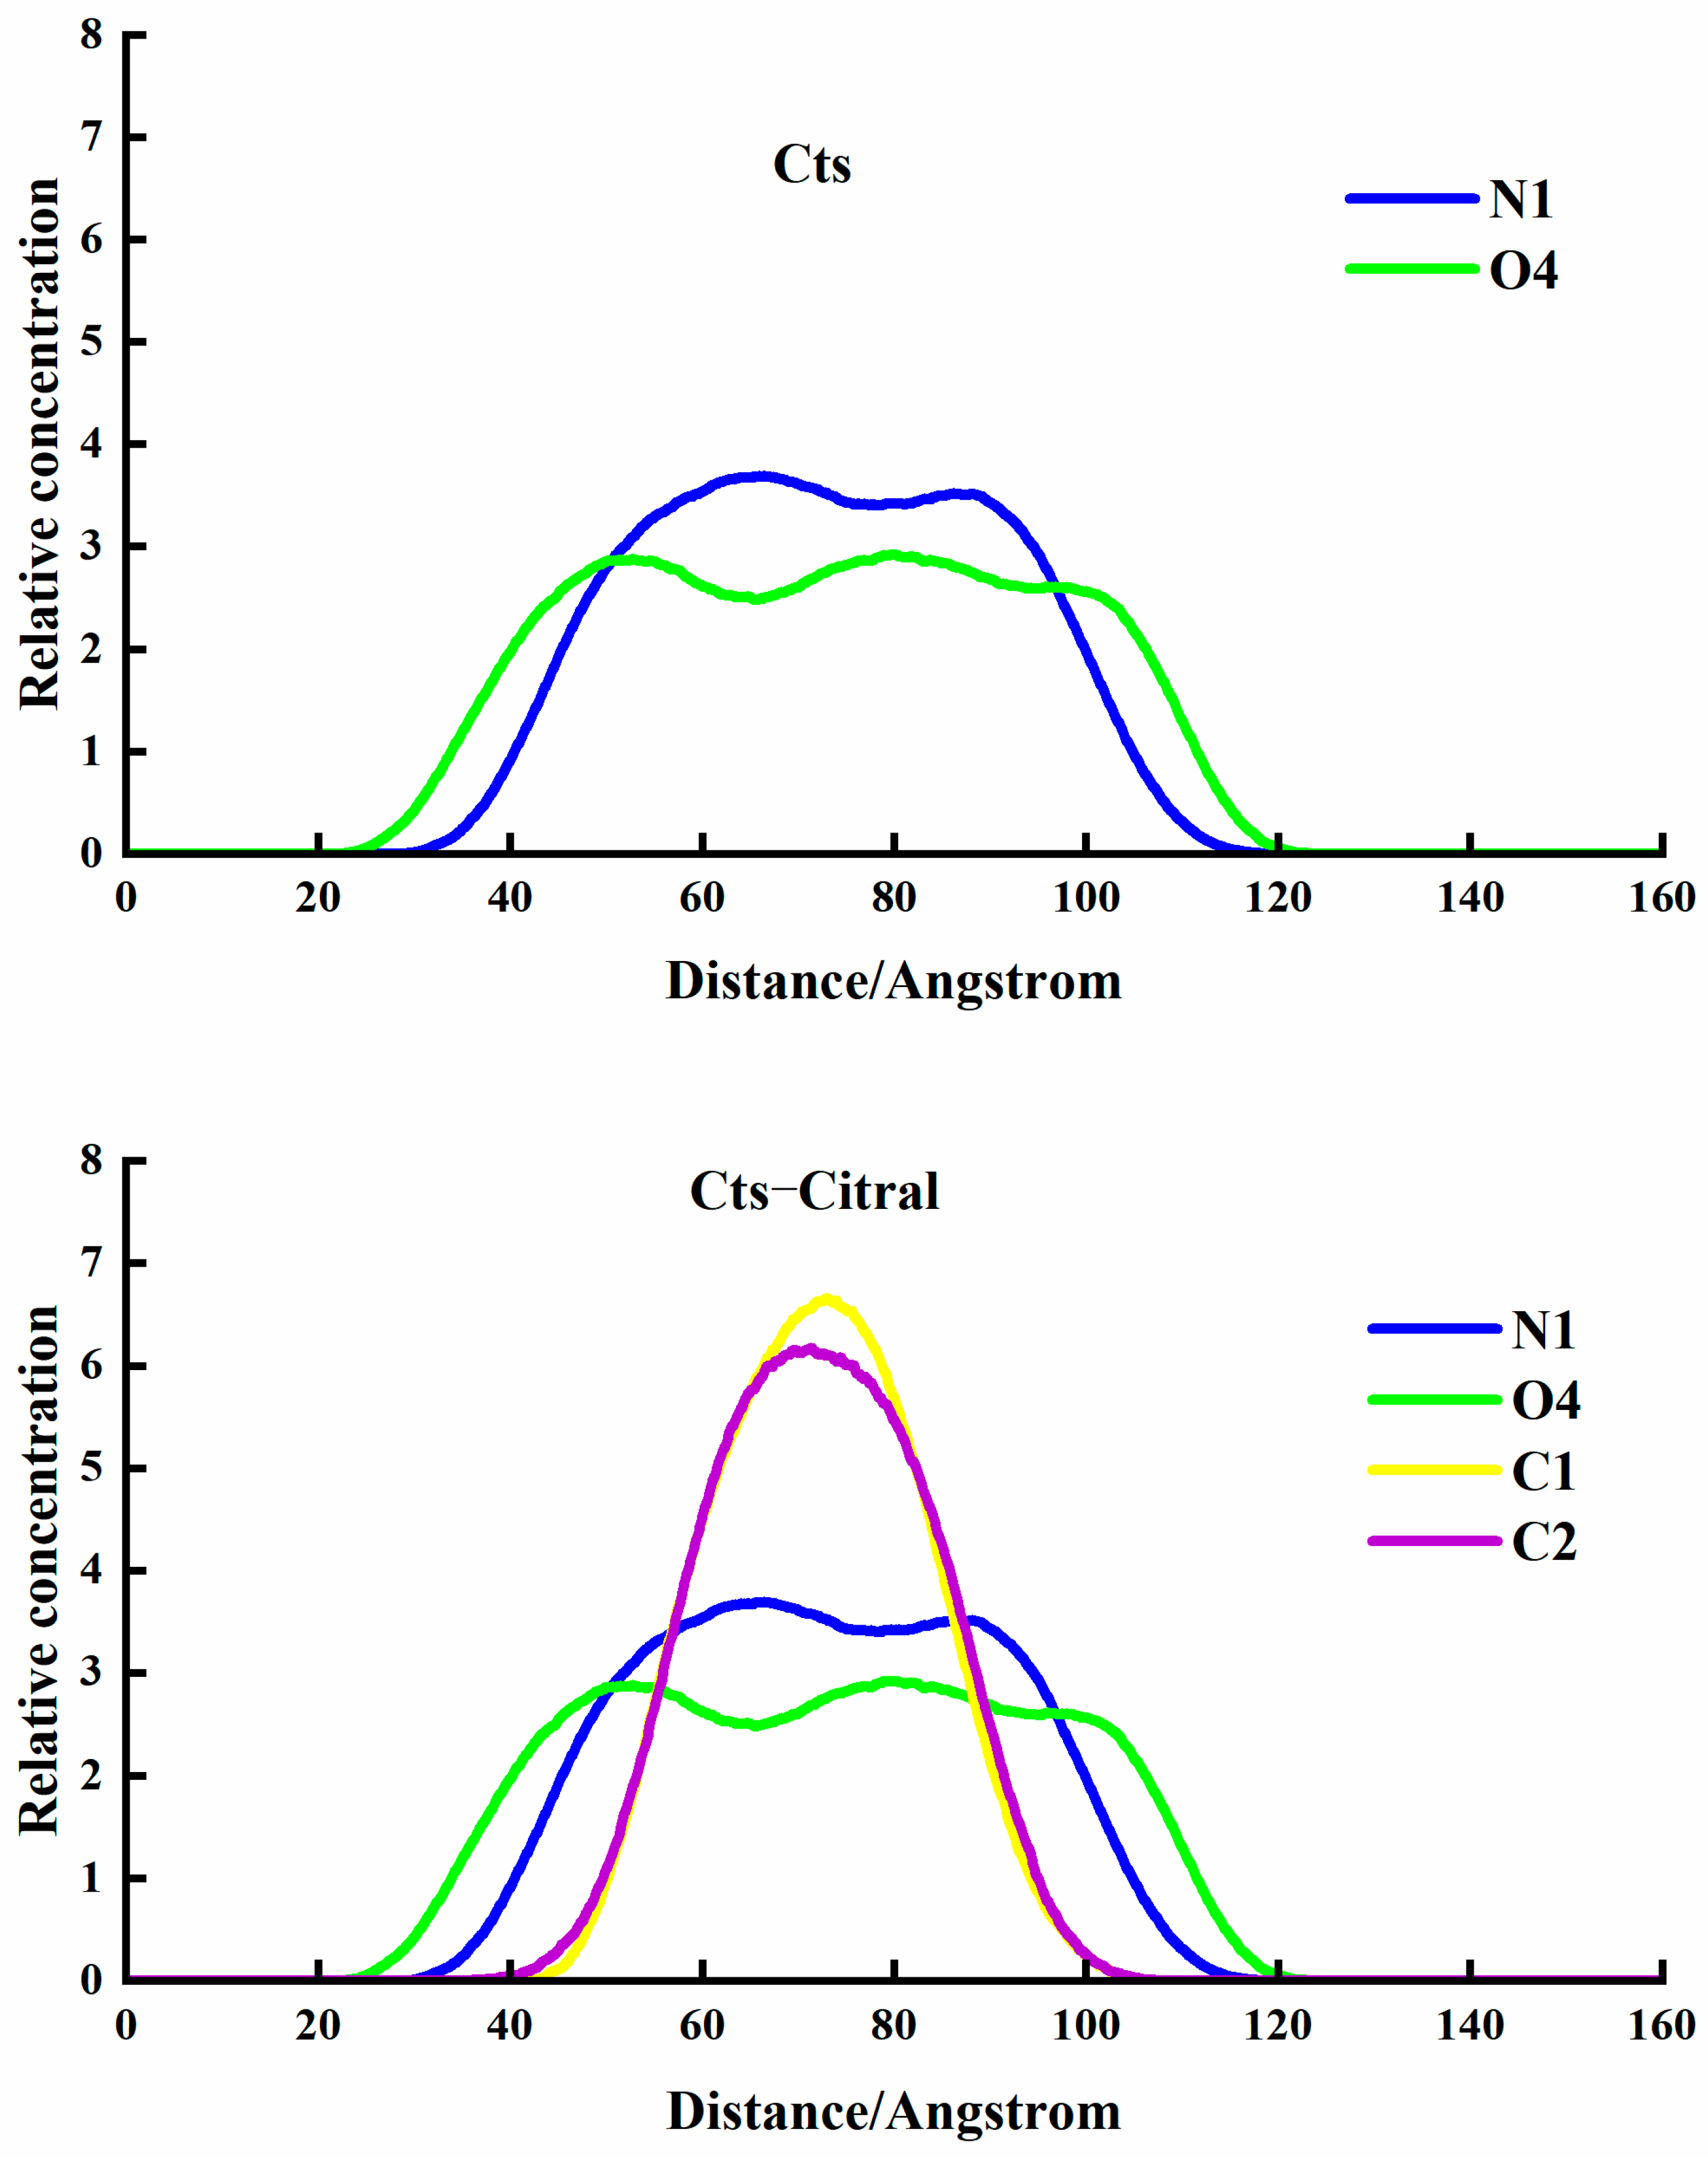
- Analysis of the concentration distribution curve of citral
Alg–Cts–Citral Double-Wall Material Microcapsule of Alg and Cts
Alg–MC–Citral Double-Wall Material Microcapsule
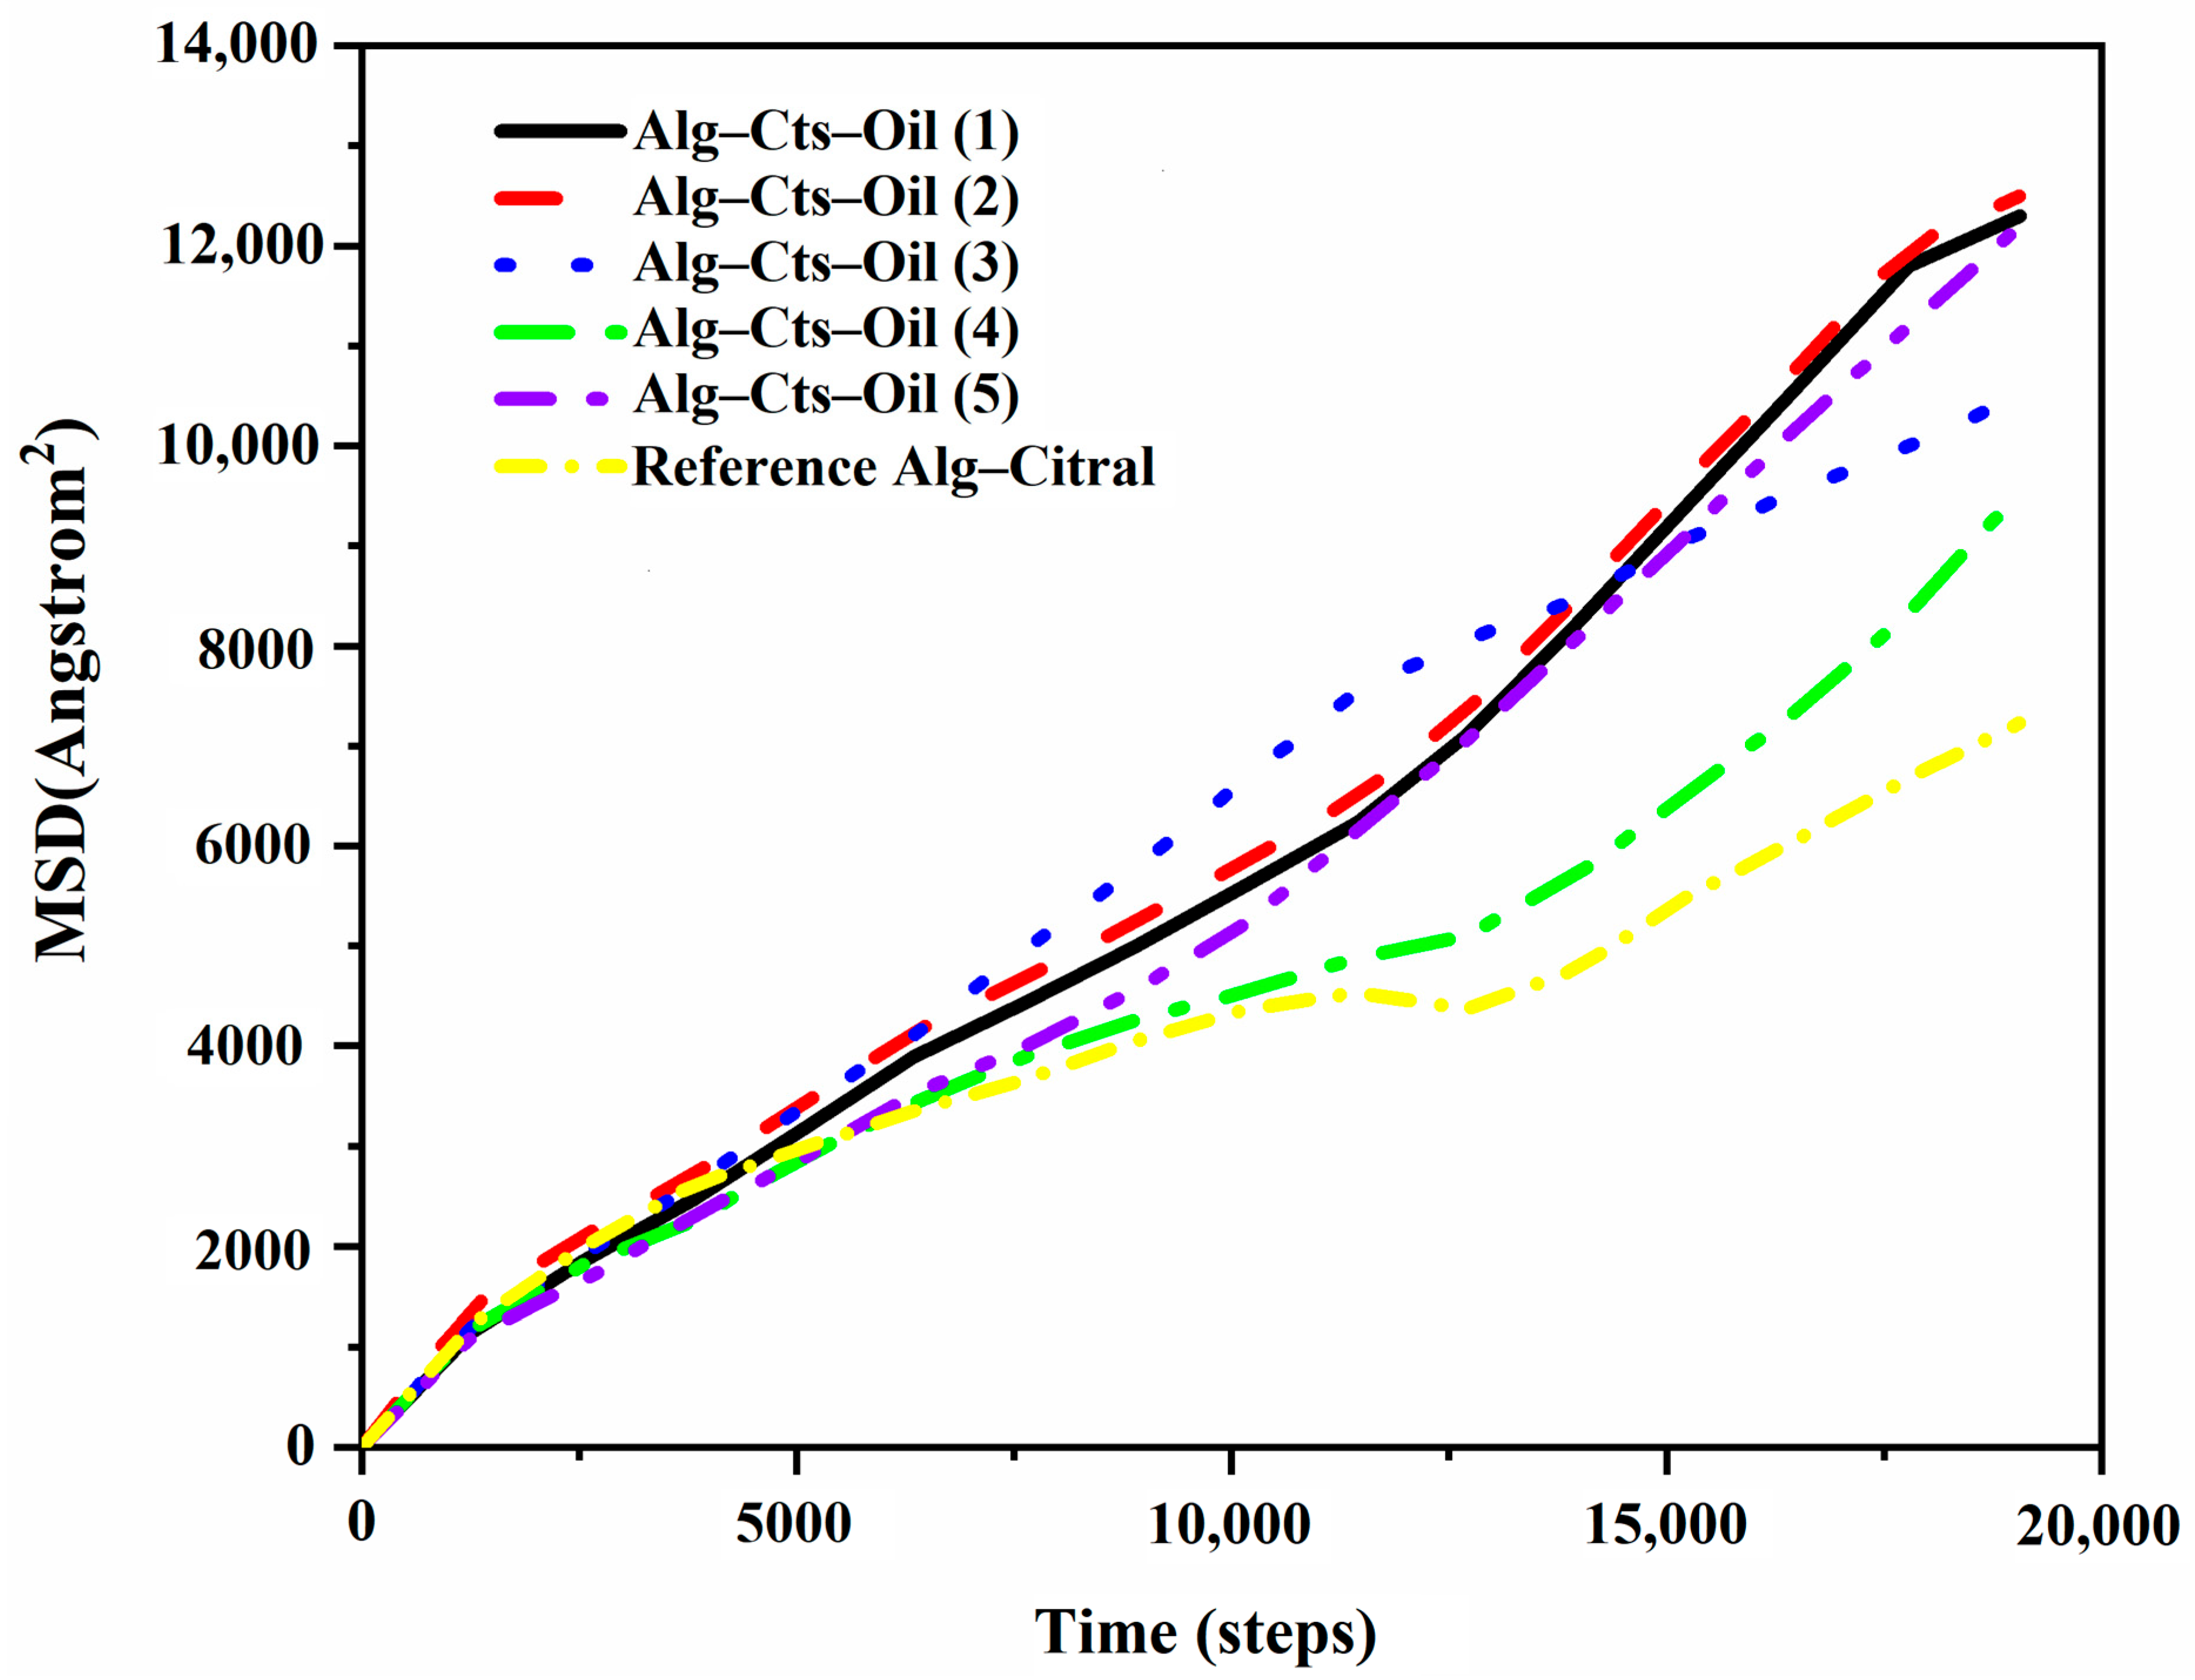
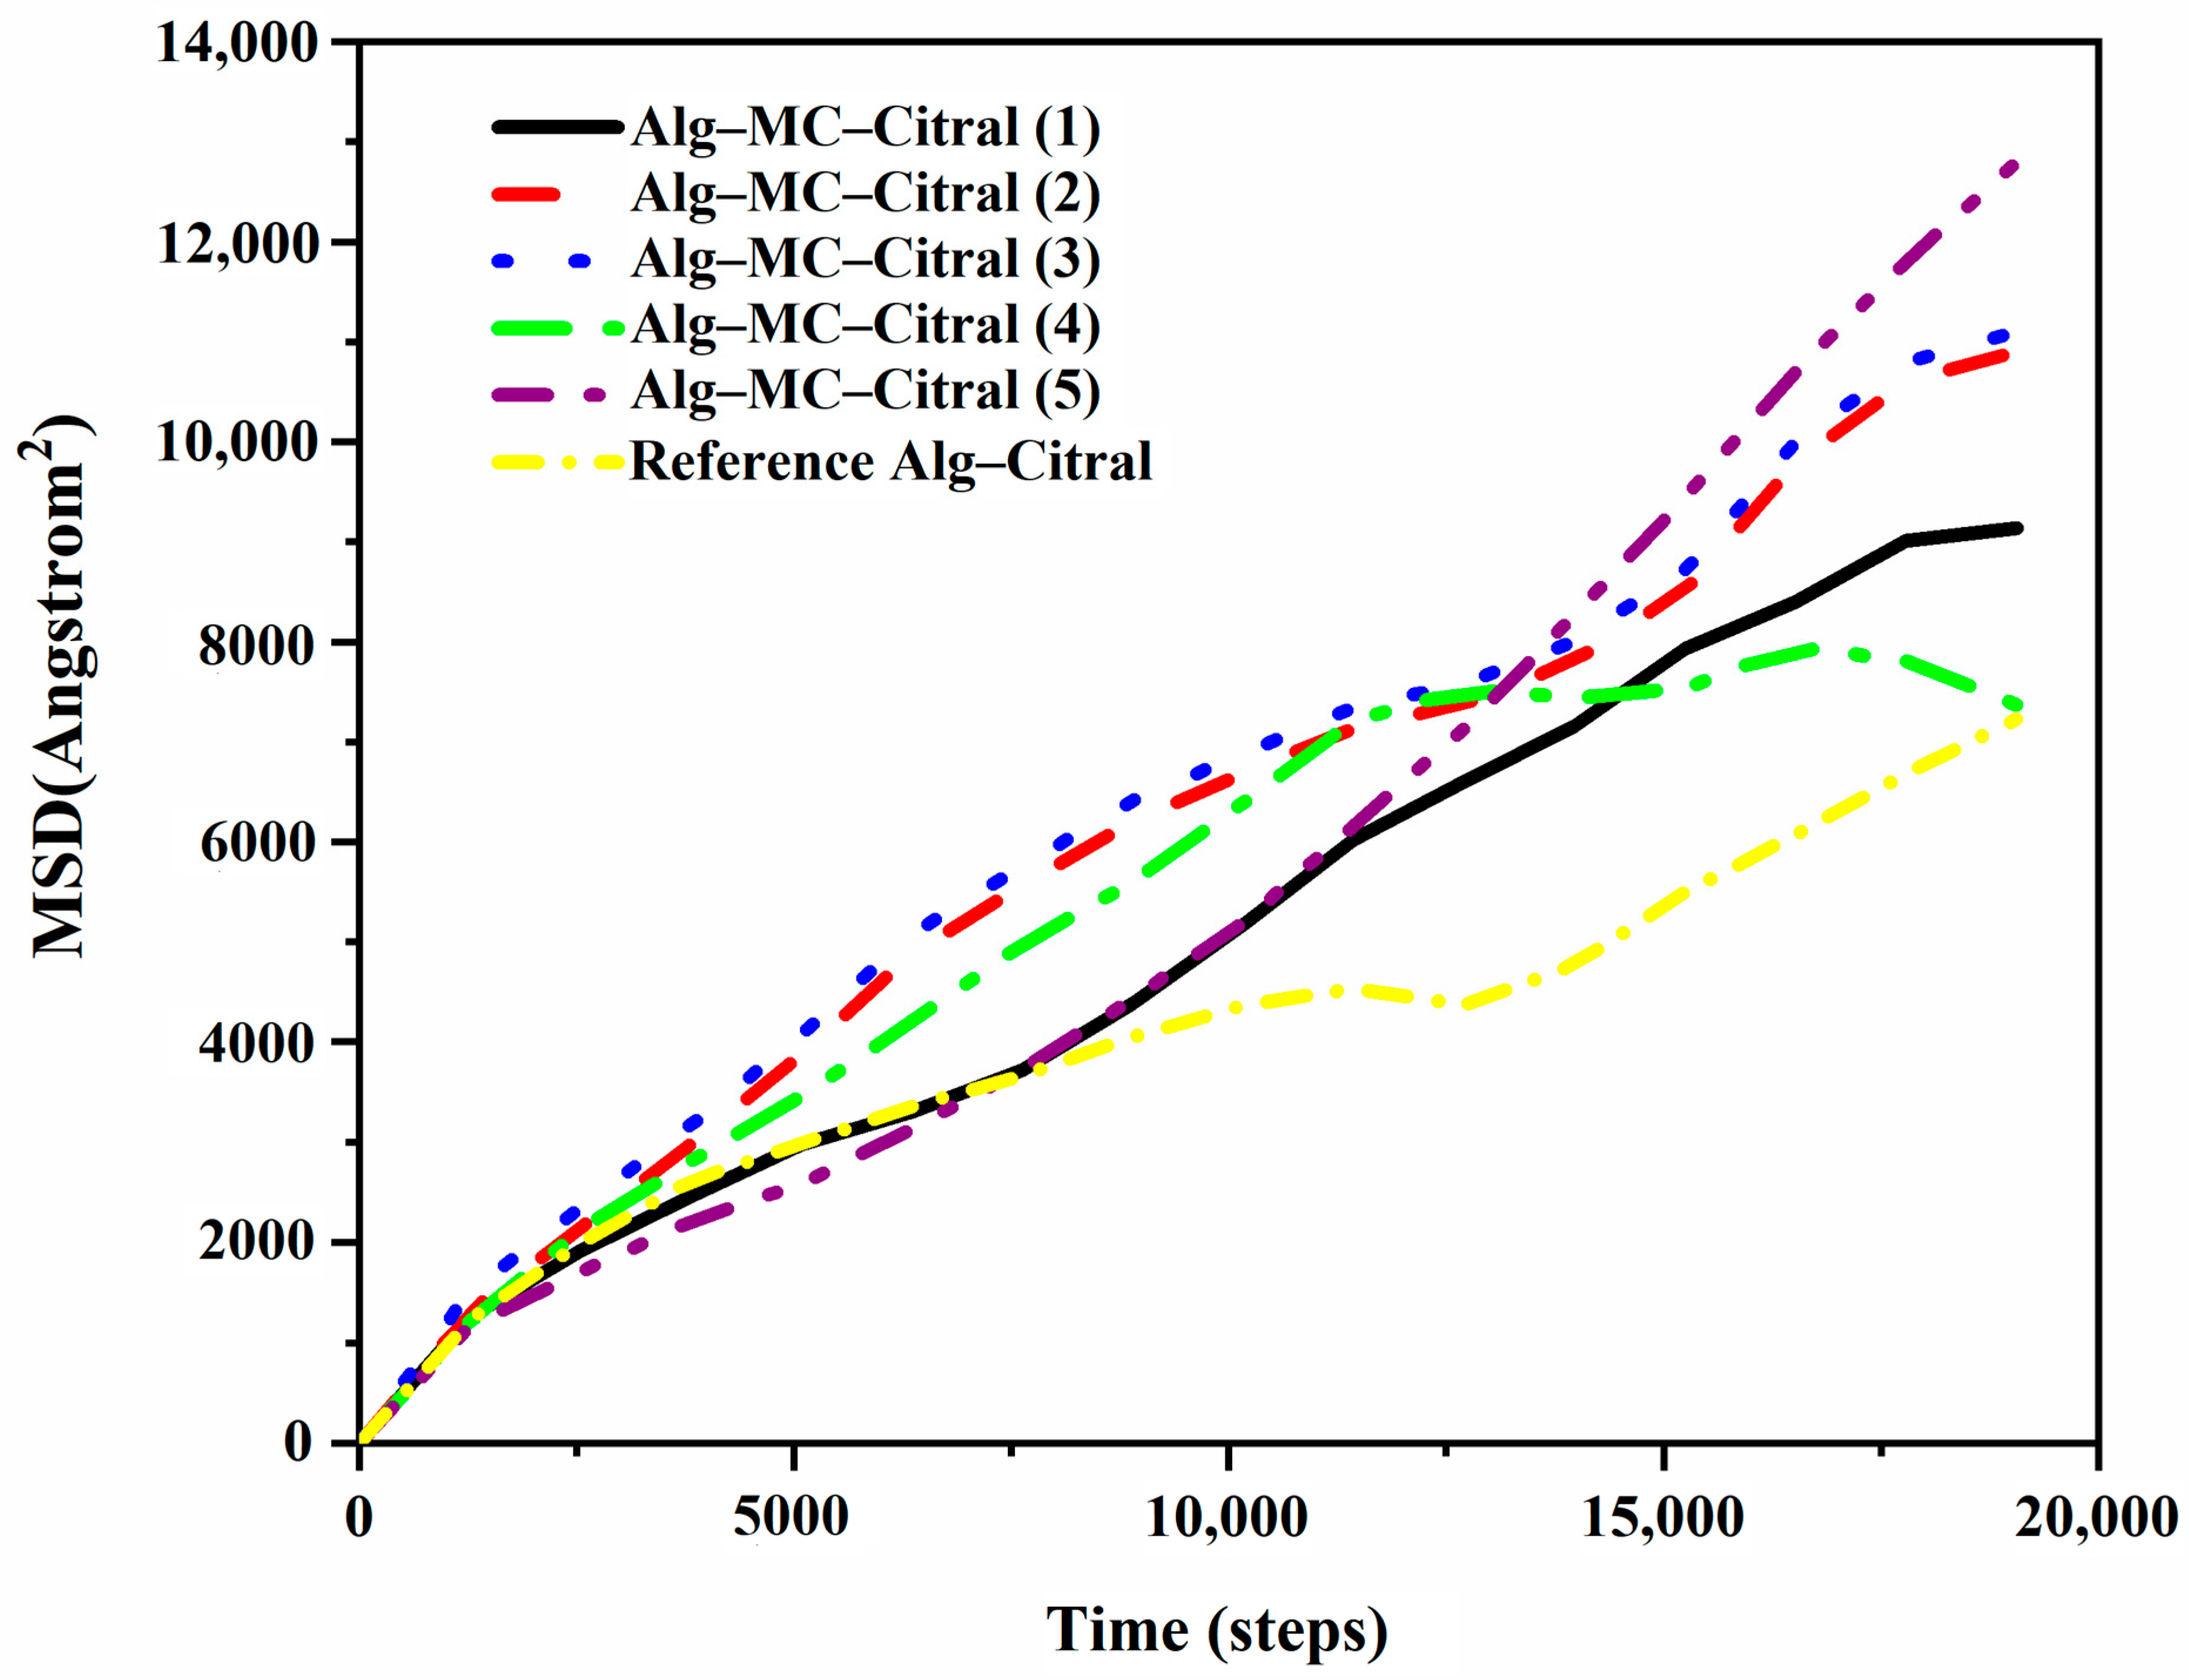
Diffusion Coefficient of Citral in the Simulation Process
4. Conclusions
Author Contributions
Funding
Institutional Review Board Statement
Informed Consent Statement
Data Availability Statement
Conflicts of Interest
References
- Ye, W.; Wang, N.; Hu, K.; Zhang, L.; Liu, A.; Pan, C.J.; Gong, T.; Liu, T.; Ding, H.Y. Bio-inspired microcapsule for targeted antithrombotic drug delivery. RSC Adv. 2018, 8, 27253–27259. [Google Scholar] [CrossRef] [PubMed]
- Huang, D.; Sun, M.; Bu, Y.Z.; Luo, F.; Lin, C.Y.; Lin, Z.Y.; Weng, Z.Q.; Yang, F.; Wu, D.C. Microcapsule-embedded hydrogel patches for ultrasound responsive and enhanced transdermal delivery of diclofenac sodium. J. Mater. Chem. B 2019, 7, 2330–2337. [Google Scholar] [CrossRef] [PubMed]
- Popov, A.L.; Popova, N.; Gould, D.J.; Shcherbakov, A.B.; Sukhorukov, G.B.; Ivanov, V.K. Ceria nanoparticles-decorated microcapsules as a smart drug delivery/protective system: Protection of encapsulated P. pyralis luciferase. ACS Appl. Mater. Interfaces 2018, 10, 14367–14377. [Google Scholar] [CrossRef] [PubMed]
- Vazquez-Gonzalez, M.; Willner, I. DNA-responsive SiO2 nanoparticles.; metal-organic frameworks.; and microcapsules for controlled drug release. Langmuir 2018, 34, 14692–14710. [Google Scholar] [CrossRef]
- Huang, L.Y.; Wu, K.; Zhang, R.; Ji, H.B. Fabrication of multicore milli- and microcapsules for controlling hydrophobic drugs release using a facile approach. Ind. Eng. Chem. Res. 2019, 58, 17017–17026. [Google Scholar] [CrossRef]
- Wei, L.Y.; Lu, Z.Q.; Ji, X.; Jiang, Y.K.; Ma, L. Self-assembly of hollow graphene oxide microcapsules directed by cavitation for loading hydrophobic drugs. ACS Appl. Mater. Interfaces 2021, 13, 2988–2996. [Google Scholar] [CrossRef]
- Wang, Y.F.; Cheng, Q.Q.; Liu, J.; Tariq, Z.Z.; Zheng, Z.; Li, G.; Kaplan, D.L.; Wang, X. Tuning microcapsule shell thickness and structure with silk fibroin and nanoparticles for sustained release. ACS Biomater. Sci. Eng. 2020, 6, 4583–4594. [Google Scholar] [CrossRef]
- Guo, X.Y.; Zhao, R.; Zhang, J.; Du, Y.J.; Yang, L.G.; Chen, L.Y.; Pang, S.; Xu, Y.; Zhang, Z.H.; Wu, X.M. A microcapsule oil dispersion for the controlled release of 1-methylcyclopropene in an open environment. RSC Adv. 2019, 9, 23465–23473. [Google Scholar] [CrossRef]
- Suraphan, N.; Fan, L.F.; Liu, B.X.; Wu, D.C. Co-delivery of chlorantraniliprole and avermectin with a polylactide microcapsule formulation. RSC Adv. 2020, 10, 25418–25425. [Google Scholar] [CrossRef]
- Zou, A.H.; Yang, Y.; Cheng, J.G.; Garamus, V.M.; Li, N. Construction and characterization of a novel sustained-release delivery system for hydrophobic pesticides using biodegradable polydopamine-based microcapsules. J. Agric. Food. Chem. 2018, 66, 6262–6268. [Google Scholar] [CrossRef]
- Yang, J.L.; Zhou, Z.Y.; Liang, Y.; Tang, J.Y.; Gao, Y.H.; Niu, J.F.; Dong, H.Q.; Tang, R.; Tang, G.; Cao, Y.S. Sustainable preparation of microcapsules with desirable stability and bioactivity using phosphonium ionic liquid as a functional additive. ACS Sustain. Chem. Eng. 2020, 8, 13440–13448. [Google Scholar] [CrossRef]
- Jia, C.H.; Huang, S.J.; Liu, R.; You, J.; Xiong, S.B.; Zhang, B.J.; Rong, J.H. Storage stability and in-vitro release behavior of microcapsules incorporating fish oil by spray drying. Colloids Surf. A Physicochem. Eng. Asp. 2021, 628, 127234. [Google Scholar] [CrossRef]
- Fotovvat, B.; Behzadnasab, M.; Mirabedini, S.M.; EivazMohammadloo, H. Anti-corrosion performance and mechanical properties of epoxy coatings containing microcapsules filled with linseed oil and modified ceria nanoparticles. Colloids Surf. A Physicochem. Eng. Asp. 2022, 648, 129157. [Google Scholar] [CrossRef]
- Sun, J.Y.; Li, W.; Zhan, Y.C.; Tian, L.M.; Tian, H.L. Two preparation processes for anti-corrosion and self-healing epoxy coatings containing the poly (calcium alginate) microcapsules loaded with tung oil. Colloids Surf. A Physicochem. Eng. Asp. 2022, 641, 128600. [Google Scholar] [CrossRef]
- Prabaharan, M. Chitosan derivatives as promising materials for controlled drug delivery. J. Biomater. Appl. 2008, 23, 5–36. [Google Scholar] [CrossRef]
- Calvo, P.; Remunan-Lopez, C.; Vila-Jato, J.L.; Alonso, M. Novel hydrophilic chitosan-polyethylene oxide nanoparticles as protein carriers. J. Appl. Polym. Sci. 1997, 63, 125–132. [Google Scholar] [CrossRef]
- Zhang, L.; Wang, Y.F.; Liu, H.S.; Yu, L.; Liu, X.X.; Chen, L.; Zhang, N.Z. Developing hydroxypropyl methylcellulose/hydroxypropyl starch blends for use as capsule materials. Carbohyd. Polym. 2013, 98, 73–79. [Google Scholar] [CrossRef]
- Zhang, L.; Lu, Y.Q.; Yue, L.N.; Li, Q.; Xiao, L.X.; Ding, X.L.; Guan, C.R. Microstructures, physical and sustained antioxidant properties of hydroxypropyl methylcellulose based microporous photophobic films. Int. J. Biol. Macromol. 2020, 152, 1002–1009. [Google Scholar] [CrossRef]
- Dudai, N.; Weinstein, Y.; Krup, M.; Rabinski, T.; Ofir, R. Citral is a new inducer of caspase-3 in tumor cell lines. Planta Medica 2005, 71, 484–488. [Google Scholar] [CrossRef]
- Rabbani, S.I.; Devi, K.; Shivananda, T.N. Studies on antimutagenic effects of citral in mice. J. Food Agric. Environ. 2004, 2, 62–64. [Google Scholar] [CrossRef]
- Shen, Y.B.; Sun, Z.F.; Guo, X.T. Citral inhibits lipopolysaccharide-induced acute lung injury by activating PPAR-γ. Eur. J. Pharmacol. 2015, 747, 45–51. [Google Scholar] [CrossRef] [PubMed]
- Chueca, B.; Pagán, R.; García-Gonzalo, D. Oxygenated monoterpenes citral and carvacrol cause oxidative damage in Escherichia coli without the involvement of tricarboxylic acid cycle and Fenton reaction. Int. J. Food Microbiol. 2014, 187, 189126–189131. [Google Scholar] [CrossRef] [PubMed]
- Gilling, D.H.; Kitajima, M.; Torrey, J.R.; Bright, K.R. Mechanisms of antiviral action of plant antimicrobials against murine norovirus. Appl. Environ. Microb. 2014, 80, 4898–4910. [Google Scholar] [CrossRef] [PubMed]
- Bergonzelli, G.E.; Donnicola, D.; Porta, N.; Corthésy-Theulaz, I.E. Essential oils as components of a diet-based approach to management of helicobacter infection. Antimicrob. Agents Chemother. 2003, 47, 3240–3246. [Google Scholar] [CrossRef]
- Hoogerbrugge, P.J.; Koelman, J.M.V.A. Simulating microscopic hydrodynamic phenomena with dissipative particle dynamics. EPL 1992, 19, 155–160. [Google Scholar] [CrossRef]
- Espanol, P.; Warren, P. Statistical mechanics of dissipative particle dynamics. Europhys. Lett. 1995, 30, 191–196. [Google Scholar] [CrossRef]
- Abu-Nada, E.; Pop, I.; Mahian, O. A dissipative particle dynamics two-component nanofluid heat transfer model: Application to natural convection. Int. J. Heat Mass Transf. 2019, 133, 1086–1098. [Google Scholar] [CrossRef]
- Feng, Y.H.; Zhang, X.P.; Zhao, Z.Q.; Guo, X.D. Dissipative particle dynamics aided design of drug delivery systems: A review. Mol. Pharm. 2020, 17, 1778–1799. [Google Scholar] [CrossRef]
- Okuwaki, K.; Mochizuki, Y.; Doi, H.; Kawada, S.; Ozawac, T.; Yasuoka, K. Theoretical analyses on water cluster structures in polymer electrolyte membrane by using dissipative particle dynamics simulations with fragment molecular orbital based effective parameters. RSC Adv. 2018, 8, 34582–34595. [Google Scholar] [CrossRef]
- Zhang, J.; Xu, J.C.; Wen, L.Y.; Zhang, F.S.; Zhang, L.J. The self-assembly behavior of polymer brushes induced by the orientational ordering of rod backbones: A dissipative particle dynamics study. Phys. Chem. Chem. Phys. 2020, 22, 5229–5241. [Google Scholar] [CrossRef]
- Liang, X.P.; Wu, J.Q.; Yang, X.G.; Tu, Z.B.; Wang, Y. Investigation of oil-in-water emulsion stability with relevant interfacial characteristics simulated by dissipative particle dynamics. Colloids Surf. A Physicochem. Eng. Asp. 2018, 546, 107–114. [Google Scholar] [CrossRef]
- Zhou, P.; Hou, J.; Yan, Y.G.; Wang, J.Q.; Chen, W. Effect of aggregation and adsorption behavior on the flow resistance of surfactant fluid on smooth and rough surfaces: A many-body dissipative particle dynamics study. Langmuir 2019, 35, 8110–8120. [Google Scholar] [CrossRef] [PubMed]
- Wang, X.Y.; Santo, K.P.; Neimark, A.V. Modeling gas-liquid interfaces by dissipative particle dynamics: Adsorption and surface tension of cetyl trimethyl ammonium bromide at the air-water interface. Langmuir 2020, 36, 14686–14698. [Google Scholar] [CrossRef]
- Zhang, J.W.; Chen, L.; Wang, A.; Yan, Z.C. Dissipative particle dynamics simulation of ionic liquid-based microemulsion: Quantitative properties and emulsification mechanism. Ind. Eng. Chem. Res. 2020, 59, 763–773. [Google Scholar] [CrossRef]
- Choudhary, M.; Kamil, S.M. Phase diagram study of sodium dodecyl sulfate using dissipative particle dynamics. ACS Omega 2020, 5, 22891–22900. [Google Scholar] [CrossRef]
- Panoukidou, M.; Wand, C.R.; Regno, A.D.; Anderson, R.L.; Carbone, P. Constructing the phase diagram of sodium laurylethoxysulfate using dissipative particle dynamics. J. Colloid Interf. Sci. 2019, 557, 34–44. [Google Scholar] [CrossRef]
- Guo, Z.Y.; Ma, L.P.; Dai, Q.X.; Ao, R.; Liu, H.P.; Yang, J. Combined application of modified corn-core powder and sludgebased biochar for sewage sludge pretreatment: Dewatering performance and dissipative particle dynamics simulation. Environ. Pollut. 2020, 265, 115095. [Google Scholar] [CrossRef]
- Groot, R.D.; Warren, P.B. Dissipative particle dynamics: Bridging the gap between atomistic and mesoscopic simulation. J. Chem. Phys. 1997, 107, 4423–4435. [Google Scholar] [CrossRef]
- Li, Y.; Leng, M.T.; Cai, M.T.; Huang, L.; Chen, Y.W.; Luo, X.L. pH responsive micelles based on copolymers mPEG-PCL-PDEA: The relationship between composition and properties. Colloid Surface B 2017, 154, 397–407. [Google Scholar] [CrossRef]
- Materials Studio 7.0, version 7.0; Accelrys: San Diego, CA, USA, 2013.
- Qiu, B.N.; Zhou, Y.; Yin, X.Q.; Chen, J.H.; Yin, Y.Z.; Zhu, L. Preparation of citral microcapsules through spray-dring and the stability of the micorcapsules. Sci. Technol. Food Ind. 2017, 38, 190–195. [Google Scholar] [CrossRef]
- Zhang, S.; Chen, J.; Yin, X.Q.; Qiu, B.N.; Zhu, L. Preparation of citral microcapsules and the effects of water adsorption on the structure of micorcapsules. Food Sci. Technol. 2017, 42, 60–66. [Google Scholar] [CrossRef]
- Groot, R.D.; Rabone, K.L. Mesoscopic simulation of cell membrane damage, morphology change, and rupture by nonionic surfactants. Biophys. J. 2001, 81, 725–736. [Google Scholar] [CrossRef] [PubMed]
- Ramezani, M.; Shamsara, J. Application of DPD in the design of polymeric nano-micelles as drug carriers. J. Mol. Graphics Modell. 2016, 66, 1–8. [Google Scholar] [CrossRef]
- Zwanzig, R. Memory Effects in Irreversible Thermodynamics. Phys Rev. 1961, 124, 983–992. [Google Scholar] [CrossRef]
- Wang, W.J.; Anderson, N.A.; Travesset, A.; Vaknin, D. Regulation of the Electric Charge in Phosphatidic Acid Domains. J. Phys. Chem. B 2012, 116, 7213–7220. [Google Scholar] [CrossRef] [PubMed]

| aij | N1 | N2 | O1 | O2 | C1 | C2 | S | W |
|---|---|---|---|---|---|---|---|---|
| N1 | 25 | |||||||
| N2 | 25.92 | 25 | ||||||
| O1 | 27.47 | 30.81 | 25 | |||||
| O2 | 44.23 | 51.46 | 31.06 | 25 | ||||
| C1 | 29.05 | 26.08 | 36.27 | 61.69 | 25 | |||
| C2 | 25.49 | 25.01 | 29.65 | 46.44 | 25.16 | 25 | ||
| S | 31.77 | 36.46 | 25.88 | 27 | 43.43 | 34.17 | 25 | |
| W | 95.99 | 106.18 | 57.89 | 35.74 | 121.98 | 87.94 | 44.73 | 25 |
| Number | H2O (mL) | m (Cts) (g) | φ (H2O) | φ (Cts) | Citral (mL) | φ (Citral) | |
|---|---|---|---|---|---|---|---|
| Citral free | Cts (1) | 260.00 | 5.2 | 98.87 | 1.13 | ||
| Cts (2) | 260.00 | 6.93 | 98.50 | 1.50 | |||
| Cts (3) | 260.00 | 8.67 | 98.13 | 1.87 | |||
| Cts (4) | 260.00 | 10.4 | 97.77 | 2.23 | |||
| Cts (5) | 260.00 | 12.13 | 97.40 | 2.60 | |||
| Containing Citral | Cts–Citral (1) | 260.00 | 5.2 | 98.31 | 1.12 | 1.5 | 0.57 |
| Cts–Citral (2) | 260.00 | 6.93 | 97.94 | 1.49 | 1.5 | 0.57 | |
| Cts–Citral (3) | 260.00 | 8.67 | 97.58 | 1.86 | 1.5 | 0.56 | |
| Cts–Citral (4) | 260.00 | 10.4 | 97.22 | 2.22 | 1.5 | 0.56 | |
| Cts–Citral (5) | 260.00 | 12.13 | 96.86 | 2.58 | 1.5 | 0.56 |
| Number | H2O (mL) | Alg (g) | φ (H2O) | φ (Alg) | Citral (mL) | φ (Citral) | |
|---|---|---|---|---|---|---|---|
| Citral free | Alg (1) | 260.00 | 7.22 | 98.28 | 1.72 | ||
| Alg (2) | 260.00 | 7.94 | 98.12 | 1.88 | |||
| Alg (3) | 260.00 | 8.67 | 97.95 | 2.05 | |||
| Alg (4) | 260.00 | 9.39 | 97.78 | 2.22 | |||
| Alg (5) | 260.00 | 10.11 | 97.61 | 2.39 | |||
| Containing Citral | Alg–Citral (1) | 260.00 | 7.22 | 97.73 | 1.71 | 1.5 | 0.56 |
| Alg–Citral (2) | 260.00 | 7.94 | 97.56 | 1.87 | 1.5 | 0.56 | |
| Alg–Citral (3) | 260.00 | 8.67 | 97.40 | 2.04 | 1.5 | 0.56 | |
| Alg–Citral (4) | 260.00 | 9.39 | 97.23 | 2.21 | 1.5 | 0.56 | |
| Alg–Citral (5) | 260.00 | 10.11 | 97.07 | 2.37 | 1.5 | 0.56 |
| Number | H2O (mL) | Alg (g) | φ (H2O) | Cts (g) | φ (Cts) | φ (Alg) | Citral (mL) | φ (Citral) | |
|---|---|---|---|---|---|---|---|---|---|
| Citral free | Alg–Cts (1) | 260.00 | 14.00 | 96.60 | 0.60 | 0.13 | 3.27 | ||
| Alg–Cts (2) | 260.00 | 14.00 | 96.56 | 0.80 | 0.17 | 3.27 | |||
| Alg–Cts (3) | 260.00 | 14.00 | 96.52 | 1.00 | 0.21 | 3.27 | |||
| Alg–Cts (4) | 260.00 | 14.00 | 96.48 | 1.20 | 0.25 | 3.27 | |||
| Alg–Cts (5) | 260.00 | 14.00 | 96.44 | 1.40 | 0.30 | 3.27 | |||
| Containing Citral | Alg–Cts–Citral (1) | 260.00 | 14.00 | 96.07 | 0.60 | 0.13 | 3.25 | 1.50 | 0.55 |
| Alg–Cts–Citral (2) | 260.00 | 14.00 | 96.03 | 0.80 | 0.17 | 3.25 | 1.50 | 0.55 | |
| Alg–Cts–Citral (3) | 260.00 | 14.00 | 95.98 | 1.00 | 0.21 | 3.25 | 1.50 | 0.55 | |
| Alg–Cts–Citral (4) | 260.00 | 14.00 | 95.94 | 1.20 | 0.25 | 3.25 | 1.50 | 0.55 | |
| Alg–Cts–Citral (5) | 260.00 | 14.00 | 95.90 | 1.40 | 0.30 | 3.25 | 1.50 | 0.55 |
| Number | H2O (mL) | Alg (g) | MC (g) | φ (H2O) | φ (MC) | φ (Alg) | Citral (mL) | φ (Citral) | |
|---|---|---|---|---|---|---|---|---|---|
| Citral free | Alg–MC (1) | 260.00 | 7.00 | 0.40 | 98.22 | 0.12 | 1.66 | ||
| Alg–MC (2) | 260.00 | 7.00 | 0.60 | 98.16 | 0.17 | 1.66 | |||
| Alg–MC (3) | 260.00 | 7.00 | 0.80 | 98.11 | 0.23 | 1.66 | |||
| Alg–MC (4) | 260.00 | 7.00 | 1.00 | 98.05 | 0.29 | 1.66 | |||
| Alg–MC (5) | 260.00 | 7.00 | 1.20 | 97.99 | 0.35 | 1.66 | |||
| Containing Citral | Alg–MC–Citral (1) | 260.00 | 7.00 | 0.40 | 97.67 | 0.12 | 1.65 | 1.50 | 0.56 |
| Alg–MC–Citral (2) | 260.00 | 7.00 | 0.60 | 97.61 | 0.17 | 1.65 | 1.50 | 0.56 | |
| Alg–MC–Citral (3) | 260.00 | 7.00 | 0.80 | 97.55 | 0.23 | 1.65 | 1.50 | 0.56 | |
| Alg–MC–Citral (4) | 260.00 | 7.00 | 1.00 | 97.50 | 0.29 | 1.65 | 1.50 | 0.56 | |
| Alg–MC–Citral (5) | 260.00 | 7.00 | 1.20 | 97.44 | 0.35 | 1.65 | 1.50 | 0.56 |
Disclaimer/Publisher’s Note: The statements, opinions and data contained in all publications are solely those of the individual author(s) and contributor(s) and not of MDPI and/or the editor(s). MDPI and/or the editor(s) disclaim responsibility for any injury to people or property resulting from any ideas, methods, instructions or products referred to in the content. |
© 2025 by the authors. Licensee MDPI, Basel, Switzerland. This article is an open access article distributed under the terms and conditions of the Creative Commons Attribution (CC BY) license (https://creativecommons.org/licenses/by/4.0/).
Share and Cite
Wu, W.; Li, Z.; Feng, D.; Tang, Q.; Liu, S.; Lin, W. Dissipative Particle Dynamics: Simulation of Chitosan–Citral Microcapsules. Polymers 2025, 17, 678. https://doi.org/10.3390/polym17050678
Wu W, Li Z, Feng D, Tang Q, Liu S, Lin W. Dissipative Particle Dynamics: Simulation of Chitosan–Citral Microcapsules. Polymers. 2025; 17(5):678. https://doi.org/10.3390/polym17050678
Chicago/Turabian StyleWu, Wensheng, Zhiwei Li, Dachun Feng, Qing Tang, Shuijiao Liu, and Wenjing Lin. 2025. "Dissipative Particle Dynamics: Simulation of Chitosan–Citral Microcapsules" Polymers 17, no. 5: 678. https://doi.org/10.3390/polym17050678
APA StyleWu, W., Li, Z., Feng, D., Tang, Q., Liu, S., & Lin, W. (2025). Dissipative Particle Dynamics: Simulation of Chitosan–Citral Microcapsules. Polymers, 17(5), 678. https://doi.org/10.3390/polym17050678