
Glycine-Group-Functionalized Polymeric Materials Impregnated with Zn(II) Used in the Photocatalytic Degradation of Congo Red Dye

 ,
,  ,
,  ,
,  , and
, and
Abstract
1. Introduction
2. Materials and Methods
2.1. Materials and Equipments
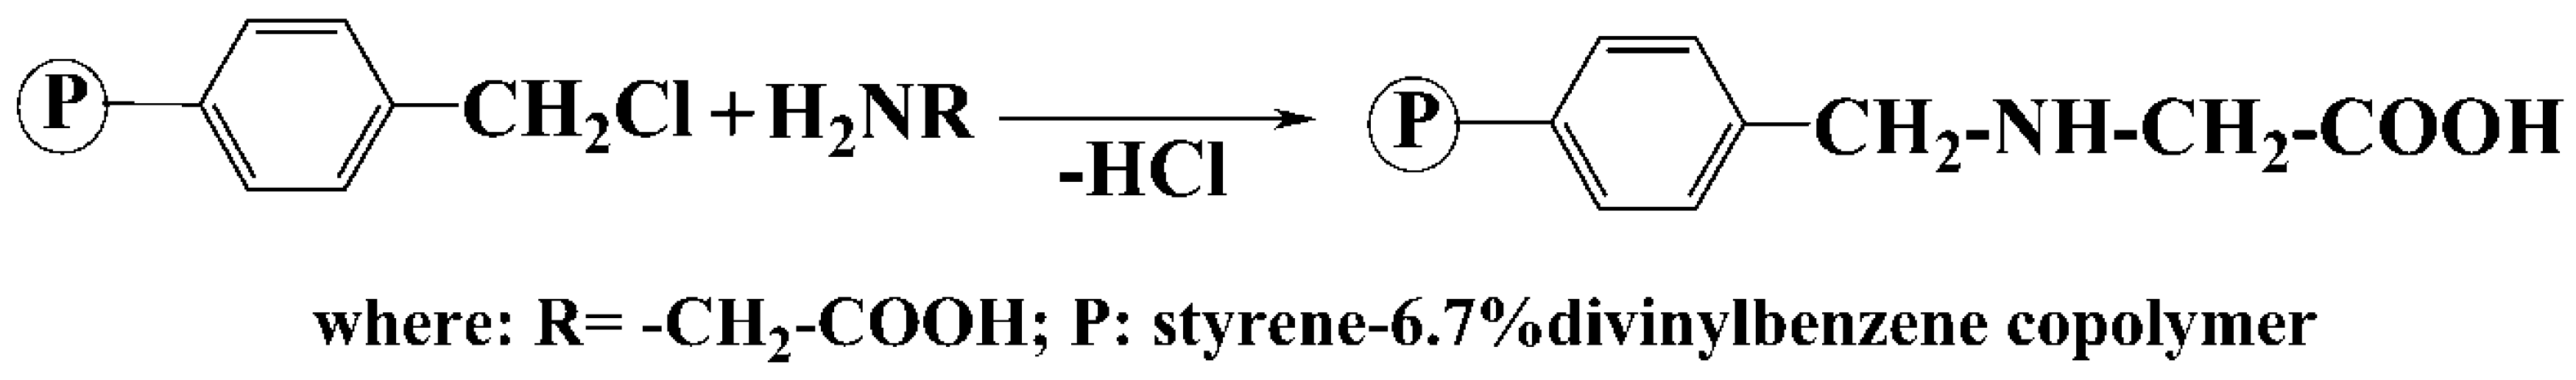
2.2. Obtaining of Copolymer Functionalized with Glycine (AP2)
2.3. Obtaining AP2-Zn(II)) Sample
2.4. Photocatalysis
2.5. Design of Experiments and Optimization by Response Surface Methodology
3. Results and Discussion
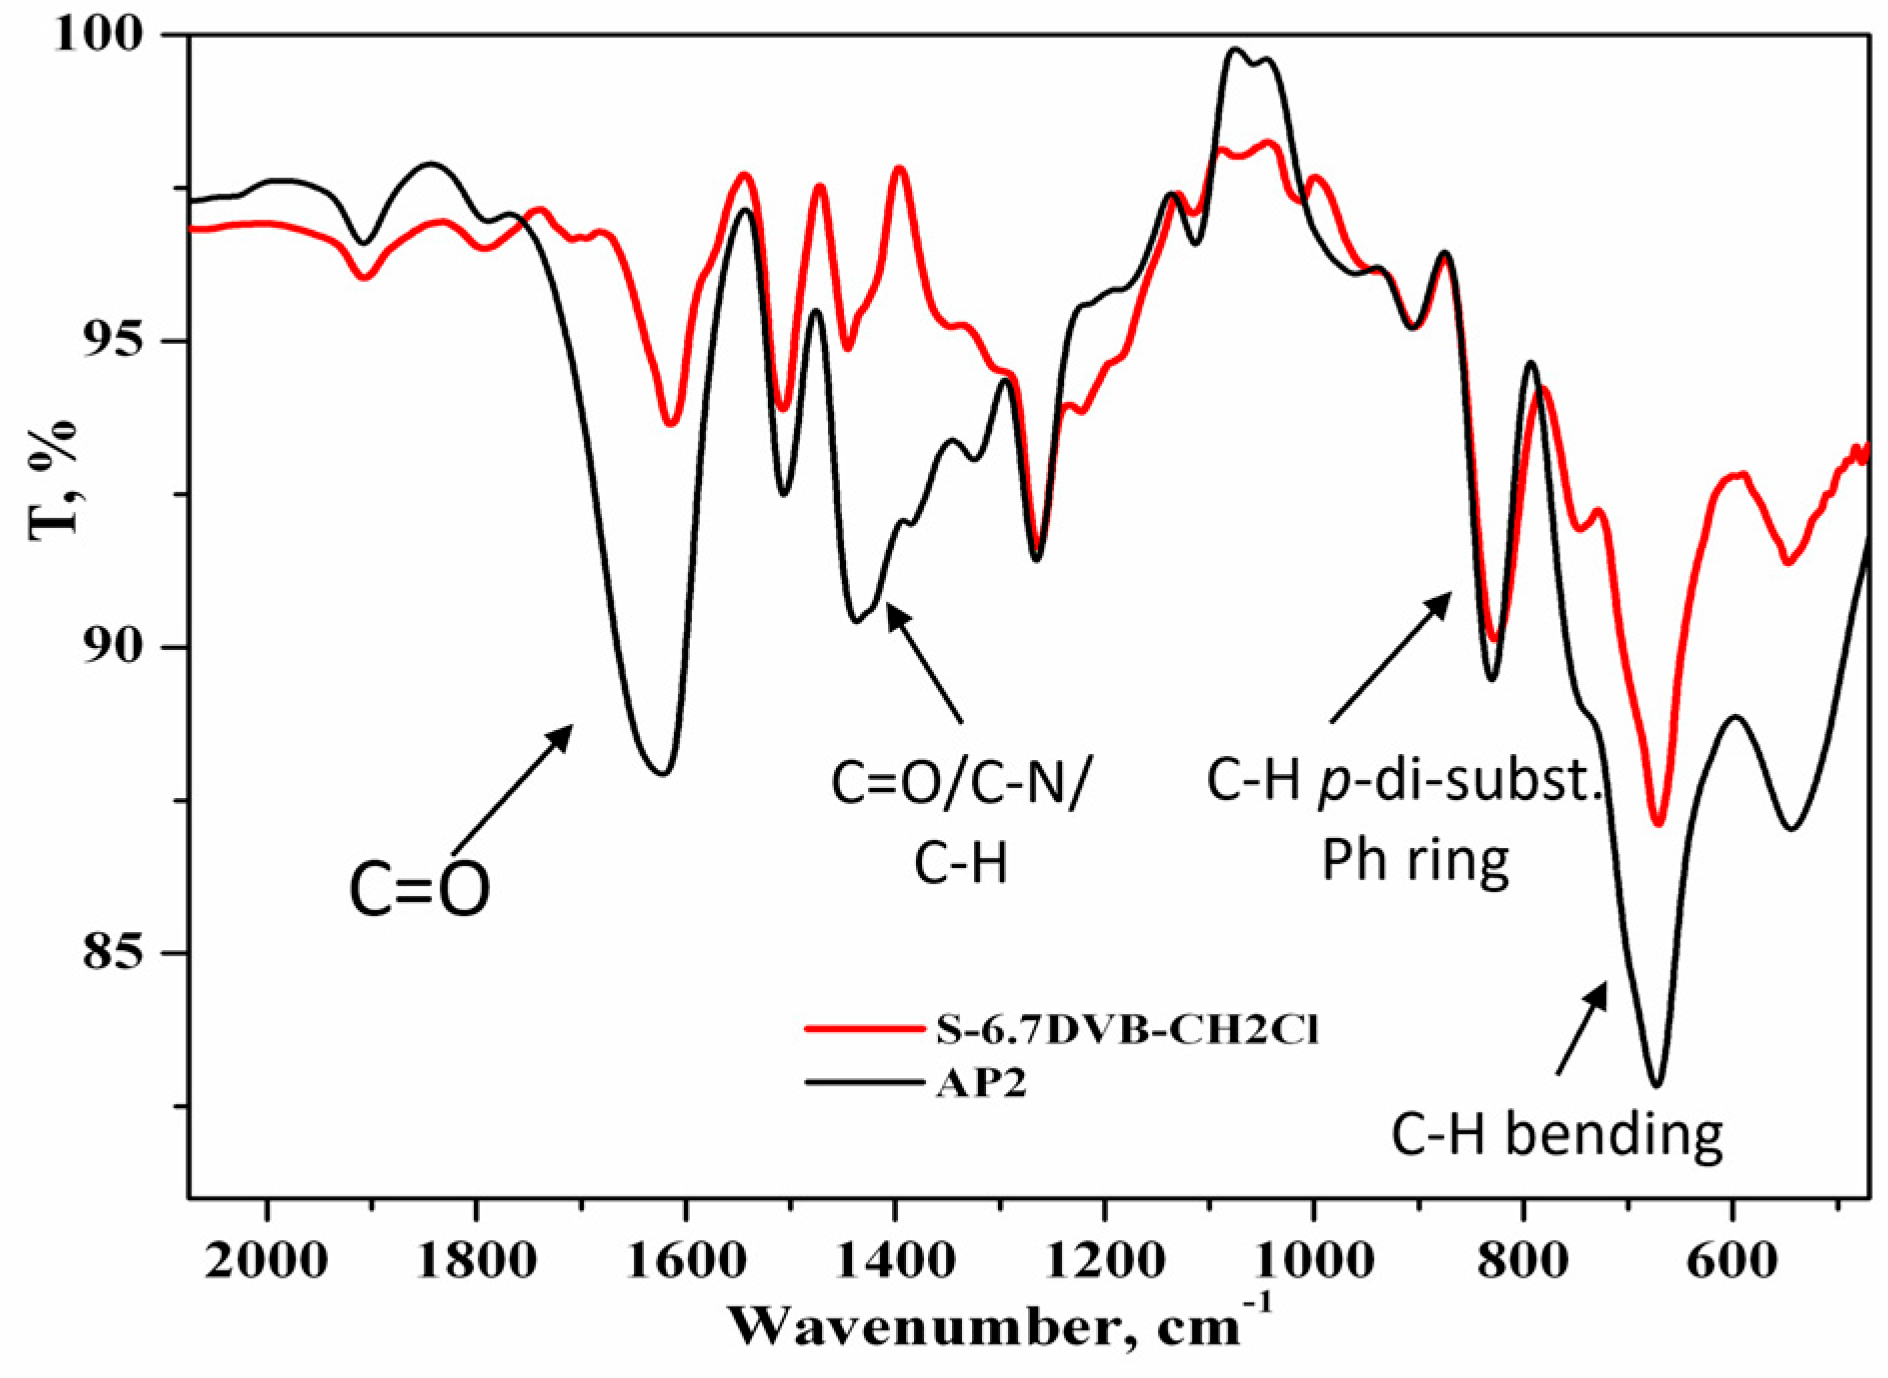
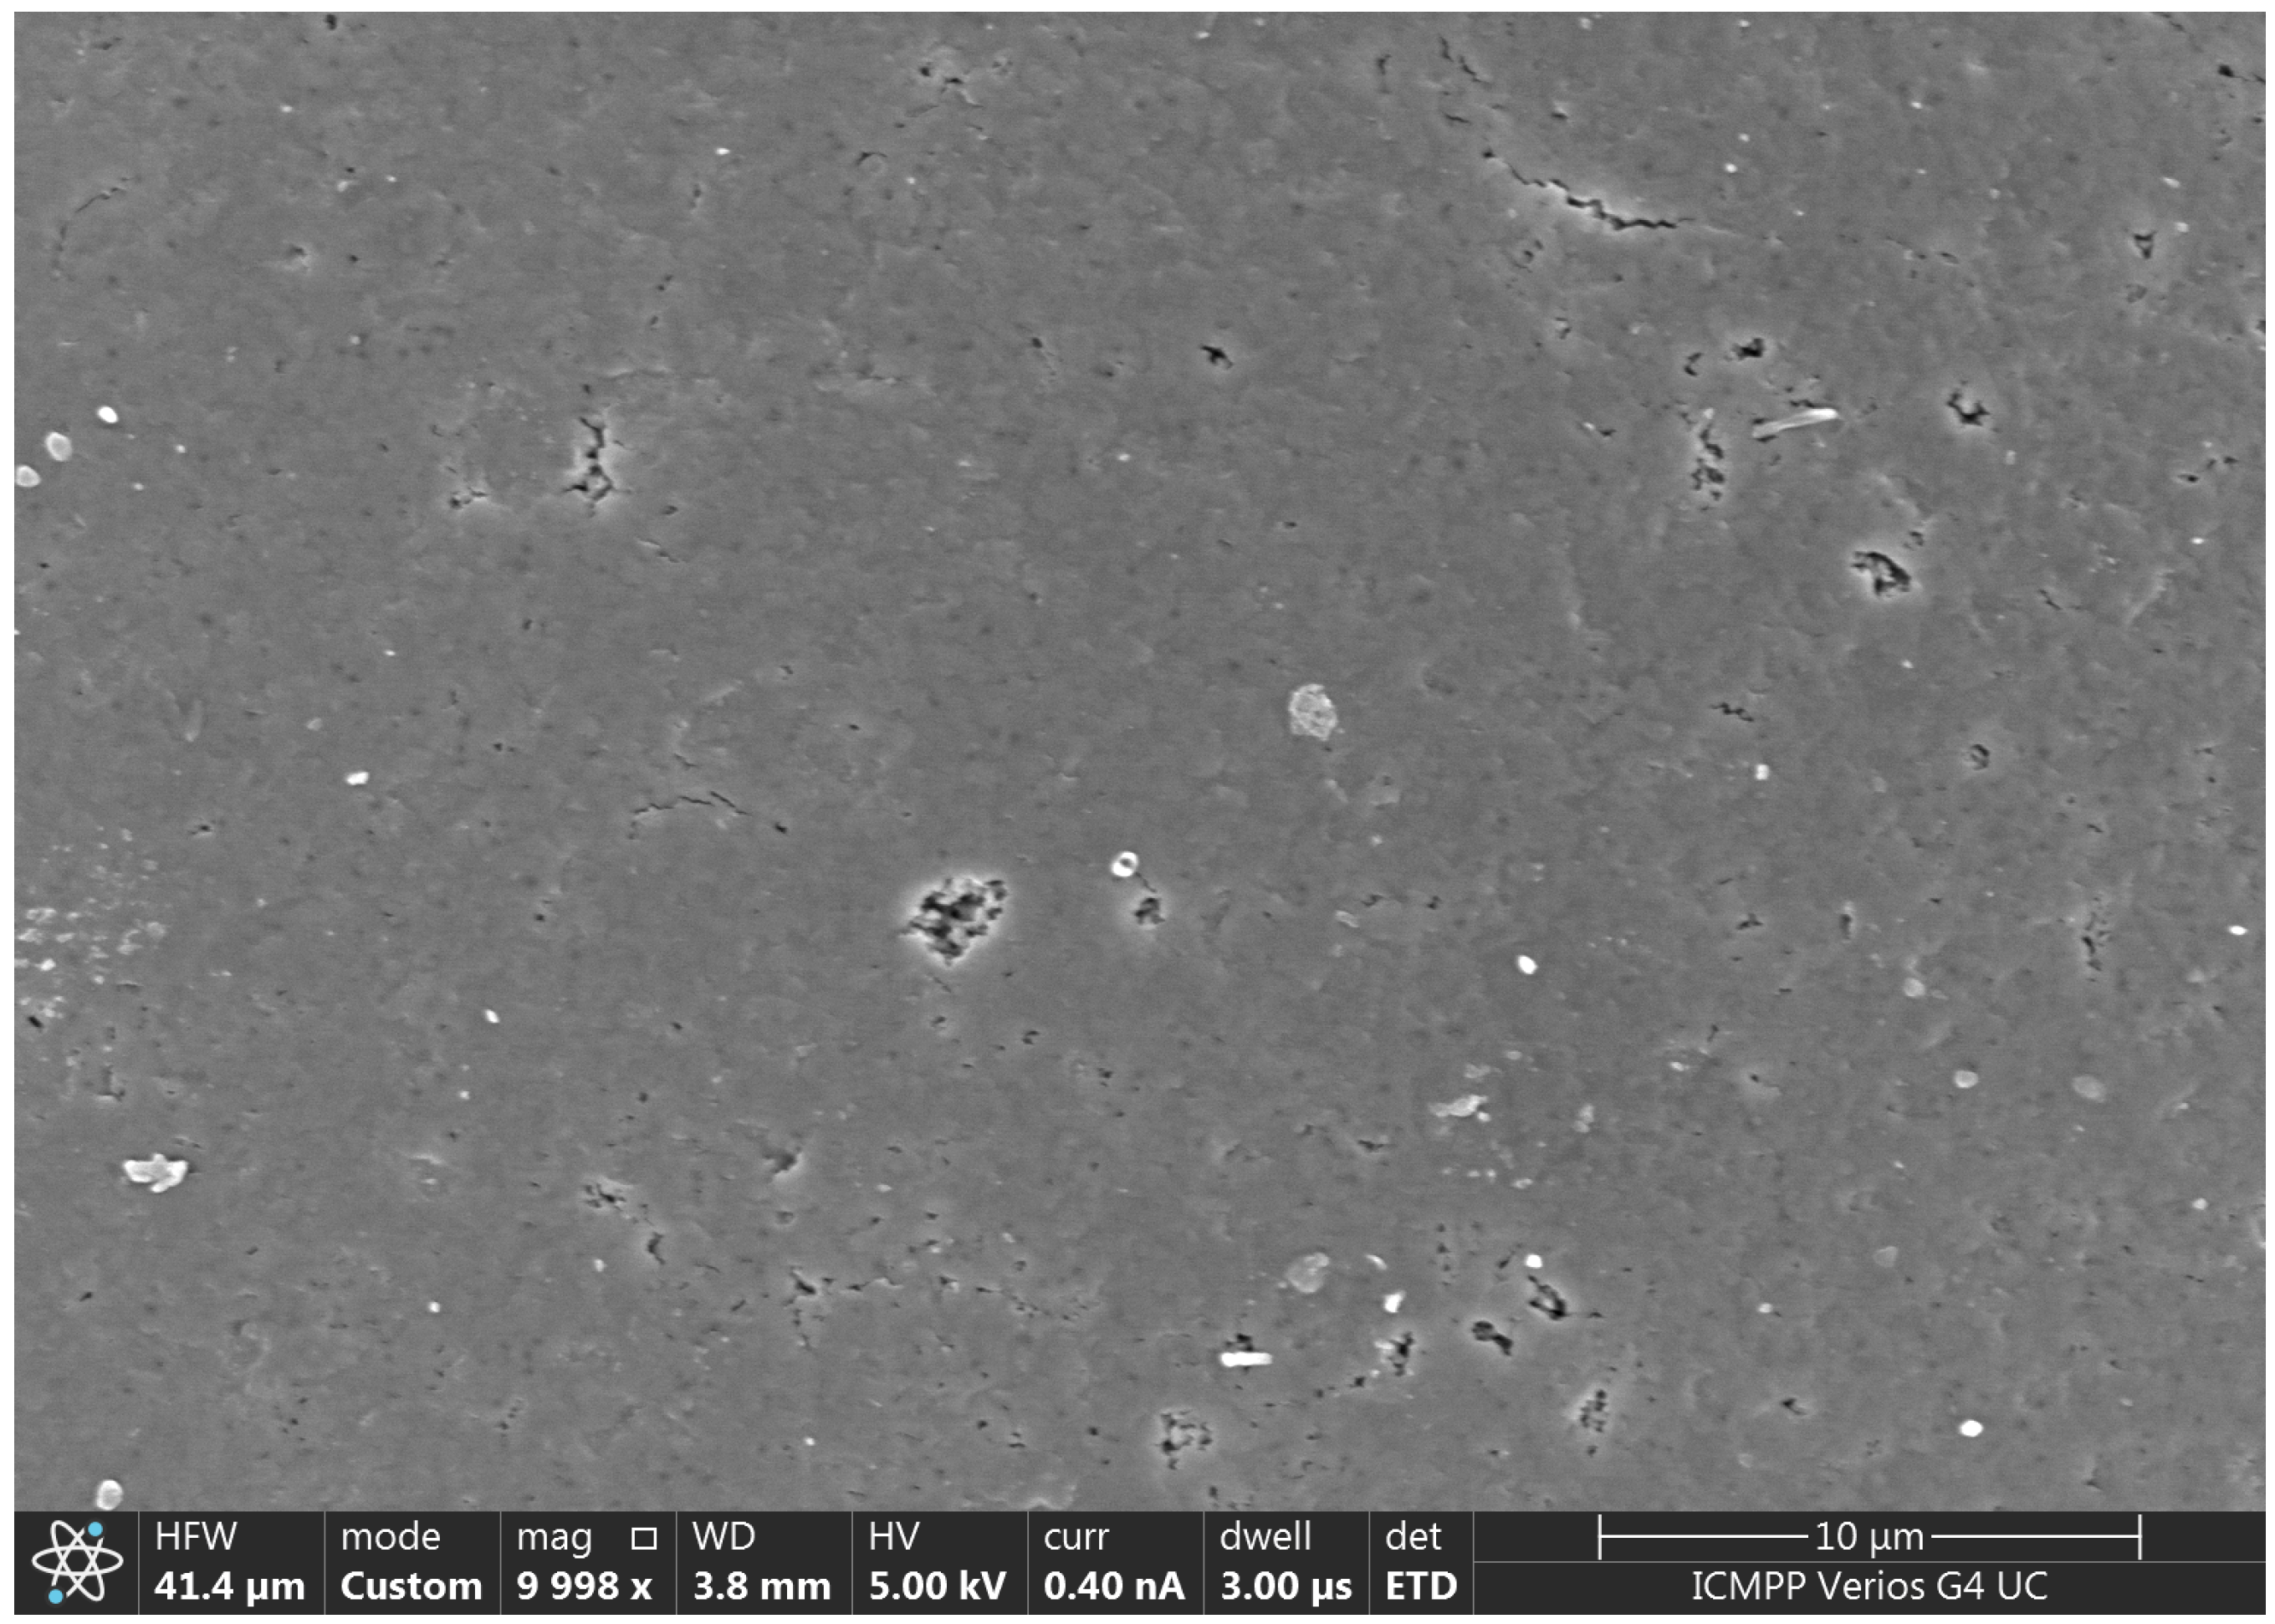
3.1. Morphological and Chemical Characterization of AP2 Copolymer
3.2. Textural Characteristics of the AP2 Copolymer
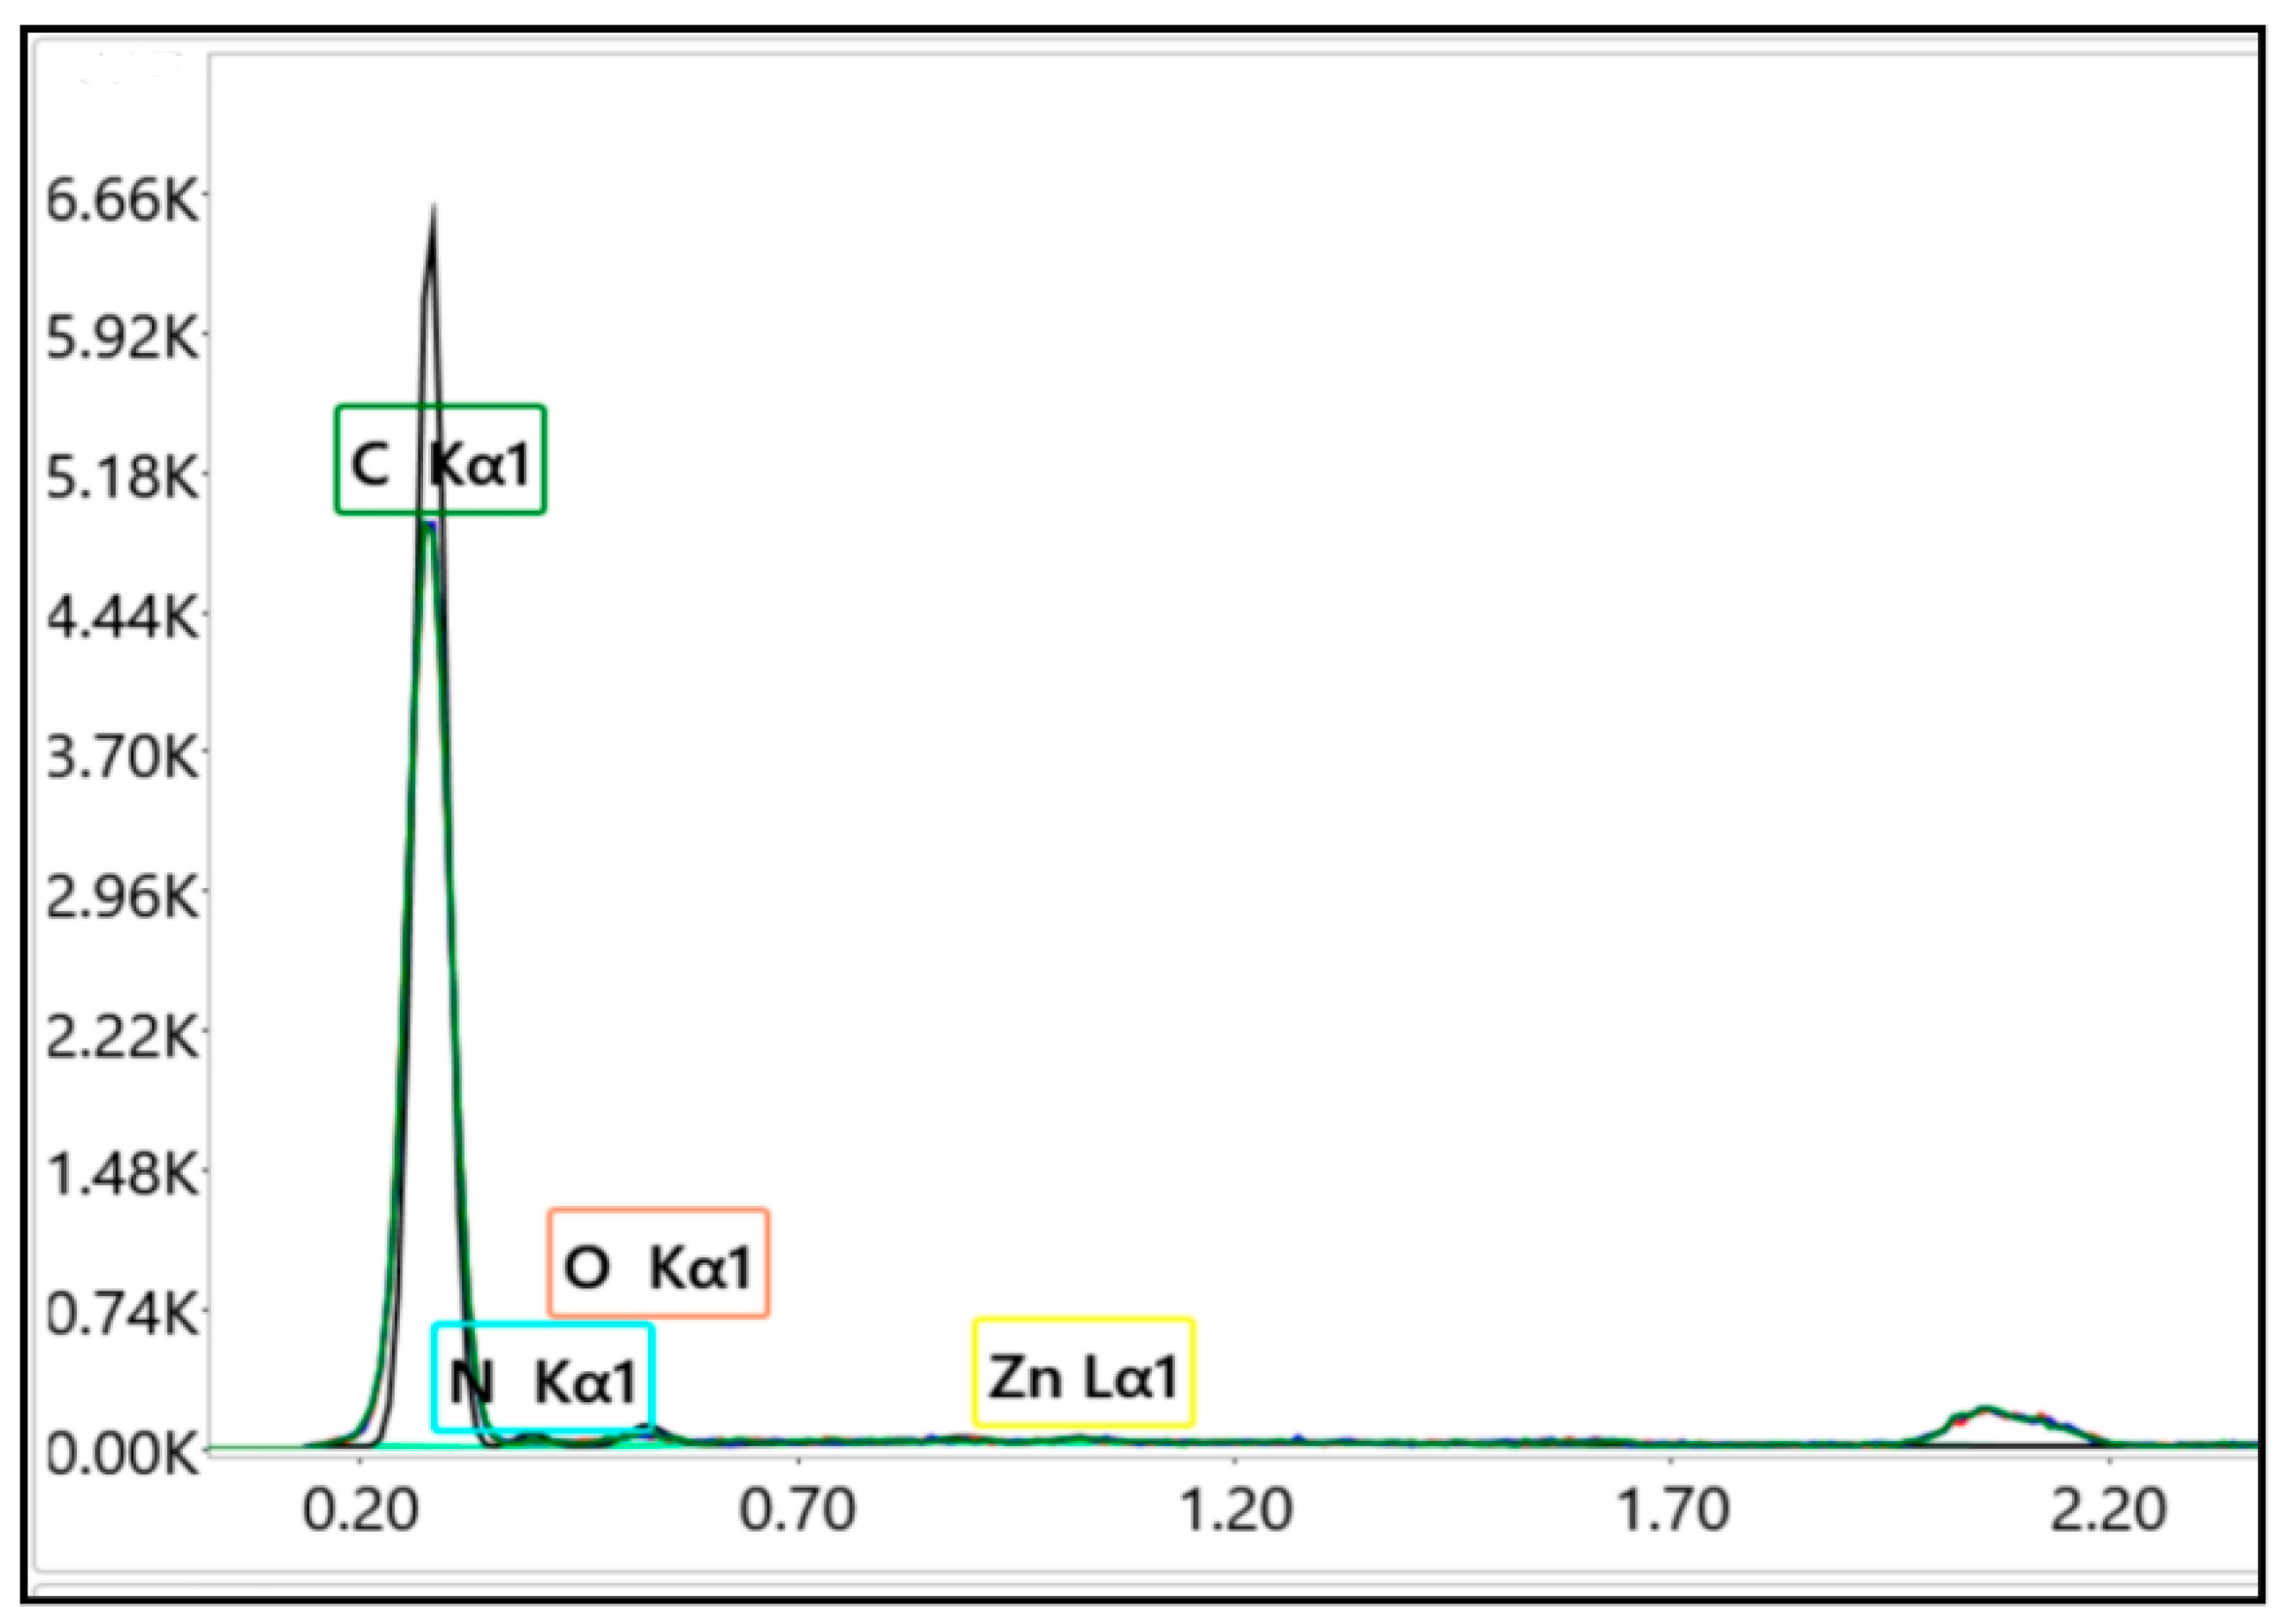
3.3. Characterization of AP2 Copolymer Impregnated with Zn(II) (Code: AP2-Zn(II))
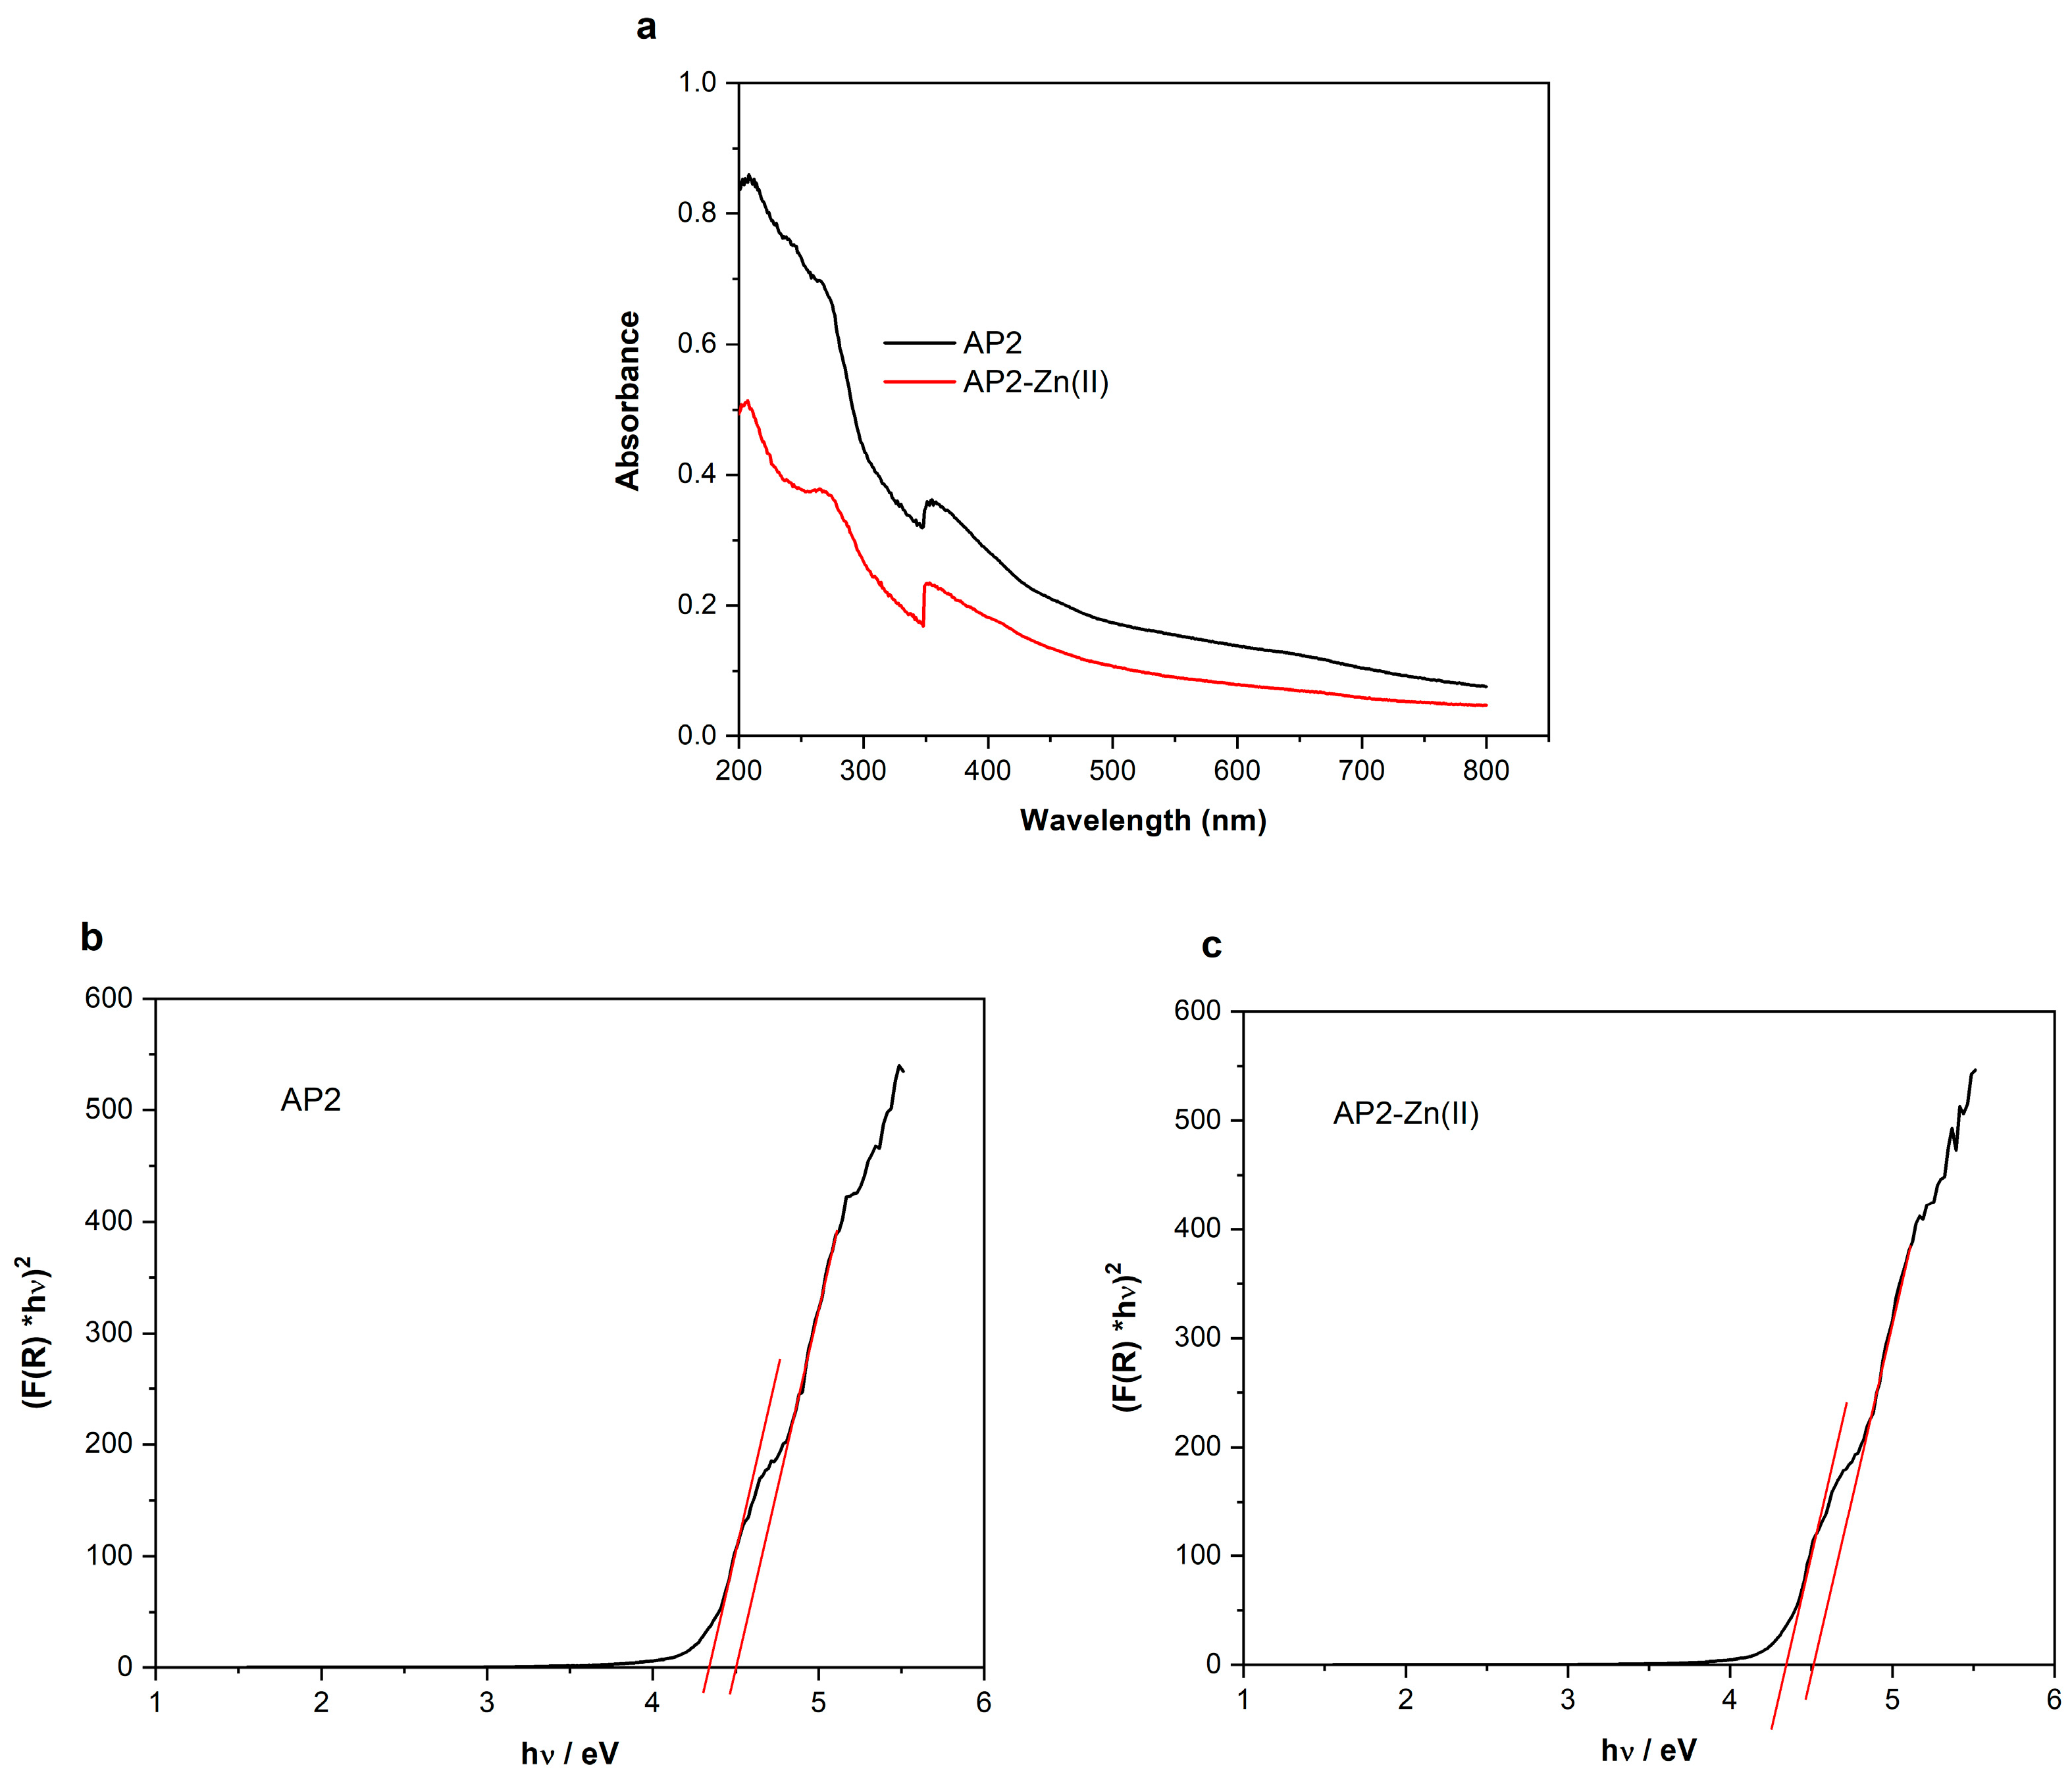
3.4. UV–Vis Diffuse Reflectance Spectra and Band-Gap Energies
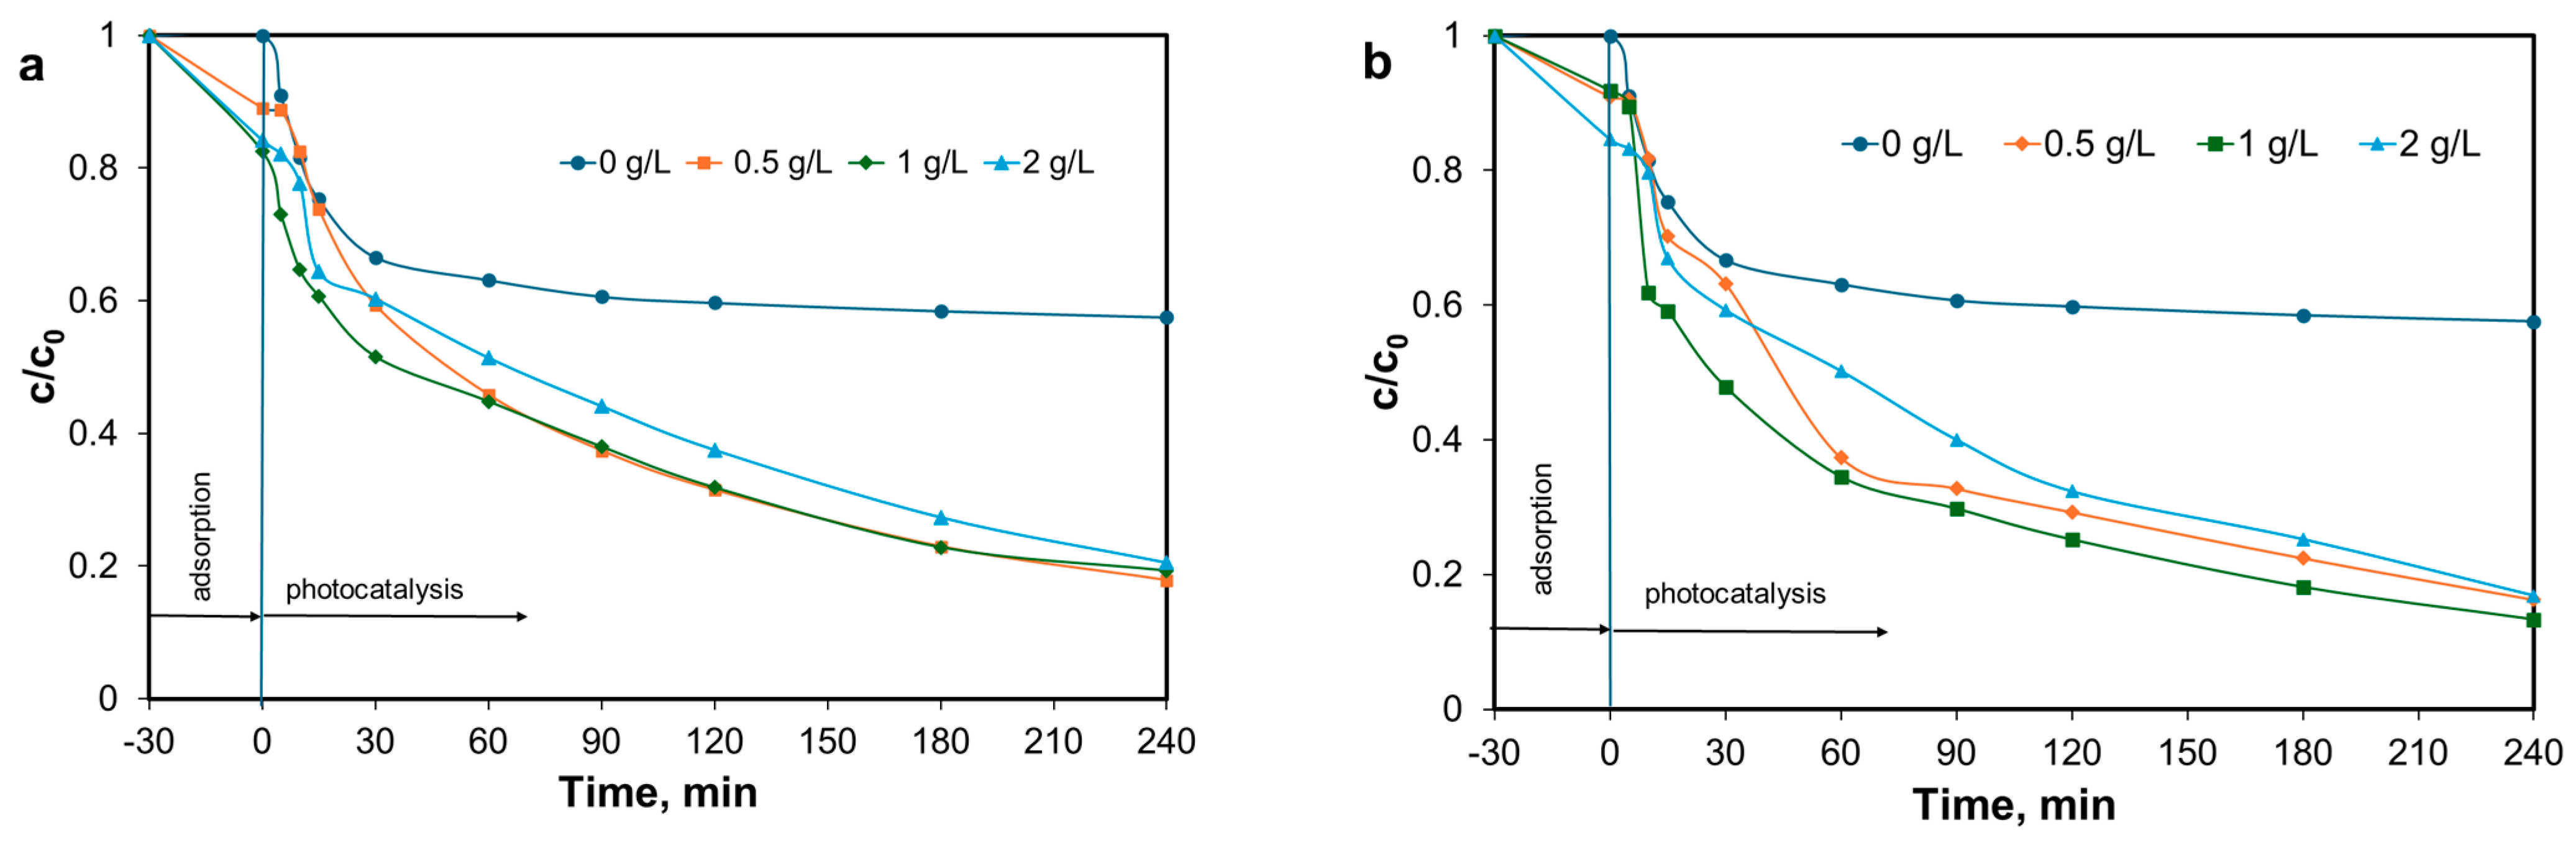
3.5. Optimization of Photocatalytic Tests
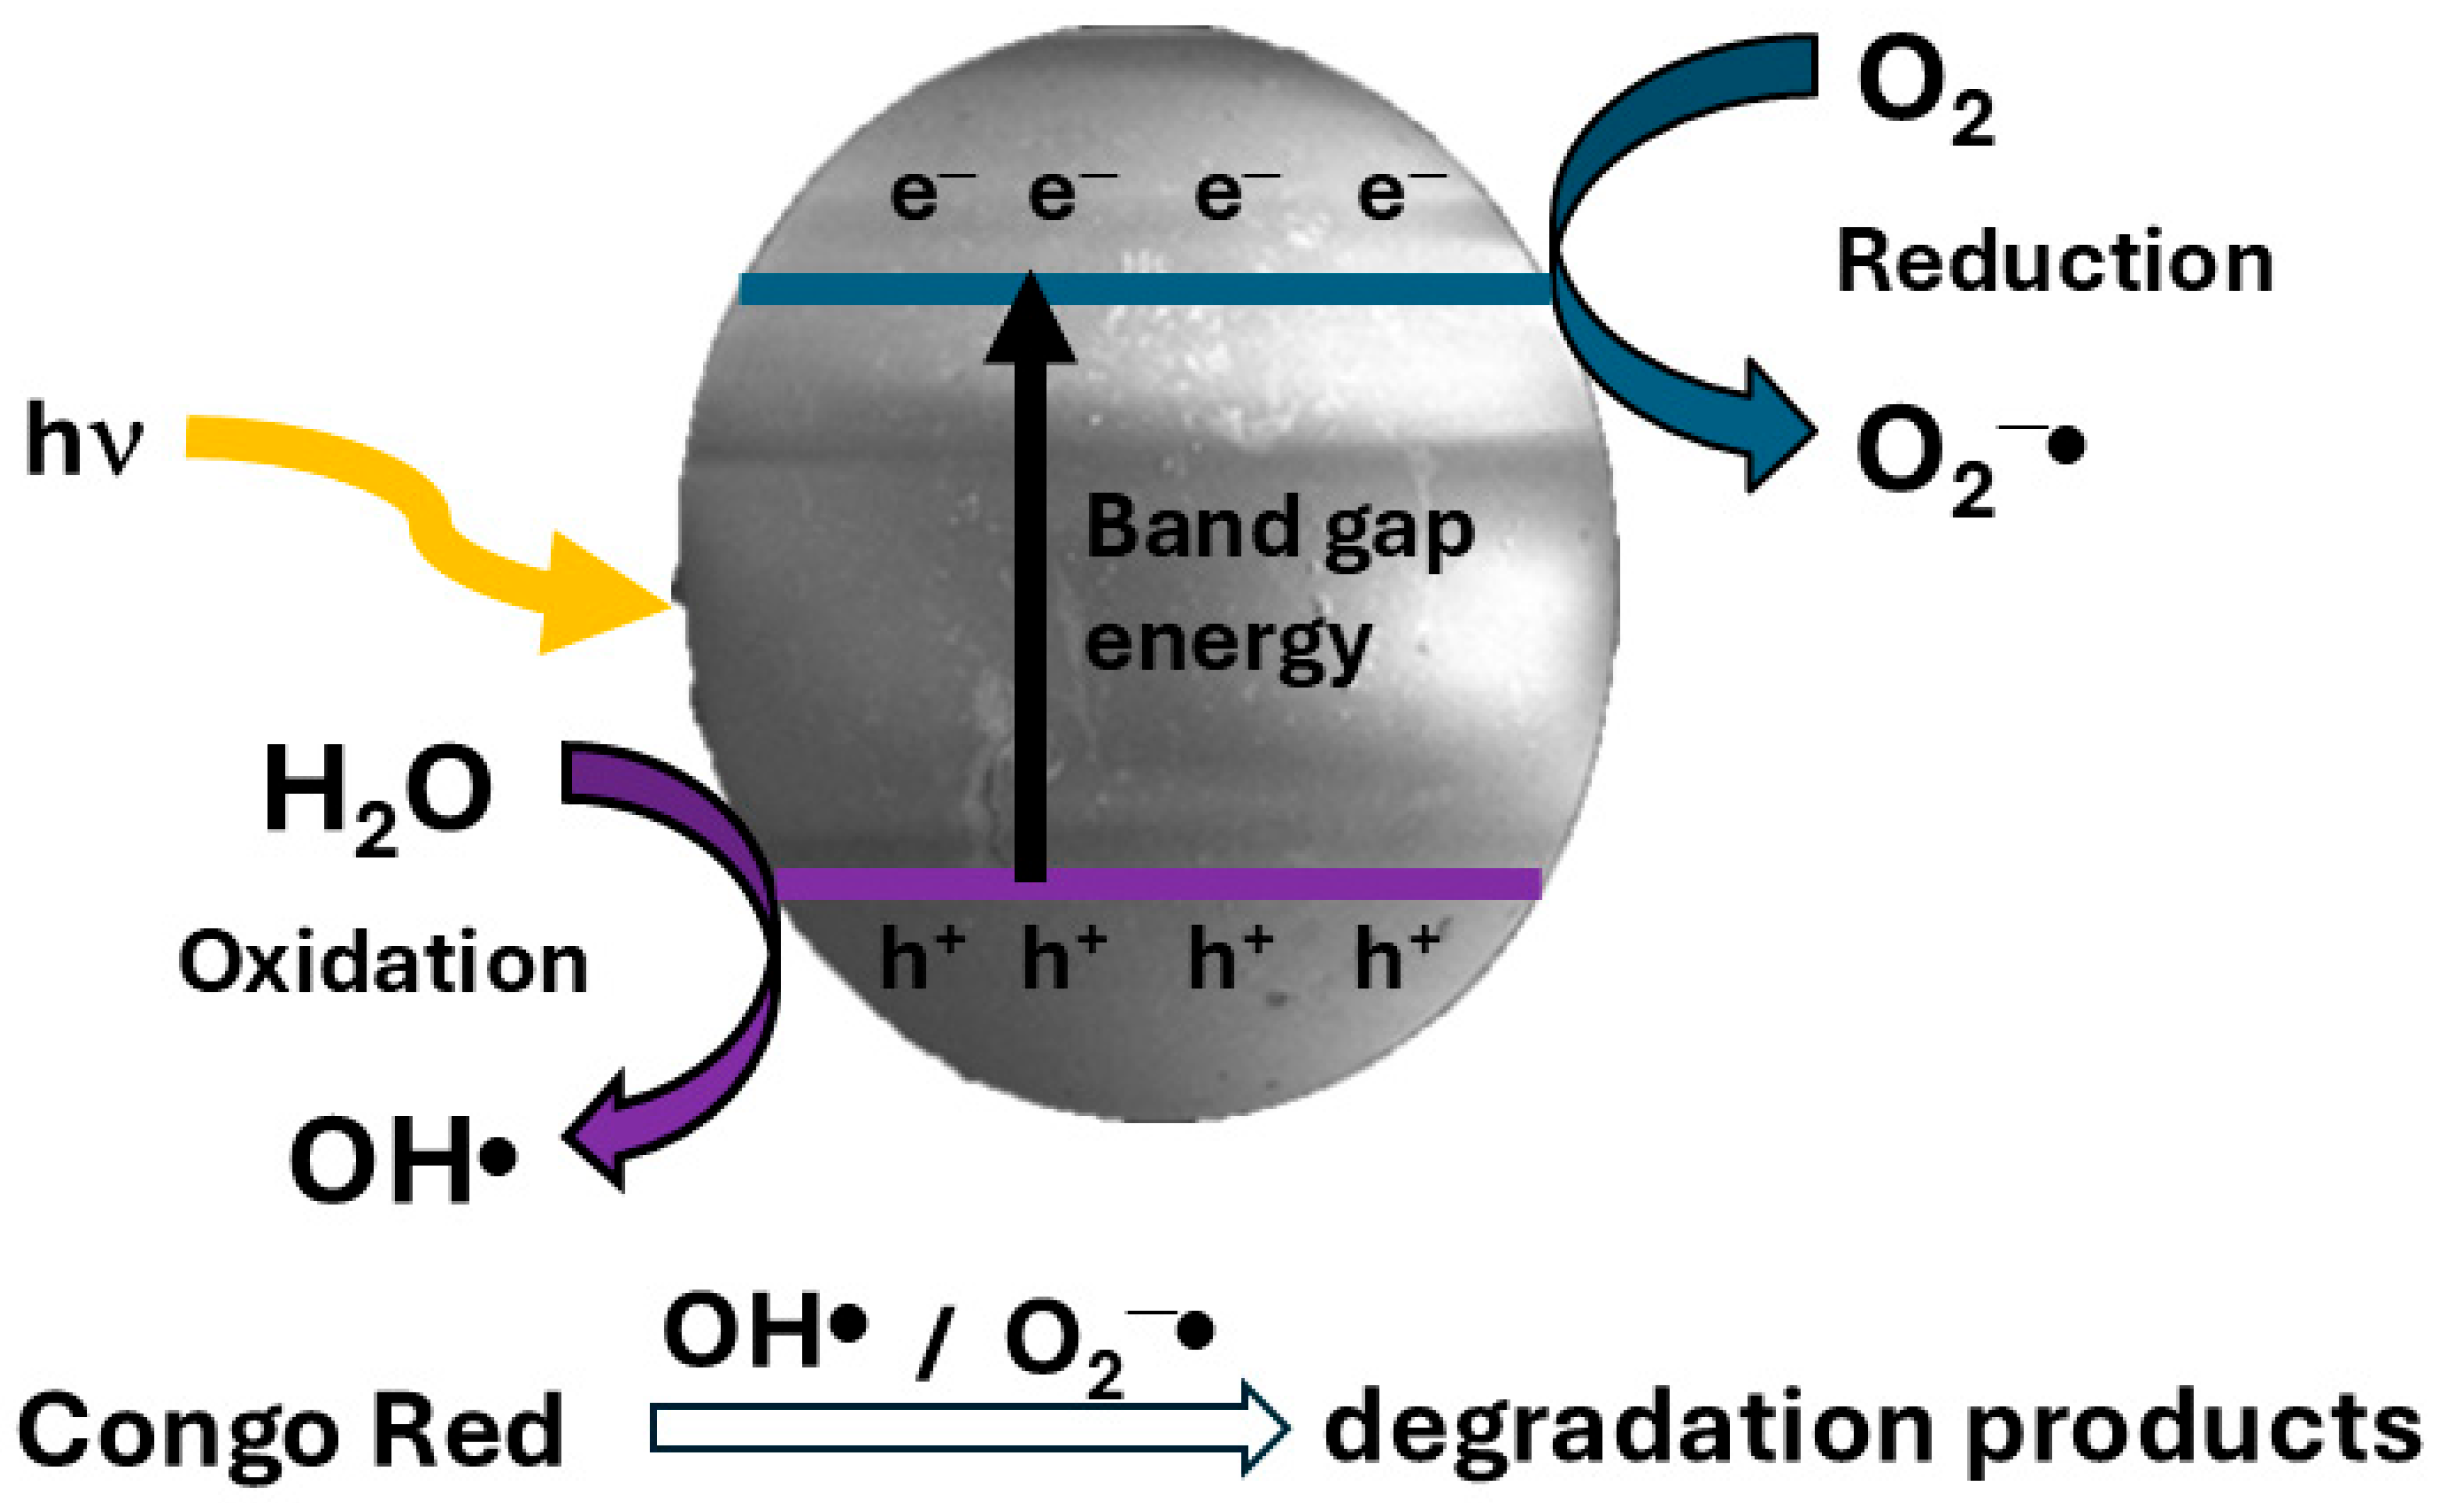
3.6. Photocatalytic Activity
4. Conclusions
Supplementary Materials
Author Contributions
Funding
Institutional Review Board Statement
Data Availability Statement
Conflicts of Interest
References
- Nasar, A.; Mashkoor, F. Application of polyaniline-based adsorbents for dye removal from water and wastewater—A review. Environ. Sci. Pollut. Res. 2019, 26, 5333–5356. [Google Scholar] [CrossRef] [PubMed]
- Sarkar, S.; Ponce, N.T.; Banerjee, A.; Bandopadhyay, R.; Rajendran, S.; Lichtfouse, E. Green polymeric nanomaterials for the photocatalytic degradation of dyes: A review. Environ. Chem. Lett. 2020, 18, 1569–1580. [Google Scholar] [CrossRef] [PubMed]
- Popa, A.; Cocheci, L.; Lupa, L.; Pop, A.; Visa, A. β-Phosphonated Glycine Pendant Groups Grafted on Styrene-6.7% Divinylbenzene Copolymers: Synthesis and Their Application as Photocatalysts. Appl. Sci. 2023, 13, 2025. [Google Scholar] [CrossRef]
- Orooji, Y.; Akbari, R.; Nezafat, Z.; Nasrollahzadeh, M.; Kamali, T.A. Recent signs of progress in polymer-supported silver complexes/nanoparticles for remediation of environmental pollutants. J. Mol. Liq. 2021, 329, 115583. [Google Scholar] [CrossRef]
- Salem, I.A.; El-Ghamry, H.A.; El-Ghobashy, M.A. Catalytic decolorization of Acid blue 29 dye by H2O2 and a heterogeneous catalyst. Beni-Suef Univ. J. Basic. Appl. Sci. 2014, 3, 186–192. [Google Scholar] [CrossRef]
- Lodha, S.; Jain, A.; Paliwal, M.; Punjabi, P.B. Photocatalytic degradation of rhodamin-busing metal complexes and hydrogen peroxide. Indones. J. Chem. 2008, 8, 42–46. [Google Scholar] [CrossRef]
- Velmurugan, R.; Swaminathan, M. Solar energy materials & solar cells an efficient nanostructured ZnO for dye sensitized degradation of reactive red 120 dye under solar light. Sol. Energy Mater. Sol. Cells 2011, 95, 942–950. [Google Scholar] [CrossRef]
- Thota, S.; Tirukkovalluri, S.R.; Bojja, S. Visible light induced photocatalytic degradation of methyl red with codoped titania. J. Catal. 2014, 2014, 962419. [Google Scholar] [CrossRef]
- Muthupoongodi, S.; Linda, T.; Shajan, X.S.; Mitu, L.; Balakumar, S. Polymer-supported catalyst for effective degradation of organic dyes: 100% recovery of catalyst stability and reusability. Polym. Bull. 2018, 75, 1867–1893. [Google Scholar] [CrossRef]
- Cocheci, L.; Lupa, L.; Pop, A.; Visa, A.; Maranescu, B.; Popa, A. Photocatalytical Degradation of Congo Red Azo Dye Using Phosphono-Aminoacid-Cd(II) Pendant Groups Grafted on a Polymeric Support. Rev. Chim. 2019, 70, 3473–3476. [Google Scholar] [CrossRef]
- Zheng, Y.; Cheng, B.; Fan, J.; Yu, J.; Ho, W. Review on nickel-based adsorption materials for Congo red. J. Hazard. Mater. 2021, 403, 123559. [Google Scholar] [CrossRef] [PubMed]
- Tang, J.; Zhang, Y.-F.; Liu, Y.; Li, Y.; Hu, H. Efficient ion-enhanced adsorption of congo red on polyacrolein from aqueous solution: Experiments, characterization and mechanism studies. Sep. Purif. Technol. 2020, 252, 117445. [Google Scholar] [CrossRef]
- Han, X.; Li, R.; Miao, P.; Gao, J.; Hu, G.; Zhao, Y.; Chen, T. Design, Synthesis and Adsorption Evaluation of Bio-Based Lignin/Chitosan Beads for Congo Red Removal. Materials 2022, 15, 2310. [Google Scholar] [CrossRef] [PubMed]
- Güy, N.; Çakar, S.; Özacar, M. Comparison of palladium/zinc oxide photocatalysts prepared by different palladium doping methods for congo red degradation. J. Colloid. Interface Sci. 2016, 466, 128–137. [Google Scholar] [CrossRef] [PubMed]
- Erdemoglu, S.; Aksu, S.K.; Sayılkan, F.; Izgi, B.; Asilturk, M.; Sayılkan, H.; Frimmel, F.; Gucer, S. Photocatalytic degradation of Congo Red by hydrothermally synthesized nanocrystalline TiO2 and identification of degradation products by LC–MS. J. Hazard. Mater. 2008, 155, 469–476. [Google Scholar] [CrossRef]
- Bezerra, M.A.; Santelli, R.E.; Oliveira, E.P.; Villar, L.S.; Escaleira, L.A. Response surface methodology (RSM) as a tool for optimization in analytical chemistry. Talanta 2008, 76, 965–977. [Google Scholar] [CrossRef]
- Karabacak, M.; Kurt, M. The spectroscopic (FT-IR and FT-Raman) and theoretical studies of 5-bromo-salicylic acid. J. Mol. Struct. 2009, 919, 215–222. [Google Scholar] [CrossRef]
- Arjunan, V.; Balamourougane, P.S.; Mythili, C.V.; Mohan, S. Experimental spectroscopic (FTIR, FT-Raman, FT-NMR, UV–Visible) and DFT studies of 2-amino-5-chlorobenzoxazole. J. Mol. Struct. 2011, 1003, 92–102. [Google Scholar] [CrossRef]
- Boukaoud, A.; Chiba, Y.; Sebbar, D. A periodic DFT study of IR spectra of amino acids: An approach toward a better understanding of the N-H and O-H stretching regions. Vib. Spectrosc. 2021, 116, 103280. [Google Scholar] [CrossRef]
- Rouquerol, J.; Avnir, D.; Fairbridge, C.W.; Everett, D.H.; Haynes, J.H.; Pernicone, N.; Ramsay, J.D.F.; Sing, K.S.W.; Unger, K.K. IUPAC Recommendations for the Characterization of Porous Solids. Pure Appl. Chem. 1994, 66, 1739–1758. [Google Scholar] [CrossRef]
- Dragan, E.S.; Humelnicu, D.; Ignat, M.; Varganici, C.D. Superadsorbents for strontium and cesium removal enriched in amidoxime by a homo-IPN strategy connected with porous silica texture. ACS Appl. Mater. Interfaces 2020, 12, 44622–44638. [Google Scholar] [CrossRef] [PubMed]
- Humelnicu, D.; Ignat, M.; Dinu, M.V.; Dragan, E.S. Optimization of arsenic removal from aqueous solutions using amidoxime resin hosted by mesoporous silica. ACS Omega 2022, 7, 31069–31080. [Google Scholar] [CrossRef] [PubMed]
- Nishat, N.; Dhyani, S.; Hasnain, S.; Manisha. Development of antimicrobial aminoacid-modified bisphenol-A formaldehyde resin and its transition-metal complexes. Polym. Bull. 2010, 64, 523–536. [Google Scholar] [CrossRef]
- Yousif, E.; Abdallh, M.; Hashim, H.; Salih, N.; Salimon, J.; Mudhaffar Abdullah, B.; Win, Y.F. Optical properties of pure and modified poly (vinyl chloride). Int. J. Ind. Chem. 2013, 4, 4. [Google Scholar] [CrossRef]
- Hussein, A.M.; Dannoun, E.M.A.; Aziz, S.B.; Brza, M.A.; Abdulwahid, R.T.; Hussen, S.A.; Rostam, S.; Mustafa, D.M.T.; Muhammad, D.S. Steps Toward the Band Gap Identification in Polystyrene Based Solid Polymer Nanocomposites Integrated with Tin Titanate Nanoparticles. Polymers 2020, 12, 2320. [Google Scholar] [CrossRef]
- Vasanth Kumar, K.; Porkodi, K.; Rocha, F. Langmuir–Hinshelwood kinetics—A theoretical study. Catal. Commun. 2008, 9, 82–84. [Google Scholar] [CrossRef]
- Michel, C.R.; Martínez-Preciado, A.H. Adsorption and photocatalytic degradation of Congo red and malachite green by nanostructured Y2O3 synthesized by the coprecipitation method. Open Ceram. 2023, 13, 100336. [Google Scholar] [CrossRef]
- Alhasan, H.S.; Omran, A.R.; Al Mahmud, A.; Mady, A.H.; Thalji, M.R. Toxic Congo Red Dye Photodegradation Employing Green Synthesis of Zinc Oxide Nanoparticles Using Gum Arabic. Water 2024, 16, 2202. [Google Scholar] [CrossRef]
- Hairom, N.H.H.; Mohammad, A.W.; Kadhum, A.A.H. Effect of various zinc oxide nanoparticles in membrane photocatalytic reactor for Congo red dye treatment. Sep. Purif. Technol. 2014, 137, 74–81. [Google Scholar] [CrossRef]
- Elkodous, M.A.; El-Khawaga, A.M.; Abouelela, M.M.; Maksoud, M.I.A.A. Cocatalyst loaded Al-SrTiO3 cubes for Congo red dye photo-degradation under wide range of light. Sci. Rep. 2023, 13, 6331. [Google Scholar] [CrossRef]


| Variable | Symbol | Units | Level | ||
|---|---|---|---|---|---|
| Low −1 | Middle 0 | High 1 | |||
| CR initial concentration | A | mg/L | 15 | 32.5 | 50 |
| Solid–liquid ratio | B | g/L | 0 | 1 | 2 |
| Time | C | min | 120 | 180 | 240 |
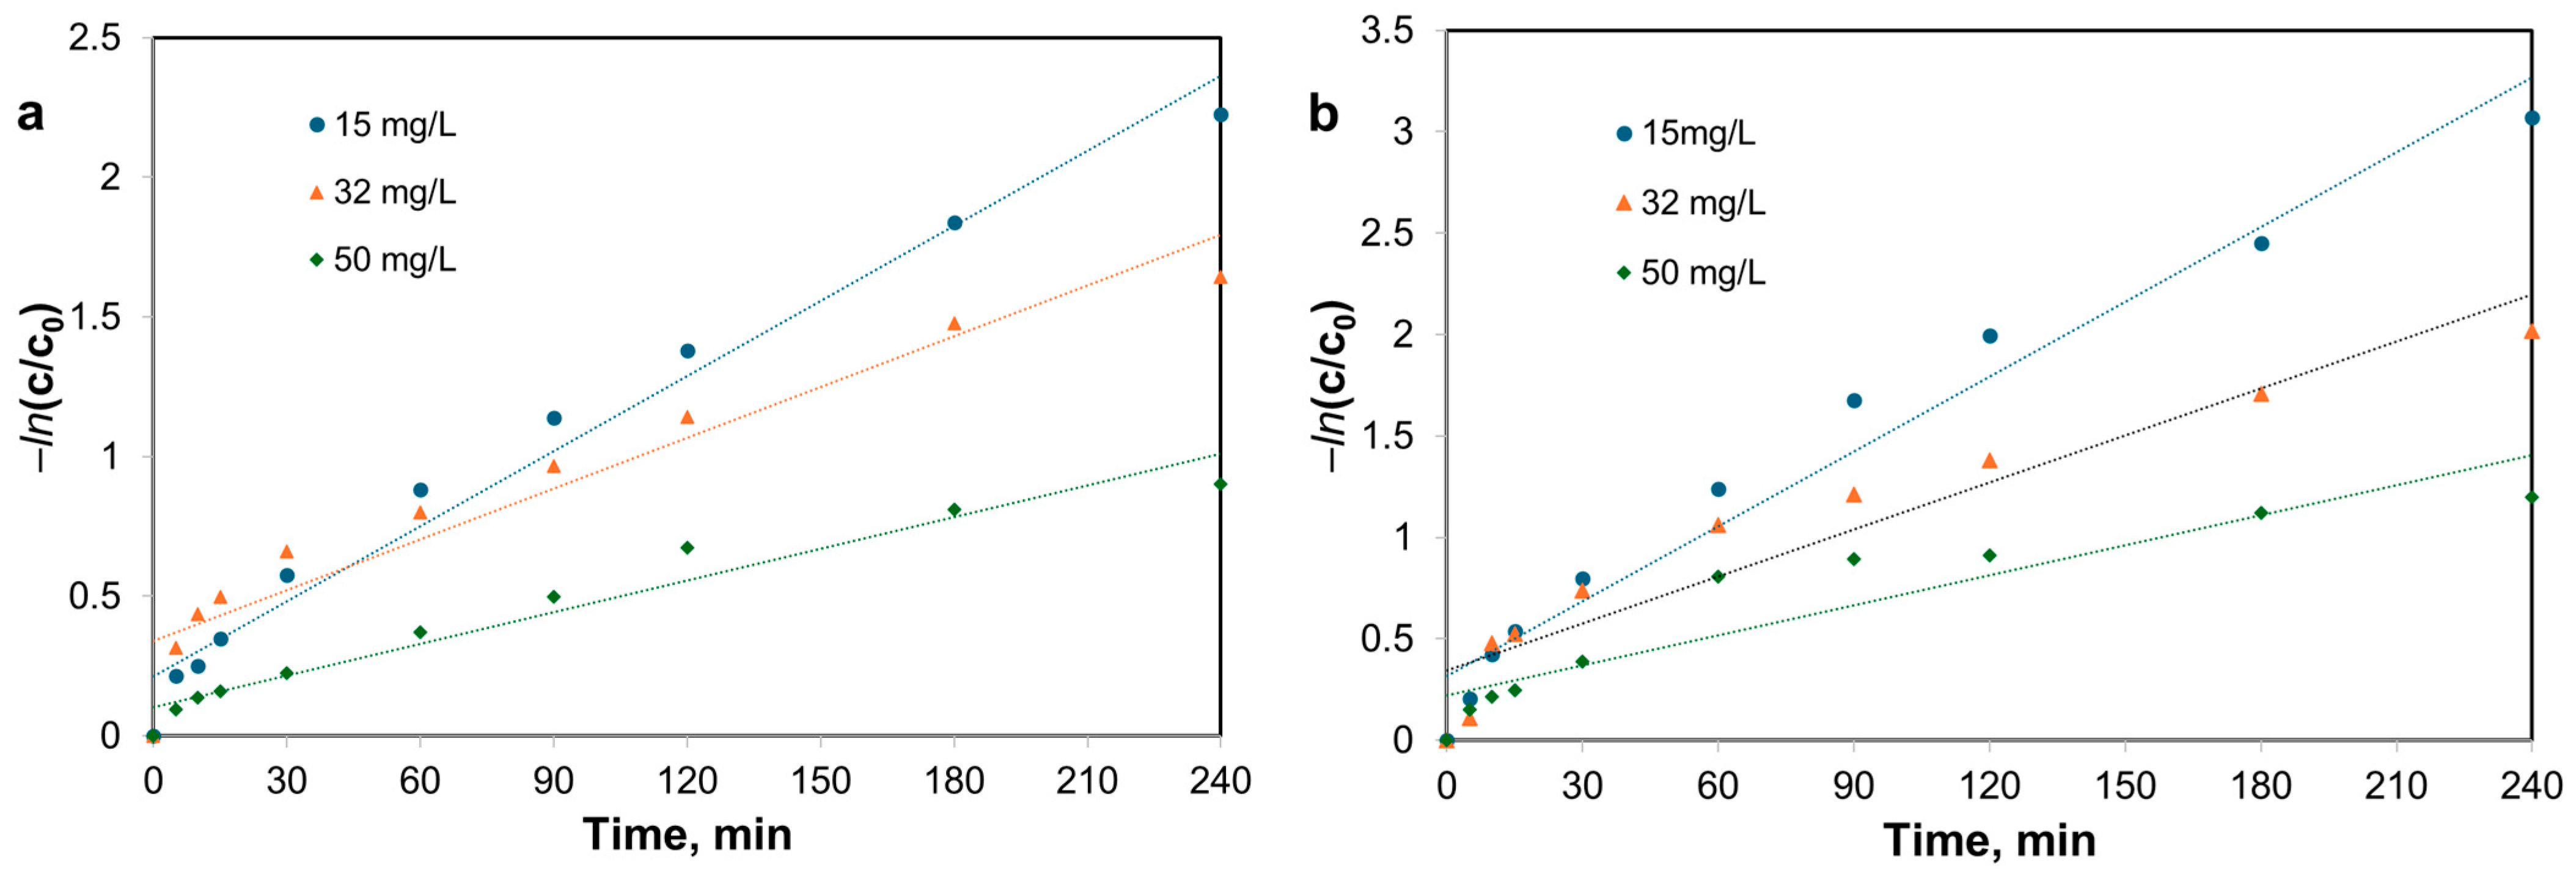
| Photocatalyst | c0 (mg/L) | ka (min−1) | R2 |
|---|---|---|---|
| Photolysis | 15 | 1.84 × 10⁻³ | 0.5628 |
| 32 | 1.90 × 10⁻³ | 0.6233 | |
| 50 | 1.85 × 10⁻³ | 0.6300 | |
| AP2 | 15 | 8.97 × 10⁻³ | 0.9766 |
| 32 | 6.06 × 10⁻³ | 0.9514 | |
| 50 | 3.78 × 10⁻³ | 0.9537 | |
| AP2-Zn(II) | 15 | 12.3 × 10⁻³ | 0.9656 |
| 32 | 7.74 × 10⁻³ | 0.9589 | |
| 50 | 4.93 × 10⁻³ | 0.9561 |
Disclaimer/Publisher’s Note: The statements, opinions and data contained in all publications are solely those of the individual author(s) and contributor(s) and not of MDPI and/or the editor(s). MDPI and/or the editor(s) disclaim responsibility for any injury to people or property resulting from any ideas, methods, instructions or products referred to in the content. |
© 2025 by the authors. Licensee MDPI, Basel, Switzerland. This article is an open access article distributed under the terms and conditions of the Creative Commons Attribution (CC BY) license (https://creativecommons.org/licenses/by/4.0/).
Share and Cite
Cocheci, L.; Visa, A.; Maranescu, B.; Lupa, L.; Pop, A.; Dragan, E.S.; Popa, A. Glycine-Group-Functionalized Polymeric Materials Impregnated with Zn(II) Used in the Photocatalytic Degradation of Congo Red Dye. Polymers 2025, 17, 641. https://doi.org/10.3390/polym17050641
Cocheci L, Visa A, Maranescu B, Lupa L, Pop A, Dragan ES, Popa A. Glycine-Group-Functionalized Polymeric Materials Impregnated with Zn(II) Used in the Photocatalytic Degradation of Congo Red Dye. Polymers. 2025; 17(5):641. https://doi.org/10.3390/polym17050641
Chicago/Turabian StyleCocheci, Laura, Aurelia Visa, Bianca Maranescu, Lavinia Lupa, Aniela Pop, Ecaterina Stela Dragan, and Adriana Popa. 2025. "Glycine-Group-Functionalized Polymeric Materials Impregnated with Zn(II) Used in the Photocatalytic Degradation of Congo Red Dye" Polymers 17, no. 5: 641. https://doi.org/10.3390/polym17050641
APA StyleCocheci, L., Visa, A., Maranescu, B., Lupa, L., Pop, A., Dragan, E. S., & Popa, A. (2025). Glycine-Group-Functionalized Polymeric Materials Impregnated with Zn(II) Used in the Photocatalytic Degradation of Congo Red Dye. Polymers, 17(5), 641. https://doi.org/10.3390/polym17050641