Abstract
Photon Density Wave (PDW) spectroscopy is used as process analytical technology (PAT) in three batch sizes, 1 L, 10 L and 100 L, of polyvinyl acetate—neodecanoic acid vinyl ester (Versa® 10) copolymerization. The effects on particle formation and growth are comparably analyzed. The data show comparability across scales up to a polymer volume fraction of around 0.15. Deviations beyond this suggest differences in particle growth dynamics. A detailed analysis of the dispersion dynamics and mixing properties provides an enhanced understanding compared to previous studies. Furthermore, the PDW spectroscopy data suggest inhomogeneity due to insufficient mixing at the beginning of the syntheses, despite very low feed-rates of the monomer mixture. PDW spectroscopy is thus capable of monitoring deviations in syntheses at different reaction volumes in real-time. These findings underline the potential of PDW spectroscopy not only for monitoring synthesis but also for enabling inhomogeneity analysis as a new application area. The integration of offline conversion and particle size measurements emphasizes the critical role of mixing efficiency in achieving optimal polymer dispersion properties and final product quality.
1. Introduction
Inline monitoring of industrially relevant manufacturing procedures, synthesis and automated processes has gained increasing relevance in recent years. The ongoing automation and implementation of smart sensor systems offers advantages for the producing industry. In polymerization synthesis, automated systems are widely used for automated dosing, stirring and other process control parameters. Smart solutions for inline monitoring, however, are rare and not generally used despite their potential economic impact [1,2,3]. The available inline control methods for polymer synthesis are not yet well optimized.
Vinyl acetate (VAc) and its polymers have been widely developed, used and intensively analyzed since the early days of polymerization theory [4,5]. But very little on inline analysis in liquid dispersions is published. Most analysis is conducted post-synthesis on dried films. Polyvinyl acetate (PVAc) blend films are formed and analyzed regarding swelling and mechanical characteristics [6,7,8,9]. For inline dispersion monitoring, a few methods, like in situ ATR-IR and inline Raman spectroscopy of the modification of the OH end groups by decrease of specific chemical vibrational bands and simultaneous conversion calculations, are possible [10,11,12]. The methods, however, can only be applied at low polymer concentrations and seem complicated and time consuming. Modeling of polymerization reactions is on a good path; however, it needs further optimization [13,14,15].
The inline monitoring of industrially relevant dispersions depends on process analytical technology (PAT). Problems with high-solid-content dispersions arise from the significant increase in emulsion viscosity with increasing solid content. The high amount of solids in the dispersion changes the macroscopic properties of the emulsion. Classical DLVO Theory is no longer applicable. The probability of coagulation is highly increased, leading to waste batches, increasing costs and safety issues [16,17,18,19]. To prevent coagulation and ensure a safe process, PAT tools, like Photon Density Wave (PDW) spectroscopy, can be implemented. Successful inline monitoring of high solid content (up to 63 wt % PVAc dispersions) by PDW spectroscopy of small reaction volumes up to 1 L has already been shown and reported [20,21,22].
In this research, PDW spectroscopy is further established as a powerful PAT tool that determines the absorption coefficient µa and reduced scattering coefficient µs’ independently of each other without dilution or sampling. Jacob and Pauer reported on the scale-up process of the PVAc-Versa® 10 synthesis [23]. The authors showed that inline particle size determination by PDW spectroscopy was successful. The authors also showed that inline measurements of the particle size agree very well with the theoretically calculated mean particle diameter. In contrast, measurements of particle sizes with dynamic light scattering (DLS) and disc centrifuge (DC) show huge deviations at solid contents over 30% polymer fraction [23].
Different approaches to synthesis scale-up are available but involve complicated steps to ensure a safe process [14]. The choice of polymerization technique has significant effects on the properties of the polymer product [24,25]. The upscaling of emulsion polymerization processes to large volumes might face many challenges. The nonlinear scalability of components often leads to safety issues, imperfect mixing and accumulation of reactive monomer [26,27,28,29]. Additional issues are reduced heat transfer [30], coagulation and reactor fouling by polymer precipitates and many more. The colloidal stability of the particles is affected in larger reaction volumes by dilution, reactor geometry and interactions between particles [31,32,33,34]. A proper scale-up procedure is important to maintain colloidal stability, prevent coagulum and ensure consistent material properties [35,36,37]. To guarantee safety and continuous product quality, PAT applications are highly valuable. However, only basic process analysis like flow rate control, pH control, temperature control and offline sample analysis are used in a standardized manner [34,38,39].
The main finding of this study is the ability to use PDW spectroscopy as a very early detection measure by means of the presented Iraw and µs’ values in the initial reaction minutes. From these data, early deviations from an ideal process are detectable. These inconsistencies are proven by well-established methods like gravimetrical conversion control and particle sizing by DLS. The inconsistencies detected by PDW spectroscopy in Iraw are very useful to check if a polymerization process is progressing as desired. These findings are suitable to be transferred from the PVAc-copolymer analyzed here to various types of other polymer reactions and polymer systems.
The results and safety measures shown here for risk minimization of the given process are specific for the analyzed PVAc/Versa® 10 copolymer synthesis. It is possible to adapt the results to other polymer reactions; safety measures, however, need to be revised and applied for each process individually.
2. Materials and Methods
The chemicals used for the starved-feed emulsion polymerization processes at different volume scales are described in Jacob and Pauer [23]. Table 1 shows the components used and their masses at the three different reaction volumes VR. Semi-continuous batch syntheses at a reaction temperature of TR = 60 °C were conducted, as these showed better integration of Versa® 10 into the copolymer and fewer safety issues with the generation of heat during the polymerization process [40,41]. To start a reaction, the amount of water was put into the reactor. The stirrer was placed at the height according to Table S1 in the Supplementary Materials. Stirring and N2 purging were started (cf. Table S2 in the Supplementary Materials). The reactors were equipped with automated temperature control by external thermostats (Julabo Cryo Compact F30-C thermostat, Huber Unistat Tango thermostat, Huber Unistat 405wl thermostat, regulated to constant jacket temperature by Huber, Offenburg, Germany). The reactor was heated to 60 °C. After a temperature equilibrium of about 10 min, polyvinyl alcohol Mowiol 4-88® was added. The polyvinyl alcohol needed to be dissolved completely before starting the redox and monomer feed. This took several minutes, depending on the reactor size. The initial charge consisted consecutively of a 4.8% by mass polyvinyl alcohol aqueous solution.

Table 1.
Experimental set up of semi continuous emulsion polymerization reactions. Initial masses of water and polyvinyl alcohol Mowiol 4-88® in the initial charge (iC) in the respective reactor as well as total mass of monomer mixture VAc—neodecanoic adic Versa ® 10 dosed during the reaction with the given feed-rate.
The PVAc/Versa® 10 copolymerization mechanism is explained in detail by Agirre et al. [40]. The chemical structures of the used monomers are shown in Figure 1. Versa® 10 is less soluble in water than VAc; it diffuses faster into the active polymer particles and converts to polymer faster. As both monomers are water soluble to a certain extent, the diffusion into the active particles is fast [42]. The rate of polymerization can be assumed to be nearly equal to the feed-rate of the monomer. As polymerizations are run at a constant reaction temperature, it can be assumed that the rate of chain transfer to propagation stays constant throughout the experiment. Due to an excess of initiator radicals in the dispersion, termination reactions are suppressed to keep the polymerization alive and running [43].
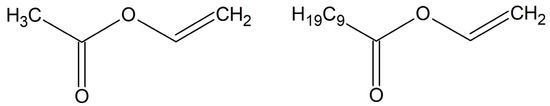
Figure 1.
Representative chemical structures of monomers vinyl acetate (left) and neodecanoic acid vinyl ester (right).
PDW spectroscopy data analysis and evaluation were performed using LabView-based PDW spectroscopy software (v. 2025 Q1) developed, optimized and maintained by the University of Potsdam–innoFSPEC, Potsdam, Germany. The experimental data were checked for consistency. Data with a significant deviation were not used for further data treatment. At least three runs were conducted for each reaction volume to check the reproducibility of the experiments.
Input parameters like refractive index n, density ρ and particle volume fraction ϕ of the dispersion components were used equally, as in Jacob and Pauer, in order to keep the data comparable [23]. The refractive index of the pure polymer was determined by a customized refractometer DSR-λ by Schmidt and Haensch (Berlin, Germany); details can be found in our previous work [20]. The experimentally determined values are shown in Table 2. The formula used to determine the particle density is given below.
Table 2.
Experimentally determined refractive index n and density ρ data used in this research.
ρDisp, ρD and ρP are the densities of the dispersion, the dispersant and the polymer. ω is the solid content of the dispersion. For the density of zero polymer content, the density of pure water was considered. These data are necessary for the experimental determination of the reduced scattering coefficient and absorption coefficient.
2.1. Photon Density Wave Spectroscopy
PDW spectroscopy has been optimized as a technique and established as a promising PAT tool. Detailed description of the technique, set-up [44,45] and application can be found in various publications [46,47,48,49,50]. As a PAT tool for the inline monitoring of polymerizations, PDW spectroscopy has been applied to small-scale reaction volumes in emulsion polymerization and other processes. It delivered reproducible results on the inline synthesis analysis, undiluted dispersion analysis and particle size analysis of high-solid-content, highly turbid liquid dispersions [20,22,46,51].
An advantage of inline PDW spectroscopy is its wide range of application. Using a simple optical fiber probe, it can be either implemented directly into the bulk reactor via an inlet port or it can be used in a bypass of the reactor where other PAT sensors are also implemented. Consequently, the volume, reactor set-up and probe positioning are key aspects. Measurements far away from the stirrer might not represent the conditions in the overall reactor. Sufficient mixing at the point of data acquisition is therefore crucial to produce a reliable PAT result.
A PDW spectroscopy measurement for one wavelength consists of a scan of 15 fiber distances df over a modulation frequency f, ranging from 10 to 510 MHz. Each distance df creates an intensity signal Iraw over the set frequency range. In a well-mixed dispersion, smaller distances result in higher intensity data, e.g., small df lead to higher Iraw. Detected photons travelled a shorter measurement path length through the sample and have been scattered less often than at larger distances. For longer pathways, i.e., larger df, lower intensities are expected as more scattering events and stronger absorption occur on the random walk of the photons through the sample from emission to the detection fiber. A detailed description of the measurement principle can be found in Bressel et al. [52]. Formula 27 in that paper describes the derivation of the optical coefficients µa and µs’ from the distance-dependent measurements by PDW spectroscopy based on the theory of radiative transport [47,49].
As data are acquired based on manually set boundaries for the measurement distances df and used modulation frequencies, data curation after the measurement might be necessary. This is performed manually after the experiment has been completed. The initially set number of distances df and modulation frequencies f can be cut if the signal to noise ratio is too high. Too high noise might be interpreted as valuable data. This leads to errors in the analysis, as the used noise does not describe the particulate system. For each experiment, the data thereof are analyzed, and the used df and modulation frequencies are cut manually so that a proper fit of intensity and phase [52] can be applied by the algorithm in the used LabView analysis software (v. 2025 Q1).
2.2. Microwave Analyser
For offline conversion analysis, samples were dried with a Smart System 5 device from CEM (Kamp-Lintfort, Germany). A small sample of approx. 3 g was dried at 120 °C until mass consistency. Determination of the total solid content ω was performed by gravimetrical mass comparison between the wet and dried sample. This determined total mass (i.e., dried mass of polymer and stabilizing agent) was used for calculation of the respective volume fraction φ. The volume fractions have been calculated accordingly with the densities of the medium and polymer described in Table 2. The formula is shown below.
with solid content ω; density of the polymer and the dispersant ρP and ρD.
2.3. Dynamic Light Scattering
DLS measurements were performed on a Zetasizer Nano ZS from Malvern Instruments (Malvern Panalytical GmbH, Malvern, UK), using single-use polyethylene UV cuvettes with a diameter of 10 mm. The laser position and attenuator settings were determined automatically by the device itself. A scattering angle of 173° was used. The data analysis was based on the general-purpose model. For the sample preparation, one drop of dispersion sample was diluted in 5 mL demineralized water. The sizes shown here are shown as mean of three consecutive measurements, each individually consists of 18 measurements at 25 °C. The error bars indicate the deviation of the mean diameter between three measurements.
3. Results and Discussion
The results presented here are ordered in the way that the data would be temporally available during or after a synthesis performed in real-time in the laboratory. Therefore, inline-determined PDW spectroscopy data are shown for one synthesis first by means of the Iraw trends (Section 3.1), which are readily available in real-time while the synthesis proceeds. Iraw data are observed at the control unit of the PDW spectrometer. Further, inline µa and µs’ data are simultaneously plotted and can be analyzed onsite. The data are analyzed for three reaction volumes (Section 3.2 and following). Next, offline data analysis of conversion by means of the solid content analysis and offline-determined particle size is additionally taken into account. Conversion measurements using a microwave analyzer are only available minutes after the time point of sampling due to sample withdrawal, preparation and sample analysis by drying at elevated temperatures. Data on the mean particle diameter by DLS are only available at a later point in time due to sampling, sample preparation by dilution, DLS analysis and subsequent evaluation.
In the end, in Section 3.5, the inline monitoring by PDW spectroscopy of the 100 L synthesis is shown to explore its suitability in high volume reactors and specify the effect of mixing on the dispersion properties.
3.1. Inline Process Analysis of PDW Spectroscopy Intensity Data
For rapid and high conversion and particle formation, a well-mixed and homogeneous reaction dispersion is crucial. Indications for an inhomogeneous dispersion can be observed in the PDW spectroscopy raw intensity data Iraw. If a particle or droplet system, like an emulsion or dispersion, is homogeneously mixed and entities are evenly distributed, the Iraw signal shows a decrease from lowest to highest df. An example is shown in Figure 2.
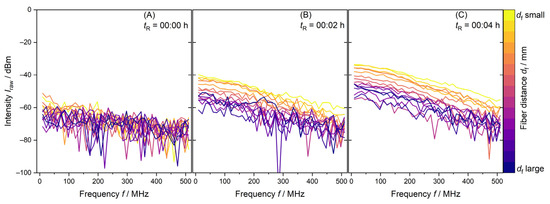
Figure 2.
PDW spectroscopy Iraw data measurements at λ = 638 nm of the first minutes of a synthesis with 1 L reaction volume. (A) shows Iraw just before addition of monomer mixture, (B) after two minutes and (C) after four minutes of monomer dosing.
Figure 2 shows PDW spectroscopy Iraw data for a 1 L synthesis. tR = 00:00 h shows a measurement of 15 fiber distances of the reaction mixture containing only water and redox initiator. Due to the absence of strongly scattering droplets and particles, measurement of this initial charge only leads to noise in the Iraw data in Figure 2A. tR = 00:01 h indicates the addition of VAc/Versa® 10 monomer mixture to the reaction vessel. Within two minutes and one PDW spectroscopy measurement, the Iraw values increase. An ordered decrease in Iraw from small to larger fiber distances df is established in Figure 2B. A further two minutes of reactant dosing causes Iraw to increase overall. A higher order of the fiber distances is visible in Figure 2C. These data are expected for a well-mixed, homogenous reaction mixture.
Figure 3 shows PDW spectroscopy data Iraw over the modulation frequency f of all measured distances taken from a 10 L synthesis. From Figure 3A–F, the synthesis proceeds from tR = 00:02 h to tR = 01:00 h reaction time. The intensity Iraw values for the smallest df (yellow line) and smallest modulation frequency f (10 MHz) increase with increasing reaction time from −30 to −18 dBm. The intensity of the measurement with highest df (purple line) and smallest modulation frequency increases from approx. −60 dBm with high noise to above −40 dBm. In a homogeneous dispersion, the measured intensity Iraw would decrease from df small to df large (from yellow to purple). With the proceeding polymerization, the reaction mixture becomes more turbid. More and larger particles contribute to absorption and scattering in the measurement path length. The detected inconsistencies by PDW spectroscopy in Iraw by means of a deviated order from the smallest to biggest measurement distances df are very useful to check if a polymerization process is progressing as desired.
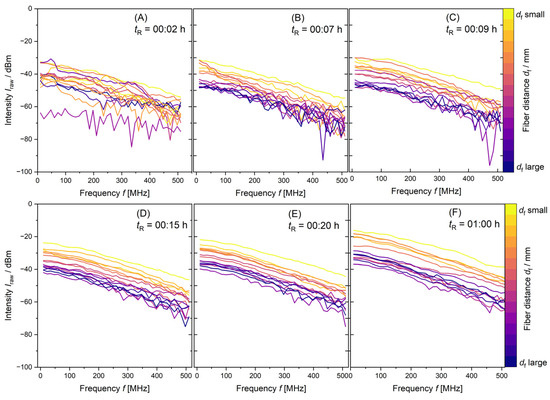
Figure 3.
PDW spectroscopy Iraw data measurements at λ = 638 nm of a synthesis with 10 L reaction volume from tR = 00:02 h to tR = 01:00 h. With monomer mixture dosing time tR increasing from (A–F) as shown and increasing order of df.
With increasing reaction time tR, the order of the distance-dependent measurements from df, small to df, large of Iraw data changes. The irregularity of the measurements in Figure 3 for the 10 L synthesis proposes that inhomogeneity of the reaction mixture is present for reaction times up to at least tR = 00:20 h. This might be caused by insufficient mixing. All dispersions analyzed in this paper have been produced with low feed-rates of the components. The monomer mixture is dosed into the dispersion at rMon1L = 1.2 mL min−1, rMon10L = 12 mL min−1 and rMon100L = 120 mL min−1, respectively. The stabilizer was completely added to the initial charge. With insufficient mixing, the high conversions needed for a starved feed polymerization are not guaranteed. The resulting particle properties will deviate from the desired product properties, leading to inconsistencies in product quality. As data acquisition is fast and the reaction mixture is not homogeneous, the measurements deviate strongly from each other. With increasing reaction time, particle formation and particle growth, the mixture becomes more homogeneous (see Figure 3D–F). PDW spectroscopy intensity measurements Iraw arrange to the measurement distance from smallest df to biggest df, as anticipated.
The Iraw measurements for the 100 L synthesis also indicates incomplete mixing. The data can be found in Supplementary Material Figure S1.
3.2. Inline Analysis of Optical Coefficients—Initial Particle Nucleation and Growth
Additionally to the Iraw data, data on the reduced scattering coefficient µs’ are measured inline by PDW spectroscopy and are readily available during the synthesis. Figure 4 shows the reduced scattering coefficient µs’ measured inline in dependency of the particle volume fraction ϕ for batch sizes of 1 L, 10 L and 100 L. ϕ was calculated as the dosed mass of monomer and colloidal stabilizer at an assumed 100% conversion to polymer. The reaction temperature was kept constant at TR = 60 °C. Until ϕ = 0.15, the scattering properties are comparable across all scales. The measured µs’ indicates that up to ϕ = 0.15 particle nucleation and growth happens at a comparable rate of polymerization. Exceeding ϕ > 0.15, the measured µs’ trends start to deviate from each other significantly.
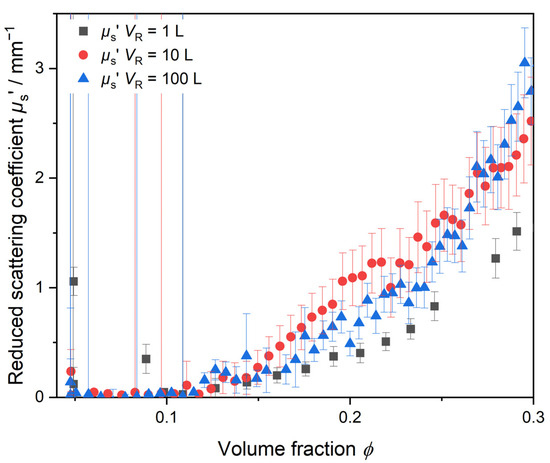
Figure 4.
Initial polymerization phase monitored inline by PDW spectroscopy by means of the reduced scattering coefficient µs’ inline trend at λ = 638 nm. Measurement of µs’ at three different reaction volumes derived from a scale-up procedure from reaction volume of 1 L to 10 L and 100 L.
Here, reliable PDW spectroscopy inline data can only be derived for volume fractions greater than ϕ > 0.1. Before, the scattering was too small to comply with the assumption of significant multiple scattering during the data analysis procedure. Due to the partial solubility of the monomer and small oligomers in water, larger, phase-separated polymer particles with a high refractive index in a significant amount, and thus strong scattering, are only formed later. The reduced scattering coefficient µs’ shows a significant increase at all three reaction scales, starting around ϕ ≈ 0.11. The deviation of the µs’ trends and different particle growth might be explained by the initial inhomogeneity of the respective reaction mixture.
From the Iraw data and the µs’ trends, it can already be observed that the syntheses do not proceed in the same way, as anticipated. Deviations in the µs’ trend clearly show that the dispersion properties are different after reaching a volume fraction of ϕ ≈ 0.15. PDW spectroscopy analysis is based on Mie theory. The µs’ dependency on particle size according to Mie shows that smaller particles at low volume fractions lead to lower values for µs’. As mixing of the 1 L sample is sufficient to create a homogeneous reaction mixture, many small active radical reaction centers are formed where the polymerization proceeds. Therefore, µs’ is smallest for the 1 L sample up to φ < 0.3. The bigger reaction volumes show homogeneity issues, leading to less active reaction centers for polymerization to be formed and therefore larger µs’ values.
3.3. Offline Dispersion Analysis
Further analysis of the synthesis was performed by offline conversion analysis by means of drying samples and determining the solid content and respective conversion.
Figure 5 shows the experimental and theoretical solid content of each synthesis over the reaction time. The experimentally determined solid content ωexp deviates from the theoretical amount of solids at 100% monomer conversion. This deviation is relatively small for a total reaction volume of 1 L. Due to sufficient mixing, the conversion of monomer to polymer is high, and little deviation between theoretical and experimental solid content ω is detected. The difference between ωtheo and ωexp is the largest for the 10 L synthesis. The further each synthesis proceeds, the more divergence between theoretical solid content ωtheo and measured values ωexp is observed. The redox initiator and monomer mixture are dosed into the dispersion at very low feed-rates. In the beginning of the synthesis, the small amount of monomer added to the dispersion is still quickly converted to a high extent. The further the synthesis proceeds, the deviation increases, and the non-converted monomer stays unreacted within the dispersion.
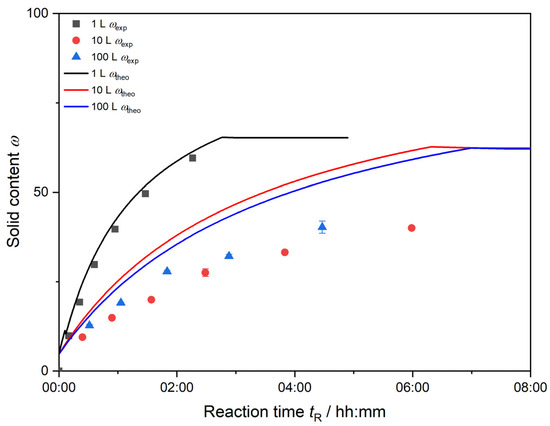
Figure 5.
Calculation of theoretical solid content from 100% monomer conversion ωtheo (lines) and experimentally determined solid content ωexp (symbols are color coded, respectively) of each reaction volume.
Note: For the 100 L synthesis, further measurements of the solid content and respective conversion calculation after tR = 04:20 h were not possible due to heavy aggregation.
Figure 6 shows offline-determined mean particle sizes by DLS for each reaction volume up to a volume fraction of ϕ = 0.3. The final products from the reactions should have the same properties like particle size and particle size distribution and therefore the same reduced scattering coefficient µs’. From these offline measurements, it is evident that the growth of particles between the reaction volumes differs already at early reaction stages. Already at low volume fractions less than ϕ < 0.2, a difference in the determined mean particle size is detectable. The smallest reaction scale of 1 L reaction volume (black squares) produces the smallest particles. Exceeding ϕ > 0.2, the 100 L synthesis (blue triangles) contains particle aggregates in the micrometer size regime, with high deviations between the measurements indicated by the very big error bar. As the reduced scattering coefficient µs’ strongly depends on the particle size within the dispersion, the deviations of the trends between the reaction scales are far earlier detected by PDW spectroscopy in real-time in Figure 3 and Figure 4. From the DLS data in Figure 6, it can be derived that the final particle sizes in the dispersions differ from each other. To achieve a successful scale-up procedure leading to equal properties across reaction scales, PDW spectroscopy can determine deviations already at low volume fractions in real-time much faster than common offline analysis.
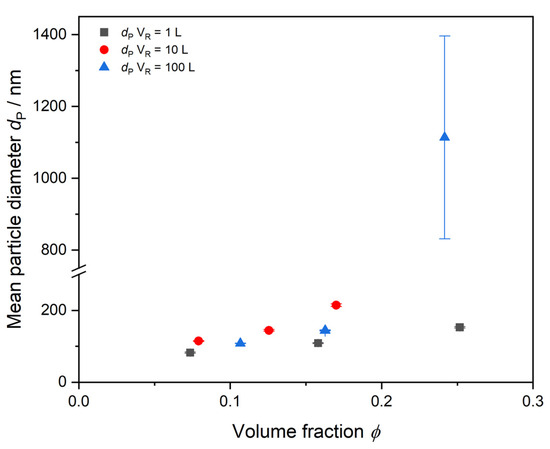
Figure 6.
Volume-based mean particle diameter determined by DLS up to a volume fraction of ϕ = 0.3. Volume fractions have been calculated based on experimentally determined conversion data (cf. Figure 5). Depicted error values are standard deviations of three DLS replicate measurements.
3.4. Comparative Analysis Across Reaction Scales
Figure 7 shows the reduced scattering coefficient µs’ of three syntheses monitored over the complete reaction course in dependence of the volume fraction ϕ. ϕ > 0.57 is reached for all reaction volumes. Figure 7 shows PDW spectroscopy measurements at two different wavelengths, λ1 = 638 nm (Figure 7A) and λ2 = 855 nm (Figure 7B), respectively. An initial increase phase, a plateau phase and a decrease in scattering can be observed. A deviation of the µs’ trends between different scales occurs around ϕ = 0.15 at λ = 638 nm and ϕ = 0.25 at λ = 855 nm. For all three reaction volumes, a plateau phase of µs’ is found. In this plateau, the µs’ value decreases with increasing reaction volume from µs’1 L = 18 mm−1 to µs’10 L = 12 mm−1 and µs’100 L = 7 mm−1. The difference in the plateaued µs’ value indicates that the used scale-up procedure by Jacob et al. might not maintain particle properties in the final dispersion throughout reaction scales. It indicates that the particle growth phase between the reactions deviate from one another. To underline this, a second PDW spectroscopy measurement at λ2 = 855 nm is simultaneously analyzed. Figure 7B also shows a deviation in the final µs’ values. Compared to Figure 7A, the discrepancy between the final µs’ values in Figure 7B decreases. The final values are µs’1L ≈ 12 mm−1 to µs’10L ≈ 8 mm−1 and µs’100L ≈ 5 mm−1. Taking all the inline data produced by PDW spectroscopy into account, it is determined in real-time that the final particle properties will deviate from each other.
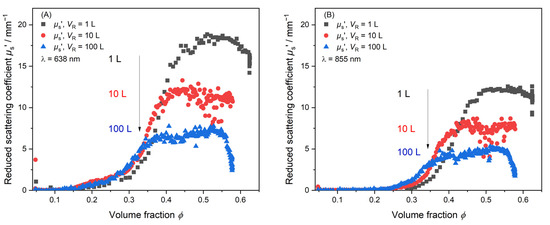
Figure 7.
Inline monitoring of the synthesis process by PDW spectroscopy at TR = 60 °C by means of µs’. Measurement of µs’ at three different reaction volumes. 1 L (black), 10 L (red) and 100 L (blue) at two different wavelengths. (A) λ1 = 638 nm and (B) λ2 = 855 nm measured simultaneously.
3.5. 100 L Synthesis Inline Analysis by PDW Spectroscopy—Effect of Mixing
In this section, the complete reaction of a 100 L synthesis is monitored by PDW spectroscopy. The reaction period of over tR = 07:00 h is completely monitored. The PDW spectroscopy data shown are collected in real-time without any dilution of the dispersion. The PDW spectroscopy probe is directly inserted into the dispersion at all times of the synthesis.
Figure 8 displays the inline trends of the reduced scattering coefficient µs’ and the absorption coefficient µa as well as the total volume fraction ϕ over time and the total conversion χ for a 100 L synthesis.
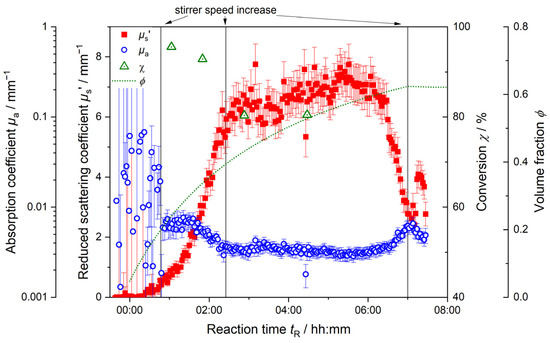
Figure 8.
Inline monitoring of 100 L synthesis by PDW spectroscopy at λ = 638 nm with reduced scattering coefficient µs’ (red) and absorption coefficient µa (blue). Offline-determined total conversion χ (green) and total volume fraction ϕ (green dotted line) are shown along the reaction progress. Vertical lines indicate manual increases of the stirrer speed.
In the beginning of the reaction up until tR = 00:50 h, the absorption coefficient µa (blue circles) does not yield consistent data points. Collected µa data are very noisy; error bars are high, and no trend is derivable. An increase in the stirrer speed at tR = 00:50 h results in steady µa measurements. With the manual increase in stirrer speed, µa stays constant for approx. 00:30 h and decreases afterwards. This decrease in the total dispersion absorption is explained by the changes within the reaction dispersion. In the beginning up until the increase in stirrer speed, the system shown signs of inhomogeneity. The inhomogeneity itself is not at all increased. Due to this insufficient mixing, the assumed conditions for PDW spectroscopy measurements are not met, and PDW spectroscopy cannot deliver conclusive measurements for µa. (PDW spectroscopy Iraw inline data are shown in Figure S1.) Further, with proceeding synthesis and increasing homogeneity due to the increased stirring speed after tR = 00:50 h, the absorption decreases. This decrease is caused by the combined changes happening in the dispersion. As absorption is a sum parameter, it is influenced by all the entities available in the dispersion. In the beginning of the synthesis, the absorption of the dispersion is mostly influenced by the high absorption of the aqueous medium und a high number of active radicals. It was found before that created radicals from the initiator and monomers show a high absorption [53]. Due to insufficient mixing, possible monomer droplets in the dispersion also contribute to the higher µa values. With proceeding synthesis, the radical number and residual monomer in the dispersion decreases. Simultaneously, polymer particles start to form and grow. As the absorption of polymer particles is lower than that of the radicals and the aqueous medium, the overall absorption of the dispersion decreases. After a second manual stirrer increase at tR = 02:30 h, it levels off at values around 0.003 mm−1.
Only after approx. 06:00 h of reaction time, the absorption starts to increase again without any applied extrinsic changes. This increase is caused by the aggregation of polymer particles in the dispersion. The total number of particles decreases as individual particles coagulate and form aggregates. A further stirrer speed increase was applied at tR = 07:00 h in order to counteract coagulation of the dispersion. However, coagulation could not be averted. The final product achieved was a paste rather than a liquid dispersion.
In Figure 8, the trend of the reduced scattering coefficient µs’ (red squares) starts to increase slowly in the beginning at tR = 00:15 h. The formation of particles starts to influence the scattering properties of the dispersion. The slope of µs’ increases continuously as polymer particles are formed and continue growing. The manual increase in stirrer speed at tR = 00:50 h does not show such a significant effect on µs’ as it has on µa. µs’ continues to grow; its slope becoming steeper as more polymer particles as scattering entities are formed and increase in size, contributing to the overall scattering. At the second manual increase in stirring speed at tR = 02:30 h, µs’ still increases for a while, but the acquired datapoints become noisier, and a slight overall increase is observed up until approx. tR = 06:00 h. During the course of the reaction, the changes in scattering become less pronounced; initially, µs’ increases strongly with a steep slope. With the continuous addition of monomer to the dispersion (green dotted line), the particles continue to grow. However, the changes in their volume, the overall volume fraction and particle number are less pronounced, creating a decreasing slope of µs’. After tR = 06:00 h, µs’ suddenly decreases significantly. Both optical coefficients µa and µs’ change. As discussed before here and in Schlappa et al., this can be a sign of particle aggregation in the dispersion [20].
In Figure 8, for the 100 L synthesis, the conversion χ (green triangles) decreases from over 95% to approx. 80%. Due to the initial inhomogeneity (cf. Figure 4, Figure 5 and Figure 7), a conversion of only 96% is achieved in the beginning. Although very low feed-rates of monomer are used, it is not fully converted. The conversion decreases over the whole course of the reaction. Despite manual increases in stirring speed, the initial lack of full conversion cannot be retrieved. As the monomer is continuously fed into the dispersion, it is not completely converted. The running reaction cannot recover the effects the insufficient mixing had on the conversion. The presumed starved-feed process is not reached. Conversion measurements after tR = 04:20 h were not possible here. The high solid contents of the samples drawn from the reactor lead to inconclusive microwave analyzer results. The inline monitoring of the synthesis shows that the initial inhomogeneities detected in the PDW spectroscopy Iraw measurements are also detectable in the noisy inline data acquisition of µa and the low conversion of the reaction.
4. Conclusions
For the first time, the suitability of monitoring 10 L and 100 L reaction volumes with inline PDW spectroscopy for high-solid-content emulsion polymerization synthesis has been described in detail. It is shown that the technique delivers inline data on the optical coefficients without dilution of the dispersion. The feasibility of PDW spectroscopy for the 100 L reaction scale with industrially relevant dispersion properties was successfully demonstrated. The PVAc copolymerization was successfully monitored in real-time. It was shown here that PDW spectroscopy data provide much physical and chemical information about polymerization processes. These findings can be adapted for various other emulsion polymerization systems. On top of the optical coefficients of a polymer dispersion, insights into its dynamics can be drawn. For the scale-up process adapted here with reaction volumes from 1 L to 10 L and 100 L, the reduced scattering coefficient µs’ increases comparably only for up to ϕ = 0.15, indicating similar initial particle nucleation and growth rates throughout the different reaction volumes. However, as the reactions proceed, deviations in both measured inline trends of µa and µs’ suggest differences in the final dispersion properties. It is shown by DLS particle size analysis that the particle size indeed starts to grow deviant to that in the Model 1 L system. These data are particularly valuable and relatable to various polymerization processes as they capture real-time changes in optical properties, which reflect critical aspects of the reaction’s progression in particle growth. Initial deviations between the syntheses can already be seen inline via PDW spectroscopy Iraw data in real-time in the first synthesis minutes.
Instead of relying on experience, data-driven knowledge can be used to ensure safe operation of large-scale syntheses and consistent product quality. PDW spectroscopy inline data reveal these early reaction inconsistencies. Insufficient mixing and resulting inhomogeneity, especially in the larger volumes, hint that starved-feed conditions are not achieved. It is detected that the scale-up procedure is not feasible to deliver identical dispersion properties. This was only found after advanced analysis of PDW spectroscopy data in combination with offline conversion data. Earlier studies based on basic data evaluation could not deliver these progressive results. The inline data highlight the importance of sufficient mixing at early reaction stages to achieve high conversion values. Further, the implemented PDW spectroscopy as PAT was able to indicate coagulation incidents during synthesis. Both inline trends µa and µs’ significantly change during coagulation, and countermeasures could be introduced to the dispersion to prevent it.
Supplementary Materials
The following supporting information can be downloaded at: https://www.mdpi.com/article/10.3390/polym17050629/s1, Figure S1: PDW spectroscopy Iraw data measurements at λ = 638 nm of a synthesis with 100 L reaction volume from tR = 00:02 h to tR = 00:38 h. Initial measurements up to at least tR = 00:22 h show irregularities in the order of Iraw and df. This might be caused by an inhomogeneous dispersion due to insufficient mixing; Figure S2: Inline monitoring of 10 L synthesis by PDW spectroscopy at λ = 638 nm with reduced scattering coefficient µs’ (red) and absorption coefficient µa (blue). Offline determined total conversion Χ (green) and total volume fraction ϕ (green dotted line) are shown along the reaction progress. Vertical lines indicate manual increases of the stirrer speed; Table S1: Overview of the measurements of the experimental set-up of all three reactor sizes at different polymerization reaction volumes VR.with H as height of the reactor, D as diameter of the reactor, d as diameter of the used anchor stirrer, H1 as height of initial Charge before starting the reaction and h as height from the bottom of the reactor to the anchor stirrer; Table S2: Initial stirring rates for the different reaction volumes VR.
Author Contributions
Conceptualization, W.P., S.S., M.M. and O.R.; methodology, S.S. and M.M.; software, M.M.; validation, S.S.; formal analysis, S.S.; data curation, S.S., M.M. and O.R.; writing—original draft preparation, S.S.; writing—review and editing, S.S., O.R. and M.M.; visualization, S.S.; supervision, M.M. and O.R.; project administration, W.P.; funding acquisition, M.M. and W.P. All authors have read and agreed to the published version of the manuscript.
Funding
This study was financed by the financial support of the German Federal Ministry of Education and Research (grants 03Z22AN12 and 03Z22AB1B) and the University of Potsdam. It was funded by the Deutsche Forschungsgemeinschaft (DFG, German Research Foundation)—Project-number 491466077. We further acknowledge financial support from the Open Access Publication Fund of the University of Hamburg.
Institutional Review Board Statement
Not applicable.
Data Availability Statement
The original contributions presented in the study are included in the article/supplementary material, further inquiries can be directed to the corresponding author.
Acknowledgments
The authors would like to acknowledge the cooperation between the University of Potsdam and University of Hamburg, Roland Hass for establishing the cooperation and Laurence Jacob for conducting the experiments, beneficial discussions and an overall cordial joint work.
Conflicts of Interest
The authors declare no conflicts of interest.
References
- Brodhagen, A.; Grünewald, M.; Kleiner, M.; Lier, S. Erhöhung der Wirtschaftlichkeit durch beschleunigte Produkt- und Prozessentwicklung mit Hilfe modularer und skalierbarer Apparate. Chem. Ing. Tech. 2012, 84, 624–632. [Google Scholar] [CrossRef]
- Kammona, O.; Chatzi, E.G.; Kiparissides, C. Recent Developments in Hardware Sensors For the On-Line Monitoring of Polymerization Reactions. J. Macromol. Sci. Part C Polym. Rev. 1999, 39, 57–134. [Google Scholar] [CrossRef]
- Hamzehlou, S.; Asua, J.M. On-line monitoring and control of emulsion polymerization reactors. In Advances in Polymer Reaction Engineering; Elsevier: Cambridge, MA, USA, 2020; pp. 31–57. ISBN 9780128206454. [Google Scholar]
- Flory, P.J. The mechanism of vinyl polymerizations1. J. Am. Chem. Soc. 1937, 59, 241–253. [Google Scholar] [CrossRef]
- Mardare, D.; Matyjaszewski, K. “Living” radical polymerization of vinyl acetate. Macromolecules 1994, 27, 645–649. [Google Scholar] [CrossRef]
- Samide, A.; Tutunaru, B.; Merişanu, C.; Cioateră, N. Thermal analysis: An effective characterization method of polyvinyl acetate films applied in corrosion inhibition field. J. Therm. Anal. Calorim. 2020, 142, 1825–1834. [Google Scholar] [CrossRef]
- Berber, H.; Tamer, Y.; Yildirim, H. The effects of feeding ratio on final properties of vinyl acetate-based latexes via semi-continuous emulsion copolymerization. Colloid. Polym. Sci. 2018, 296, 211–221. [Google Scholar] [CrossRef]
- Horkay, F.; Burchard, W.; Hecht, A.M.; Geissler, E. Scattering properties of poly (vinyl acetate) gels in different solvents. Macromolecules 1993, 26, 4203–4207. [Google Scholar] [CrossRef]
- Abad, C.; De La Cal, J.C.; Asua, J.M. Emulsion copolymerization of vinyl esters in continuous reactors: Comparison between loop and continuous stirred tank reactors. J. Appl. Polym. Sci. 1995, 56, 419–424. [Google Scholar] [CrossRef]
- Fischer, D.; Sahre, K.; Abdelrhim, M.; Voit, B.; Sadhu, V.B.; Pionteck, J.; Komber, H.; Hutschenreuter, J. Process monitoring of polymers by in-line ATR-IR, NIR and Raman spectroscopy and ultrasonic measurements. C. R. Chim. 2006, 9, 1419–1424. [Google Scholar] [CrossRef]
- Haven, J.J.; Junkers, T. Online Monitoring of Polymerizations: Current Status. Eur. J. Org. Chem. 2017, 2017, 6474–6482. [Google Scholar] [CrossRef]
- Pasquale, A.J.; Long, T.E. Real-Time Monitoring of the Stable Free Radical Polymerization of Styrene via in-Situ Mid-Infrared Spectroscopy. Macromolecules 1999, 32, 7954–7957. [Google Scholar] [CrossRef]
- Araújo, P.H.H.; De La Cal, J.C.; Asua, J.M.; Pinto, J.C. Modeling Particle Size Distribution (PSD) in Emulsion Copolymerization Reactions in a Continuous Loop Reactor. Macromol. Theory Simul. 2001, 10, 769–779. [Google Scholar] [CrossRef]
- Monsalve-Bravo, G.M.; Moscoso-Vasquez, H.M.; Alvarez, H. Scaleup of Batch Reactors Using Phenomenological-Based Models. Ind. Eng. Chem. Res. 2014, 53, 9439–9453. [Google Scholar] [CrossRef]
- Fortuny, M.; Graillat, C.; McKenna, T.F.; Araújo, P.H.H.; Pinto, J.C. Modeling the nucleation stage during batch emulsion polymerization. AIChE J. 2005, 51, 2521–2533. [Google Scholar] [CrossRef]
- Kemmere, M.F.; Meuldijk, J.; Drinkenburg, A.A.H.; German, A.L. Colloidal stability of high-solids polystyrene and polyvinyl acetate latices. J. Appl. Polym. Sci. 1999, 74, 1780–1791. [Google Scholar] [CrossRef]
- Verwey, E.J.W. Theory of the stability of lyophobic colloids. J. Phys. Chem. 1947, 51, 631–636. [Google Scholar] [CrossRef]
- Melis, S.; Kemmere, M.; Meuldijk, J.; Storti, G.; Morbidelli, M. A model for the coagulation of polyvinyl acetate particles in emulsion. Chem. Eng. Sci. 2000, 55, 3101–3111. [Google Scholar] [CrossRef]
- Baade, W.; Moritz, H.U.; Reichert, K.H. Kinetics of high conversion polymerization of vinyl acetate. Effects of mixing and reactor type on polymer properties. J. Appl. Polym. Sci. 1982, 27, 2249–2267. [Google Scholar] [CrossRef]
- Schlappa, S.; Brenker, L.J.; Bressel, L.; Hass, R.; Münzberg, M. Process Characterization of Polyvinyl Acetate Emulsions Applying Inline Photon Density Wave Spectroscopy at High Solid Contents. Polymers 2021, 13, 669. [Google Scholar] [CrossRef]
- Aspiazu, U.O.; Gómez, S.; Paulis, M.; Leiza, J.R. Real-Time Monitoring of Particle Size in Emulsion Polymerization: Simultaneous Turbidity and Photon Density Wave Spectroscopy. Macromol. Rapid Commun. 2024, 45, e2400374. [Google Scholar] [CrossRef]
- Jacob, L.I.; Pauer, W. In-line monitoring of latex-particle size during emulsion polymerizations with a high polymer content of more than 60. RSC Adv. 2020, 10, 26528–26534. [Google Scholar] [CrossRef] [PubMed]
- Jacob, L.I.; Pauer, W. Scale-up of Emulsion Polymerisation up to 100 L and with a Polymer Content of up to 67 wt%, Monitored by Photon Density Wave Spectroscopy. Polymers 2022, 14, 1574. [Google Scholar] [CrossRef] [PubMed]
- Ishibe, T.; Kaneko, T.; Uematsu, Y.; Sato-Akaba, H.; Komura, M.; Iyoda, T.; Nakamura, Y. Tunable Thermal Switch via Order-Order Transition in Liquid Crystalline Block Copolymer. Nano Lett. 2022, 22, 6105–6111. [Google Scholar] [CrossRef] [PubMed]
- Song, H.; Cai, K.; Wang, J.; Shen, S. Influence of polymerization method on the thermoelectric properties of multi-walled carbon nanotubes/polypyrrole composites. Synth. Met. 2016, 211, 58–65. [Google Scholar] [CrossRef]
- Pohn, J.; Heniche, M.; Fradette, L.; Cunningham, M.; McKenna, T. Computational Analysis of Mixing and Scale-Up in Emulsion Polymerization Reactors. Macromol. Symp. 2011, 302, 133–141. [Google Scholar] [CrossRef]
- Gustin, J.-L.; Laganier, F. Understanding Vinyl Acetate Polymerization Accidents. Org. Process Res. Dev. 2005, 9, 962–975. [Google Scholar] [CrossRef]
- Azpeitia, M.; Leiza, J.R.; Asua, J.M. Safety in Emulsion Polymerization Reactors: An Experimental Study. Macromol. Mater. Eng. 2005, 290, 242–249. [Google Scholar] [CrossRef]
- Meyer, T. Scale-Up of Polymerization Process: A Practical Example. Org. Process Res. Dev. 2003, 7, 297–302. [Google Scholar] [CrossRef]
- Wang, Y.-W.; Mei, Y. Thermal runaway evaluation on batch polyvinyl acetate emulsion polymerization from calorimetric measurement. J. Therm. Anal. Calorim. 2023, 148, 4801–4810. [Google Scholar] [CrossRef]
- Chern, C.S.; Kuo, Y.N. Shear-induced coagulation kinetics of semibatch seeded emulsion polymerization. Chem. Eng. Sci. 1996, 51, 1079–1087. [Google Scholar] [CrossRef]
- Copelli, S.; Derudi, M.; Sempere, J.; Serra, E.; Lunghi, A.; Pasturenzi, C.; Rota, R. Emulsion polymerization of vinyl acetate: Safe optimization of a hazardous complex process. J. Hazard. Mater. 2011, 192, 8–17. [Google Scholar] [CrossRef]
- Elgebrandt, R.C.; Romagnoli, J.A.; Fletcher, D.F.; Gomes, V.G.; Gilbert, R.G. Analysis of shear-induced coagulation in an emulsion polymerisation reactor using computational fluid dynamics. Chem. Eng. Sci. 2005, 60, 2005–2015. [Google Scholar] [CrossRef]
- Asua, J.M. On-line control of emulsion polymerization reactors: A perspective. Can. J. Chem. Eng. 2023, 101, 4907–4913. [Google Scholar] [CrossRef]
- Cheng, D.; Ariafar, S.; Sheibat-Othman, N.; Pohn, J.; McKenna, T.F.L. Particle Coagulation of Emulsion Polymers: A Review of Experimental and Modelling Studies. Polym. Rev. 2018, 58, 717–759. [Google Scholar] [CrossRef]
- Chern, C.S. Emulsion polymerization mechanisms and kinetics. Prog. Polym. Sci. 2006, 31, 443–486. [Google Scholar] [CrossRef]
- Aguirre, M.; Ballard, N.; Gonzalez, E.; Hamzehlou, S.; Sardon, H.; Calderon, M.; Paulis, M.; Tomovska, R.; Dupin, D.; Bean, R.H.; et al. Polymer Colloids: Current Challenges, Emerging Applications, and New Developments. Macromolecules 2023, 56, 2579–2607. [Google Scholar] [CrossRef]
- Abeykoon, C. Sensing technologies for process monitoring in polymer extrusion: A comprehensive review on past, present and future aspects. Meas. Sens. 2022, 22, 100381. [Google Scholar] [CrossRef]
- Chen, Y.; Jahanzad, F.; Sajjadi, S. Semicontinuous monomer-starved emulsion polymerization as a means to produce nanolatexes: Analysis of nucleation stage. Langmuir 2013, 29, 5650–5658. [Google Scholar] [CrossRef]
- Agirre, A.; Calvo, I.; Weitzel, H.-P.; Hergeth, W.-D.; Asua, J.M. Semicontinuous Emulsion Co-polymerization of Vinyl Acetate and VeoVa10. Ind. Eng. Chem. Res. 2014, 53, 9282–9295. [Google Scholar] [CrossRef]
- Agirre, A.; Weitzel, H.-P.; Hergeth, W.-D.; Asua, J.M. Process intensification of VAc–VeoVa10 latex production. Chem. Eng. J. 2015, 266, 34–47. [Google Scholar] [CrossRef]
- Chai, X.-S.; Schork, F.J.; DeCinque, A.; Wilson, K. Measurement of the Solubilities of Vinylic Monomers in Water. Ind. Eng. Chem. Res. 2005, 44, 5256–5258. [Google Scholar] [CrossRef]
- Britton, D.; Heatley, F.; Lovell, P.A. Effect of Monomer Feed Rate on Chain Transfer to Polymer in Semibatch Emulsion Polymerization of Vinyl Acetate Studied by NMR Spectroscopy. Macromolecules 2000, 33, 5048–5052. [Google Scholar] [CrossRef]
- Bressel, L. Bedeutung der abhaengigen Streuung für die optischen Eigenschaften hochkonzentrierter Dispersionen. Ph.D. Thesis, University of Potsdam, Potsdam, Germany, 2016. [Google Scholar]
- Reich, O. Photonendichtewellenspektroskopie mit intensitätsmodulierten Diodenlasern (Photon Density Wave Spectroscopy with Intensity-Modulated Diode Lasers). Ph.D. Thesis, University of Potsdam, Potsdam, Germany, 2005. [Google Scholar]
- Schlappa, S.; Bressel, L.; Reich, O.; Münzberg, M. Advanced Particle Size Analysis in High-Solid-Content Polymer Dispersions Using Photon Density Wave Spectroscopy. Polymers 2023, 15, 3181. [Google Scholar] [CrossRef] [PubMed]
- Hass, R.; Reich, O. Photon density wave spectroscopy for dilution-free sizing of highly concentrated nanoparticles during starved-feed polymerization. Chemphyschem 2011, 12, 2572–2575. [Google Scholar] [CrossRef]
- Bressel, K.; Müller, W.; Leser, M.E.; Reich, O.; Hass, R.; Wooster, T.J. Depletion-Induced Flocculation of Concentrated Emulsions Probed by Photon Density Wave Spectroscopy. Langmuir 2020, 36, 3504–3513. [Google Scholar] [CrossRef]
- Hass, R.; Münzberg, M.; Bressel, L.; Reich, O. Industrial applications of photon density wave spectroscopy for in-line particle sizing Invited. Appl. Opt. 2013, 52, 1423–1431. [Google Scholar] [CrossRef]
- Zimmermann, S.; Reich, O.; Bressel, L. Exploitation of inline photon density wave spectroscopy for titania particle syntheses. J. Am. Ceram. Soc. 2023, 106, 671–680. [Google Scholar] [CrossRef]
- Aspiazu, U.O.; Paulis, M.; Leiza, J.R. Photon Density Wave spectroscopy to monitor the particle size in seeded semibatch emulsion copolymerization reactions. Chem. Eng. J. 2024, 483, 149292. [Google Scholar] [CrossRef]
- Bressel, L.; Hass, R.; Reich, O. Particle sizing in highly turbid dispersions by Photon Density Wave spectroscopy. J. Quant. Spectrosc. Radiat. Transf. 2013, 126, 122–129. [Google Scholar] [CrossRef]
- Johnston, L.J.; Schepp, N.P. Reactivities of radical cations: Characterization of styrene radical cations and measurements of their reactivity toward nucleophiles. J. Am. Chem. Soc. 1993, 115, 6564–6571. [Google Scholar] [CrossRef]
Disclaimer/Publisher’s Note: The statements, opinions and data contained in all publications are solely those of the individual author(s) and contributor(s) and not of MDPI and/or the editor(s). MDPI and/or the editor(s) disclaim responsibility for any injury to people or property resulting from any ideas, methods, instructions or products referred to in the content. |
© 2025 by the authors. Licensee MDPI, Basel, Switzerland. This article is an open access article distributed under the terms and conditions of the Creative Commons Attribution (CC BY) license (https://creativecommons.org/licenses/by/4.0/).