Author Contributions
Conceptualization, P.Z. and G.L.; methodology, P.Z.; software, P.Z. and M.S.; validation, P.Z., M.S. and S.D.; formal analysis, P.Z.; investigation, P.Z.; resources, G.L.; data curation, P.Z.; writing—original draft preparation, P.Z.; writing—review and editing, M.S. and S.D.; visualization, P.Z.; supervision, G.L.; project administration, P.Z.; funding acquisition, P.Z. and G.L. All authors have read and agreed to the published version of the manuscript.
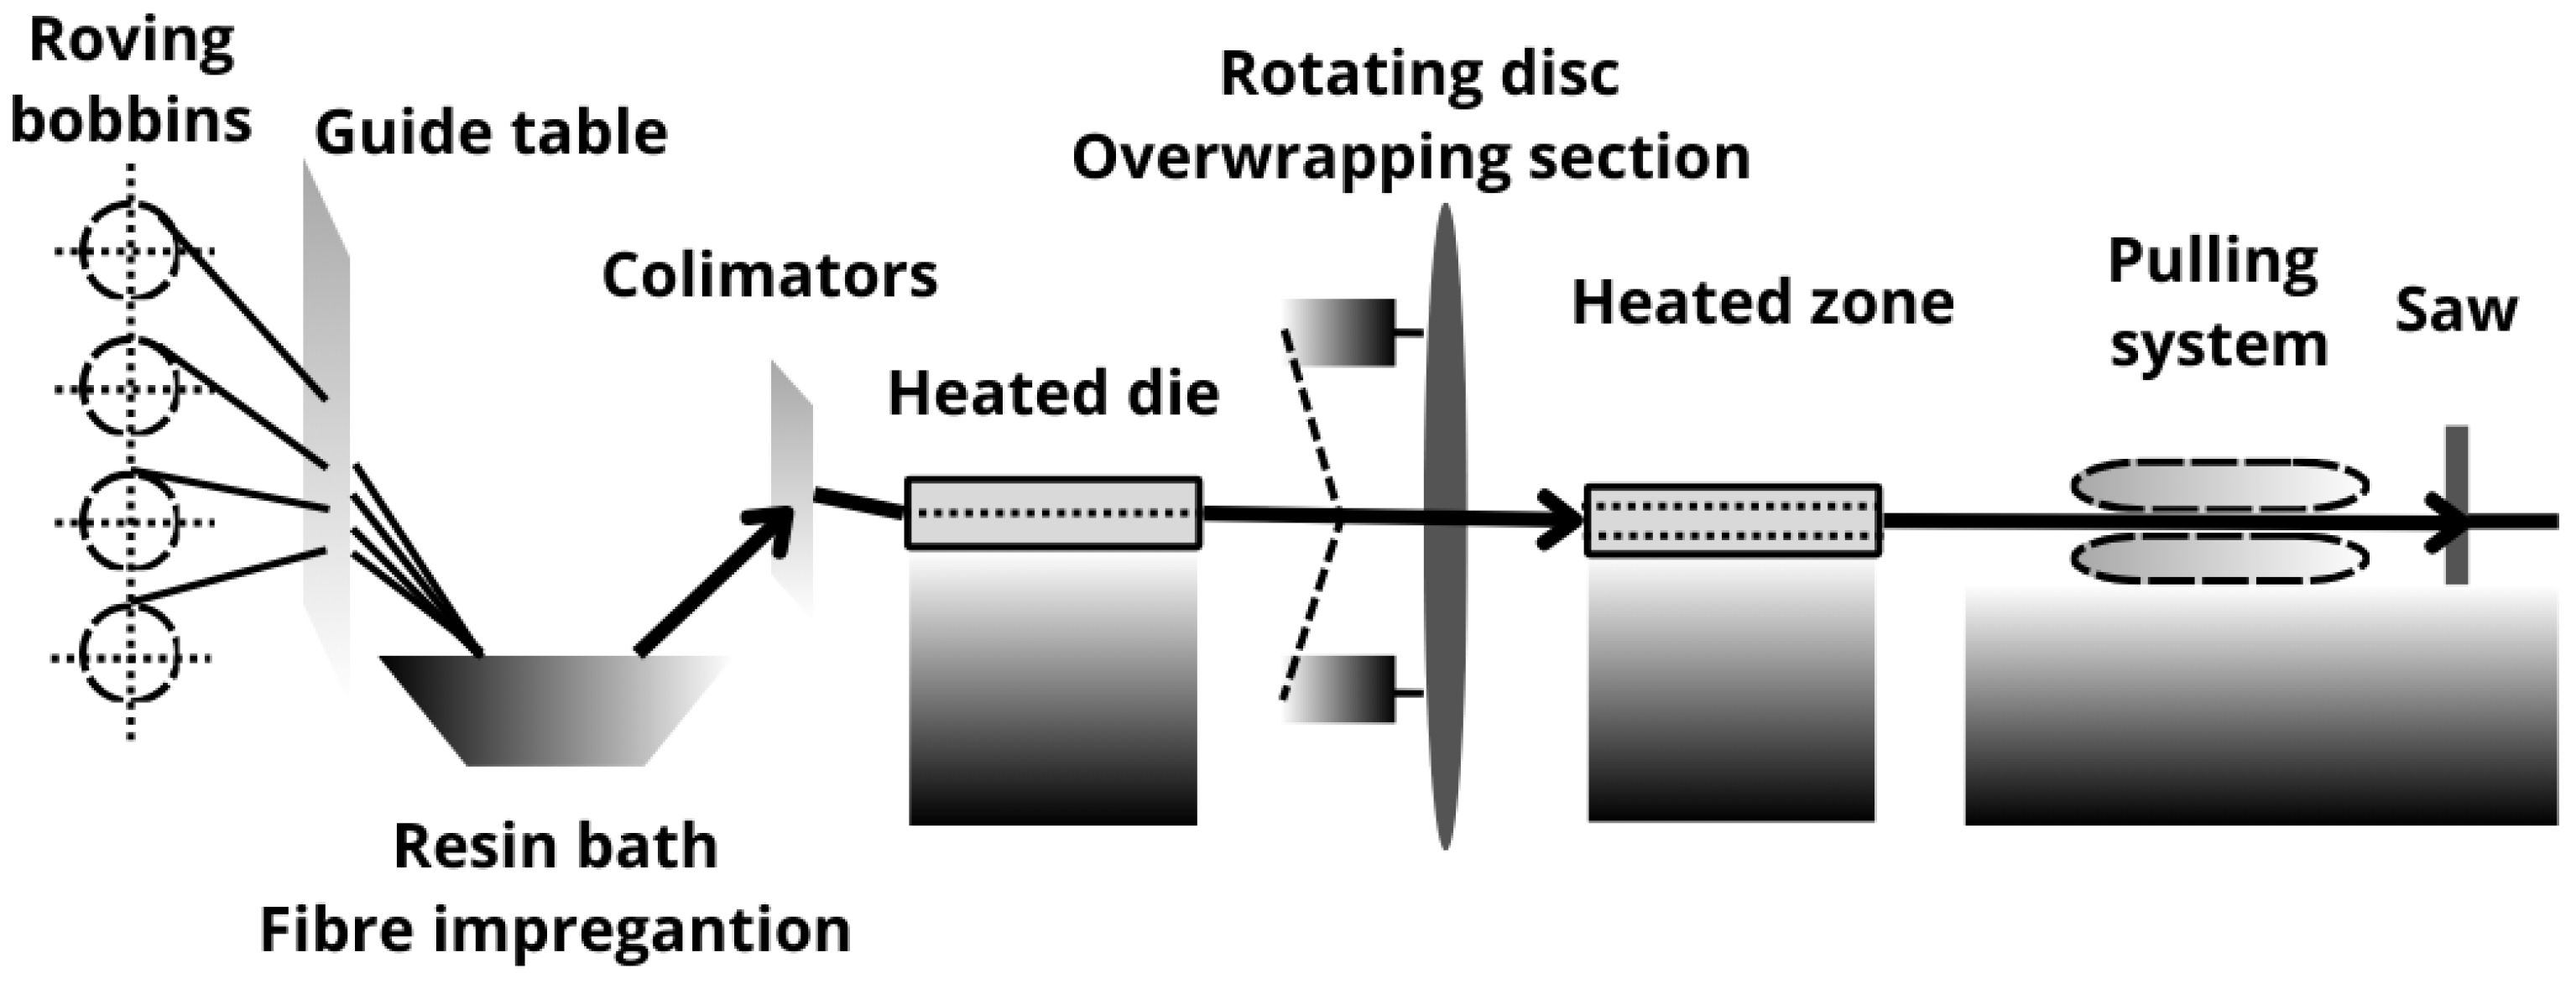
Figure 1.
Pultrusion process used for composite rebars manufacturing.
Figure 1.
Pultrusion process used for composite rebars manufacturing.
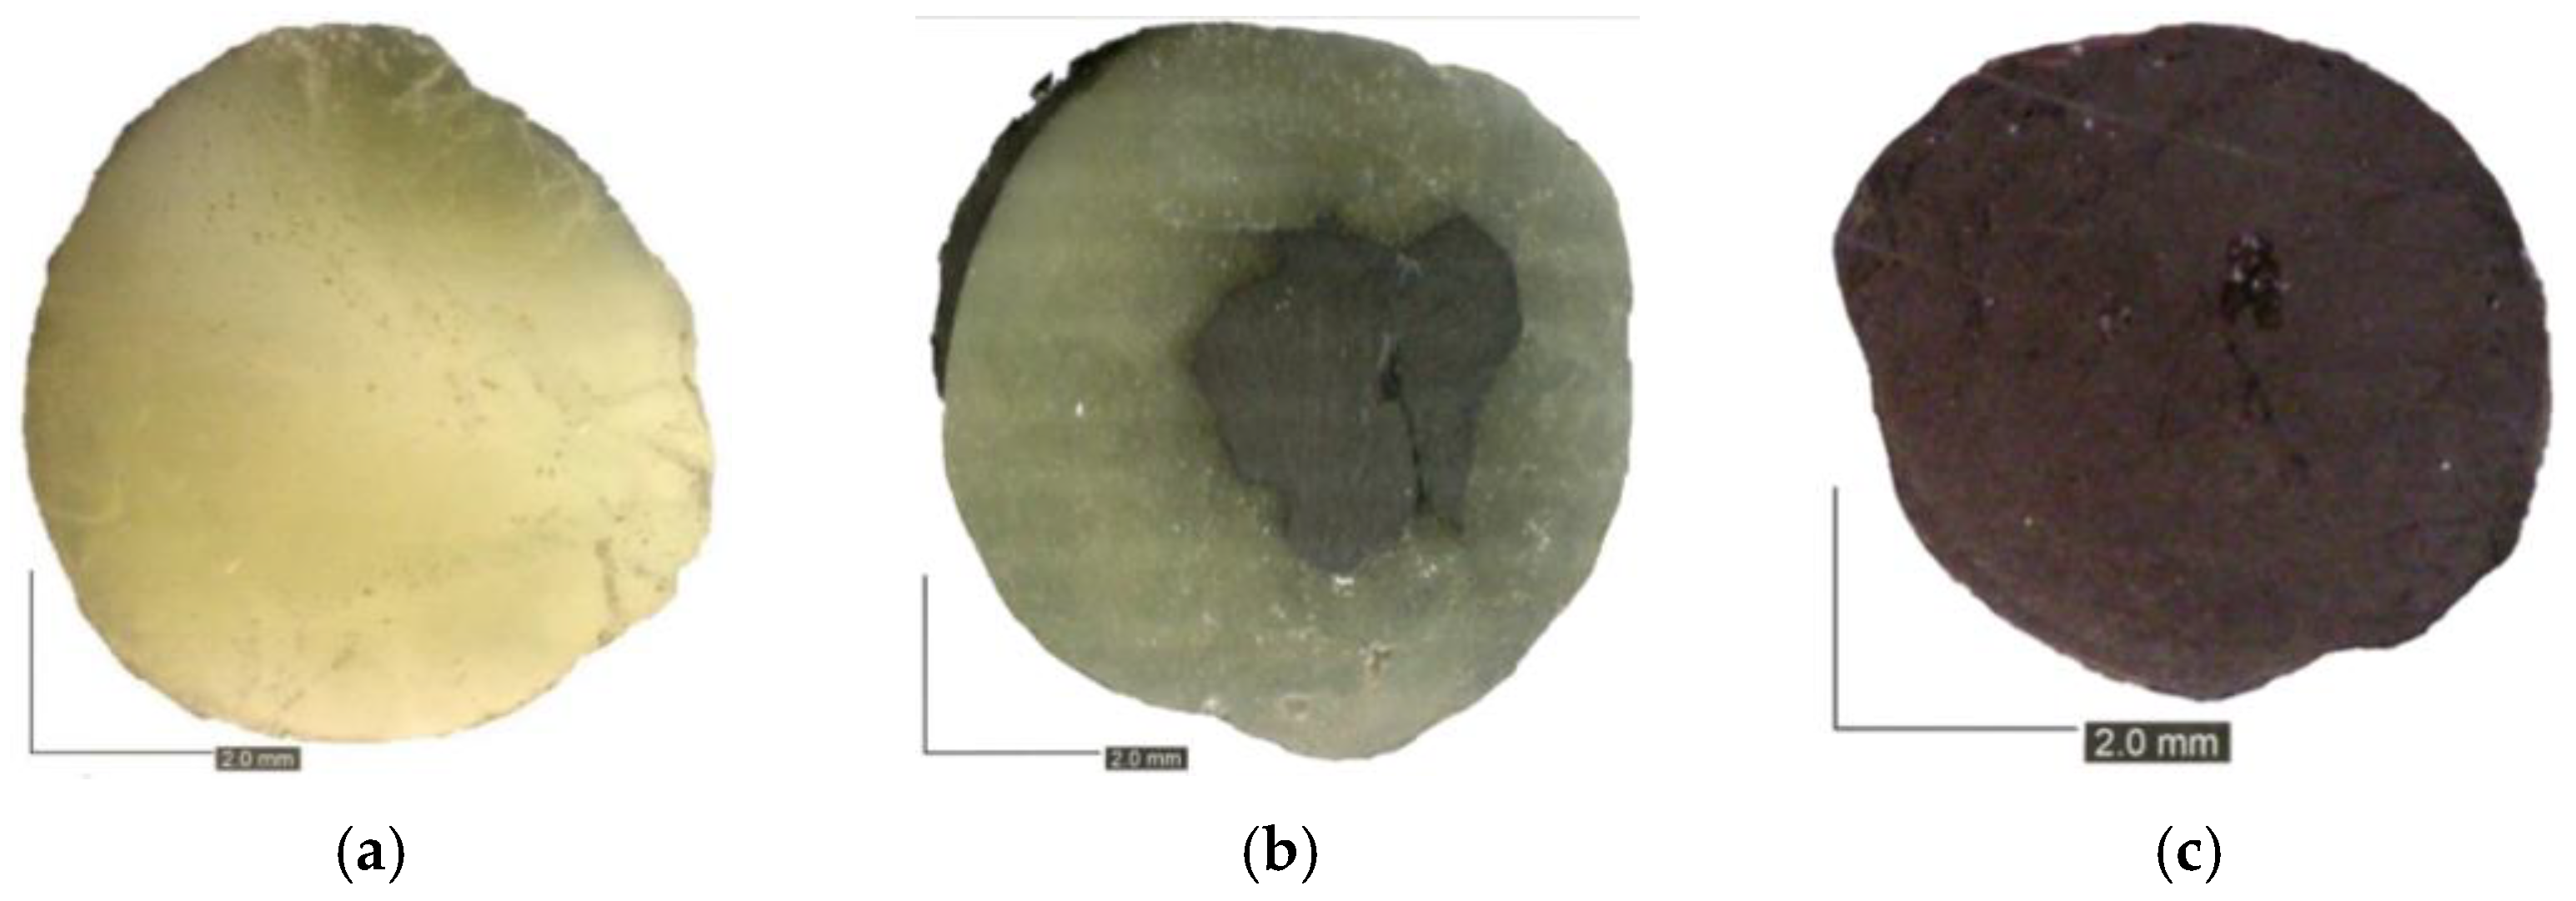
Figure 2.
Cross-section of composite rebars conducted under experimental campaign (a) Glass fiber rebar with nominal diameter 8 mm; (b) Hybrid fiber rebar with nominal diameter 8 mm; (c) Carbon fiber rebar with nominal diameter 6 mm.
Figure 2.
Cross-section of composite rebars conducted under experimental campaign (a) Glass fiber rebar with nominal diameter 8 mm; (b) Hybrid fiber rebar with nominal diameter 8 mm; (c) Carbon fiber rebar with nominal diameter 6 mm.
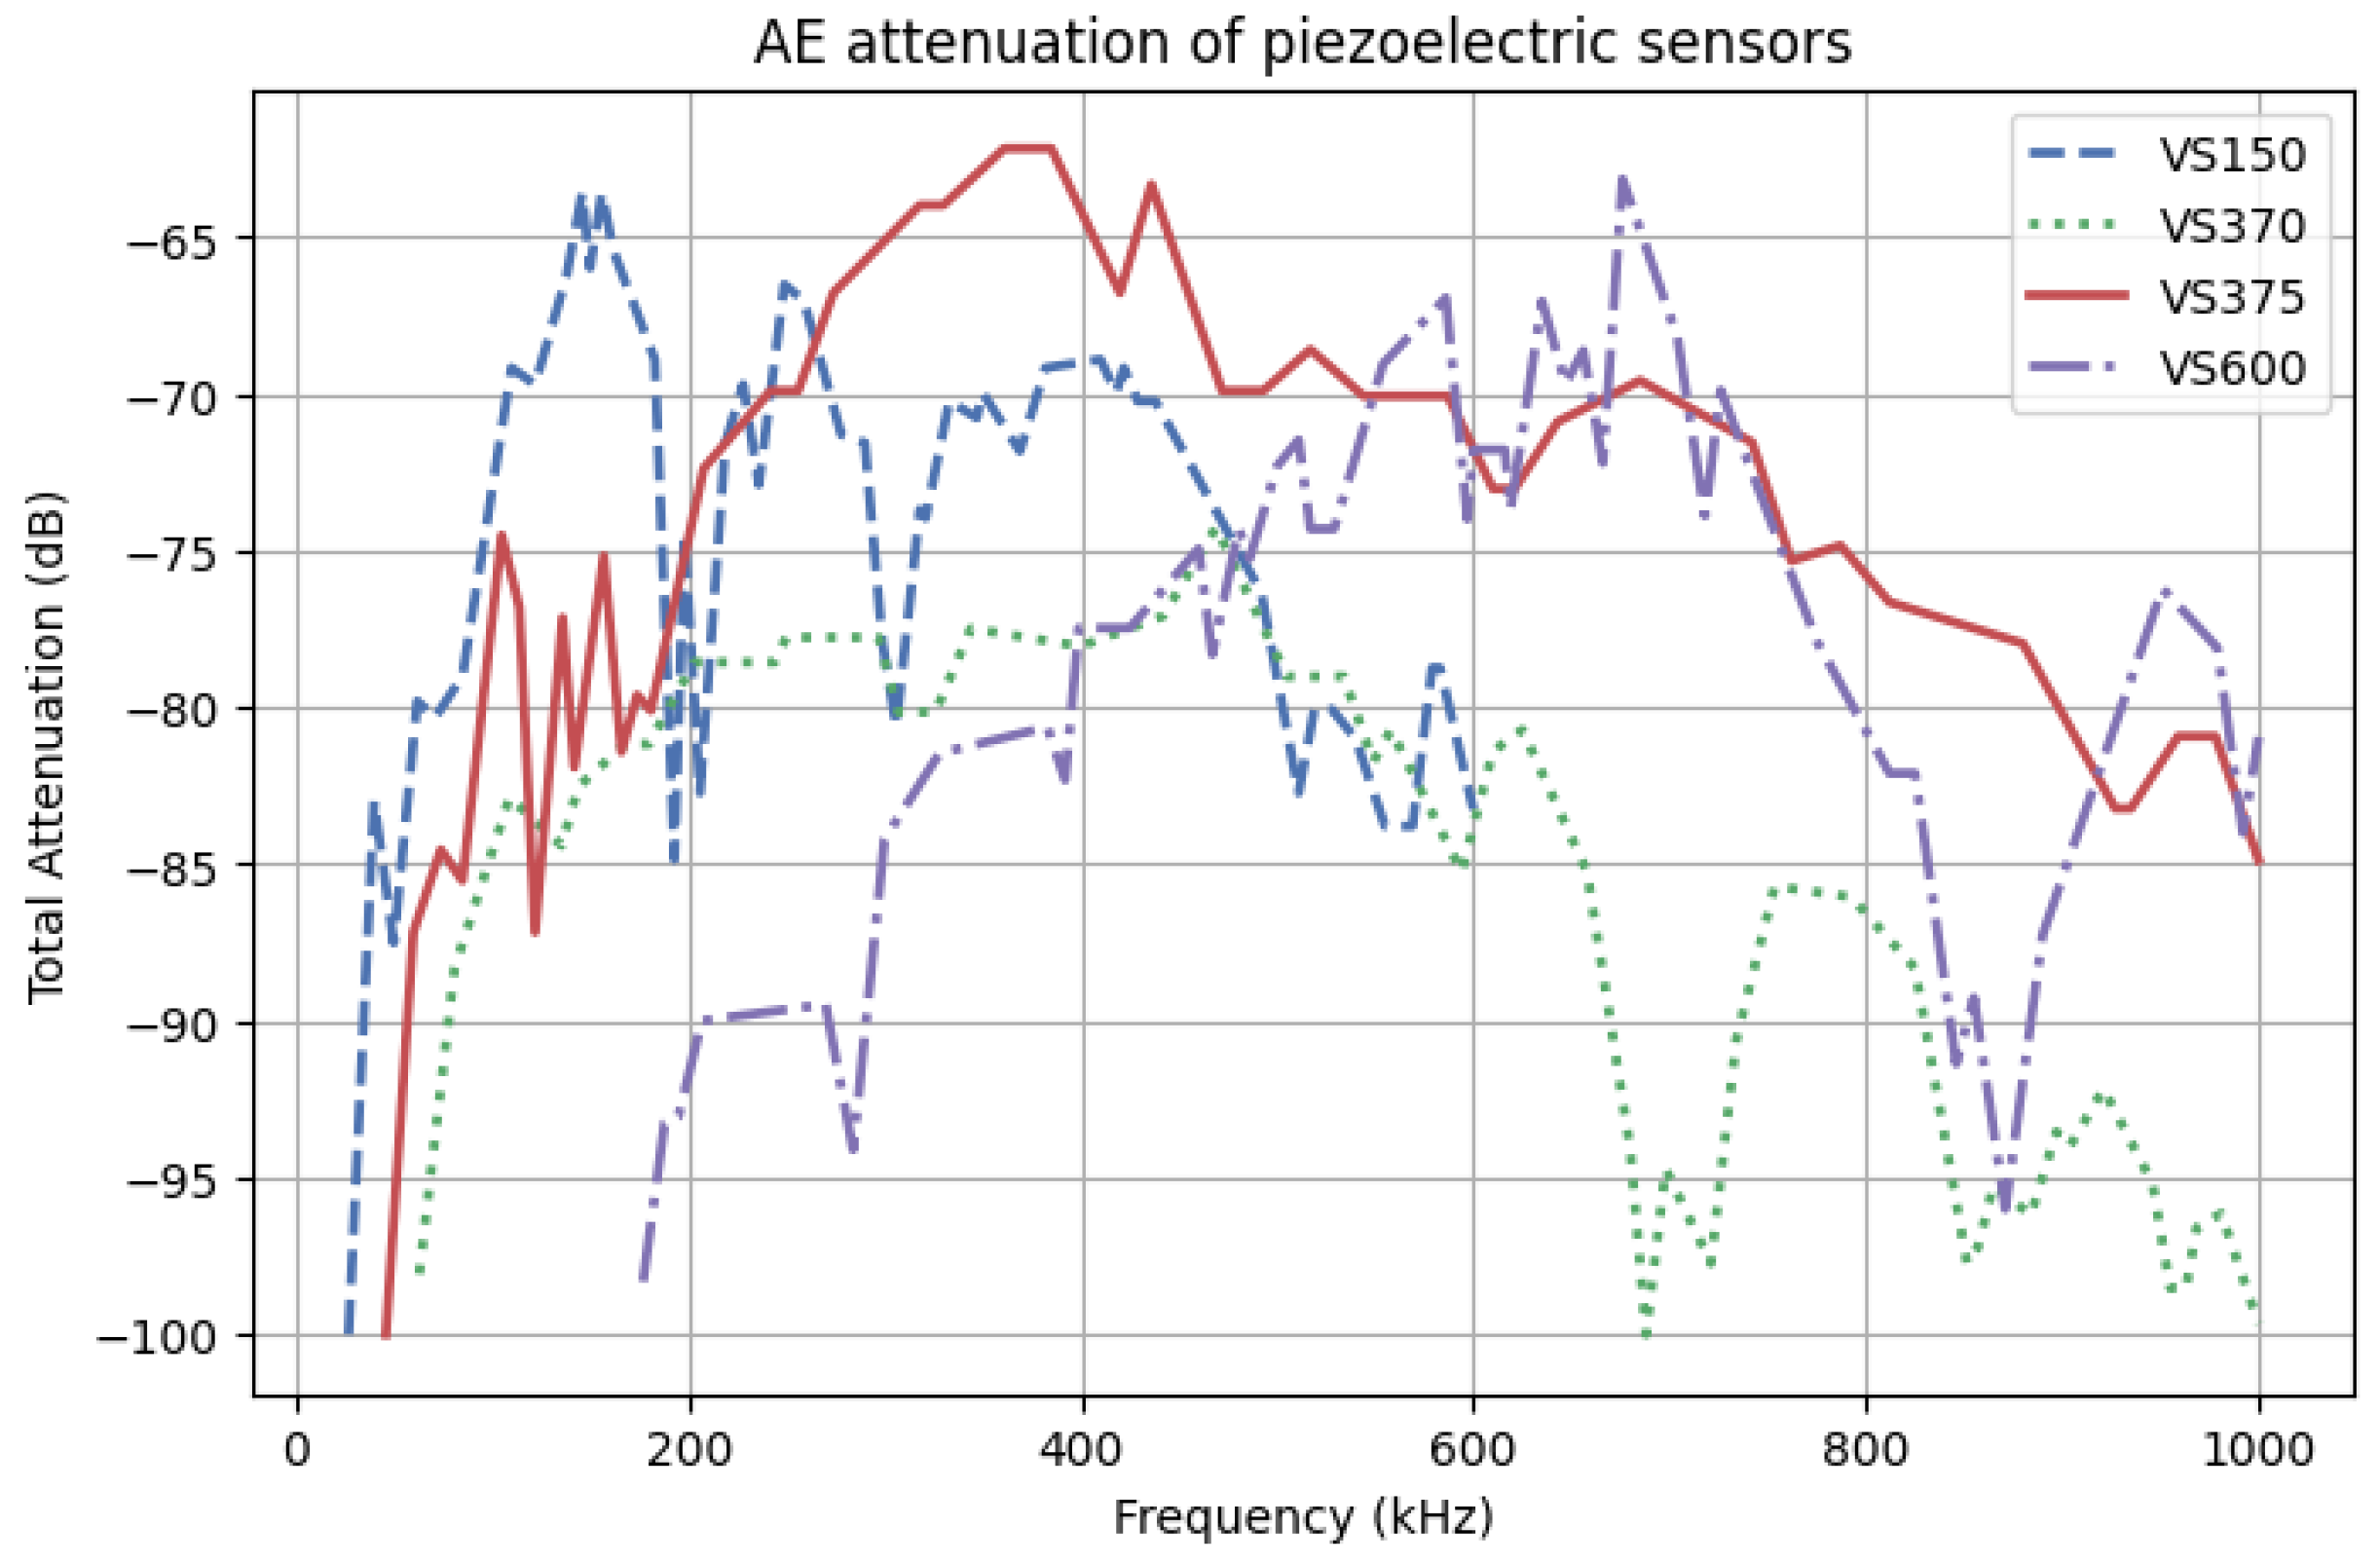
Figure 3.
Attenuation characteristics of piezoelectric sensors based on the certificates provided by the manufacturer.
Figure 3.
Attenuation characteristics of piezoelectric sensors based on the certificates provided by the manufacturer.
Figure 4.
Composite rebar specimen with mounted AE sensors prepared for static tensile loading.
Figure 4.
Composite rebar specimen with mounted AE sensors prepared for static tensile loading.
Figure 5.
Attenuation characterization of various types of fibrous reinforcement carried out with the pulsing procedure. The localization of sensors was highlighted in the figure—the first sensor with solid lines and various positions of the second sensors with dashed lines.
Figure 5.
Attenuation characterization of various types of fibrous reinforcement carried out with the pulsing procedure. The localization of sensors was highlighted in the figure—the first sensor with solid lines and various positions of the second sensors with dashed lines.
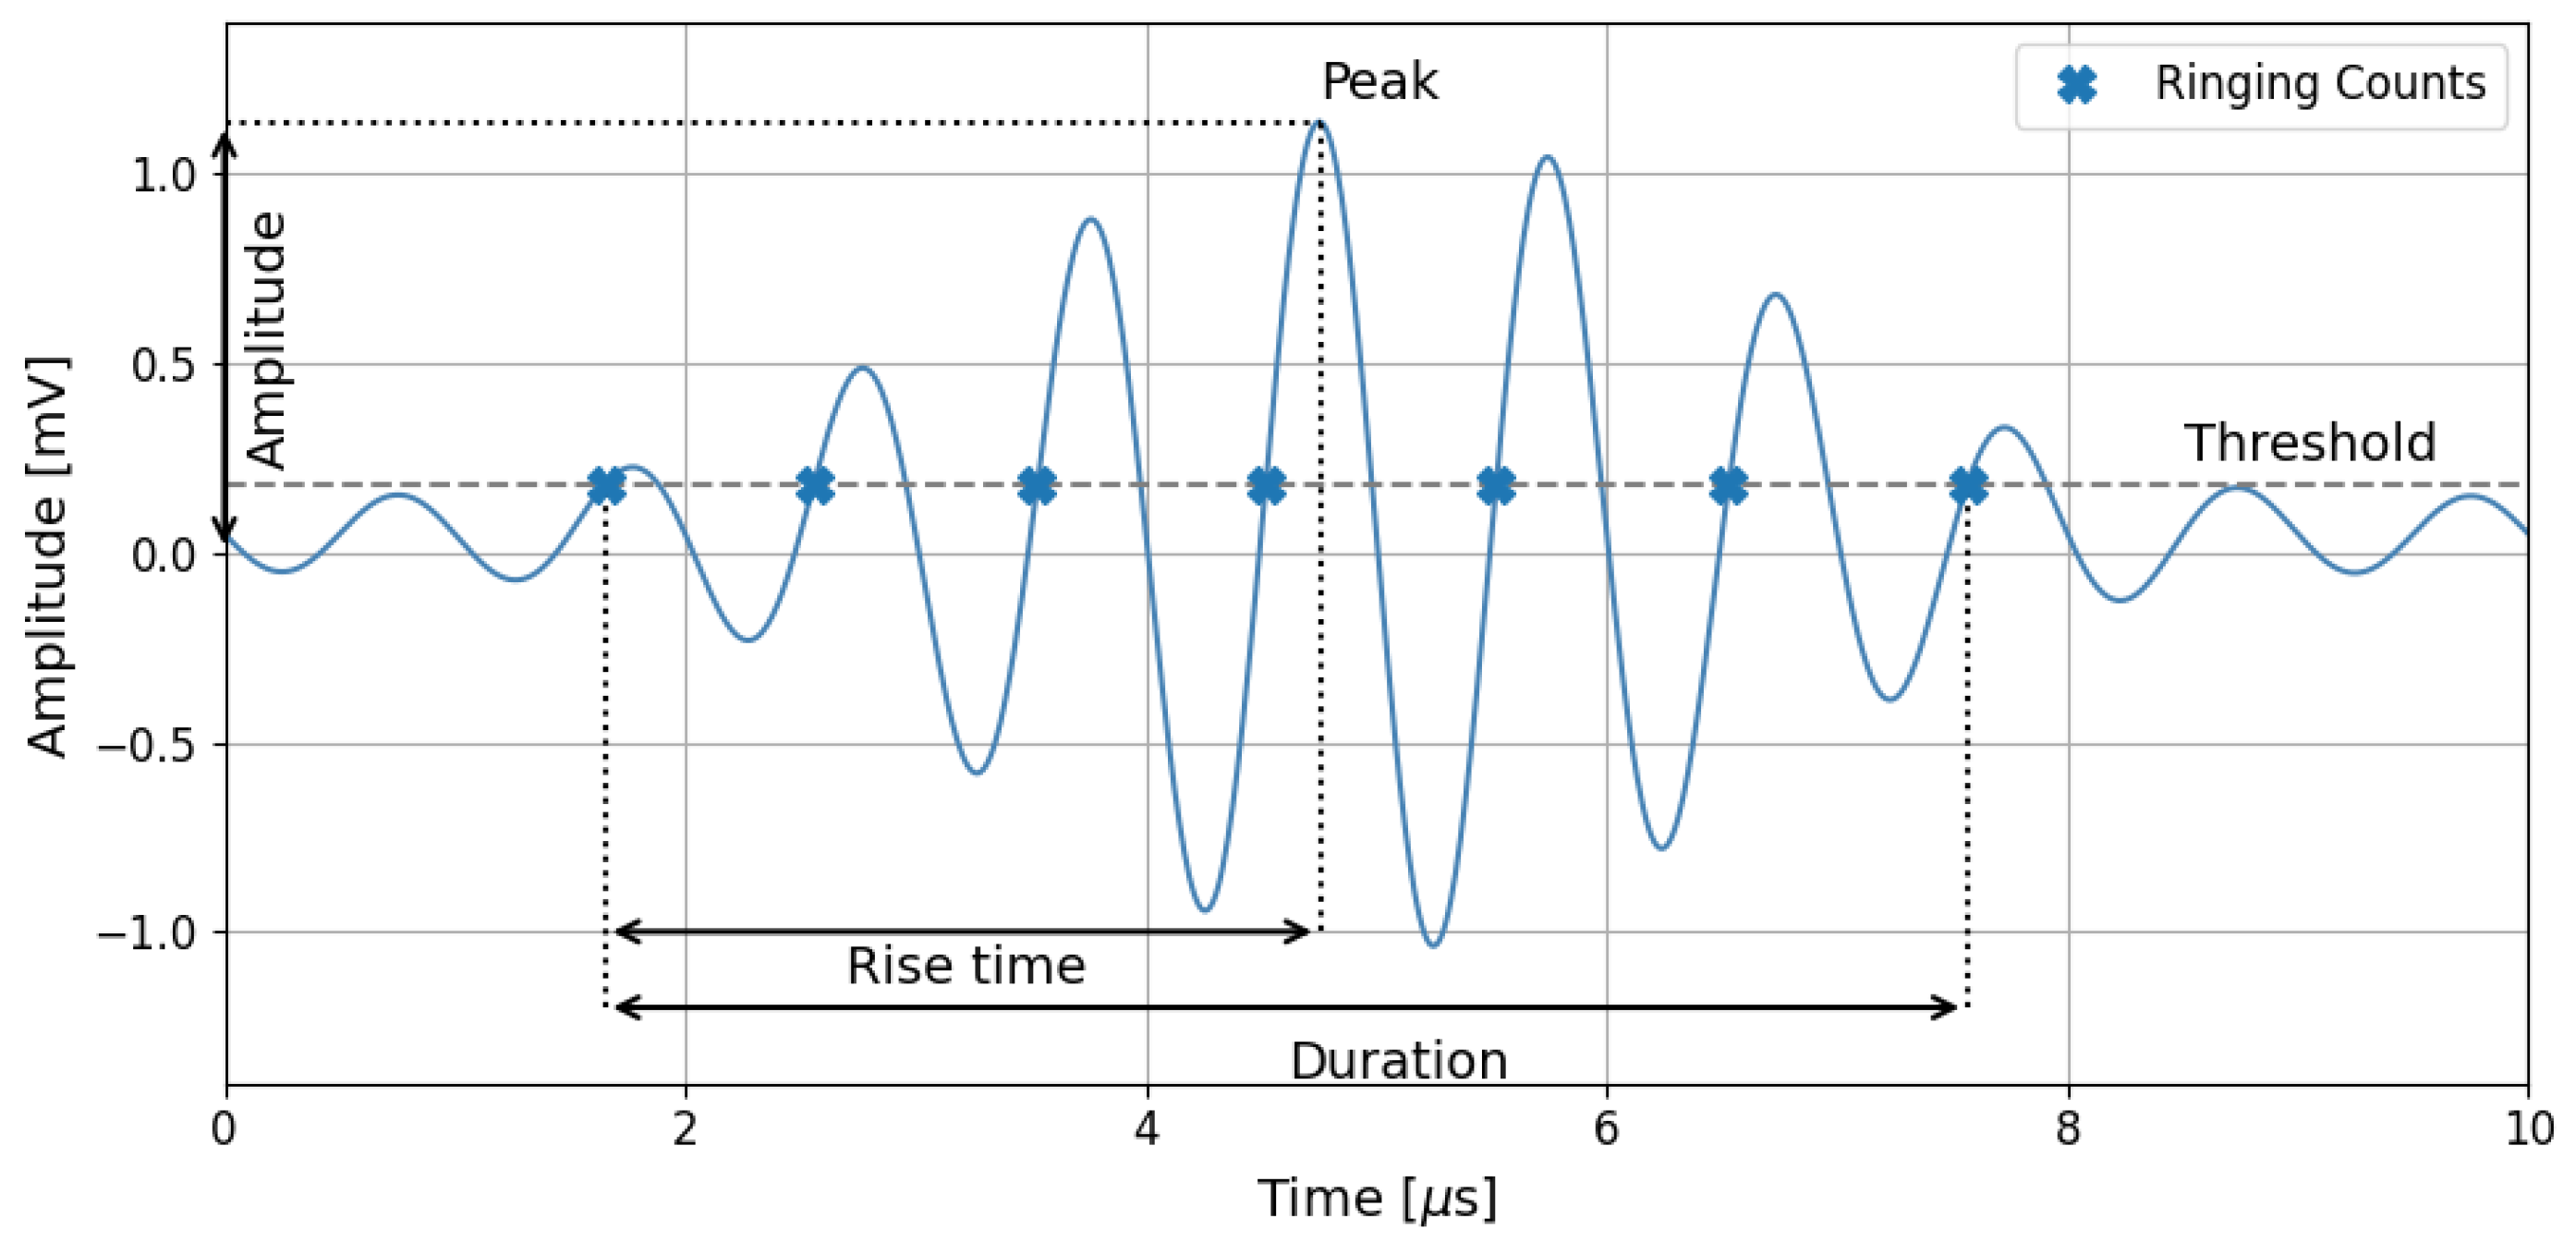
Figure 6.
Exemplary acoustic waveform with characteristic parameters.
Figure 6.
Exemplary acoustic waveform with characteristic parameters.
Figure 7.
Acoustic wave path from the damage location to the piezoelectric sensor. In the investigated case, the AE signal has to travel through different materials such as matrix, reinforcement, hot glue and sensor material.
Figure 7.
Acoustic wave path from the damage location to the piezoelectric sensor. In the investigated case, the AE signal has to travel through different materials such as matrix, reinforcement, hot glue and sensor material.
Figure 8.
Algorithm of the attenuation implementation in acoustic emission events.
Figure 8.
Algorithm of the attenuation implementation in acoustic emission events.
Figure 9.
Dependency of the registered amplitude on the distance between piezoelectric sensors during pulsing procedure for (a) glass fiber rebars, (b) hybrid rebars, (c) carbon fiber rebars.
Figure 9.
Dependency of the registered amplitude on the distance between piezoelectric sensors during pulsing procedure for (a) glass fiber rebars, (b) hybrid rebars, (c) carbon fiber rebars.
Figure 10.
Dependency of the registered energy on the distance between piezoelectric sensors during pulsing procedure for (a) glass fiber rebars, (b) hybrid rebars, (c) carbon fiber rebars.
Figure 10.
Dependency of the registered energy on the distance between piezoelectric sensors during pulsing procedure for (a) glass fiber rebars, (b) hybrid rebars, (c) carbon fiber rebars.
Figure 11.
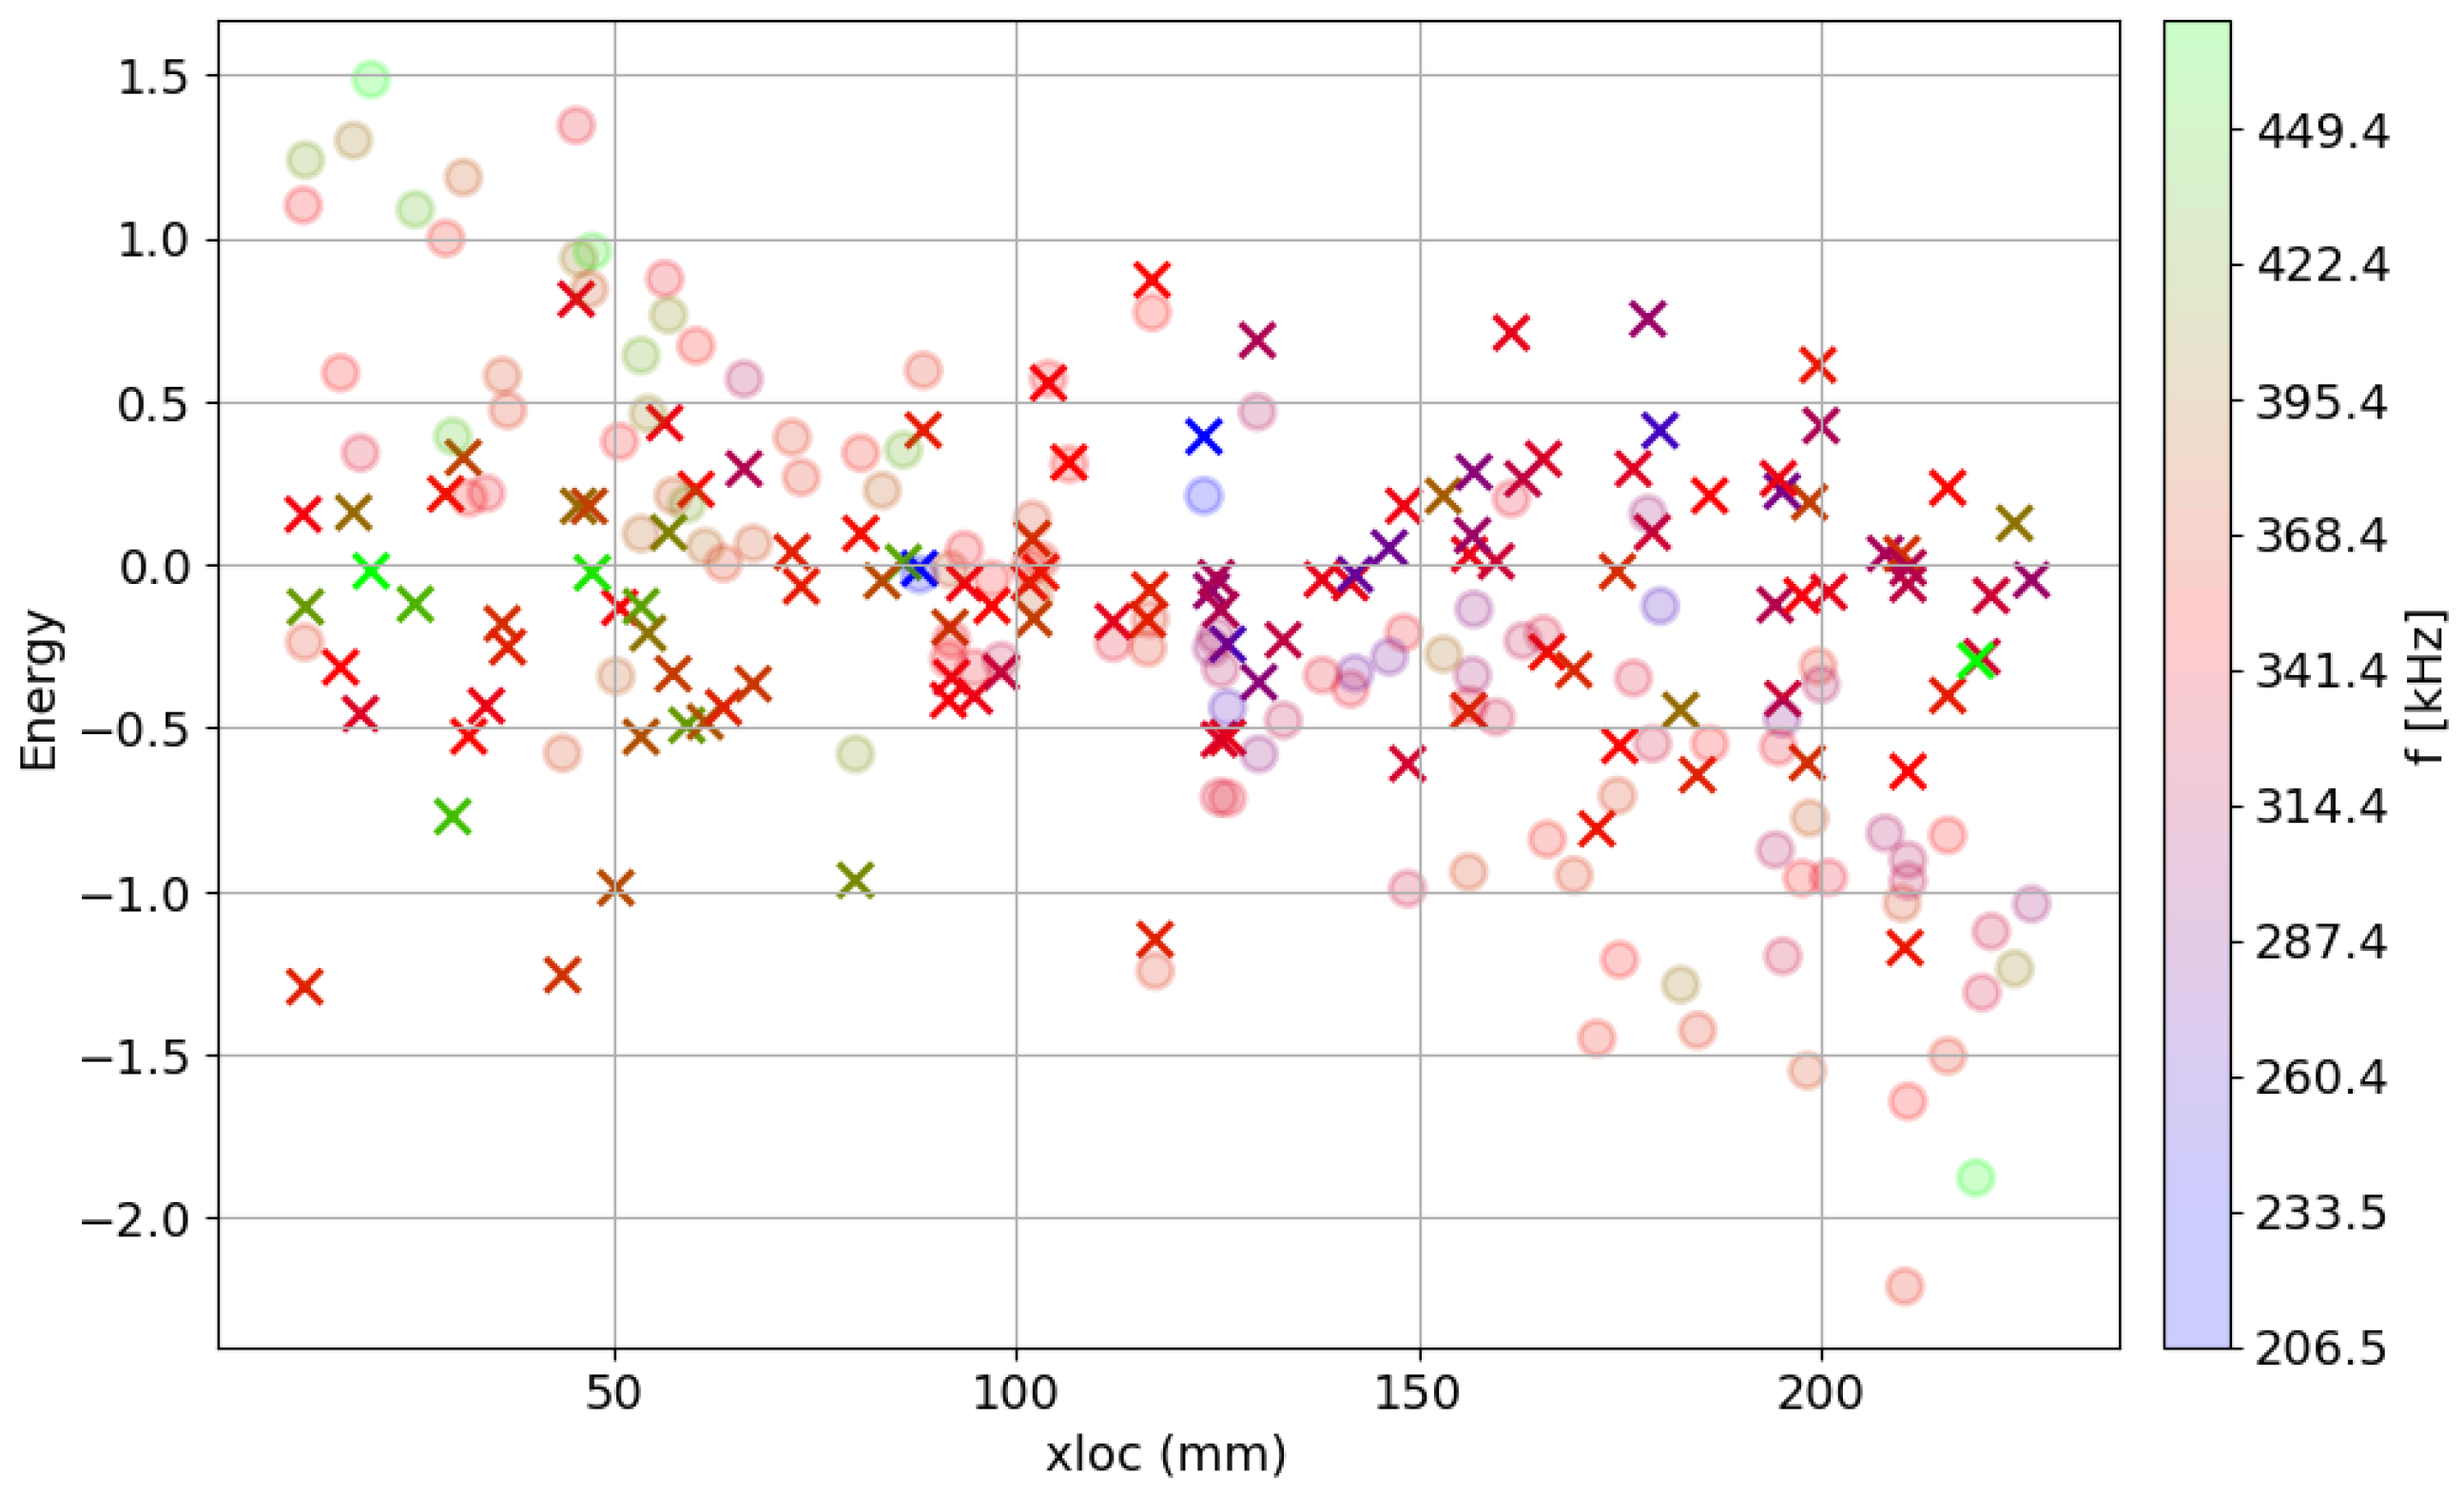
Correction of the training dataset over localization on the rebar. The frequency center of gravity for each event is highlighted. Transparent circles were used to mark the original data, while the crosses were applied for AE events after correction using obtained damping parameters.
Figure 11.
Correction of the training dataset over localization on the rebar. The frequency center of gravity for each event is highlighted. Transparent circles were used to mark the original data, while the crosses were applied for AE events after correction using obtained damping parameters.
Figure 12.
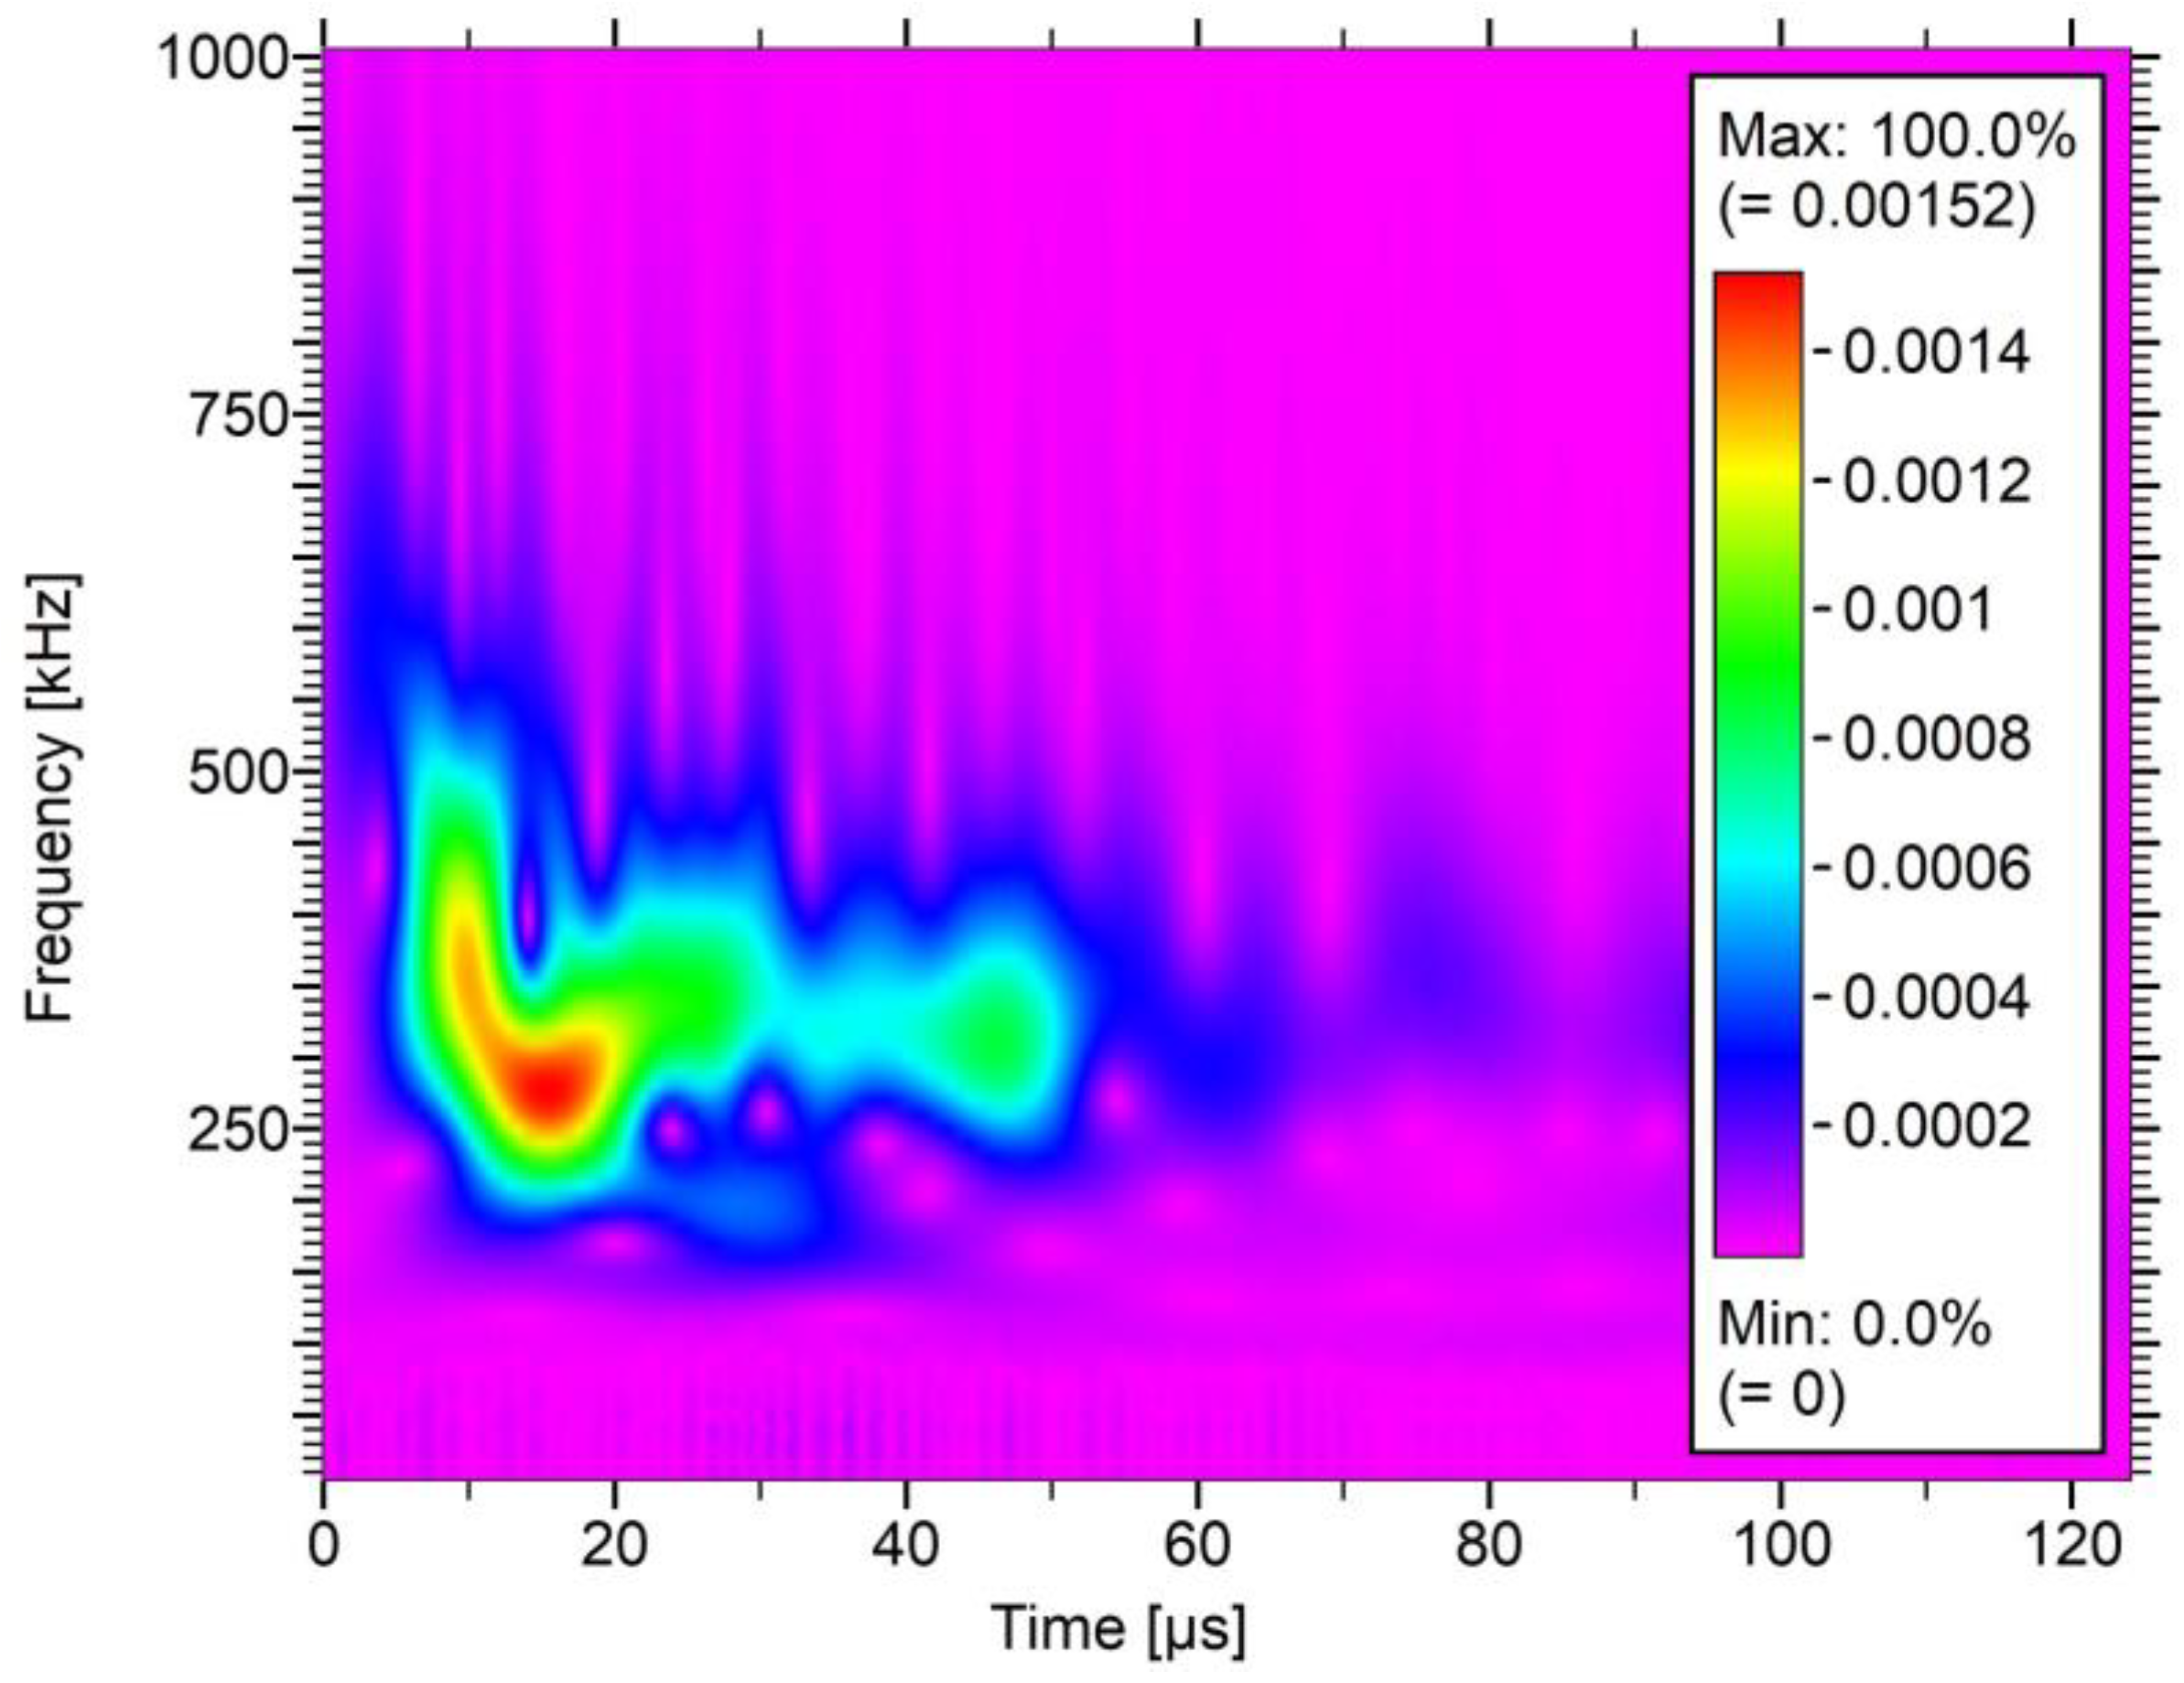
Frequency distribution of the AE signal over the time domain.
Figure 12.
Frequency distribution of the AE signal over the time domain.
Figure 13.
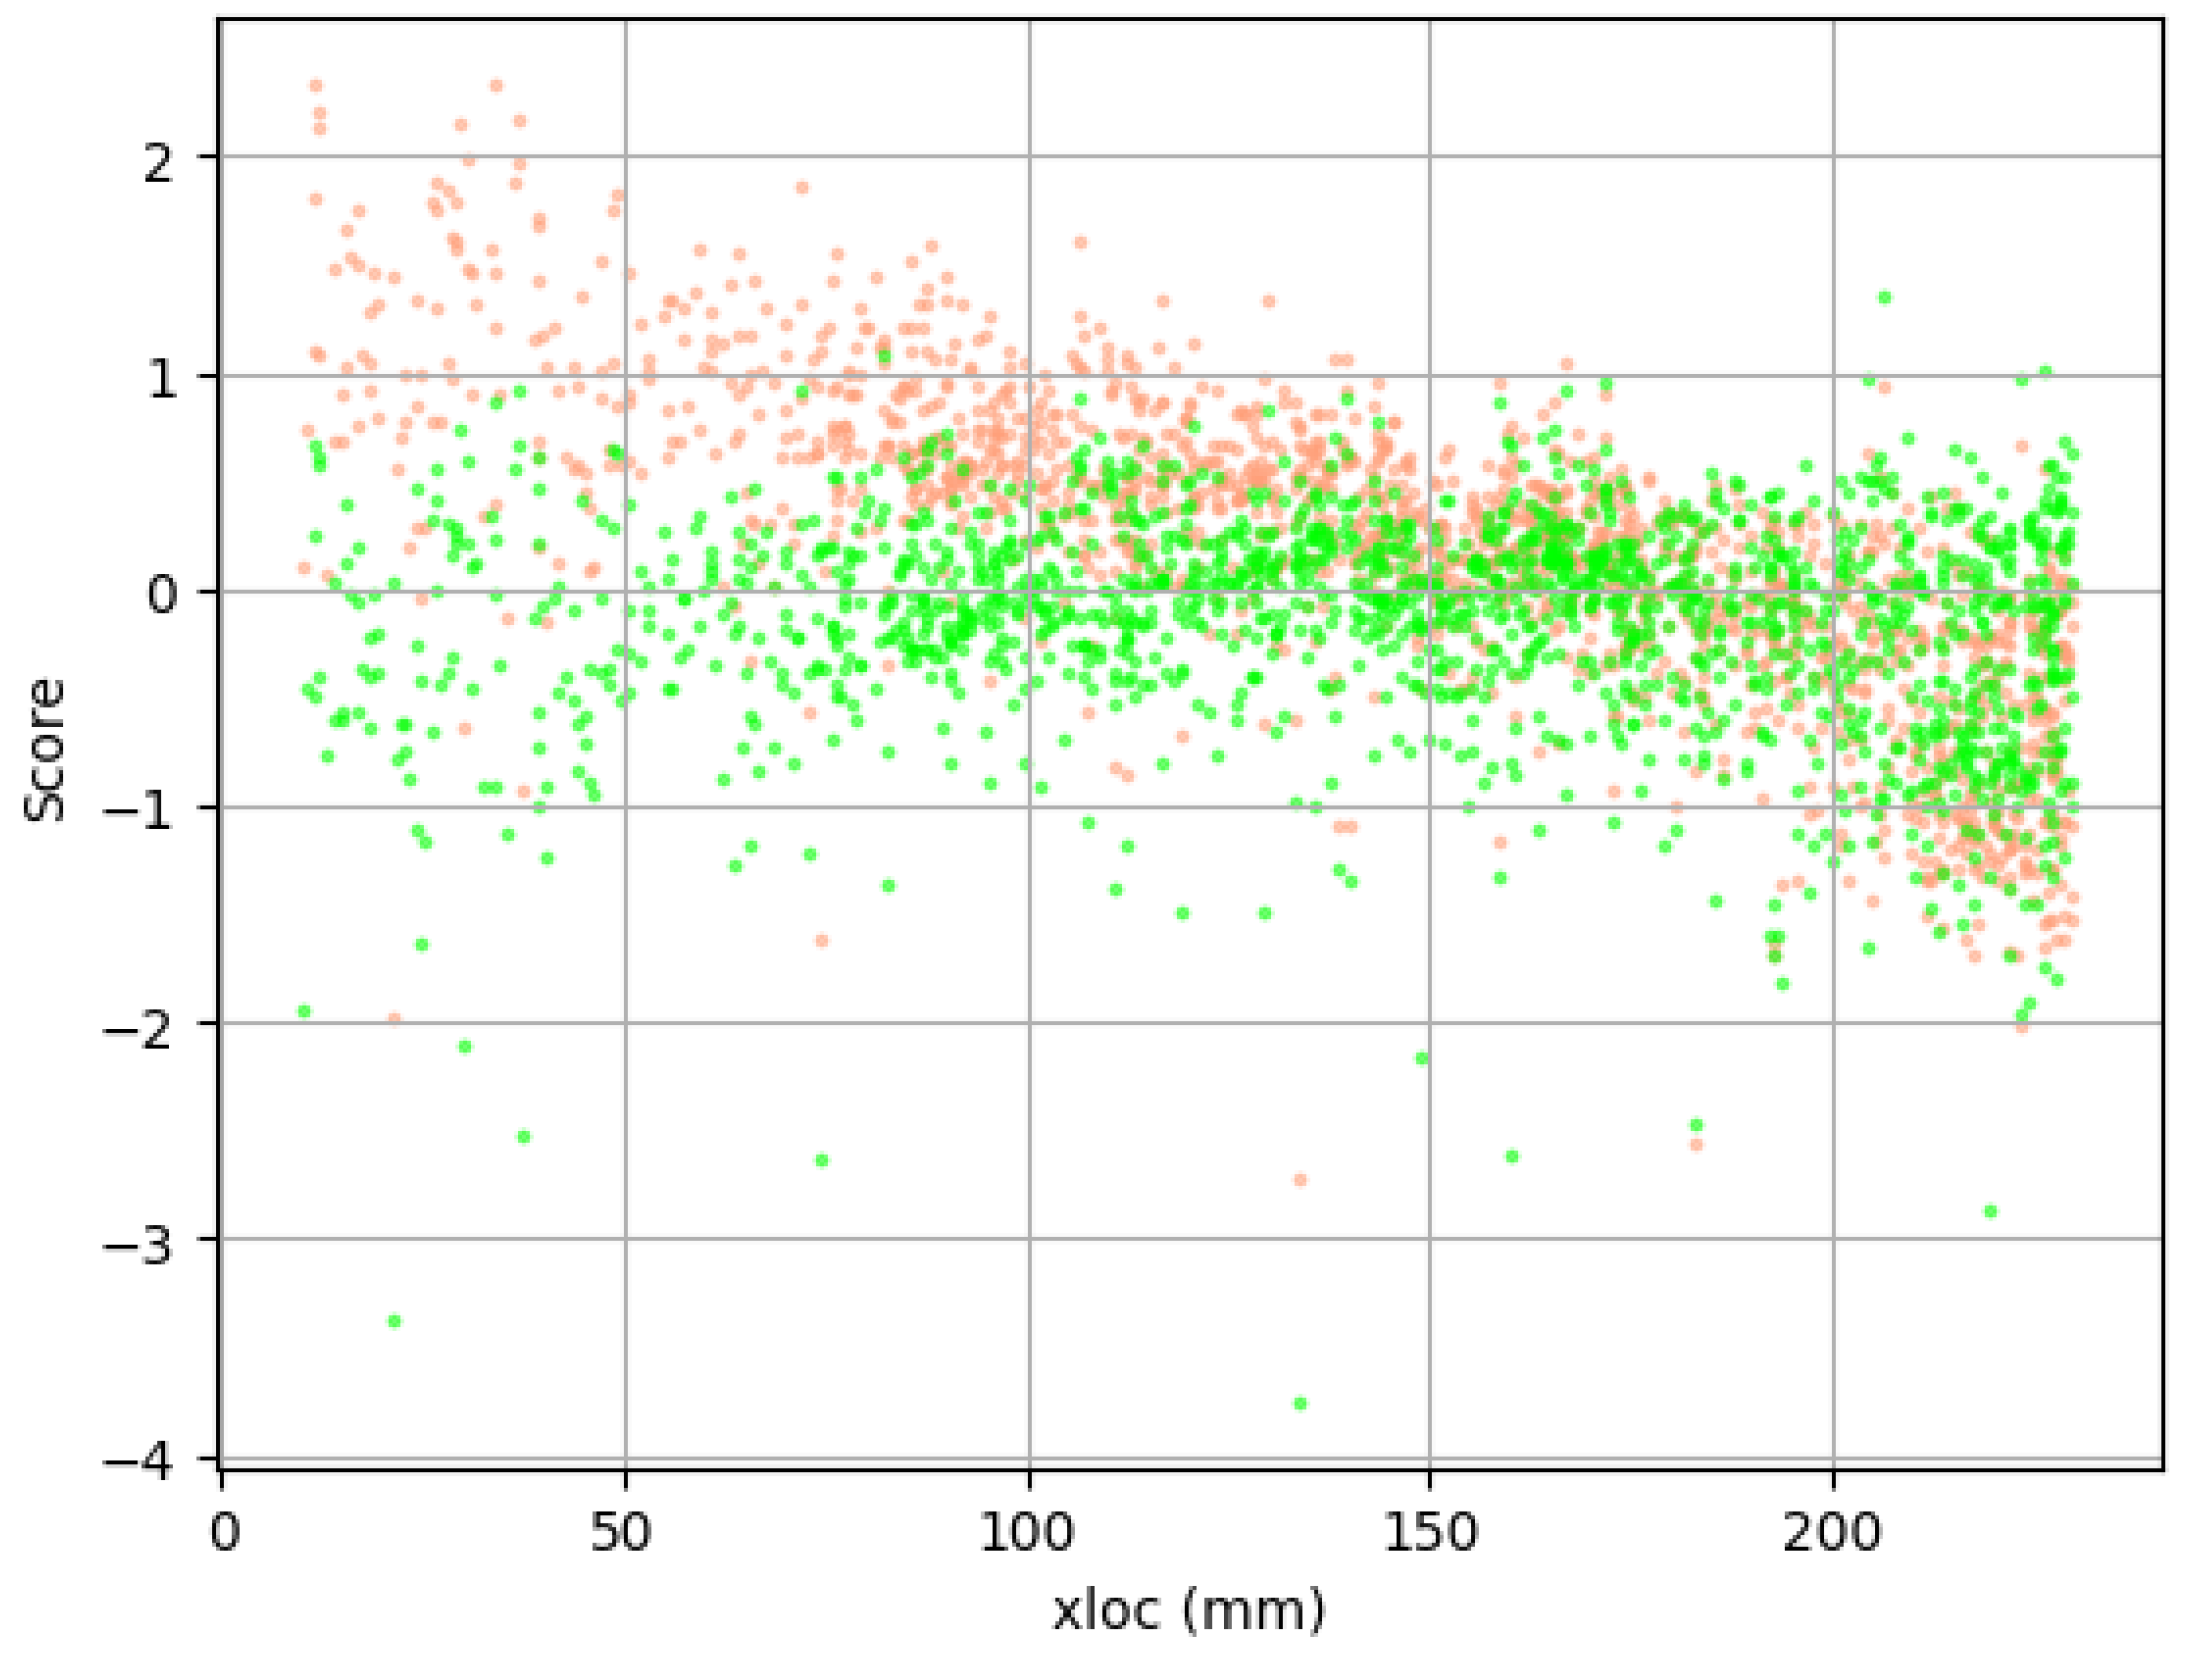
Correction of the whole dataset based on values designated using the training set. The ratio of the data obtained from both sensors on a logarithmic scale was presented over localization on the rebar. The green markers were used for attenuated results, the orange ones for the recorded data.
Figure 14.
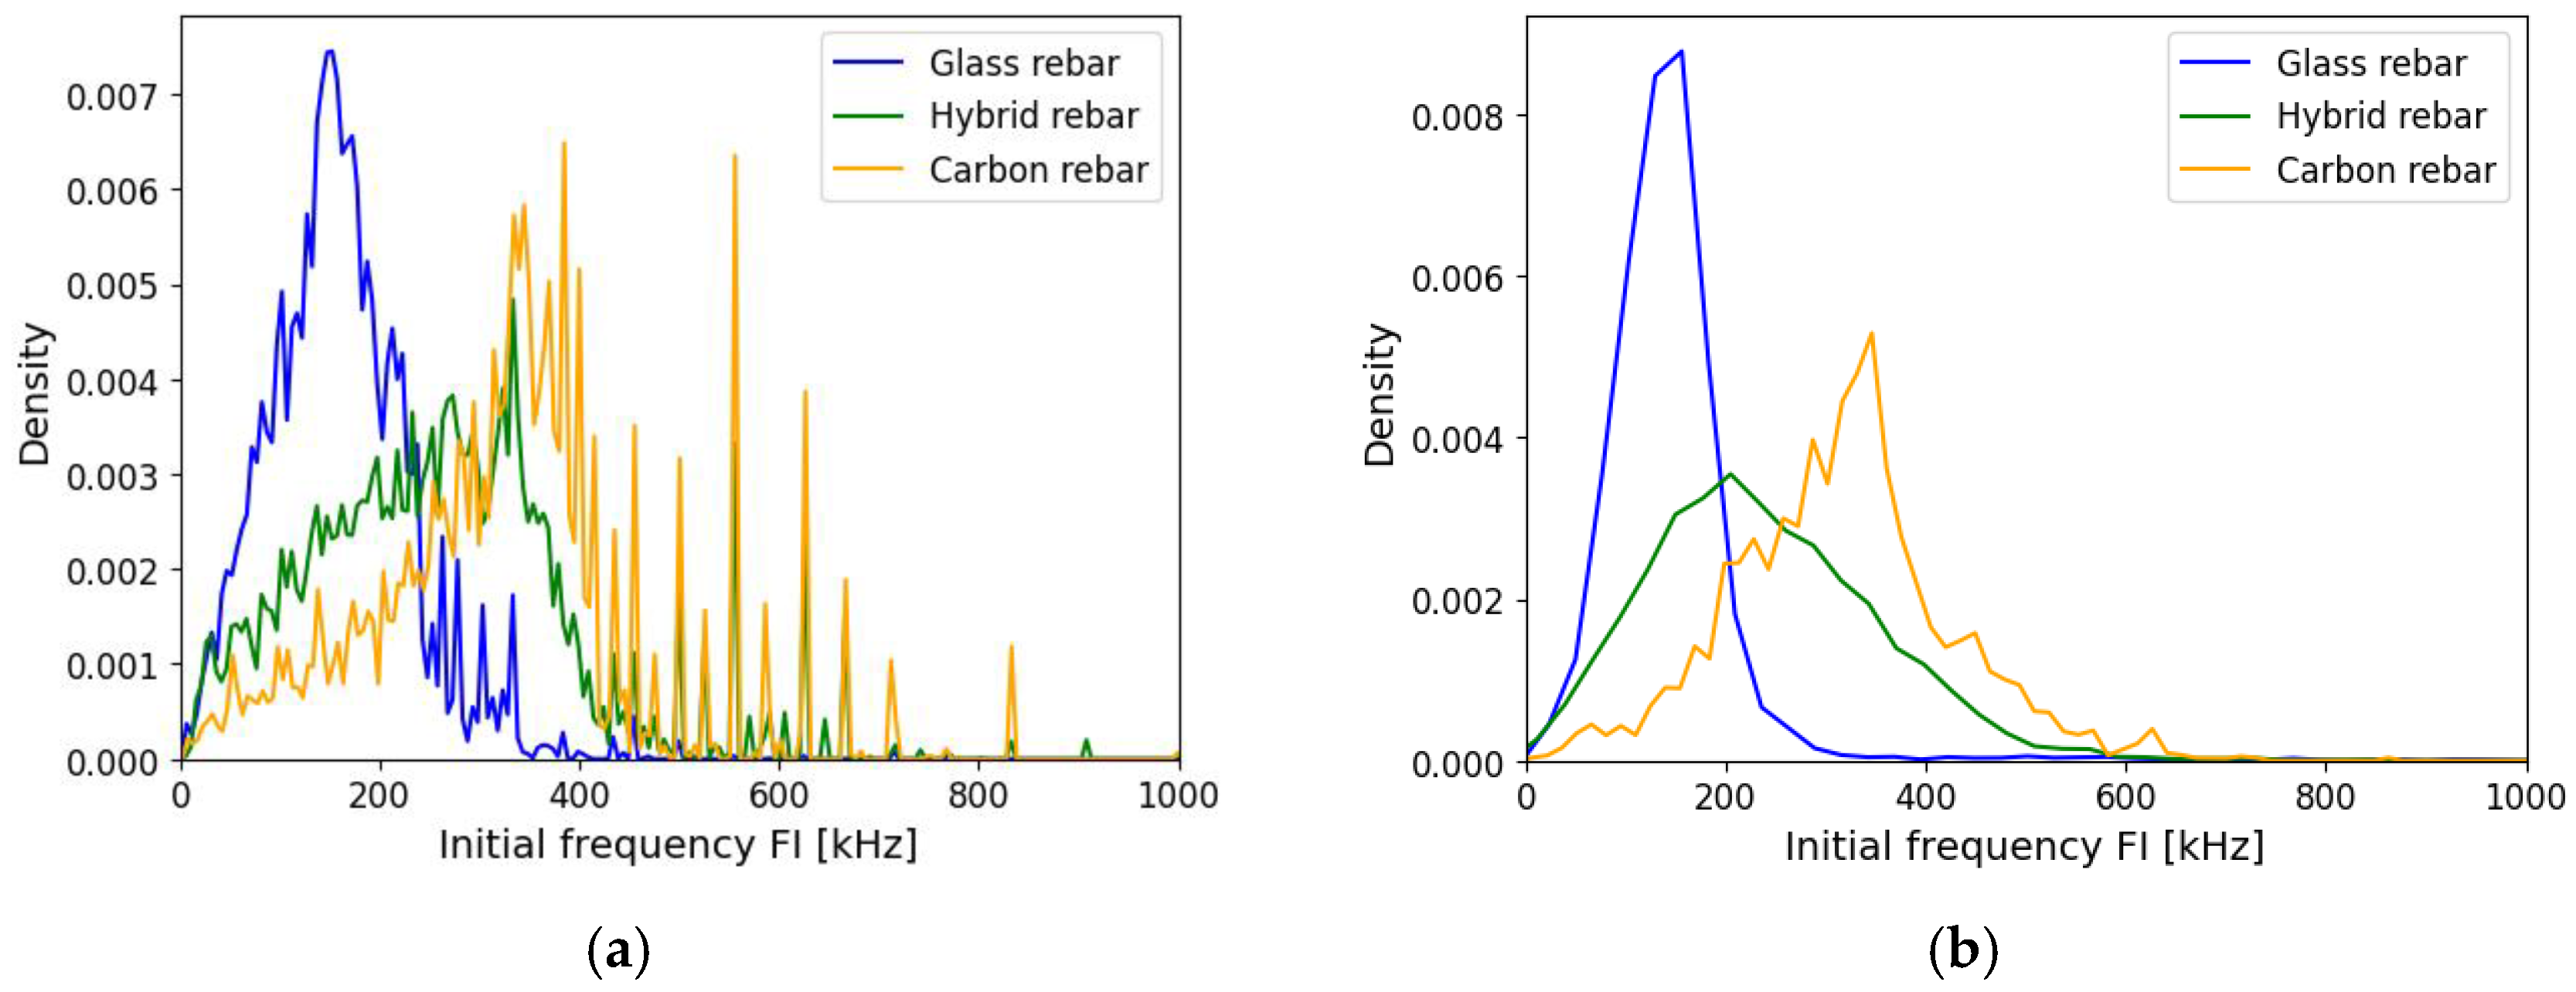
Initial frequency FI of composite rebars, (a) registered data, (b) AE data after applying attenuation assumption.
Figure 14.
Initial frequency FI of composite rebars, (a) registered data, (b) AE data after applying attenuation assumption.
Figure 15.
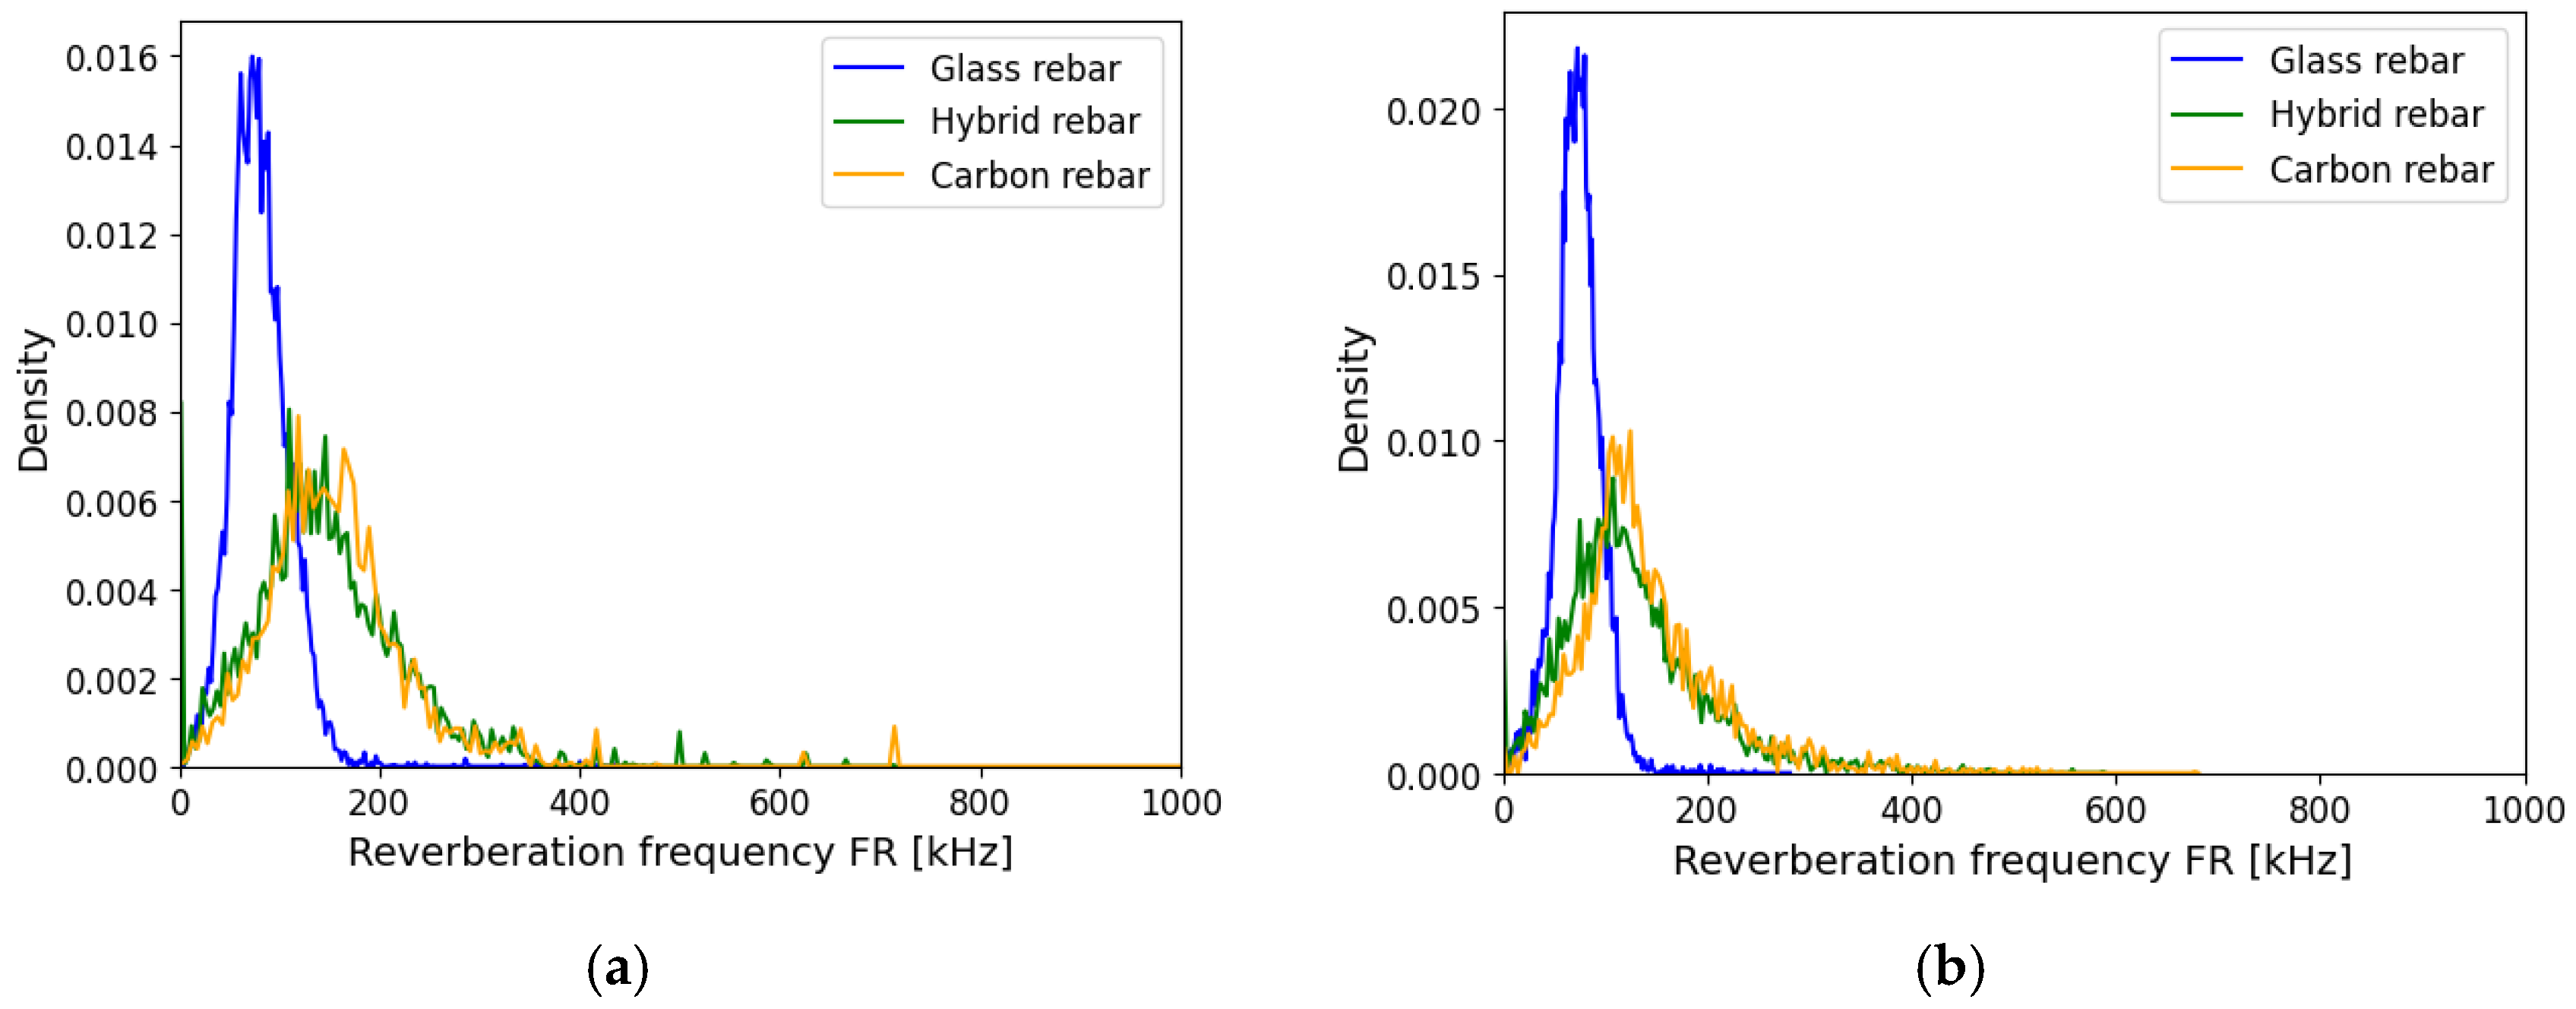
Reverberation frequency FR of composite rebars, (a) registered data, (b) AE data after applying attenuation assumption.
Figure 15.
Reverberation frequency FR of composite rebars, (a) registered data, (b) AE data after applying attenuation assumption.
Figure 16.
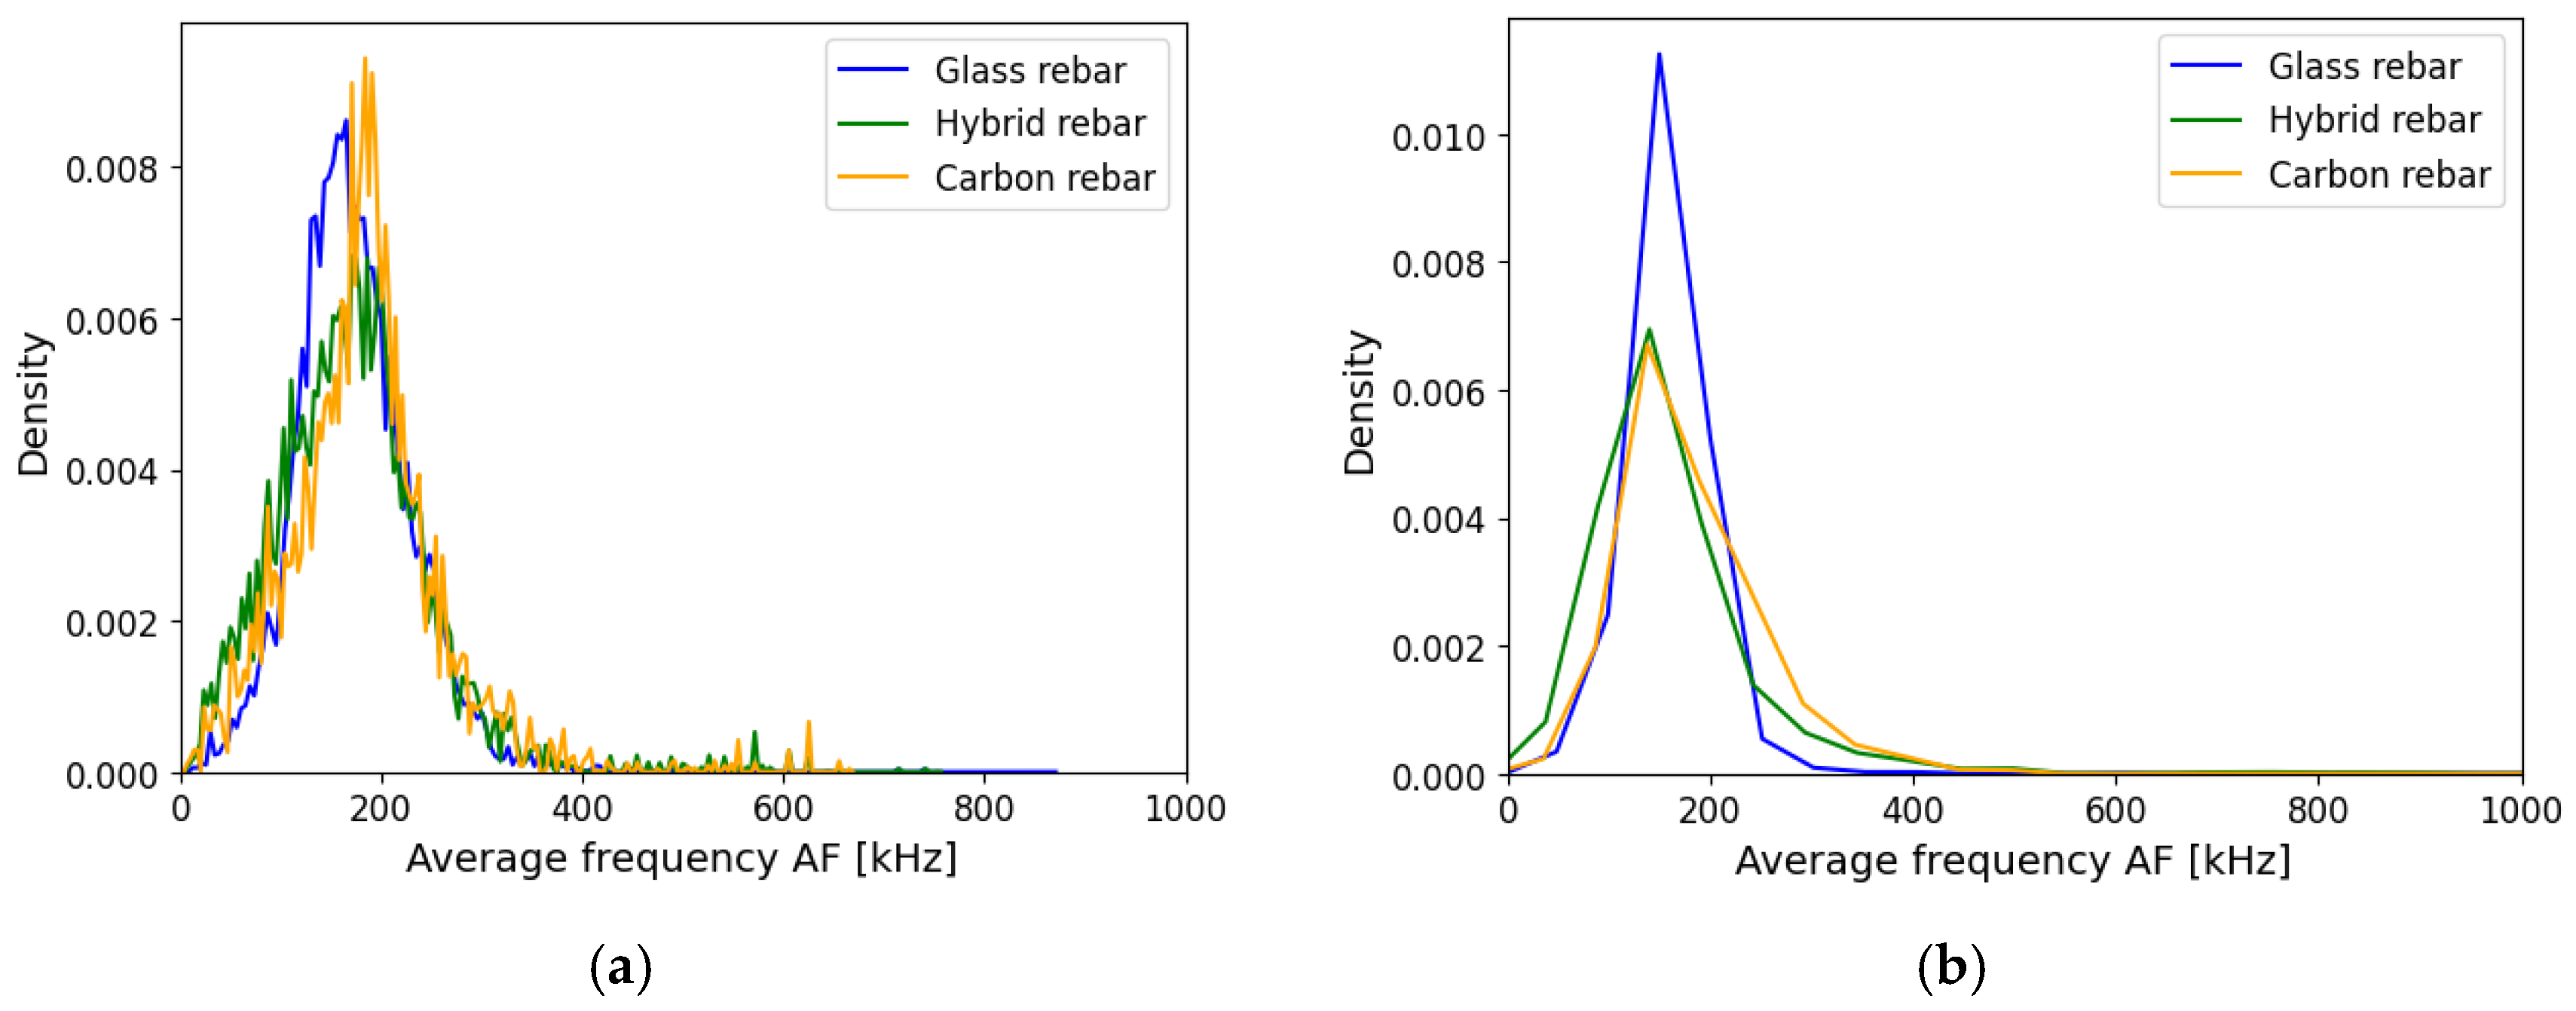
Average Frequency AF of composite rebars, (a) registered data, (b) AE data after applying attenuation assumption.
Figure 16.
Average Frequency AF of composite rebars, (a) registered data, (b) AE data after applying attenuation assumption.
Figure 17.
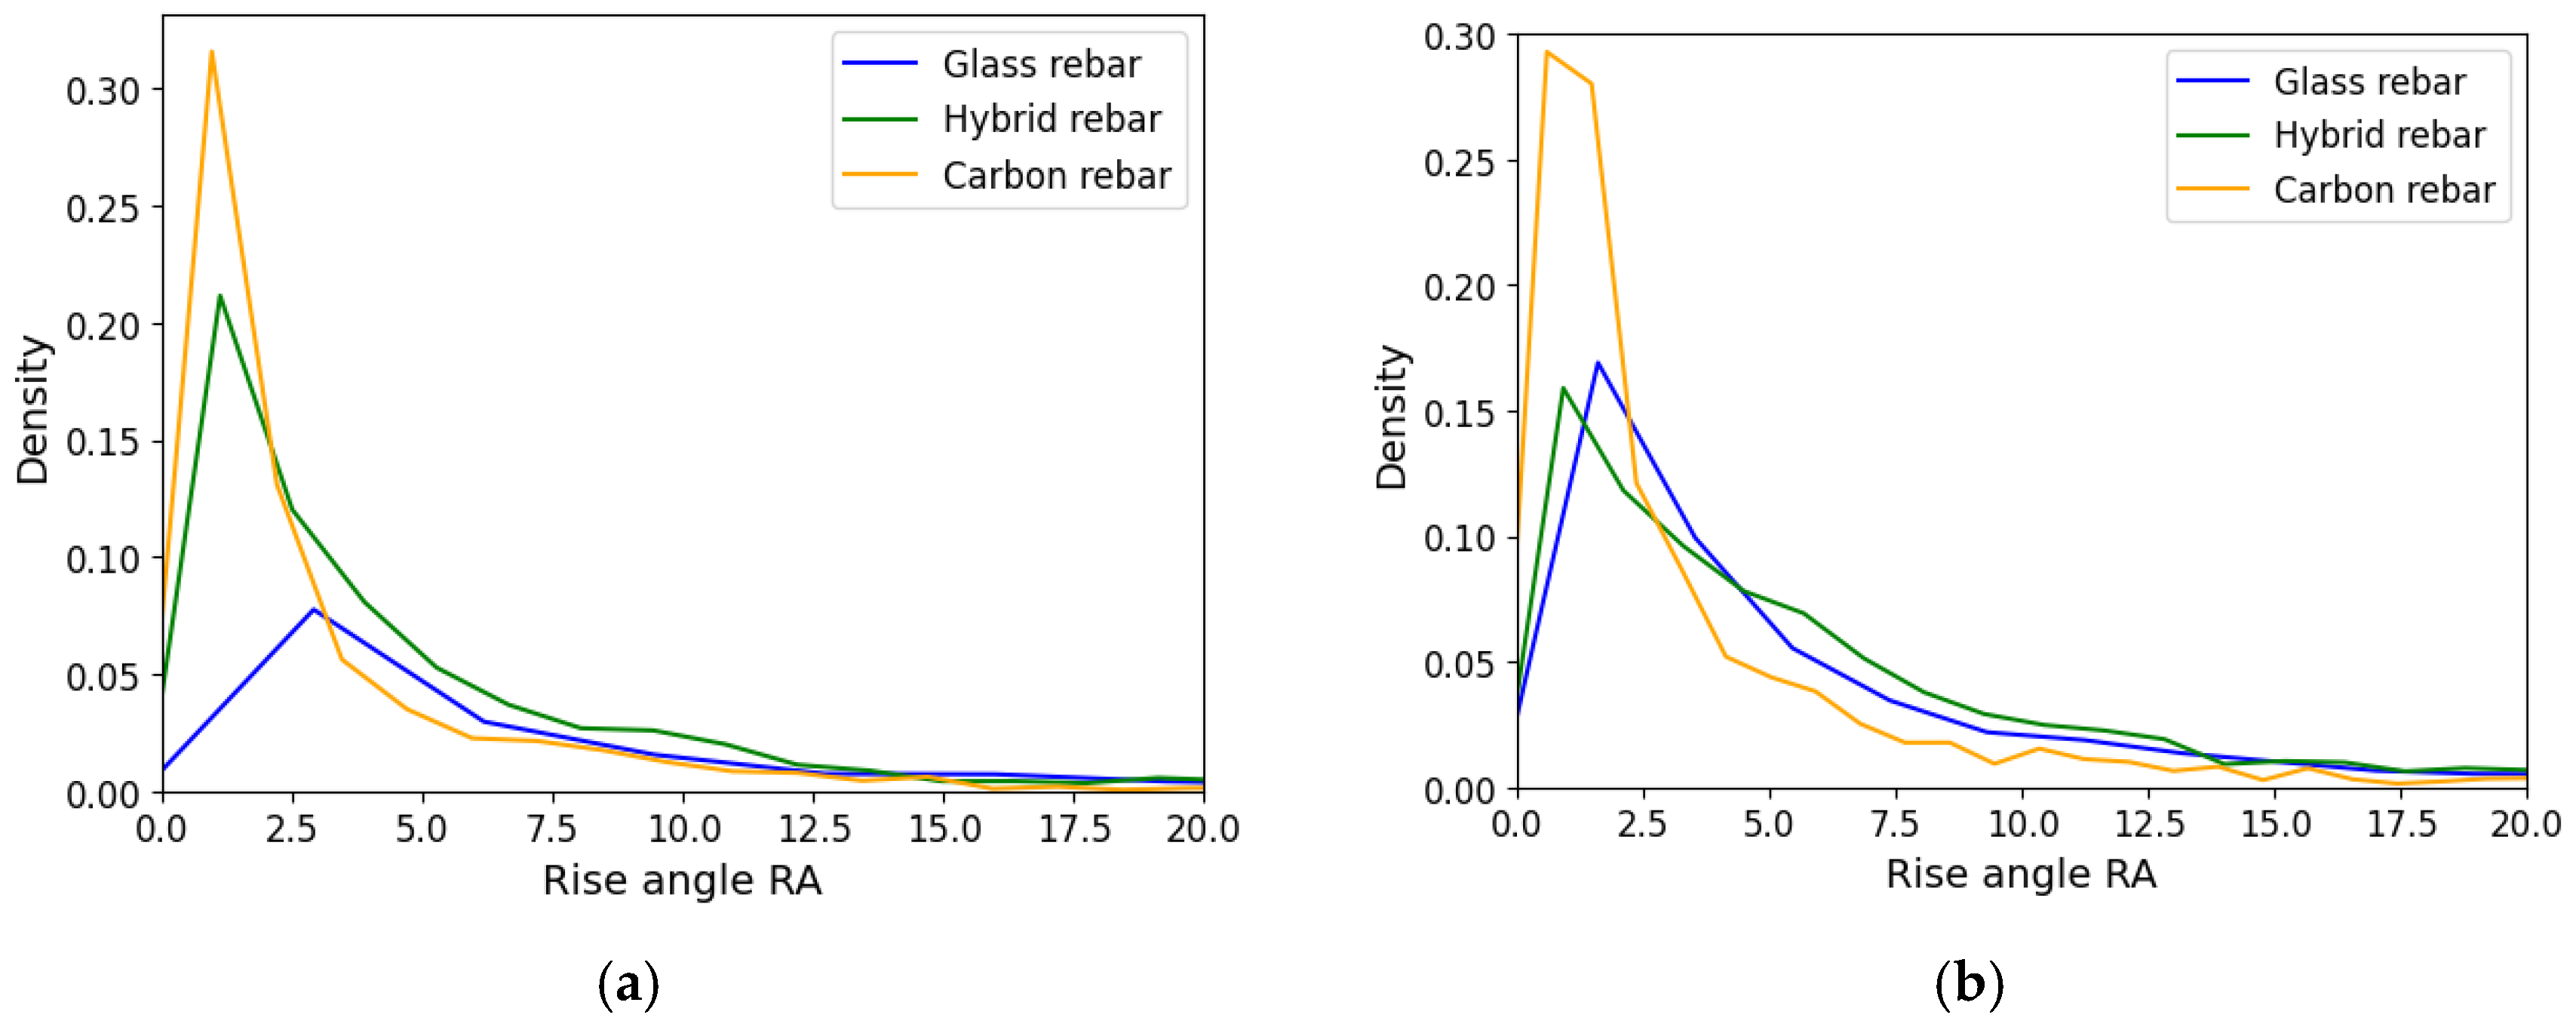
Rise angle RA of composite rebars, (a) registered data, (b) AE data after applying attenuation assumption.
Figure 17.
Rise angle RA of composite rebars, (a) registered data, (b) AE data after applying attenuation assumption.
Figure 18.
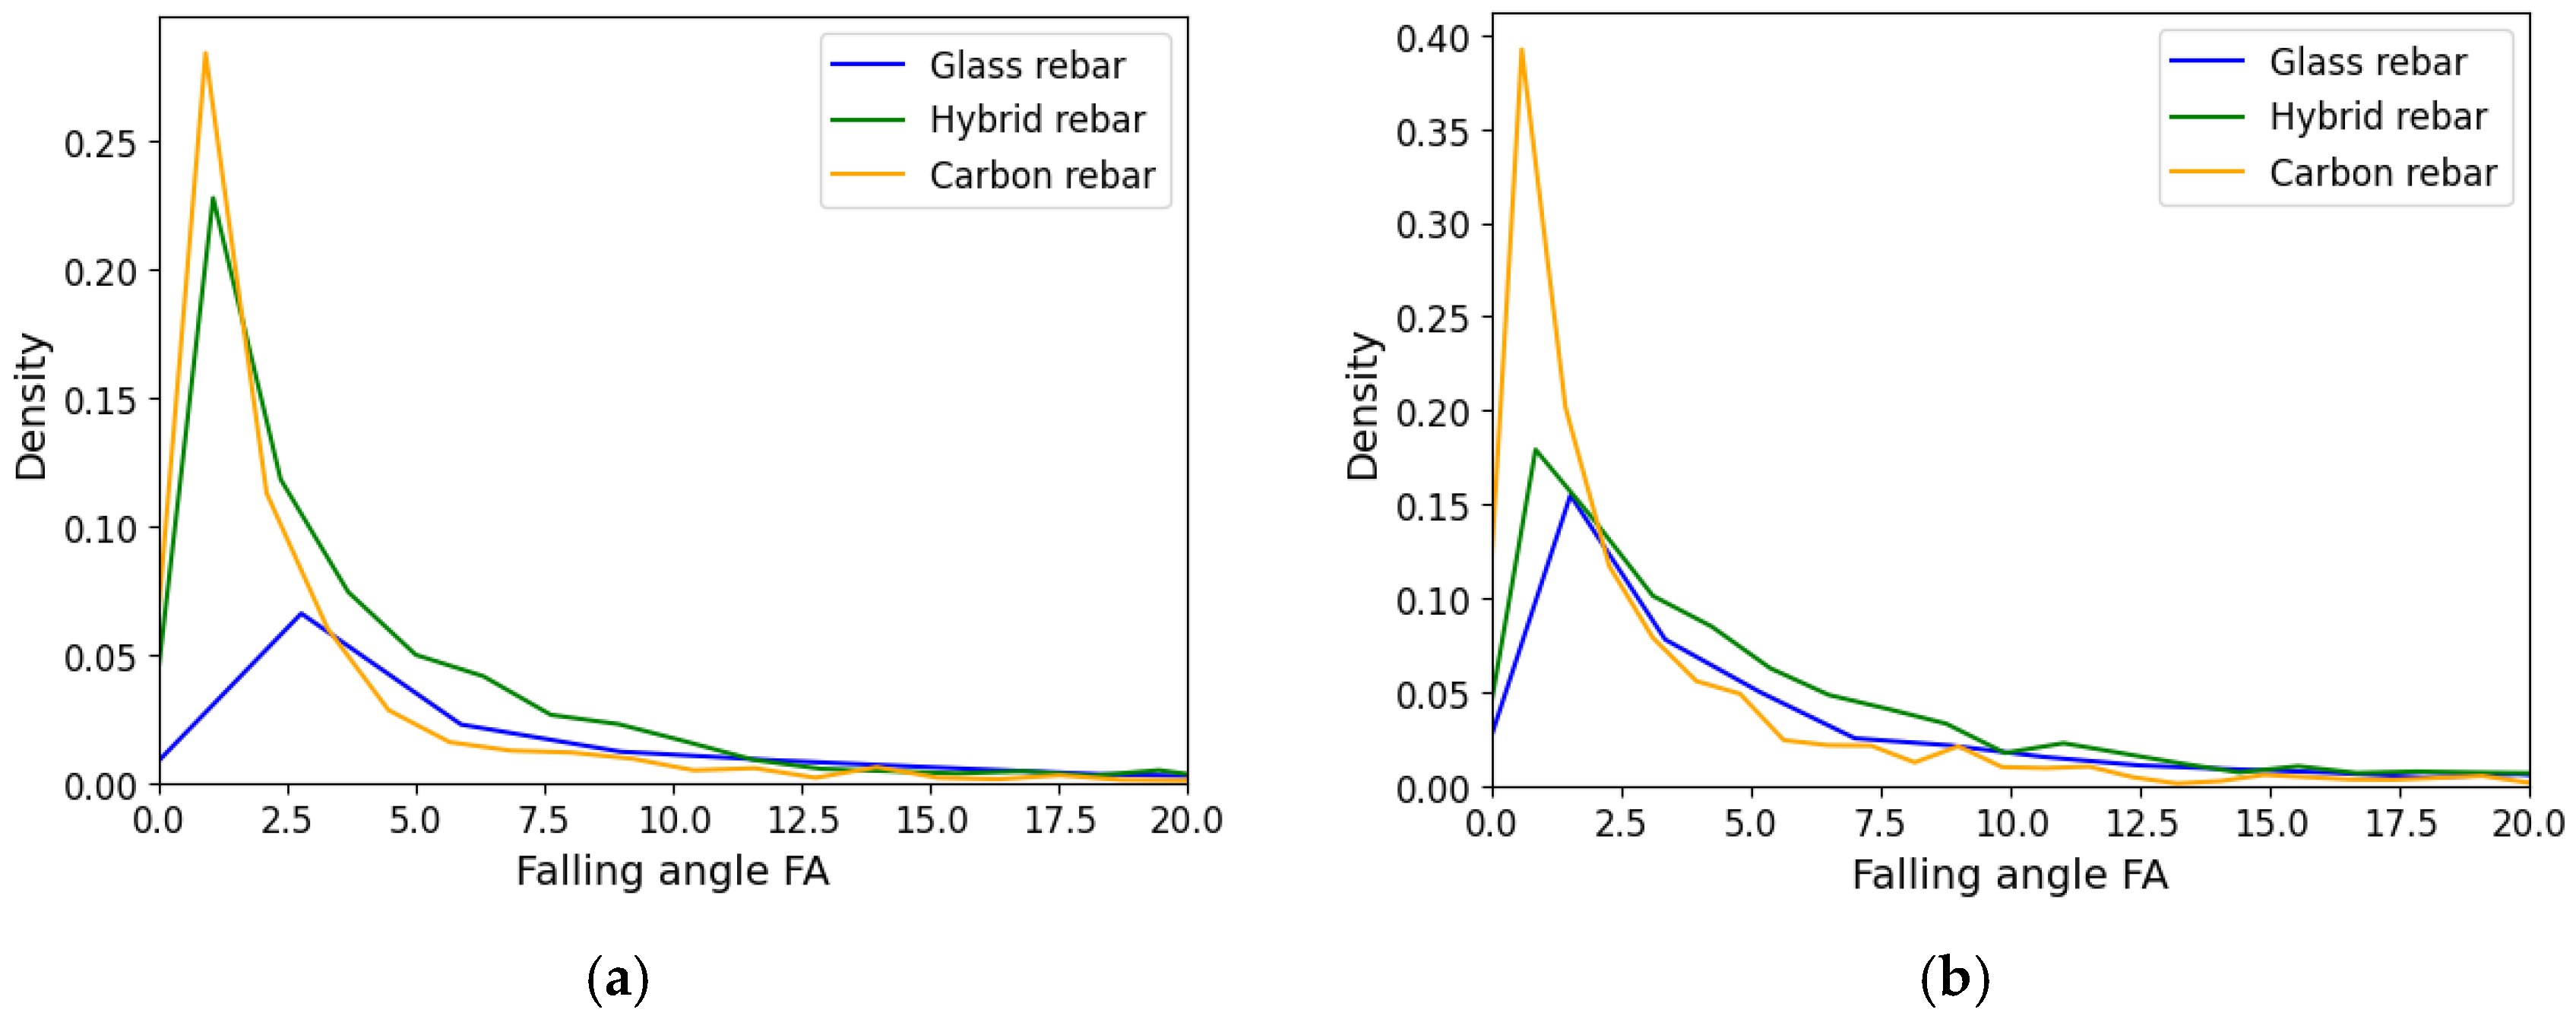
Falling Angle FA of composite rebars, (a) registered data, (b) AE data after applying attenuation assumption.
Figure 18.
Falling Angle FA of composite rebars, (a) registered data, (b) AE data after applying attenuation assumption.
Figure 19.
Glass fiber (up) and carbon fiber rebars (bottom) after experimental static tensile test.
Figure 19.
Glass fiber (up) and carbon fiber rebars (bottom) after experimental static tensile test.
Table 1.
Overview of matrix components used in the experimental campaign.
Table 1.
Overview of matrix components used in the experimental campaign.
| | Biresin CR141
Resin (A) | Biresin CH141
Hardener (B) | Biresin CA141
Accelerator (C) |
|---|
| Components | ≥90% bisphenol-A-(epichloryhydrin) epoxy resin (number average molecular weight ≤ 700) | ≥50%–≤100% tetrahydromethylphathalic anhydride | ≥50%–≤100% 1-methylimidazole |
| Mixing ratio, parts by weight | 100 | 90 | 2 |
Table 2.
Applied reinforcement types during experimental campaign.
Table 2.
Applied reinforcement types during experimental campaign.
| | Glass Fibers | Carbon Fibers |
|---|
| Manufacturer | StarRov | Zoltek |
| Type of sizing | silane | silane |
| Density [g/cm3] | 2.60 | 1.78 |
| Tensile strength [MPa] | 1765 | 4137 |
| Modulus of elasticity [GPa] | 74 | 242 |
| Strain at failure [%] | - | 1.5 |
| Fiber diam. [µm] | 23 | 7.2 |
| Tex | 4800 | 3600 |
Table 3.
Technological parameters controlled during modified pultrusion process.
Table 3.
Technological parameters controlled during modified pultrusion process.
| Temperature [°C] | Velocity |
|---|
| Bath | Die1 | Die2 | Zone1 | Zone2 | Zone3 | Linear [m/min] | Radial [1/min] |
|---|
| 60 | 110 | 125 | 160 | 150 | 140 | 0.3 | 1.25 |
Table 4.
Acquisition parameter.
Table 4.
Acquisition parameter.
| Parameter Name | Parameter Value |
|---|
| Threshold [dB] | 35 |
| Rearm time [µm] | 400 |
| Duration discr. time [µm] | 200 |
| Amplifier | AEP5 (34 dB) |
| Preamplifier gain [dB] | 34 |
| Pre-trigger samples | 100 (10 µm) |
| Post-duration samples | 100 (10 µm) |
| Frequency filter [kHz] | 95–850 |
Table 5.
FFT-feature extractor.
Table 5.
FFT-feature extractor.
| Parameter Name | Parameter Value |
|---|
| Start sample relative to trigger sample | −100 |
| No. of samples for extraction window | 256 |
| No. of samples for FFT calculation | 4096 |
Table 6.
Overview of piezoelectric sensors used in the study.
Table 6.
Overview of piezoelectric sensors used in the study.
| | VS150-M | VS370-A2 | VS375-M | VS600-Z1 |
|---|
| Frequency range [kHz] | 100–450 | 170–590 | 250–700 | 550–730 |
| Frequency of sensitivity peak [kHz] | 150 | 370 | 375 | 600 |
| Capacity [pF] | 350 | 47 | 390 | 200 |
| Size(dxH) [mm] | 20.3 × 14.3 | 8.5 × 13.0 | 20.3 × 14.3 | 4.75 × 5.8 |
Table 7.
Impact of the applied limitations on the analyzed number of acoustic emission events per specimen.
Table 7.
Impact of the applied limitations on the analyzed number of acoustic emission events per specimen.
| | Number of AE Events per Specimen | Number of AE Events per Specimen After the Reduction Scheme |
|---|
| | Mean | SD | CV | Mean | SD | CV |
|---|
| Glass fiber rebar | 396,080 | 28,404 | 7.2 | 6852 | 474 | 6.9 |
| Hybrid fiber rebar | 71,991 | 1674 | 23.3 | 1707 | 364 | 21.3 |
| Carbon fiber rebar | 49,560 | 14,307 | 28.9 | 1086 | 380 | 35.0 |
Table 8.
Boundary conditions used in optimization.
Table 8.
Boundary conditions used in optimization.
| Parameter | Min Value | Max Value | Unit |
|---|
| Material attenuation | | 0.001 | 1 | Np/mm/kHz |
| Mounting material attenuation | | 0.01 | 10 | Np/mm/kHz |
| Geometrical spreading | | 0 | 1.5 | - |
| Geometrical spreading of mounting | | 0 | 1.5 | - |
| Frequency power | | 1 | 2 | - |
| Glue thickness | t | 0.1 | 5 | mm |
| Transmission | | 0 | 1 | - |
Table 9.
Improvement of the mean score value per event after optimization for amplitude value.
Table 9.
Improvement of the mean score value per event after optimization for amplitude value.
| | Glass Rebar | Hybrid Rebar | Carbon Rebar |
|---|
| | Mean | SD | CV | Mean | SD | CV | Mean | SD | CV |
|---|
| Initial score | 0.22 | 0.01 | 3.5 | 0.28 | 0.06 | 21.9 | 0.30 | 0.04 | 13.0 |
| Best score | 0.15 | 0.02 | 14.9 | 0.17 | 0.02 | 13.3 | 0.18 | 0.03 | 18.6 |
| Improvement | 32% | 39% | 40% |
Table 10.
Improvement of the mean score value per event after optimization for energy parameters.
Table 10.
Improvement of the mean score value per event after optimization for energy parameters.
| | Glass Rebar | Hybrid Rebar | Carbon Rebar |
|---|
| | Mean | SD | CV | Mean | SD | CV | Mean | SD | CV |
|---|
| Initial score | 0.36 | 0.05 | 14.8 | 0.51 | 0.10 | 20.5 | 0.58 | 0.11 | 19.1 |
| Best score | 0.24 | 0.02 | 9.5 | 0.26 | 0.05 | 17.2 | 0.28 | 0.06 | 21.4 |
| Improvement | 33% | 49% | 52% |
Table 11.
Attenuation parameters obtained for amplitude and energy attenuation using the optimization method.
Table 11.
Attenuation parameters obtained for amplitude and energy attenuation using the optimization method.
| | Glass Rebar | Hybrid Rebar | Carbon Rebar |
|---|
| | Mean | SD | CV | Mean | SD | CV | Mean | SD | CV |
|---|
| 0.0077 | 0.0011 | 13.7 | 0.0184 | 0.0062 | 33.8 | 0.0244 | 0.0084 | 34.3 |
| 0.0035 | 0.0036 | 102.5 | 0.0187 | 0.014 | 72.5 | 0.0244 | 0.0049 | 20.1 |
| 0.178 | 0.054 | 30.1 | 0.106 | 0.033 | 30.9 | 0.144 | 0.173 | 120.3 |
| 0.311 | 0.098 | 31.6 | 0.132 | 0.159 | 120.5 | 0.142 | 0.176 | 124.0 |
| 1.37 | 0.24 | 17.6 | 1.58 | 0.18 | 11.7 | 1.79 | 0.02 | 0.9 |
| 1.55 | 0.21 | 13.7 | 1.33 | 0.40 | 29.9 | 1.68 | 0.23 | 13.7 |
