Abstract
Pharmaceutical residues, including a wide range of therapeutic drugs, have been increasingly reported in drinking water sources worldwide, raising environmental concerns due to their potential impact on aquatic ecosystems. Among the available treatment approaches, adsorption has emerged as one of the most reliable methods for eliminating these pollutants. In the present study, metformin was effectively removed from water using a nanocomposite adsorbent consisting of copper nanoparticles anchored onto magnetic chitosan (Cu@MCS). The removal of metformin by Cu@MCS was governed by several mechanisms: surface complexation with copper species, electrostatic interactions, hydrophobic associations between the drug’s methyl groups and magnetite, and hydrogen bonding between metformin’s amino groups and oxygenated functional groups of chitosan. The structural and surface properties of the nanocomposite were characterized through FTIR, XPS, XRD, SEM, and HRTEM analyses. Key experimental factors, such as initial drug concentration, contact time, pH, and ionic strength, were systematically optimized to maximize adsorption efficiency. Adsorption data closely followed the Langmuir isotherm model, with a maximum capacity (qm;) of 52.91 mg·g−1 at 298 K. Regeneration tests demonstrated excellent reusability, showing only a 3.7% decline in performance after six adsorption–desorption cycles. The Cu@MCS material also proved effective in removing metformin from diverse real water samples, including river water, wastewater, bottled water, and tap water. A notable advantage of this nanosorbent is its magnetic separability, which enables straightforward recovery from solution, even at low contaminant levels and with large sample volumes. These results underline the potential of magnetic chitosan-based nanocomposites as fast, efficient, and reusable adsorbents for the removal of pharmaceutical contaminants from aquatic systems.
1. Introduction
Pharmaceutical residues have increasingly been detected in drinking water sources worldwide, raising concerns about their potential risks to aquatic ecosystems and human health [1,2,3,4]. Large amounts of therapeutic drugs enter wastewater and groundwater treatment facilities through human excretion, sewer leakage, and the disposal of expired medications [5,6,7]. These pollutants are persistent, bioactive, and often remain unmetabolized, making their presence in water bodies an emerging environmental issue of global importance.
Among these contaminants, metformin (1,1-dimethylbiguanide), a first-line treatment for type 2 diabetes and polycystic ovarian syndrome, is one of the most widely consumed pharmaceuticals, with more than 150 million users annually [8,9,10]. Approximately 70% of ingested metformin is excreted unchanged in urine, leading to frequent detection in sewage effluents and surface waters at concentrations ranging from micrograms to milligrams per liter in different countries [11,12,13,14,15,16,17]. Its continuous release into aquatic systems raises ecological and health concerns, including endocrine disruption in fish and possible effects on human vitamin B12 metabolism [18,19]. Yet, no regulatory limits for metformin in drinking water have been established, underscoring the urgency of developing effective remediation strategies.
Various treatment methods, such as coagulation [20], biological degradation [21], photocatalysis [22], catalytic ozonation [23], electrochemical oxidation [24], and adsorption [25,26,27], have been investigated for pharmaceutical removal. Among these, adsorption stands out due to its simplicity, efficiency, and wide availability of sorbents [28]. Several adsorbents, including magnetic chitosan [29], activated carbon [30,31], magnetic carbon composites [32,33], silica–alumina [34], biochar [35,36], and natural clay [37], have been applied for metformin removal. Chitosan is attractive because of its abundance, eco-friendliness, and multiple amino and hydroxyl groups that enable strong binding with pollutants [38,39,40,41]. However, conventional chitosan-based sorbents often suffer from limited separation efficiency, poor stability, or aggregation issues, which restrict their large-scale applicability [42,43,44,45].
Although many adsorbents have been explored, most are unsuitable for real industrial applications due to limited separation efficiency. Magnetic separation offers distinct advantages, including low cost and high efficiency, by employing carriers with a magnetic core for strong response and a polymeric shell for surface functionality [46,47,48]. Nanosized carriers further outperform microsized supports because of their higher surface area and reduced diffusion resistance [49,50]. Magnetite (Fe3O4), with its excellent magnetic properties, chemical stability, and biocompatibility, has thus been widely used to impart magnetic functionality. Chitosan, with abundant amine and hydroxyl groups, provides strong interaction sites, and when magnetically modified, can be easily separated from aqueous systems under an external field [51]. Such magnetically functionalized chitosan systems have shown promise in removing heavy metals [52,53,54,55,56], dyes [57,58], and aflatoxins [59], as well as serving in green catalysis [60,61] and drug delivery applications [62,63]. Building on this foundation, our ongoing research focuses on further enhancing chitosan- and graphene-based nanocomposites for efficient removal of emerging pollutants from water.
In this study, we address these limitations by developing a copper-functionalized magnetic chitosan nanocomposite (Cu@MCS) as a novel nanosorbent for the rapid and efficient adsorption of metformin (Figure 1) from water. The synergistic role of Cu nanoparticles is to prevent aggregation of magnetic chitosan, enhance surface area, and promote strong Cu–metformin surface interactions, thereby improving adsorption performance. To the best of our knowledge, this is the first report demonstrating the application of Cu@MCS for metformin and pharmaceutical wastewater treatment, combining high efficiency, rapid kinetics, and excellent reusability.
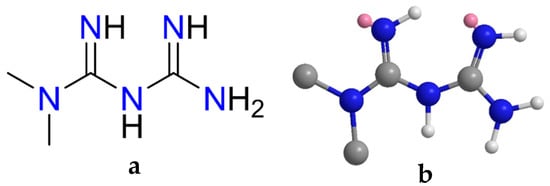
Figure 1.
The (a) 2D and (b) 3D structures of metformin.
2. Experimental Section
2.1. Materials and Reagents
Sodium chloride (NaCl), L-ascorbic acid, copper nitrate trihydrate (Cu(NO3)2·3H2O), FeSO4, FeCl3, and methanol were analytical reagent grade (Sigma-Aldrich, St. Louis, MO, USA). We purchased 99.99% pure metformin HCl from (Selleck Biotechnology GmbH, Cologne, Germany). Sigma-Aldrich provided chitosan powder. By dissolving the required amount of metformin, stock standard solutions were generated (500 mg/L), which were then stored at 4 °C. By diluting the stock solutions with Milli-Q water, the proper concentrations of working solutions were made each day.
2.2. Instrumentation
A Nicolet 400 Fourier transform infrared spectrometer was used to perform the FTIR measurements. Using a quartz cuvette with a path length of 1 cm, the Labomed Inc. UVD-3500 UV-Vis double-beam spectrophotometer (Culver City, CA, USA) was used to estimate the metformin concentration. pH values were adjusted using a combined glass electrode and a calibrated pH meter. X-ray powder diffractometer with a Cu-Kα radiation source (k = 1.5418 Å) (D/MAX-2550-Rigaku, Tokyo, Japan). High-resolution transmission electron microscopy (HRTEM) with JEOL JEM-2100V (JEOL, Peabody, MA, USA) and scanning electron microscopy (SEM) with JEOL JSM-6010LV (JEOL, Peabody, MA, USA) were used to examine the morphology of MCS and Cu@MCS nanocomposites.
2.3. Preparation of Cu@MCS Nanoparticles
A nanoparticle-sized Cu-functionalized magnetic chitosan nanocomposite was created by mixing Cu-NPs with magnetic chitosan (MCS) in a ball mill. To make the MCS nanoparticles, ferrous and ferric ions were chemically co-precipitated with NaOH and chitosan in a solution that was then hydrothermally treated [64,65]. In a nutshell, 2.0 g of chitosan was dissolved in 100 mL of a 2.0% acetic acid solution. In a 1:2 molar ratio, FeSO4 and FeCl3 were dissolved. Then, 15 mL of 30% NaOH solution was added dropwise while stirring constantly under argon to chemically precipitate the resultant solution at 40 °C. Separation was achieved by centrifugation many times in water and ethanol after heating the suspension to 90 °C and maintaining continuous stirring for 1 h. Then, the particles were dried in a vacuum at a temperature of 70 °C. A basic precursor for Cu was used in a 0.1 M-Cu(NO3)2 solution, L-ascorbic acid served as an antioxidant, and PVP was used as a stabilizing and reducing agent. With the help of a catalyst, NaOH (0.2 M), the pH was brought down to 12. A 100 mL stainless-steel autoclave lined with a Teflon container was used to heat the combination to 190 °C for five hours after it had been carefully placed inside. Following centrifugation, the brownish Cu nanoparticles were washed with a mixture of ethanol and water and then dried in an oven. As a last step, the black Cu@MCS nanocomposite was created by carefully blending the Cu nanoparticles with the black MCS nanosheets using a stainless-steel ball mill set to 25 Hz for 30 min.
2.4. Batch Experiments for the Adsorption Removal of Metformin by Cu@MCS Nanocomposite
In a centrifuge tube, 10 mg of Cu@MCS nanoparticles were exposed to a particular concentration range (10–400 mg∙L−1) of metformin solution. The suspending solutions had been enclosed in aluminum foil and ultrasonicated for two minutes, and the pH was brought down to 6.0 by 0.05 M HCl or NaOH to prevent any photodegradation of metformin. The solution was stirred at 250 rpm using a thermostatic shaker. Following separation, a typical calibration curve of various metformin concentrations was used to quantify the clear solution of metformin spectrophotometrically at a wavelength of 235 nm [66]. To examine the effects of pH, the suspension of the nanocomposite and metformin was changed from 2 to 11. Then, 10 mg of the Cu@MCS nanoparticles were introduced to 20.0 mL of metformin solutions at varying starting concentrations (10.0, 20.0, and 40.0 mg L−1) to examine the adsorptive removal efficiency kinetics. A series of measurements was made of the metformin concentration at various intervals of time (1–40 min). By dissolving varying concentrations of NaCl, the effect of ionic strength (0–50 mM) on the effectiveness of metformin removal was investigated. Equations (1) and (2) [67,68] were used to determine the metformin removal efficiency (%R) and capacity of adsorption (qe) in mg∙g−1.
Co and Ce denote the metformin original and final concentrations (mg∙L−1), respectively, m is the mass of the adsorbent (g), and V represents the solution volume (L).
3. Results and Discussion
3.1. Surface Morphology and Characterization
Using HRTEM and SEM, the surface morphologies of MCS nanosheets and the Cu@MCS nanocomposite were investigated; the resulting images are shown in Figure 2A–D. A vertical, compacted stack morphology and wrinkled structure appeared in the scanning electron micrograph of MCS (Figure 2A). Agglomeration of MCS with wrinkled films was reduced, to some degree, by the immobilized copper nanoparticles (Figure 2B). Figure 2C,D show HRTEM images of MCS and Cu@MCS, which reveal dark patches on the MCS sheets, which are magnetite and Cu-NPs moieties. The 3D Cu@MCS nanocomposite’s thicker, rougher, and more inconsistent surface, as well as its more random 3D porous arrangement, demonstrates that the MCS surface was effectively doped with Cu-NPs. The Cu@MCS nanocomposite has an average diameter of 25.3 ± 1.5 nm. The N2 adsorption/desorption hysteresis loop of the Cu@MCS nanocomposite is shown in Figure S1. Hysteresis loop analysis shows that the Cu@MCS nanocomposite has a microporous structure, which causes a considerable increase in pressure at relatively low pressures (P/Po < 0.05 atm). In addition, the presence of mesopores is shown by the BET isotherm, which shows type IV with an H4 hysteresis loop. The specific surface area and total pore diameter were measured to be 414.33 m2∙g−1 and 5.40 nm, respectively. Figure 2E,F show the results of the elemental analysis, which verify the chemical purity of the porous Cu@MCS nanocomposite, as well as the presence of magnetite and Cu dopant. The EDX spectrograph of the nanocomposite shows three different peaks of Cu nanoparticles (Figure 2E). The first peak is at 0.93–1.21 keV (Lα1), the second and largest peak is at 7.95–8.31 keV (Kα), and the third peak is at 8.78–8.93 keV (Kβ). Additionally, at 0.58–0.67, 6.28–6.71, and 6.92–7.22 eV, the three distinctive peaks of the magnetite nanoparticles are detected. Figure 2F shows the results of the EDS mapping, which indicate the distribution of Cu-NPs and Fe, O magnetite throughout the Cu@MCS nanoparticles. The EDS spectra confirm the presence of Cu loading on the magnetic chitosan nanoparticles. Figure 3A shows the Fourier transform infrared spectra of the MCS and Cu@MCS nanostructures. At the 3471–3512 cm−1 range, the stretching vibration of O-H in MCS and Cu@MCS was identified. The C-H stretching vibrations of the -CH2- groups in the chitosan polymer backbone are connected to the absorption bands at 2927–2944 cm−1 in MCS and Cu@MCS. At 3414–3417 and 1615–1627 cm−1, the typical biosorption peak of primary amine (-NH2) is visible. C-O bond stretching vibration is shown by the bands at 1030–1075 cm−1. At 607.5 cm−1, the immobilized Cu-NPs onto the Cu@MCS nanocomposite show their most unique peak, whereas the peak at 581.4 cm−1 is assigned to the stretching vibration of the Fe-O in the magnetite. Cu nanoparticles are shown to be immobilized on MCS nanostructures by FTIR spectroscopy. In Figure 3B, XRD results validate the Cu@MCS nanocomposite’s structure. The three diffraction peaks observed in Cu@MCS, namely at 43.94° (111), 51.21° (200), and 75.02° (220), are quite close to the typical Cu card (JCPDS Card: 04-0836) [66]. The CS sheets are responsible for the extra broad (111) peak at around 19.91–20.02° [67]. The magnetite nanoparticles in MCS and Cu@MCS exhibit six distinct diffraction peaks, which align with the standard Fe card (JCPDS Card: 19-0629) at 30.20–30.37° (220), 35.53–35.60, 43.94–43.40, 53.20–53.63° (511), 62.74–62.77°, and 73.38–74.31° (533) [68]. The nanocomposite’s XRD spectrogram displays no extra peaks, suggesting that the fabricated nanocomposite is highly pure.
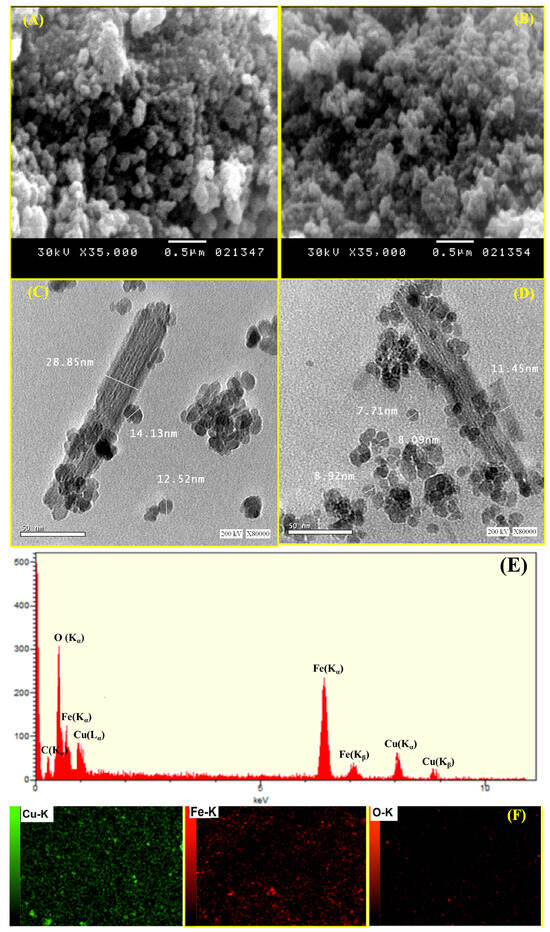
Figure 2.
SEM (A,B) and HRTEM (C,D) morphologies of MCS and Cu@MCS nanocomposite; EDS (E) and mapping EDS (F) of Cu@MCS nanocomposite.
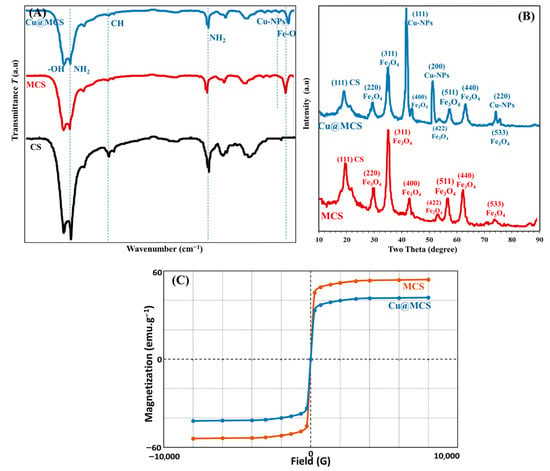
Figure 3.
FTIR spectrum (A), XRD (B), and VSM (C) of Cu@MCS nanocomposite.
Figure 3C depicts the magnetic hysteresis loop of Cu@MCS, which demonstrates its superparamagnetic behavior at ambient temperature. In other words, it is the ability to react to a magnetic field without keeping any magnetism once the field is removed. The VSM was used to characterize the magnetic behavior of magnetic nanoparticles. There is a saturation magnetization (Ms) of 42.11 emu/g in Cu@MCS. Accordingly, the nanocomposite can be isolated from the solution by using an external field. XPS measurements were also used to identify the elemental chemical states, such as the oxidation states and elemental composition, in the Cu@MCS nanocomposite that correspond to the characteristic peaks of Cu2p, Fe2p, O1s, and C1s (Figure 4). With a 20-eV spin-energy gap, the two prominent XPS peaks in the spectrum for Cu2p seen in Figure 4a, which correspond to Cu2p1/2 and Cu2p3/2, respectively, and have binding energies of 953.2 and 933.1 eV, confirm the doped Cu-NPs [69]. Cu2p3/2’s deconvoluted XPS spectra (Figure 4b) display three appropriate wide bands at binding energies of 932.2, 933.3, and 934.0 eV, which are associated with Cu(0)/Cu(I), Cu(II), and Cu(OH)2, respectively [69]. The deconvoluted XPS spectra of Cu2p1/2 (Figure 4c) reveal two fitted wide bands at binding energies of 951.7 eV and 953.4 eV, corresponding to Cu(II)/Cu(I) and Cu(II), respectively [69]. The analyzed peaks of Cu2p1/2 and Cu2p3/2 in the XPS spectrum validate the effective functionalization of Cu-NPs. The Fe2p XPS spectra of the nanocomposite (Figure 4d) show binding energies of 722.6 and 726.6 eV for the Fe2p1/2 for the Fe(II) and Fe(III), respectively, as well as 711.8 and 714.3 eV for the Fe2p3/2 for the Fe(II) and Fe(III) [70]. Three fitting peaks at binding energies of 285.6, 286.9, and 288.4 eV are visible in the deconvoluted XPS spectra of C1s (Figure 4e), and they may be associated with C–C, C–N, and C–O chemical bonds [71]. Three oxygen contributions can be seen in the high-resolution spectrum of O1s. The first peak, located at a binding energy of 530.6 eV, is attributed to the oxygen atoms in the Fe3O4 lattice. The other two peaks, located at binding energies of 532.3 and 535.6 eV, can be attributed to the O–C and O=C groups, respectively (Figure 4f). Moreover, the presence of chitosan nitrogen on the nanocomposite surface would be shown by the N1s XPS spectrum. The N1s’ two peaks, which represent the NH2 and N-H of the amine group, are situated at 399.1 eV and 400.5 eV, respectively (Figure 4g).
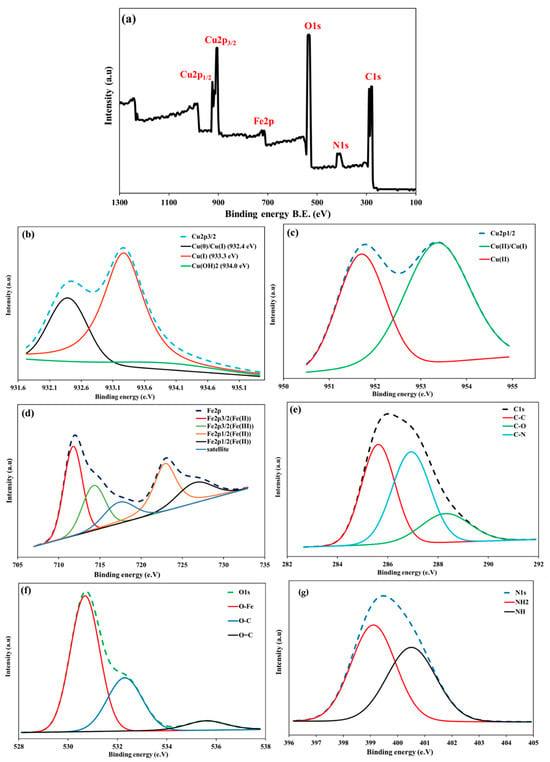
Figure 4.
XPS spectrum of full spectrum for Cu@MCS nanocomposite (a), high-resolution scan of Cu2p3/2 (b), Cu2p1/2 (c), Fe2p (d), C1s (e), O1s (f), and N(1s) (g).
3.2. Impact of pH
Because of the interaction between the functional groups in metformin and those on the surface of the Cu-immobilized magnetic chitosan nanocomposite, the pH level influences how well metformin is adsorbed by the Cu@MCS nanocomposite. Figure 5A presents the findings of this investigation. At pH 6.0, the sorption capacities attain their maximum values after increasing significantly during the studied pH range of 2–11.
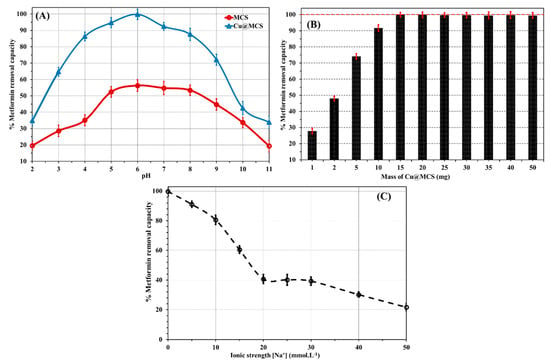
Figure 5.
(A) Impact of initial pH, (B) mass dose of Cu@MCS nanocomposite, and (C) solution ionic strength on the removal of metformin at the optimum conditions (initial metformin concentration is 20 mg L−1; T = 298.15 K; nanocomposite dosage is 15 mg, mean ± standard deviation, n = 3).
After that, they sharply decline at alkaline pHs. Metformin has two methyl substituents at position 1 and belongs to the biguanide class of guanidines. The functional groups of metformin include primary, secondary, and tertiary amines, as well as two imines (C=N−H). There are two acid dissociation constants for metformin, which are 2.8 and 11.5 [72]. This means that it mostly exists at physiological pH levels as a hydrophilic cationic species or predominantly occurs in the ionized state at pH levels ranging from 5 to 9 [72]. According to its molecular structure and pKa values, metformin exhibits a positive charge at low pH, a zwitterionic charge at neutral to moderately acidic pH, and a negative charge at basic pH. At acidic levels of pH (pH < 4.0), the ability to adsorb is thought to be due to H-bonding, electrostatic, and hydrophobic interactions. In hydrophobic interaction, the two methyl groups (on the 3°-N-atom) of metformin interact with the magnetite in MCS. In the electrostatic interactions, the cationic/protonated nitrogen functional groups (1°, 2°, and 3° amines and two imine groups) in metformin interact with the negatively charged oxygen atoms in magnetite and the hydroxyl groups of chitosan in MCS. Aside from the H-bonding interactions between the many hydroxyl and amine groups in MCS and the N-containing functional groups in metformin, the main reason for the increase in adsorption capacities at neutral to moderate pH levels (4.0–10) is the surface complexation interaction between the Cu-NPs and the two imines, as well as the 1° and 3° amine groups in metformin. On the other side, at basic pH values (pH > 10), the reduction in the H-bonding, electrostatic interactions, and the absence of surface complexation between Cu-NPs and N-functional groups in metformin are the main factors responsible for the experimental drop in the identified values of adsorption capacity. The weakness of these interactions can be attributed to the charged ammonium groups in metformin deprotonating at basic pH values.
3.3. Impact of Mass and Ionic Strength
The influence of ionic strength on the adsorptive removal efficiency was assessed by adding varying contents of NaCl to the suspended solution of metformin and Cu@MCS nanocomposite. The findings of this investigation are displayed in Figure 5B. The same pattern shows a progressive decline in the removal efficiencies of metformin by Cu@MCS for a range of NaCl concentrations of 0–50 mM at 20.0 mg L−1 metformin. At 50 mmol L−1 NaCl, the metformin uptake efficiency values dropped by 78.1%. Electrostatic screening phenomena were used to explain this behavior. The solution’s increased ionic strength would prevent the electrostatic interactions necessary for metformin’s surface complexation with copper nanoparticles. The effect of the nanocomposite mass dose (1–50 mg) for metformin removal with Cu@MCS was performed at pH 6 for a 20 min contact time and an initial concentration of 20 mg∙L−1 (Figure 5C). The results showed that increasing the dose from 2 mg to 15 mg increased the percentage of metformin uptake on Cu@MCS from 48 to 92%. Raising the Cu@MCS dose would make abundant active sites of Cu@MCS available to attract more metformin molecules from the solution [73]. The recorded metformin removal efficiencies remained constant at mass dosages higher than 15.0 mg. Therefore, we selected a mass dosage of 15.0 mg of nanocomposite for the subsequent studies.
3.4. Cu-Supported Nanoparticles’ Impact on Metformin Uptake by the Cu@MCS
To assess the performance of adsorption of Cu-NPs in the magnetic chitosan nanocomposite, sorption tests were conducted for both MCS and Cu@MCS nanocomposites at pH = 6.0. Figure 6 displays the findings of this comparison investigation. The capacity to remove metformin was considerably increased by 43.5% by the supported Cu nanoparticles.
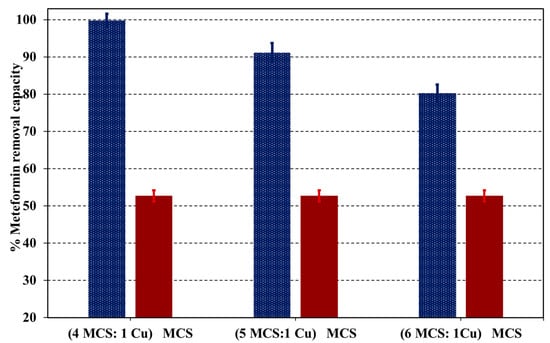
Figure 6.
The impact of immobilized Cu-NPs on the removal capacity for the metformin–Cu@MCS adsorption system.
Two key variables could account for this significant increase in adsorption, which is mostly attributed to Cu-NPs. The first reason is that the MCS moiety is prevented from being aggregated, which significantly affects the Cu@MCS’s surface area. The formation of Cu–metformin complexes onto the surface of the Cu@MCS nanocomposite in the pH range of 4–8 is the second aspect. These findings show that the developed Cu@MCS nanocomposite’s capacity to eliminate metformin is significantly influenced by Cu-NPs.
3.5. Sorption Mechanisms
The sorption of metformin and Cu@MCS can be described using four distinct types of interactions, depending on the pH of the solution [74,75]. In the first, Cu-NPs bind with the two free imine (-C=NH) groups to form stable five-membered chelate rings, as well as bind with the free amino group to form Cu–metformin surface complexes. In addition, the Cu-NPs prevent the MCS moiety from being aggregated, which significantly affects the surface area of the Cu@MCS and, in turn, enhances the metformin removal capacity. The investigations in Section 3.3 prove that the primary interactions between the Cu-MCS and the metformin are the surface Cu-complex formation [76]. The second method is the hydrophobic interaction between the two methyl groups on the 3°-N-atom of metformin with the magnetite in MCS. The third one has to do with the H-bonding that forms between the MCS’s several oxygen-containing groups (hydroxyl groups of CS and negatively charged oxygen atoms of magnetite) and the N-functional groups in metformin. The fourth method involves electrostatic interactions, which are variable with the solution pH. These interactions are mostly brought on by the attraction between the positively charged protonated nitrogen groups of metformin and the negatively charged groups in the MCS [75,77,78]. Certainly, the immobilization of Cu-NPs in the Cu@MCS nanocomposite has a crucial advantage for improving metformin’s adsorptive removal. Figure 7 presents a schematic illustration of the proposed interactions between metformin and the Cu@MCS nanocomposite.
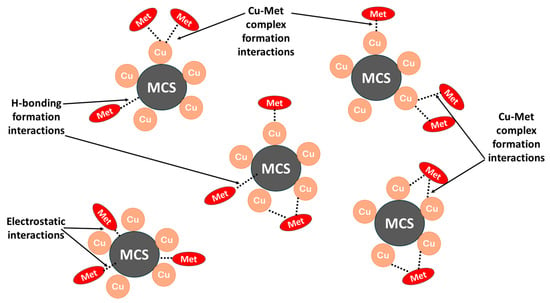
Figure 7.
A schematic diagram depicting the proposed interaction mechanisms between metformin and Cu@MCS nanocomposite.
3.6. Sorption Kinetics
The influence of contact time on the metformin adsorptive uptake by the Cu@MCS was examined in this study using three distinct initial concentrations (10, 20, and 40 mg∙L−1). The three concentrations’ metformin adsorption capabilities are shown against contact time in Figure 8A. The equilibrium between the binary nanocomposite and metformin is reached after 20 min, and the adsorption process proceeds in two consecutive phases. In just five minutes, the first kinetics adsorption stage is completed, while the second step takes ten minutes to complete. For the three distinct starting concentrations, the same pattern is seen. The linear plots of pseudo-second order (PSO), pseudo-first order (PFO), and intraparticle models were used to assess the fitness of the experimental data to assess the kinetics data of the Cu@MCS–metformin adsorption system (Figure 8B–D). Table 1 displays the linear kinetic sorption equations and fitting parameters for the applied models. It shows higher correlation coefficients (R2 = 0.995−0.998) of the PSO rate expression for all examined initial doses of metformin (Figure 8B). The experimental findings (18.20, 31.42, and 60.15 mg g−3) closely align with the adsorption capacity values derived from the PSO model. This confirms that the Cu@MCS nanocomposite removes metformin from water in a rate-controlled manner through chemisorption, just like it does for several other pharmaceutical pollutants [79,80].
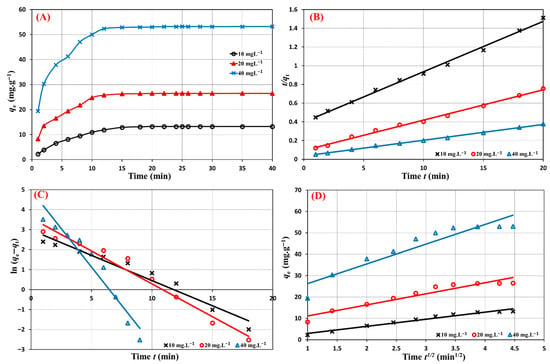
Figure 8.
Contact time effect (A), PSO (B), PFO (C), and intraparticle (D) kinetic models for metformin adsorption removal by Cu@MCS nanocomposite for different initial concentrations (10, 20, 40 mg·L−1) at 298 K.

Table 1.
The linear kinetic equations and parameters for the adsorption of metformin onto Cu@MCS nanocomposite at pH 6 for 15 mg mass dosage.
3.7. Reusability of Cu@MCS Nanocomposite
For adsorbents to be useful, they need to be reusable and have a suitable amount of capacity to adsorb. Figure 8 displays the results of this work, which demonstrates that a 0.15 M HCl solution could desorb almost all the metformin attached to the surface of the Cu@MCS. The desorbed metformin remained consistent for a maximum of six adsorption–desorption cycles. After six cycles, the adsorption capacity started to decrease. Once the recycled Cu@MCS nanocomposite was extracted, its weight was measured. After regenerating the Cu@MCS nanocomposite six times, we found no evidence of substantial mass loss. Moreover, the range of metformin extraction percentages from the recycled Cu@MCS was determined to be comparable to that of the original Cu@MCS nanocomposite. Results of metformin removal efficiencies ranging from 99.8% to 96.1% in the sixth and first cycles of desorption showed that the Cu@MCS nanocomposite’s sorption ability did not substantially decline after six runs (Figure 9). Moreover, FTIR analysis after six regeneration cycles (Figure S2) showed that the characteristic functional groups of Cu@MCS remained intact, confirming the preservation of structural integrity. In addition, no significant peak shifts or intensity losses were observed, indicating that neither repeated HCl regeneration nor pH/ionic strength variations caused detectable chemical degradation of the chitosan backbone, Cu–O, or Fe–O bonds. The remarkable desorption efficiency and reusability of Cu@MCS suggest that the nanocomposite could be a useful, cost-effective nanosorbent for the extraction of metformin from water.
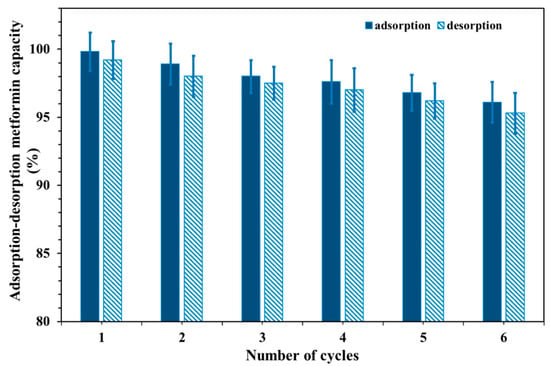
Figure 9.
Recyclability of the metformin–Cu@MCS adsorption system.
3.8. Sorption Isotherms
Understanding of the adsorbent’s affinity, surface properties, and adsorption mechanisms may be gained from the isotherm of metformin sorption onto the Cu@MCS nanosorbent. The adsorption process was examined using the Freundlich, Langmuir, and Temkin adsorption models (Figure 10). These models’ linear shapes are depicted as follows:
where Ce is the metformin’s equilibrium concentration (mg L−1); qm (mg g−1) is the nanocomposite’s maximum adsorption capacity; n represents the parameter of the Freundlich linearity, which establishes if the sorption procedure is preferred; and KL, KF, and KT are the three models’ sorption constants. The Langmuir model provides the best description of a reversible sorption process with the formation of a monolayer on a homogeneous adsorbent, while the formation of multilayers is suggested by the empirical Freundlich model. According to the Temkin model, the chemisorption process is characterized by powerful electrostatic forces between negative and positive charges [80]. Table 2 lists these models’ adsorption isotherms, along with the fitting parameters for each. The Temkin model (0.9881) and the Freundlich model (0.9395) largely fit the experimental data, whereas the correlation coefficients (R2) of metformin for Langmuir (0.9963) fit the data quite well. As a model fitting parameter, the theoretical maximum adsorption capacity (qm) for metformin was determined to be 52.91 mg g−1. The proportion of metformin’s deprotonated amine and imine structural groupings is greater at the experimental pH of 6.0, which promotes complexation with the immobilized Cu-NPs and improves surface adsorption as well as the hydrogen bonding, electrostatic, and π-π EDA interactions. The Cu@MCS nanocomposite’s maximum adsorption capacities for metformin are compared to those of other adsorbents in Table 2. Cu-NPs functionalize the MCS in the developed nanocomposite, giving it a distinct advantage. By forming surface inner complexes with the supporting copper nanoparticles, these innovative moieties significantly increase the qm values. Table 3 displays the results of the literature review on the maximum adsorption capacities of several adsorbents for metformin. The literature review indicates that the expected qmax value for metformin adsorption in this work is similar to the values reported in the literature for metformin adsorption on various adsorbents; nevertheless, Cu@MCS is distinguished by rapid metformin adsorption at ambient pH and temperature. The results of this investigation suggest that the Cu@MCS nanocomposite could be an excellent candidate for use in real systems.
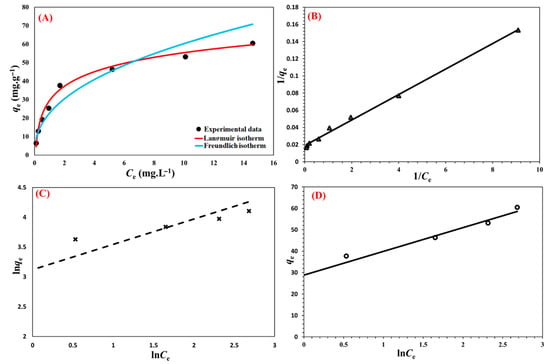
Figure 10.
Nonlinear fit of isotherm models (A) and linear plots of Langmuir (B), Freundlich (C), and Temkin adsorption (D) isotherm models for the uptake of metformin by Cu@MCS nanocomposite at 298.15 K.

Table 2.
Parameter fitting of linear plots for Temkin, Freundlich, and Langmuir sorption isotherms for the Cu@MCS nanocomposite’s sorptive removal of metformin.

Table 3.
Comparison of the Cu@MCS nanocomposite with other nanosorbents for metformin removal in the literature.
3.9. Analytical Performance of Cu@MCS Nanocomposite
The metformin adsorption capacity of the Cu@MCS was evaluated by conducting sorption tests for the removal of metformin in samples of tap water, wastewater, river water, and bottled drinking water. The study’s findings are listed in Table 4. Compared to samples of spiked bottled drinking and tap water, the percentages of metformin removal efficiency from wastewater and river water (99.5–99.9%) were significantly greater. These promoting effects are most likely related to the humic materials in river water and pH differences [87,88].

Table 4.
Metformin’s adsorptive removal from environmental water samples using the Cu@CGO nanocomposite.
In natural aquatic systems, the presence of chloride, carbonate, sulfate, sodium, calcium, magnesium ions, and dissolved oxygen can significantly influence the stability of Cu-NPs. It is important to note, however, that the Cu@MCS adsorbent is not composed of free metallic copper alone but rather Cu-NPs immobilized within the CS framework via coordination with hydroxyl (-OH) and amino (-NH2) functional groups. This immobilization minimizes direct interaction between copper species and the bulk solution, thereby enhancing stability, preserving surface-active states, and preventing uncontrolled leaching or corrosion. Consistent with this stabilization mechanism, our experiments demonstrated negligible copper release (<0.5 mg∙L−1) even after multiple adsorption–desorption cycles, confirming the structural and functional robustness of the material.
Regarding complex environmental matrices such as wastewater and river water, these typically contain suspended solids, microorganisms, and diverse organic and inorganic constituents. To ensure comparability, all samples in this study were filtered through 0.45 µm membranes prior to testing, thereby eliminating coarse particulates. Although microbial and colloidal fouling are recognized challenges in long-term applications, the present work was designed as a controlled batch investigation to demonstrate proof-of-concept adsorption under environmentally relevant chemical conditions, rather than to evaluate large-scale deployment. The consistently high recovery observed can thus be attributed to experimental design and controlled background conditions.
In terms of selectivity, despite the heterogeneous organic composition of wastewater and river water, the remarkable efficiency of metformin removal is attributable to two primary factors: (i) the strong coordination affinity between metformin’s amine groups and copper binding centers and (ii) the cooperative role of natural organic matter in facilitating co-adsorption and π–π interactions. This mechanistic interpretation is further supported by comparative analyses across different water matrices and corroborated by the pH and conductivity data presented in Table 4.
4. Conclusions
A copper-functionalized magnetic chitosan nanocomposite (Cu@MCS) was developed and utilized for the first time to achieve rapid and highly efficient elimination of metformin from environmental water. The embedded Cu-NPs enhanced the material’s performance in two major ways: (i) they improved the dispersion of the composite and preserved its two-dimensional architecture by preventing the aggregation of magnetite particles, and (ii) they promoted strong binding of metformin through the formation of Cu–metformin surface complexes. The adsorption pathway was found to be pH-sensitive and governed by four dominant interactions: hydrogen bonding between metformin amine groups and oxygenated functionalities of the nanocomposite, π–π donor–acceptor interactions with the aromatic domains of chitosan, cation–π interactions, and, most importantly, surface complexation with Cu-NPs. Kinetic evaluation fitted well to the pseudo-second-order model, highlighting the rapid nature of the adsorption process. Under optimized conditions, Cu@MCS removed metformin with a remarkable efficiency of 99.8 ± 2.7% across diverse water matrices. These findings demonstrate that f combines superior adsorption capacity, rapid kinetics, high reproducibility, strong enrichment ability, and excellent reusability, making it a promising adsorbent for pharmaceutical contaminant removal.
Supplementary Materials
The following supporting information can be downloaded at https://www.mdpi.com/article/10.3390/polym17223046/s1, Figure S1: The nitrogen adsorption-desorption hysteresis loop of the Cu@MCS nanocomposite at 77.04 K; Figure S2: FTIR of the Cu@MCS nanocomposite before and after six adsorption-desorption cycles.
Author Contributions
Conceptualization, K.M.A.-A. and A.A.Y.; Methodology, K.M.A.-A. and A.H.A.; Software, A.A.Y.; Validation, A.H.A. and A.A.Y.; Formal analysis, A.A.Y.; Investigation, K.M.A.-A. and A.A.Y.; Resources, K.M.A.-A. and A.A.Y.; Data curation, A.A.Y.; Writing—original draft, K.M.A.-A. and A.H.A.; Writing—review and editing, A.A.Y.; Visualization, K.M.A.-A., A.H.A. and A.A.Y.; Supervision, A.A.Y.; Project administration, A.A.Y.; Funding acquisition, K.M.A.-A. All authors have read and agreed to the published version of the manuscript.
Funding
This work was funded by the University of Jeddah, Jeddah, Saudi Arabia, under grant No. (UJ-24-DR-1960-1). Therefore, the authors thank the University of Jeddah for its technical and financial support.
Institutional Review Board Statement
Not applicable.
Data Availability Statement
The original contributions presented in this study are included in the article/Supplementary Material. Further inquiries can be directed to the corresponding author.
Conflicts of Interest
The authors declare that they have no known competing financial interests or personal relationships that could have appeared to influence the work reported in this paper.
References
- Kumirska, J. Special issue “Pharmaceutical Residues in the Environment”. Molecules 2020, 25, 2941. [Google Scholar] [CrossRef]
- González-González, R.B.; Martínez-Zamudio, L.Y.; Hernández, J.A.R.; González-Meza, G.M.; Parra-Saldívar, R.; Iqbal, H.M.N. Pharmaceutical pollution fingerprinting and waterbodies remediation using waste-derived carbon dots as sustainable advanced nanomaterials. Environ. Res. 2023, 238, 117180. [Google Scholar] [CrossRef]
- Khasawneh, O.F.S.; Palaniandy, P. Occurrence and removal of pharmaceuticals in wastewater treatment plants. Process Saf. Environ. Prot. 2021, 150, 532–556. [Google Scholar] [CrossRef]
- Al Falahi, O.A.; Abdullah, S.R.S.; Hasan, H.A.; Othman, A.R.; Ewadh, H.M.; Kurniawan, S.B.; Imron, M.F. Occurrence of pharmaceuticals and personal care products in domestic wastewater, available treatment technologies, and potential treatment using constructed wetland: A review. Process Saf. Environ. Prot. 2022, 168, 1067–1088. [Google Scholar] [CrossRef]
- Caban, M.; Stepnowski, P. How to decrease pharmaceuticals in the environment? A review. Environ. Chem. Lett. 2021, 19, 3115–3138. [Google Scholar] [CrossRef]
- Fork, M.L.; Fick, J.B.; Reisinger, A.J.; Rosi, E.J. Dosing the coast: Leaking sewage infrastructure delivers large annual doses and dynamic mixtures of pharmaceuticals to urban rivers. Environ. Sci. Technol. 2021, 55, 11637–11645. [Google Scholar] [CrossRef]
- Langford, K.H.; Thomas, K.V. Determination of pharmaceutical compounds in hospital effluents and their contribution to wastewater treatment works. Environ. Int. 2009, 35, 766–770. [Google Scholar] [CrossRef] [PubMed]
- Ambrosio-Albuquerque, E.P.; Cusioli, L.F.; Bergamasco, R.; Gigliolli, A.A.S.; Lupepsa, L.; Paupitz, B.R.; Barbieri, P.A.; Borin-Carvalho, L.A.; De Brito Portela-Castro, A.L. Metformin environmental exposure: A systematic review. Environ. Toxicol. Pharmacol. 2021, 83, 103588. [Google Scholar] [CrossRef]
- Balakrishnan, A.; Sillanpää, M.; Jacob, M.M.; Vo, D.N. Metformin as an emerging concern in wastewater: Occurrence, analysis and treatment methods. Environ. Res. 2022, 213, 113613. [Google Scholar] [CrossRef]
- Zheng, Y.; Shao, Y.; Zhang, Y.; Liu, Z.; Zhao, Z.; Xu, R.; Ding, J.; Li, W.; Wang, B.; Zhang, H. Metformin as an emerging pollutant in the aquatic environment: Occurrence, analysis, and toxicity. Toxics 2024, 12, 483. [Google Scholar] [CrossRef]
- Yan, J.-H.; Xiao, Y.; Tan, D.-Q.; Shao, X.-T.; Wang, Z.; Wang, D.-G. Wastewater analysis reveals spatial pattern in consumption of anti-diabetes drug metformin in China. Chemosphere 2019, 222, 688–695. [Google Scholar] [CrossRef]
- Oosterhuis, M.; Sacher, F.; Ter Laak, T.L. Prediction of concentration levels of metformin and other high consumption pharmaceuticals in wastewater and regional surface water based on sales data. Sci. Total Environ. 2013, 442, 380–388. [Google Scholar] [CrossRef] [PubMed]
- Blair, B.D.; Crago, J.P.; Hedman, C.J.; Treguer, R.J.F.; Magruder, C.; Royer, L.S.; Klaper, R.D. Evaluation of a model for the removal of pharmaceuticals, personal care products, and hormones from wastewater. Sci. Total Environ. 2013, 444, 515–521. [Google Scholar] [CrossRef]
- Scheurer, M.; Michel, A.; Brauch, H.-J.; Ruck, W.; Sacher, F. Occurrence and fate of the antidiabetic drug metformin and its metabolite guanylurea in the environment and during drinking water treatment. Water Res. 2012, 46, 4790–4802. [Google Scholar] [CrossRef]
- Gaffney, V.J.; Cardoso, V.V.; Cardoso, E.; Teixeira, A.P.; Martins, J.; Benoliel, J.M.; Almeida, C.M.M. Occurrence and behaviour of pharmaceutical compounds in a Portuguese wastewater treatment plant: Removal efficiency through conventional treatment processes. Environ. Sci. Pollut. Res. 2017, 24, 14717–14734. [Google Scholar] [CrossRef]
- Al-Odaini, N.A.; Zakaria, M.P.; Yaziz, M.I.; Surif, S.; Abdulghani, M. The occurrence of human pharmaceuticals in wastewater effluents and surface water of Langat River and its tributaries, Malaysia. Int. J. Environ. Anal. Chem. 2013, 93, 245–264. [Google Scholar] [CrossRef]
- Zheng, Q.; Dewapriya, P.; Eaglesham, G.; Reeks, T.; Thompson, J.; Ahmed, F.; Prasad, P.; Thomas, K.V.; Mueller, J.F.; Thai, P.K. Direct injection analysis of oxypurinol and metformin in wastewater by hydrophilic interaction liquid chromatography coupled to tandem mass spectrometry. Drug Test. Anal. 2022, 14, 1519–1524. [Google Scholar] [CrossRef]
- Ramzan, N.U.H.; Shahjahan, K.; Dhillon, R.A.; Khan, N.T.A.; Hashmat, M.B.; Anwer, M.U.; Ahmed, D.; Afzal, F.; Tahir, M.M.; Muzaffar, A. Vitamin B12 deficiency in patients taking metformin: Pathogenesis and recommendations. Cureus 2024, 16, e68550. [Google Scholar] [CrossRef]
- Sayedali, E.; Yalin, A.E.; Yalin, S. Association between metformin and vitamin B12 deficiency in patients with type 2 diabetes. World J. Diabetes 2023, 14, 585–593. [Google Scholar] [CrossRef] [PubMed]
- Koojiman, G.; De-Kreuk, M.K.; Houtman, C.; Van-Lier, J.B. Perspectives of coagulation/flocculation for the removal of pharmaceuticals from domestic wastewater: A critical view at experimental procedures. J. Water Process Eng. 2020, 34, 101161. [Google Scholar] [CrossRef]
- Alamo, A.C.; Pariente, M.I.; Martinez, F.; Molina, R. Trametes versicolor immobilized on rotating biological contactors as alternative biological treatment for the removal of emerging concern micropollutants. Water Res. 2020, 170, 115313. [Google Scholar] [CrossRef]
- Awafa, D.; Ateia, M.; Fujii, M.; Yoshimura, C. Photocatalytic degradation of organic micropollutants: Inhibition mechanisms by different fractions of natural organic matter. Water Res. 2020, 174, 115643. [Google Scholar] [CrossRef] [PubMed]
- Pelalak, R.; Alizadeh, R.; Ghareshabani, E. Enhanced heterogeneous catalytic ozonation of pharmaceutical pollutants using a novel nanostructure of iron-based mineral prepared via plasma technology: A comparative study. J. Hazard Mater. 2020, 392, 122269. [Google Scholar] [CrossRef] [PubMed]
- Rajasekhar, B.; Venkateshwaran, U.; Durairaj, N.; Divyapriya, G.; Nambi, I.M.; Josep, A. Comprehensive treatment of urban wastewaters using electrochemical advanced oxidation process. J. Environ. Manag. 2020, 266, 110469. [Google Scholar] [CrossRef] [PubMed]
- Azmi, S.N.H.; Al-Lawati, W.M.; Al Hoqani, U.H.A.; Al Aufi, E.; Al Hatmi, K.; Al Zadjali, J.S.; Rahman, N.; Nasir, M.; Rahman, H.; Khan, S.A. Development of a citric acid-modified cellulose adsorbent derived from Moringa peregrina leaf for adsorptive removal of citalopram HBr in aqueous solutions. Pharmaceuticals 2022, 15, 760. [Google Scholar] [CrossRef]
- Rahman, N.; Varshney, P. Effective removal of doxycycline from aqueous solution using CuO nanoparticles decorated poly(2-acrylamido-2-methyl-1-propanesulfonic acid)/chitosan. Environ. Sci. Pollut. Res. 2021, 28, 43599–43617. [Google Scholar] [CrossRef]
- Rahman, N.; Varshney, P. Facile synthesis and characterization of Zn(II)- Impregnated chitosan/graphene oxide: Evaluation of its efficiency for removal of ciprofloxacin from aqueous solution. J. Inorg. Organomet. Polym. 2021, 31, 3595–3612. [Google Scholar] [CrossRef]
- Rahman, N.; Varshney, P. Assessment of ampicillin removal efficiency from aqueous solution by polydopamine/zirconium (IV) iodate: Optimization by response surface methodology. RSC Adv. 2020, 10, 20322–20337. [Google Scholar] [CrossRef]
- Mehdimoghadam, H.; Alijani, H.; Pourreza, N. Hydrophilic magnetic chitosan/gelatin hydrogel with enhanced fuel dehydration characteristics: Modeling, kinetic, isotherm and thermodynamic study. Int. J. Biol. Macromol. 2025, 289, 138812. [Google Scholar] [CrossRef]
- Mohammad, A.H.; Radovic, I.; Ivanović, M.; Kijevčanin, M. Adsorption of metformin on activated carbon produced from the water hyacinth biowaste using H3PO4 as a chemical activator. Sustainability 2022, 14, 11144. [Google Scholar] [CrossRef]
- Pap, S.; Shearer, L.; Gibb, S.W. Effective removal of metformin from water using an iron-biochar composite: Mechanistic studies and performance optimisation. J. Environ. Chem. Eng. 2023, 11, 110360. [Google Scholar] [CrossRef]
- Çavuşoğlu, F.C.; Bayazit, Ş.S.; Secula, M.S.; Cagnon, B. Magnetic carbon composites as regenerable and fully recoverable adsorbents: Performance on the removal of antidiabetic agent metformin hydrochloride. Chem. Eng. Res. Des. 2021, 168, 443–452. [Google Scholar] [CrossRef]
- Cusioli, L.F.; Quesada, H.B.; De Brito Portela Castro, A.L.; Gomes, R.G.; Bergamasco, R. Development of a new low-cost adsorbent functionalized with iron nanoparticles for removal of metformin from contaminated water. Chemosphere 2020, 247, 125852. [Google Scholar] [CrossRef] [PubMed]
- Alnajjar, M.; Hethnawi, A.; Nafie, G.; Hassan, A.; Vitale, G.; Nassar, N.N. Silica alumina composite as an effective adsorbent for the removal of metformin from water. J. Environ. Chem. Eng. 2019, 7, 102994. [Google Scholar] [CrossRef]
- De Bhowmick, G.; Briones, R.M.; Thiele-Bruhn, S.; Sen, R.; Sarmah, A.K. Adsorptive removal of metformin on specially designed algae-lignocellulosic biochar mix and techno-economic feasibility assessment. Environ. Pollut. 2021, 292, 118256. [Google Scholar] [CrossRef]
- Neha, S.; Rajput, P.; Remya, N. Biochar from microwave co-pyrolysis of food waste and polyethylene using different microwave susceptors—Production, modification and application for metformin removal. Environ. Res. 2022, 210, 112922. [Google Scholar] [CrossRef]
- Rebitski, E.P.; Aranda, P.; Darder, M.; Carraro, R.; Ruiz-Hitzky, E. Intercalation of metformin into montmorillonite. Dalton Trans. 2018, 47, 3185–3192. [Google Scholar] [CrossRef]
- Biswas, U.K.; Bose, A.; Ghosh, B.; Sharma, S. An insight into chemically modified chitosan and their biological, pharmaceutical, and medical applications. Int. J. Biol. Macromol. 2025, 303, 140612. [Google Scholar] [CrossRef] [PubMed]
- Ashraf, M.H.; Hussain, N.; Muneer, M.A.; Arif, I.; Ali, M.R. Chitosan-based nanomaterials for pharmaceutical waste remediation. In Advances in Chemical Pollution, Environmental Management and Protection; Elsevier: Amsterdam, The Netherlands, 2023; pp. 83–116. [Google Scholar] [CrossRef]
- Tamer, T.M.; Hassan, M.A.; Valachová, K.; Omer, A.M.; El-Shafeey, M.E.; Eldin, M.S.M.; Šoltés, L. Enhancement of wound healing by chitosan/hyaluronan polyelectrolyte membrane loaded with glutathione: In vitro and in vivo evaluations. J. Biotechnol. 2020, 310, 103–113. [Google Scholar] [CrossRef] [PubMed]
- Omer, A.M.; Ahmed, M.S.; El-Subruiti, G.M.; Khalifa, R.E.; Eltaweil, A.S. pH-sensitive alginate/carboxymethyl chitosan/aminated chitosan microcapsules for efficient encapsulation and delivery of diclofenac sodium. Pharmaceutics 2021, 13, 338. [Google Scholar] [CrossRef]
- Zhang, X.; Yang, M.; Xie, D.; Wang, X. Multi-enzyme-immobilized robust self-floating covalent organic framework/chitosan aerogels for the efficient remediation of emerging pollutants in water. J. Environ. Chem. Eng. 2024, 12, 114791. [Google Scholar] [CrossRef]
- Al-Harthy, E.; Shaker, M.A.; Yakout, A.A. Synergetic Enhancement of Copper and Manganese Dioxide Nanoparticles With the biobased Chitosan-crosslinked-graphene Nanocomposite for Potential Adsorptive Remediation of Tetracycline Antibiotics From Food Samples. Mater. Today Commun. 2025, 1, 112930. [Google Scholar] [CrossRef]
- Yuwei, C.; Jianlong, W. Preparation and characterization of magnetic chitosan nanoparticles and its application for Cu (II) removal. Chem. Eng. J. 2011, 168, 286–292. [Google Scholar] [CrossRef]
- Islam, M.N.; Khan, M.N.; Mallik, A.K.; Rahman, M.M. Preparation of bio-inspired trimethoxysilyl group terminated poly (1-vinylimidazole)-modified-chitosan composite for adsorption of chromium (VI) ions. J. Hazard. Mater. 2019, 379, 120792. [Google Scholar] [CrossRef] [PubMed]
- Oliveira, L.C.A.; Rios, R.V.R.A.; Fabris, J.D.; Sapag, K.; Garg, V.K.; Lago, R.M. Clay–iron oxide magnetic composites for the biosorption of contaminants in water. Appl. Clay Sci. 2003, 22, 169–177. [Google Scholar] [CrossRef]
- Graves, D.J. Bioseparations in the magnetically stabilized fluidized bed. Chromatogr. Sci. 1993, 61, 187–207. [Google Scholar]
- Huang, G.L.; Yang, C.; Zhang, K.; Shi, J. Adsorption removal of copper ions from aqueous solution using cross-linked magnetic chitosan bead. Chin. J. Chem. Eng. 2009, 17, 960–966. [Google Scholar] [CrossRef]
- Dyal, A.; Loos, K.; Noto, M.; Chang, S.W.; Spagnoli, C.; Shafi, K.V.P.M.; Ulman, A.; Cowman, M.; Gross, R.A. Activity of Candida rugosa lipase immobilized on -Fe2O3 magnetic nanoparticles. J. Am. Chem. Soc. 2003, 125, 1664–1665. [Google Scholar] [CrossRef]
- Liao, M.H.; Chen, D.H. Preparation characterization of a novel magnetic nano-adsorbent. J. Mater. Chem. 2002, 12, 3654–3659. [Google Scholar] [CrossRef]
- Bulin, C.; Guo, T.; Ma, Y. Spectroscopic and statistical physics elucidation for Cu(II) remediation using magnetic bio adsorbent based on Fe3O4-chitosan-graphene oxide. Int. J. Biol. Macromol. 2024, 276 Pt 1, 133895. [Google Scholar] [CrossRef]
- Saberi-Zare, M.; Bodaghifard, M.A. A Schiff base-functionalized chitosan magnetic bio-nanocomposite for efficient removal of Pb (II) and Cd (II) ions from aqueous solutions. Int. J. Biol. Macromol. 2025, 296, 39794. [Google Scholar] [CrossRef]
- Billah, R.E.; Islam, M.A.; Khan, M.A.; Nazal, M.K.; Bahsis, L.; Achak, M.; Mahmoud, A.E.; Abdul Aziz, M.; Jeon, B.-H. Adsorption of lead(II) onto magnetic chitosan@calcium phosphate rock biocomposite. Mater. Chem. Phys. 2025, 332, 130249. [Google Scholar] [CrossRef]
- Dang, M.; Yin, J.; Wu, M.; Liu, C. Study on the preparation of a novel acrylic modified magnetic chitosan adsorbent and the adsorption behavior on Ga (III). Sep. Purif. Technol. 2025, 358, 130245. [Google Scholar] [CrossRef]
- Bulin, C.; Guo, T.; Zheng, R. Preparation of ion imprinted EDTA modified chitosan-magnetic graphene oxide for selective recovery and adsorption mechanism of Ce(III). Sci. Total Environ. 2025, 962, 178468. [Google Scholar] [CrossRef]
- Alyasi, H.; Wahib, S.; Tong, Y.; Gomez, T.; Mahmoud, K.A. Magnetic MXene chitosan-lignosulfonate composite (Fe3O4@ MCLS) for the reductive removal of Cr(VI) and other heavy metals from water. J. Hazard. Mater. Adv. 2025, 17, 100536. [Google Scholar] [CrossRef]
- Sadat, Z.; Eivazzadeh-Keihan, R.; Kashtiara, A.; Maleki, A. Magnetic gelatin-chitosan hydrogel containing zinc chromite nanoparticles as novel and antibacterial nanostructure for efficient removal of methylene blue and crystal violet from aqueous solutions. J. Environ. Chem. Eng. 2024, 120–126, 114875. [Google Scholar] [CrossRef]
- Jawad, A.H.; Maharani, R.A.; Hapiz, A.; Khadiran, T.; Jani, N.A.; ALOthman, Z.A.; Wilson, L.D. Freeze-drying synthesis of mesoporous magnetic grafted chitosan/calcium oxide nanoparticle for remazol brilliant blue dye removal: A statistical optimization. Int. J. Biol. Macromol. 2025, 286, 138373. [Google Scholar] [CrossRef] [PubMed]
- Rezagholizade-Shirvan, A.; Ghasemi, A.; Mazaheri, Y.; Shokri, S.; Fallahizadeh, S.; Sani, M.A.; Mohtashami, M.; Mahmoudzadeh, M.; Sarafraz, M.; Darroudi, M.; et al. Removal of aflatoxin M1 in milk using magnetic laccase/MoS2/chitosan nanocomposite as an efficient sorbent. Chemosphere 2024, 365, 143334. [Google Scholar] [CrossRef] [PubMed]
- Han, X.; Zhou, F.; Liu, X.; Zheng, W.; Wang, Z.; Yang, S.; Tang, X. Magnetic chitosan supported copper particles as a heterogeneous catalyst for benzaldehyde glycol acetal reaction. Int. J. Biol. Macromol. 2024, 281, 136269. [Google Scholar] [CrossRef]
- Hassanzadeh, N.; Dekamin, M.G.; Valiey, E. A supramolecular magnetic and multifunctional Titriplex V-grafted chitosan organocatalyst for the synthesis of acridine-1,8-diones and 2-amino-3-cyano-4H-pyran derivatives. Nanoscale Adv. 2024, 7, 99–123. [Google Scholar] [CrossRef]
- Tan, Z.; Shi, H.; Zheng, Y.; He, W.; Xu, W.; Cao, Y.; Liao, J.; Dan, Z.; Huang, S. Application of microreactor constructed with micro-mixing channel featuring 3D lateral secondary flow structure for ultra-small particle size preparation of magnetic chitosan nanodrug carriers. Chem. Eng. J. 2024, 499, 156040. [Google Scholar] [CrossRef]
- Yousefi, Q.; Nezamzadeh-Ejhieh, A. A chitosan-based magnetic system for response surface methodology (RSM) optimization of the influencing variables in ciprofloxacin loading/releasing. Int. J. Biol. Macromol. 2024, 283, 137717. [Google Scholar] [CrossRef] [PubMed]
- Namdeo, M.; Bajpai, S.K. Chitosan–magnetite nanocomposites (magnetic chitosan nanoparticles) as magnetic carrier particles for removal of Fe(III) from aqueous solutions. Colloids Surf. A Physicochem. Eng. 2008, 320, 161–168. [Google Scholar] [CrossRef]
- Li, J.; Su, J.; Yang, Q.; Yang, Z. Hydrothermal synthesis of Zr-doped chitosan carbon-shell protected magnetic composites (Zr–Fe3O4@C) for stable removal of Cr(VI) from water: Enhanced adsorption and pH adaptability. Mater. Chem. Phys. 2023, 306, 128057. [Google Scholar] [CrossRef]
- Fedushchak, T.A.; Petrenko, T.V.; Vosmerikov, A.V.; Velichkina, L.M. Inorganic reagents for testing the properties of copper nanopowders. J. Anal. Chem. 2009, 64, 566–570. [Google Scholar] [CrossRef]
- Denkbas, E.; Kilicay, E.; Ozturk, E. Magnetic chitosanmicrospheres: Preparation and characterization. Reac. Func. Polym. 2002, 50, 225–232. [Google Scholar] [CrossRef]
- Zhou, L.M.; Wang, Y.P.; Liu, Z.R.; Huang, Q.W. Characteristics of equilibrium kinetic studies for adsorption of Hg(II), Cu(II), and Ni(II) ions by thiourea modified magnetic chitosan microspheres. J. Hazard. Mater. 2009, 161, 995–1002. [Google Scholar] [CrossRef]
- Chastain, J.; King, R.C., Jr. Handbook of X-Ray Photoelectron Spectroscopy; Perkin-Elmer: Shelton, CT, USA, 1992. [Google Scholar]
- Tang, X.Q.; Zhang, Y.D.; Jiang, Z.W.; Wang, D.M.; Huang, C.Z.; Li, Y.F. Fe3O4 and metal–organic framework MIL-101 (Fe) composites catalyze luminol chemiluminescence for sensitively sensing hydrogen peroxide and glucose. Talanta 2018, 179, 43–50. [Google Scholar] [CrossRef]
- Gao, W.; Zhong, D.; Xu, Y.; Luo, H.; Zeng, S. Nano zero-valent iron supported by macroporous styrene ion exchange resin for enhanced Cr (VI) removal from aqueous solution. J. Dispers. Sci. Technol. 2020, 2, 1197–1207. [Google Scholar] [CrossRef]
- Al-Janabi, N.K.W.S.; Mahmood, N.A.K.; Luaibi, N.H.M. Determination of the Dissociation Constants of Metformin from a Second Derivative UV Spectrum. Int. J. Res. Pharm. Sci. 2020, 11, 790–796. [Google Scholar] [CrossRef]
- Yakout, A.A.; Alshutairi, A.M.; Albishri, H.M.; Alshitari, W.H.; Basha, M.T. Cu-nanoparticles graphene nanocomposite: A robust and efficient nanocomposite for micro-solid phase extraction of trace aflatoxins in different foodstuffs. Food Chem. 2024, 440, 138239. [Google Scholar] [CrossRef]
- Shaker, M.A.; Alshitari, W.H.; Basha, M.T.; Asim, M.; Albishri, H.M.; Bhawani, S.A.; Yakout, A.A. Synergetic impact of copper nanoparticles and polyaniline reinforced graphene oxide nanocomposite on the sequestration of tetracycline antibiotic from milk and wastewaters samples. Mater. Today Commun. 2024, 38, 107869. [Google Scholar] [CrossRef]
- Yakout, A.A.; Mahmoud, M.E. Fabrication of magnetite-functionalized-graphene oxide and hexadecyltrimethyl ammonium bromide nanocomposite for efficient nanosorption of sunset yellow. Mater. Sci. Eng. C 2018, 92, 287–296. [Google Scholar] [CrossRef]
- Yakout, A.A.; Alshitari, W.; Akhdhar, A. Synergistic effect of Cu-nanoparticles and β-cyclodextrin functionalized reduced graphene oxide nanocomposite on the adsorptive remediation of tetracycline antibiotics. Carbohydr. Polym. 2021, 273, 118528. [Google Scholar] [CrossRef]
- Zhang, X.; Lin, X.; He, Y.; Chen, Y.; Luo, X.; Shang, R. Study on adsorption of tetracycline by Cu-immobilized alginate adsorbent from water environment. Int. J. Biol. Macromol. 2019, 12, 418–428. [Google Scholar] [CrossRef] [PubMed]
- Zhuang, Y.; Yu, F.; Ma, J.; Chen, J.H. Enhanced adsorption removal of antibiotics from aqueous solutions by modified alginate/graphene double network porous hydrogel. J. Colloid Interface Sci. 2017, 507, 250–259. [Google Scholar] [CrossRef]
- Han, X.L.; Wang, W.; Ma, X.J. Adsorption characteristics of methylene blue onto low-cost biomass material lotus leaf. Chem. Eng. J. 2011, 171, 1–8. [Google Scholar] [CrossRef]
- Ma, Q.; Song, T.-Y.; Yuan, P.; Wang, C.; Su, X.-G. QDs-labeled microspheres for the adsorption of rabbit immunoglobulin G and fluoroimmuno-assay. Colloids Surf. B 2008, 64, 248–254. [Google Scholar] [CrossRef] [PubMed]
- Quesada, H.B.; De Araújo, T.P.; Cusioli, L.F.; De Barros, M.A.S.D.; Gomes, R.G.; Bergamasco, R. Evaluation of novel activated carbons from chichá-do-cerrado (Sterculia striata St. Hil. et Naud) fruit shells on metformin adsorption and treatment of a synthetic mixture. J. Environ. Chem. Eng. 2020, 9, 104914. [Google Scholar] [CrossRef]
- Zhu, S.; Liu, Y.G.; Liu, S.B.; Zeng, G.M.; Jiang, L.H.; Tan, X.F.; Zhou, L.; Zeng, W.; Li, T.T.; Yang, C.P. Adsorption of emerging contaminant metformin using graphene oxide. Chemosphere 2017, 179, 20–28. [Google Scholar] [CrossRef]
- Niaei, H.A.; Rostamizadeh, M. Adsorption of metformin from an aqueous solution by Fe-ZSM-5 nano-adsorbent: Isotherm, kinetic and thermodynamic studies. J. Chem. Thermodyn. 2020, 142, 106003. [Google Scholar] [CrossRef]
- Oluwatimileyin, S.J.; Asiata Omotayo, I.; Olugbenga, S.B. Metformin adsorption onto activated carbon prepared by acid activation and carbonization of orange peel. Int. J. Phytoremediat. 2022, 25, 125–136. [Google Scholar] [CrossRef]
- Kalumpha, M.; Guyo, U.; Zinyama, N.P.; Vakira, F.M.; Nyamunda, B.C. Adsorptive potential of Zea mays tassel activated carbon towards the removal of metformin hydrochloride from pharmaceutical effluent. Int. J. Phytoremed. 2020, 22, 148–156. [Google Scholar] [CrossRef] [PubMed]
- Elamin, M.R.; Abdulkhair, B.Y.; Algethami, F.K.; Khezami, L. Linear and nonlinear investigations for the adsorption of paracetamol and metformin from water on acid-treated clay. Sci. Rep. 2021, 11, 13606. [Google Scholar] [CrossRef] [PubMed]
- Zhao, Y.; Geng, J.; Wang, X.; Gu, X.; Gao, S. Adsorption of tetracycline onto goethite in the presence of metal cations and humic substances. J. Colloid Interface Sci. 2011, 361, 247–251. [Google Scholar] [CrossRef] [PubMed]
- Yakout, A.A.; Basha, M.T.; Al-Raimi, D.S.; Aljadaani, A.H.; Zainy, F.M.A. Synergistic impact of Cu and MnO2 nanoparticles in Cu/MnO2/chitosan/graphene oxide hybrid nanocomposite for improved antibacterial activity and fast adsorption of environmentally relevant anionic and cationic dyes from industrial wastewater. Int. J. Biol. Macromol. 2025, 1, 144839. [Google Scholar] [CrossRef]
Disclaimer/Publisher’s Note: The statements, opinions and data contained in all publications are solely those of the individual author(s) and contributor(s) and not of MDPI and/or the editor(s). MDPI and/or the editor(s) disclaim responsibility for any injury to people or property resulting from any ideas, methods, instructions or products referred to in the content. |
© 2025 by the authors. Licensee MDPI, Basel, Switzerland. This article is an open access article distributed under the terms and conditions of the Creative Commons Attribution (CC BY) license (https://creativecommons.org/licenses/by/4.0/).