1. Introduction
High-performance elastomer products are generally preferred for applications subjected to extreme dynamic or cyclical loads, such as seals, damping elements, hoses, and tyres. In order to meet the high demands placed on the material in this respect, rubber compounds consist of a large number of ingredients [
1]. The essential ones include: (i) the base polymer, (ii) active fillers such as carbon black or silica, and (iii) the curing system, generally based on sulfur or peroxide. Sulfur vulcanization is the oldest and remains the most widely considered system for curing of unsaturated elastomers [
2]. In this sense, an effective and rapid curing reaction of rubber materials with sulfur occurs only in the presence of accelerators and activators. Both influence the kinetic parameters (especially the curing speed), the processing safety of the rubber compound, and the amount of sulfur needed for the optimal crosslinked structure of the elastomeric product. Thus, the type and amount of accelerator and the ratio of the accelerator to sulfur in the rubber compound impacts the final part properties, because of its influence on the sulfur chain composition [
2,
3,
4,
5,
6,
7,
8]. In this context, a distinction is made between poly-, di-, and monosulfidic crosslinks, which are formed during the vulcanization process. In addition to the selected crosslinking system, the process parameters also have a significant influence on the type of crosslinks formed in the product. For example, elevated mold temperatures and/or prolonged vulcanization times result in a dissociation reaction of the polysulfidic crosslinks. These are converted to di- and monosulfidic bonds, resulting in a distinct crosslink length distribution, an increased crosslink density, and finally leading to a different part quality [
6,
9,
10,
11,
12,
13,
14,
15,
16,
17,
18,
19]. Overall, it can be concluded that (i) the sulfur crosslinking only proceeds efficiently if accelerators and activators are used, as this optimizes the reaction kinetics with regard to a faster conversion (curing speed), (ii) the selected vulcanization temperature initiates the rapid start of the crosslinking reaction and affects the resulting sulfur network, and (iii) the quality of a part is ultimately affected by a different sulfur network.
The Rubber Process Analyzer (RPA) is mainly employed in industry to record the onset and progress of the crosslinking reaction. It is a dynamic–mechanical testing device consists of a biconical test chamber to achieve an almost homogeneous distribution of shear deformation. To characterize the isothermal crosslinking reaction, the test system is first heated, e.g., to 160 °C; then, the specimen is loaded, and the measurement starts. During the test, the lower test chamber is subjected to a sinusoidal strain oscillation. At the same time, the torque transmitted by the sample is detected and recorded by the upper test chamber [
20,
21]. Currently, the state-of-the-art practice is to normalize the curing characteristics, determined indirectly via the transmitted torque, at several isothermal temperatures. This involves normalizing each isotherm between 0 (non-crosslinked) and 1 (fully crosslinked), disregarding any differences in the minimum and maximum transmitted torque. On the one hand, this is carried out to define suitable manufacturing parameters, e.g., mold temperature and vulcanization time, and, on the other hand, to approximate the reaction kinetics with suitable models in order to enable the calculation of the degree of cure by means of a simulation routine.
Simulation routines have been successfully applied in the polymer sector for decades to virtually optimize real manufacturing processes [
22]. These optimizations include: (i) the basic polymer-compatible part design, (ii) the choice of injection point, injection system, and number of cavities, (iii) the design of the complex injection mold, including the selection and type of the temperature control system, and (iv) the virtual prediction of the operation point. These virtual representations of real manufacturing processes can be considered, for example, to reduce the cost of any changes to the complex injection mold and to minimize the amount of material used when sampling the mold based on an already virtually optimized operating point. Although the utilization of simulation routines is already state of the art and has been in application for several decades, there are still challenges to be solved, especially in the area of reactive materials such as elastomers. The reaction kinetics is normally only estimated indirectly via the transmitted torque under isothermal conditions, which do not occur in real processes. In addition, the difference in the maximum transmitted torque that arises from different vulcanization temperatures is neglected by the normalization step. The associated loss of information is known, but it is completely ignored in the approximation. Furthermore, a filling and curing simulation is not carried out to directly compute the part quality, e.g., the permanent deformation, the dynamic–mechanical properties, or the fracture-mechanical behavior, but rather the degree of cure. The degree of cure is then either correlated with part quality depending on the operator or the quality is estimated by exporting relevant information with the help of other calculation programs. However, the processing history, i.e., the speed of the crosslinking reaction, which is largely responsible for the formation of poly-, di-, and monosulfidic network sites, for example, is not taken into account. Notwithstanding, this is of great importance in real production, as it significantly influences the final product properties.
This work continues the preliminary findings of Hornbachner [
23] as well as of Traintinger et al. [
12] and addresses precisely the challenges mentioned above by first manufacturing and characterizing parts with different degrees of cure. This was conducted to highlight the reliability of the assumptions made on the basis of normalized reaction isotherms with regard to part quality. Based on this, an innovative modeling approach was developed to provide, for the first time, the possibility of calculating part quality directly during filling and curing simulation, taking into account the processing history.
2. Theoretical Insights into an Innovative Modeling Approach
Especially in the area of process simulation of thick-walled parts, such as some elastomer products, a homogeneous temperature distribution cannot be assumed. Due to the low thermal conductivity of filled rubber compounds, i.e.,
–
in common manufacturing temperature ranges [
24,
25], huge temperature differences occur within the molded part during the crosslinking reaction. The material in contact with the hot mold surface therefore has a significantly higher temperature in comparison to the material in the center of the thick-walled part. These temperature inhomogeneities not only trigger the start of the crosslinking reaction at different times, but also significantly influence its speed. As a result, the crosslinking reaction does not take place at a constant speed throughout the whole part, but it takes place at different speeds at each volume element.
While developing the present innovative modeling approach, the following question arose: If a crosslinking reaction is carried out under ideal conditions with a Rubber Process Analyzer (RPA) at an isothermal temperature of
until the plateau is reached and then the temperature rises by
for
, is it possible to achieve the same transmitted torque
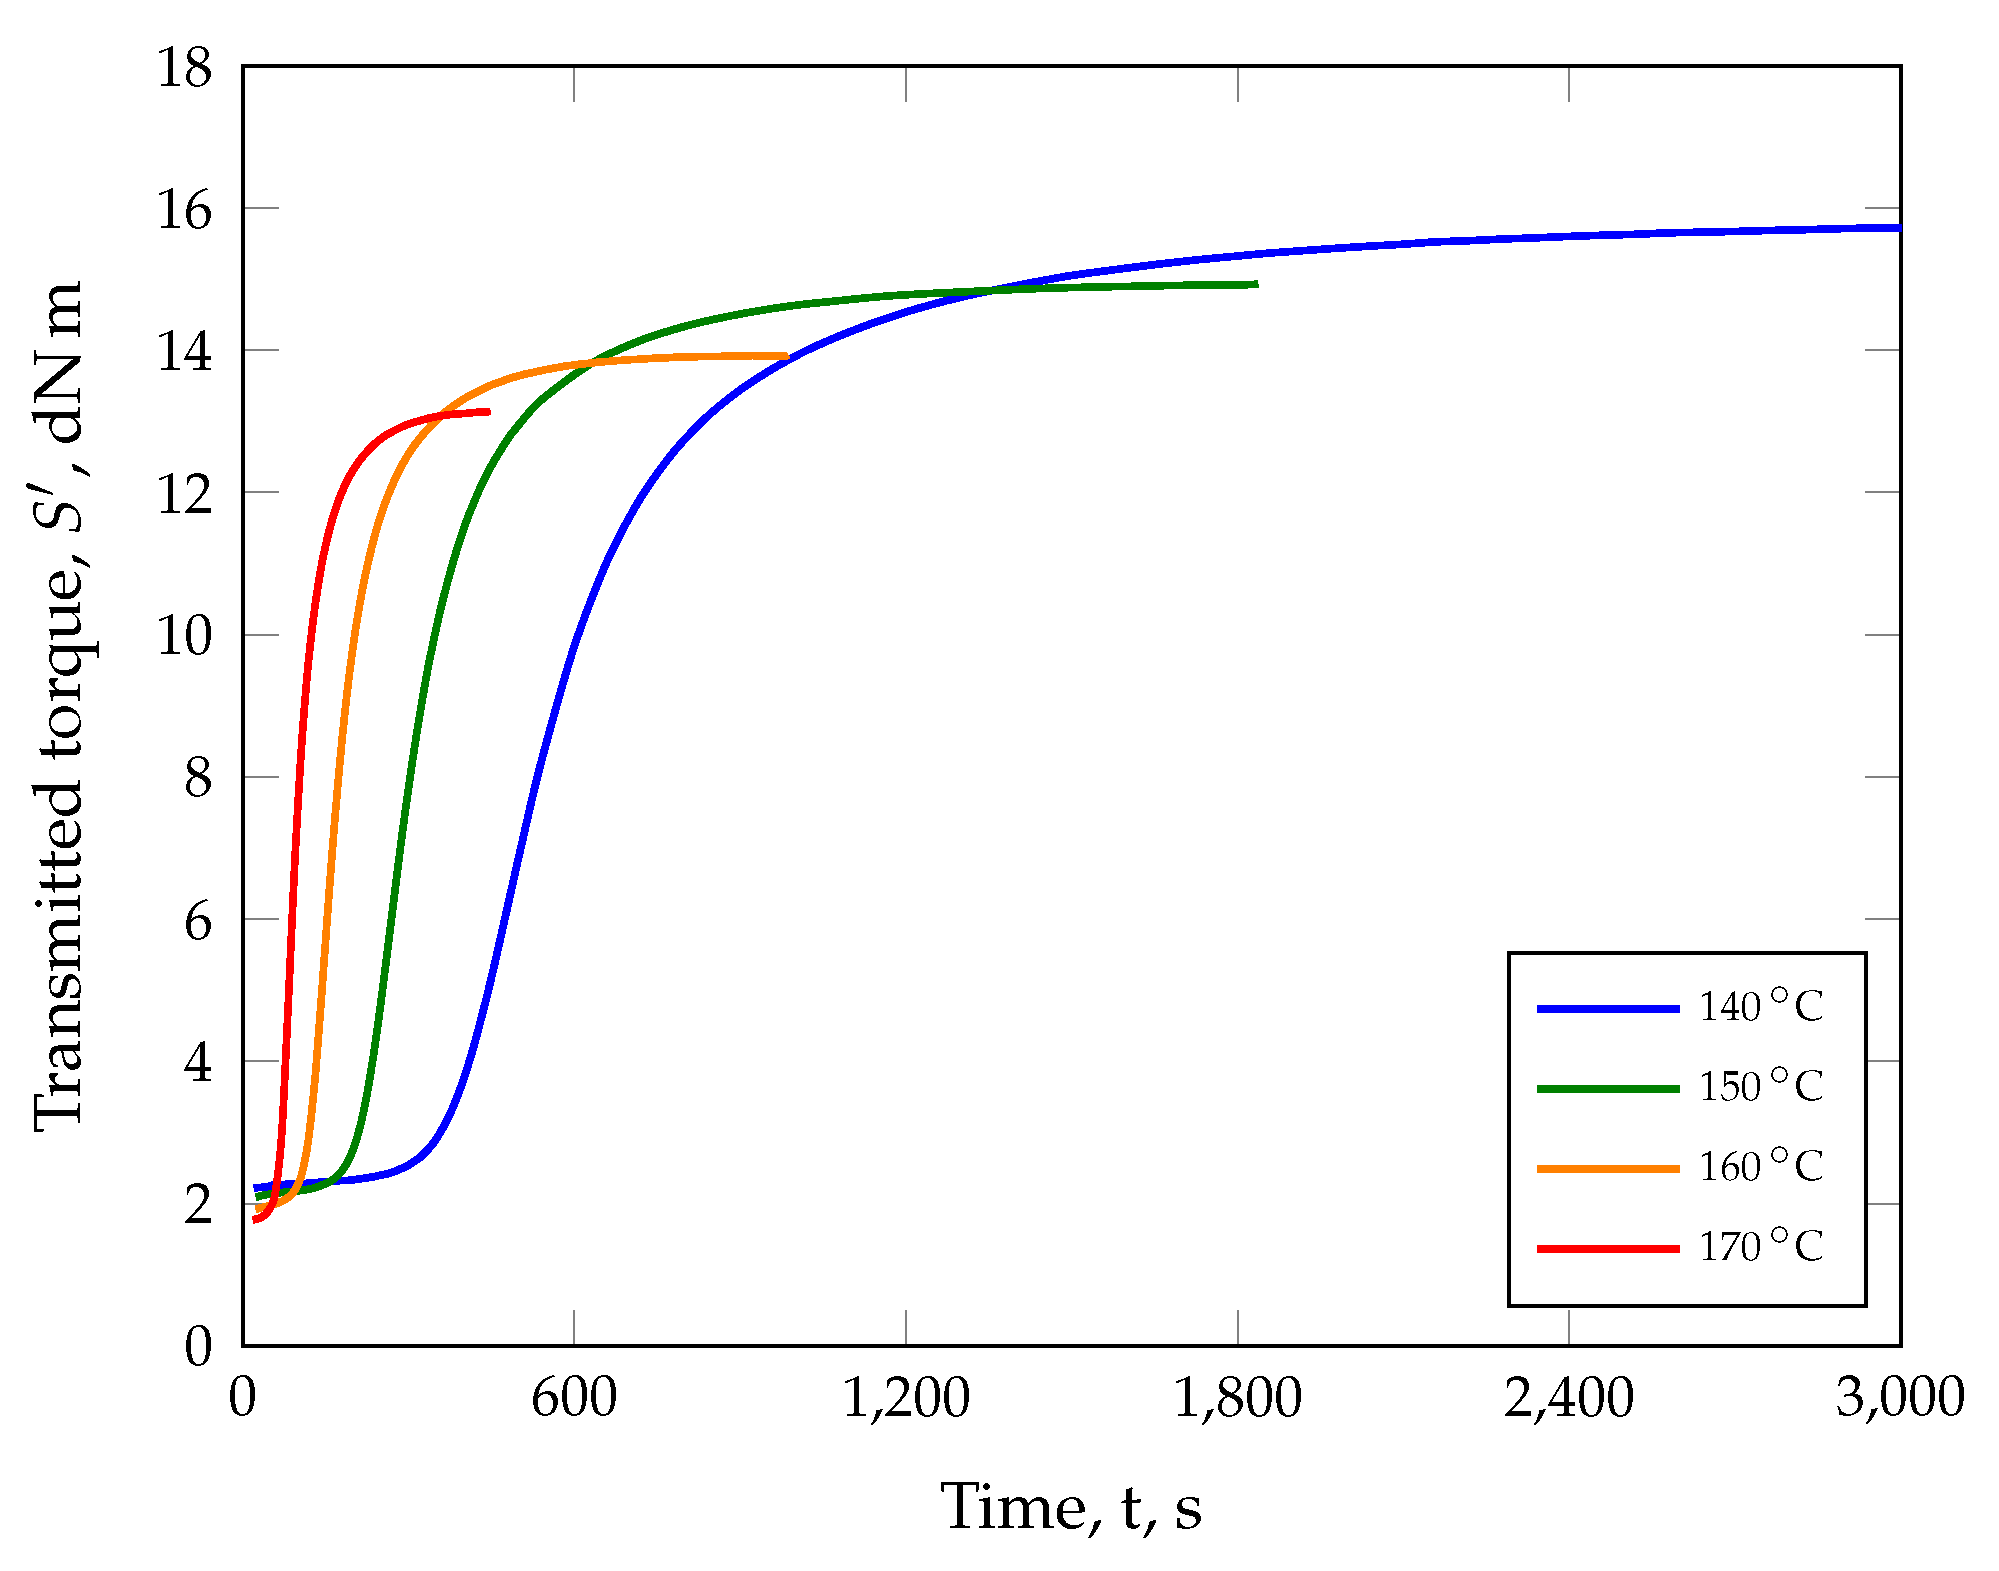
with an isothermal analysis of 160 °C at the end of the measurement? As can be seen in
Figure 1, this is not the case. After applying the two temperature programs, there is a difference between 150 °C and 160 °C in the maximum transmitted torque of
(7%) while, after the temperature rise, the difference consists of
(9%) at the end of the analysis. Despite the fact that the same material was tested and the temperature was constant for a longer period of time at the end of the experiment, the mechanical response was different.
Moreover, this material behavior is still ignored in state-of-the-art models of reaction kinetics. Although it is known that the maximum transmitted torque decreases with increasing test temperature, as shown in
Figure 1 and observed by Khang et al. [
26] for natural rubber as well as by Hornbachner [
23] for styrene–butadiene rubber and ethylene propylene diene rubber, for example, these observations are first normalized and then approximated according to models by Deng Isayev [
27,
28] or Kamal and Sourour [
29]. The associated loss of mechanical information based on the normalization step is accepted.
As a result, it is not recommended to correlate a degree of cure simulated on the basis of these assumptions with a part quality, e.g., the compression set.
To overcome these challenges, Weinhold proposed a phenomenological modeling approach. This approach includes the average curing speed
to optimally take into account the process history, i.e., the locally different temperature development impacts the speed of the crosslinking reaction and thus the associated mechanical material response. The average curing speed (ACS) model is given by Equation (
1) and the boundary condition by Equation (
2).
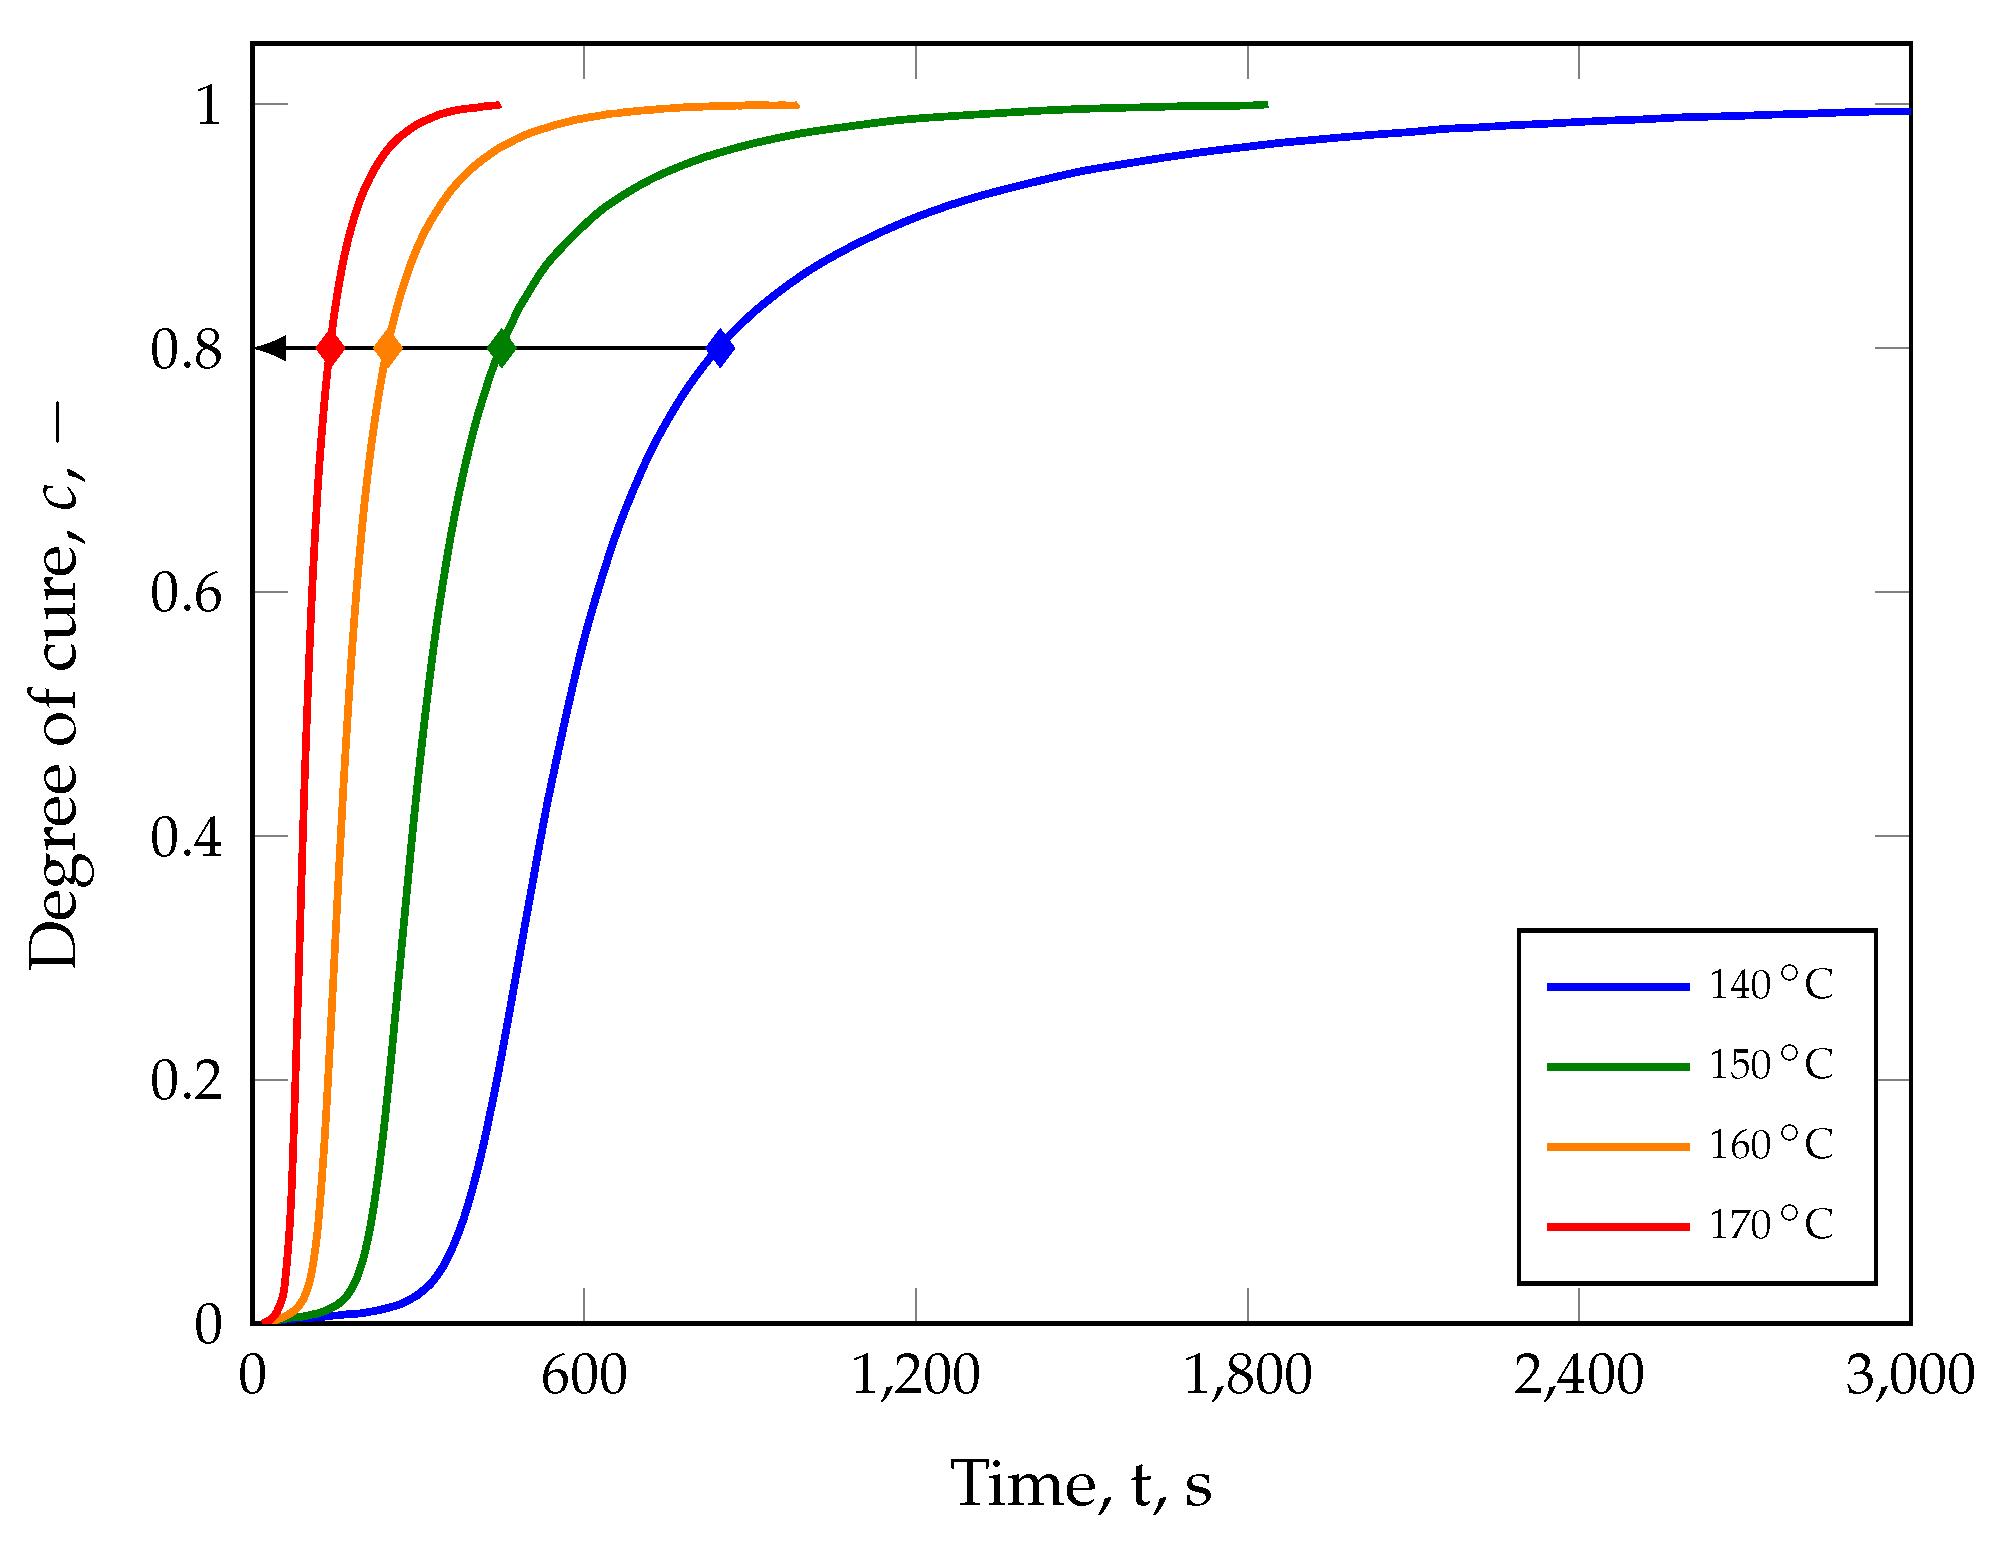
The restriction to a minimum and maximum degree of cure ensures that only the ongoing curing reaction, i.e., from the incubation time at a given temperature T to the maximum degree of cure at time , is taken into account. All times before and after the main curing reaction, i.e., when a degree of cure of 100% is reached (for example, reversion or marching modulus), are neglected in the calculation. The average curing speed therefore captures the temperature-dependent curing speed during the vulcanization process. At isothermal temperatures, i.e., given during the characterization of the curing reaction with an RPA, the average curing speed is simplified to the secant gradient from the start of curing to its end.
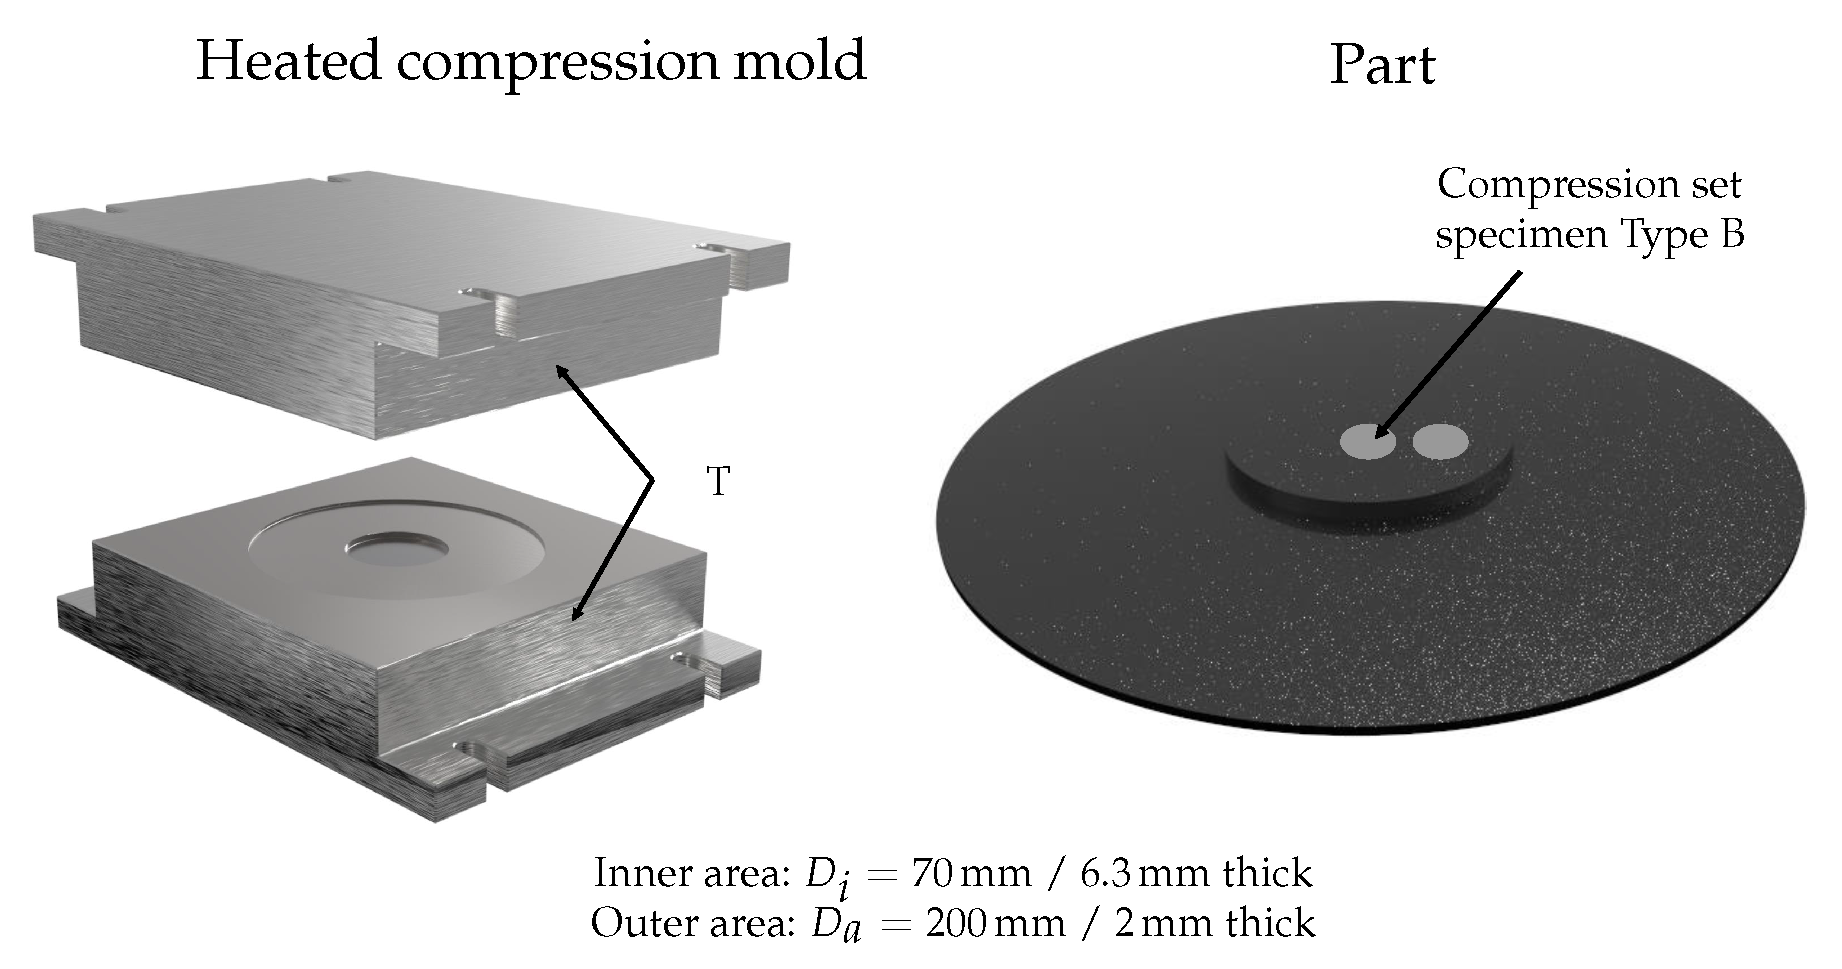
However, constant mass temperature cannot be assumed in real production processes. Consequently, the ACS model must be calibrated once with part quality parameters. Initially, the calibration process requires that parts are manufactured at different mold temperatures and curing times in order to ensure various curing states. After this step, all manufactured parts are subjected to quality control (
Figure 2). The part quality can either be the compression set, for example, the tensile test, derived from dynamic–mechanical analysis, such as the dynamic spring constant [
30], or any other quality-relevant parameter.
Finally, Equation (
1) can be applied to calculate the average curing speed based on isothermal curing characteristics. In simple terms, the secant slope is calculated based on RPA measurements at each manufacturing temperature between
and the production time corresponding to the degree of cure. This procedure will be carried out for all settings.
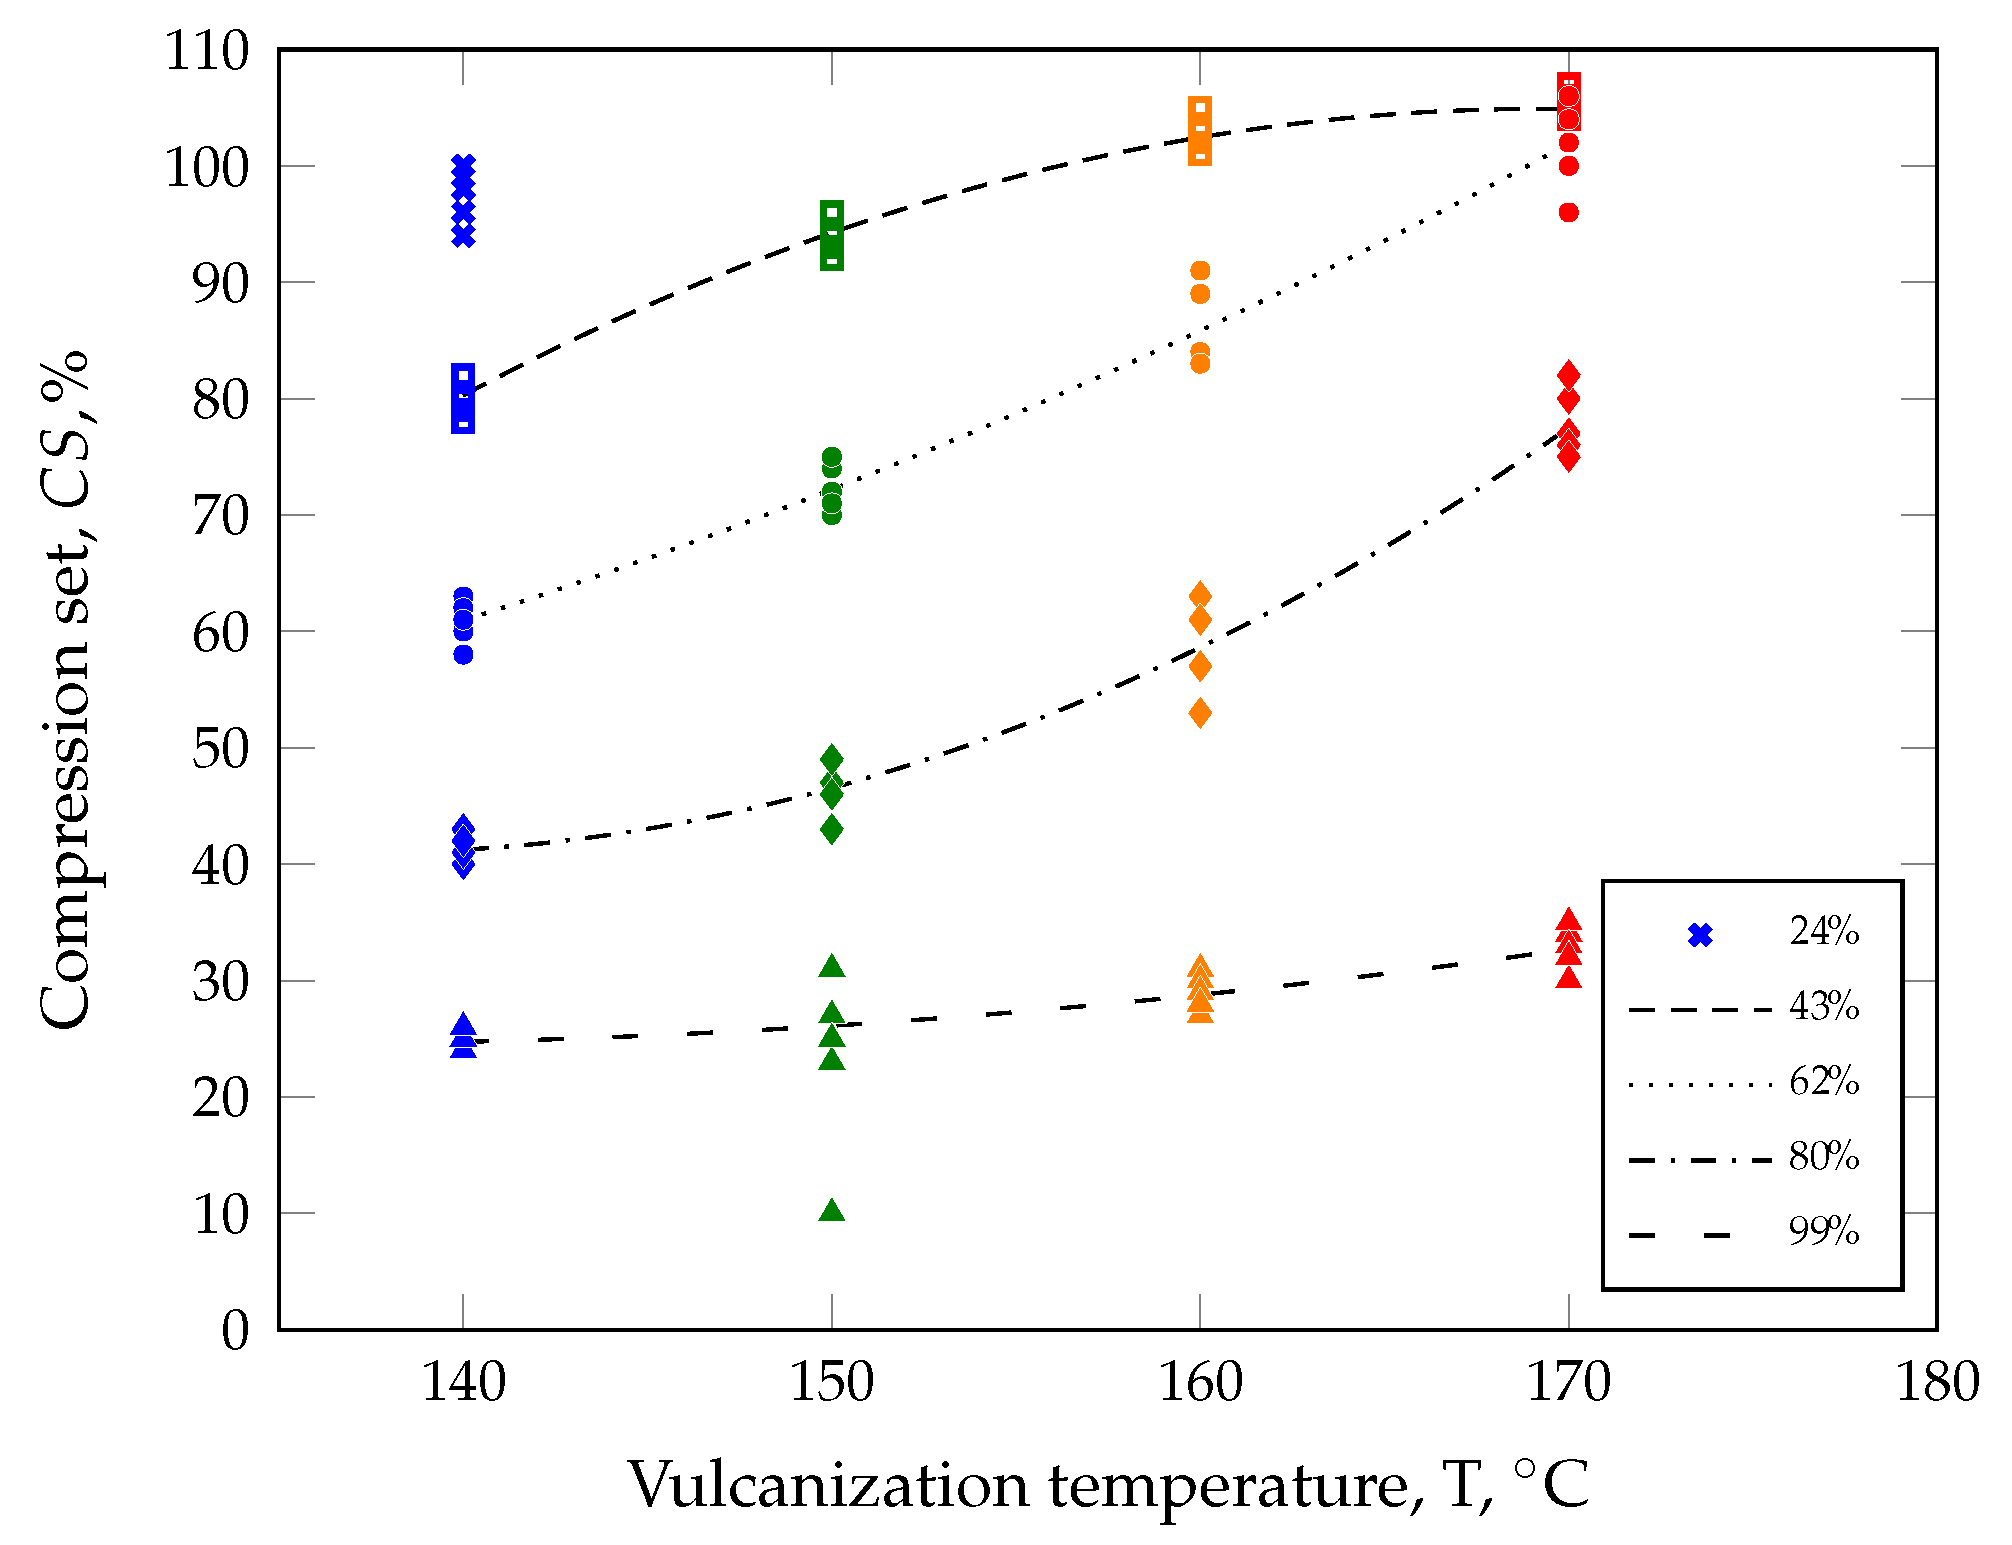
Instead of including the temperature as a parameter in the innovative ACS model, the part quality will be plotted as a function of the average curing speed and subsequently approximated with a suitable model (see
Figure 3).
For this purpose, an approximation model, e.g., a model with the lowest standard error of the regression, should be selected for the numerical approximation of the part quality. As an example, a quadratic model (Equation (
3)) is proposed for calculating the part quality in the demonstration case (
Figure 3) employing a quality parameter
Q.
Here, the model parameters
,
, and
with the indices
are estimated with the method of minimizing the error squares. With the model parameters specified in
Table 1, the quadratic model is able to describe the characterized part quality behavior very well with an adjusted coefficient of determination of
87%, as shown in
Figure 3 (dashed curve).
All of the aforementioned steps are essential for the accurate simulation of part quality based on the processing history. The locally resolved degree of cure and the average curing speed can be calculated with the aid of a process simulation, i.e., the ACS model is fully implemented in the SIGMASOFT® v (SIGMA Engineering GmbH, Aachen, Germany) simulation routine, and subsequently serve as input variables in the innovative ACS model. As a result, the locally resolved part quality is plotted instead of the degree of cure, which replaces the homogeneous mechanical quality criteria for structural analysis.
5. Application and Validation of the Average Curing Speed Model
As described in
Section 2, the coefficients required for the ACS model were first calculated; then, the part quality was simulated for two selected settings, and finally compared with the results obtained for compression-molded parts.
For the initial calibration of the ACS model, the average curing speed
was calculated as the secant slope based on the reaction kinetics shown in
Figure 8 and for each vulcanization time (see
Table 4). For example, the secant slope was computed as
for a part manufactured at
with a defined degree of cure of
%. In this case, it should be noted that the incubation time was selected at a degree of cure of
%. However, approximation of the compression set values was achieved from the calculated average curing speeds
, degree of cure
c, and Equation (
3).
Figure 10 shows that
describes the measured data with an adjusted
of
%.
Subsequently, a filling and curing simulation was carried out applying the ACS model parameters shown in
Table 6.
To verify the applicability of the ACS model,
Figure 11 compares the CS values of all parts manufactured at different vulcanization temperatures and a defined degree of cure of
%.
The permanent deformation median values for parts vulcanized at and are % and % (black diamonds), respectively, and are in line with the expected trend.
Overall, the average part quality simulated with the innovative average curing speed model provides an excellent prediction of the real molding process. The predicted mean CS values (green crosses) of the evaluation area, i.e., volume of a CS specimen, are
% and 73% as well as the absolute deviation from the median of the characterized parts is
% and
%. In addition, the simulated CS values are within the range of the tested parts, confirming the applicability of the ACS model. Another advantage of the ACS model is shown in
Figure 12. To assess the part quality, it is no longer necessary to assume the part quality based on the simulated degree of cure. Instead, the quality can be mapped individually for each volume element, which will enable new optimization strategies for part design in the future.
To conclude, the validation highlighted the enormous potential of the innovative modeling approach. Beyond this, it was shown that the curing speed is a suitable measure for the quality simulation of the compression molding process. However, to discuss possible limitations of the model, in particular the approximation of part quality as a function of the degree of cure and average curing speed based on a quadratic model, the authors investigated the more complex rubber injection molding process [
35]. It turned out that, in this case, a quadratic model was not suitable for the approximation. Instead, a logistic model was chosen to link the part quality to the degree of cure and the average curing speed. It should be noted that any approximation model can be chosen, but only the one with the lowest standard error of regression should be considered. Another limitation could be that there is no suitable model to approximate the part quality for a really unusual material behavior, e.g., by considering material blends or when there is no change in part quality depending on the degree of cure. Furthermore, the authors limited their investigations to sulfur-based crosslinking systems. In further studies, peroxide- or bisphenol A-based crosslinking systems have to be considered in order to ensure the general validity of the innovative modeling approach. Overall, it was demonstrated that the model is valid for both the compression molding process as well as for the complex injection molding process, ensuring the transferability of application and enabling the processing history to be taken into account in the calculation of part quality for the first time.


 ,
, 

