
Sustainable Rubber Solutions: A Study on Bio-Based Oil and Resin Blends

 ,
,  ,
,  and
and
Abstract
1. Introduction
2. Materials and Methods
2.1. Materials
2.2. Mixing Procedure
2.3. Analytical Testing
2.3.1. Vulcanization
2.3.2. Cured Payne Effect
2.3.3. Hardness
2.3.4. Stress–Strain Behavior
2.3.5. Dynamical Properties
2.3.6. DIN Abrasion
3. Results and Discussion
3.1. Various Oil and Resin Ratios
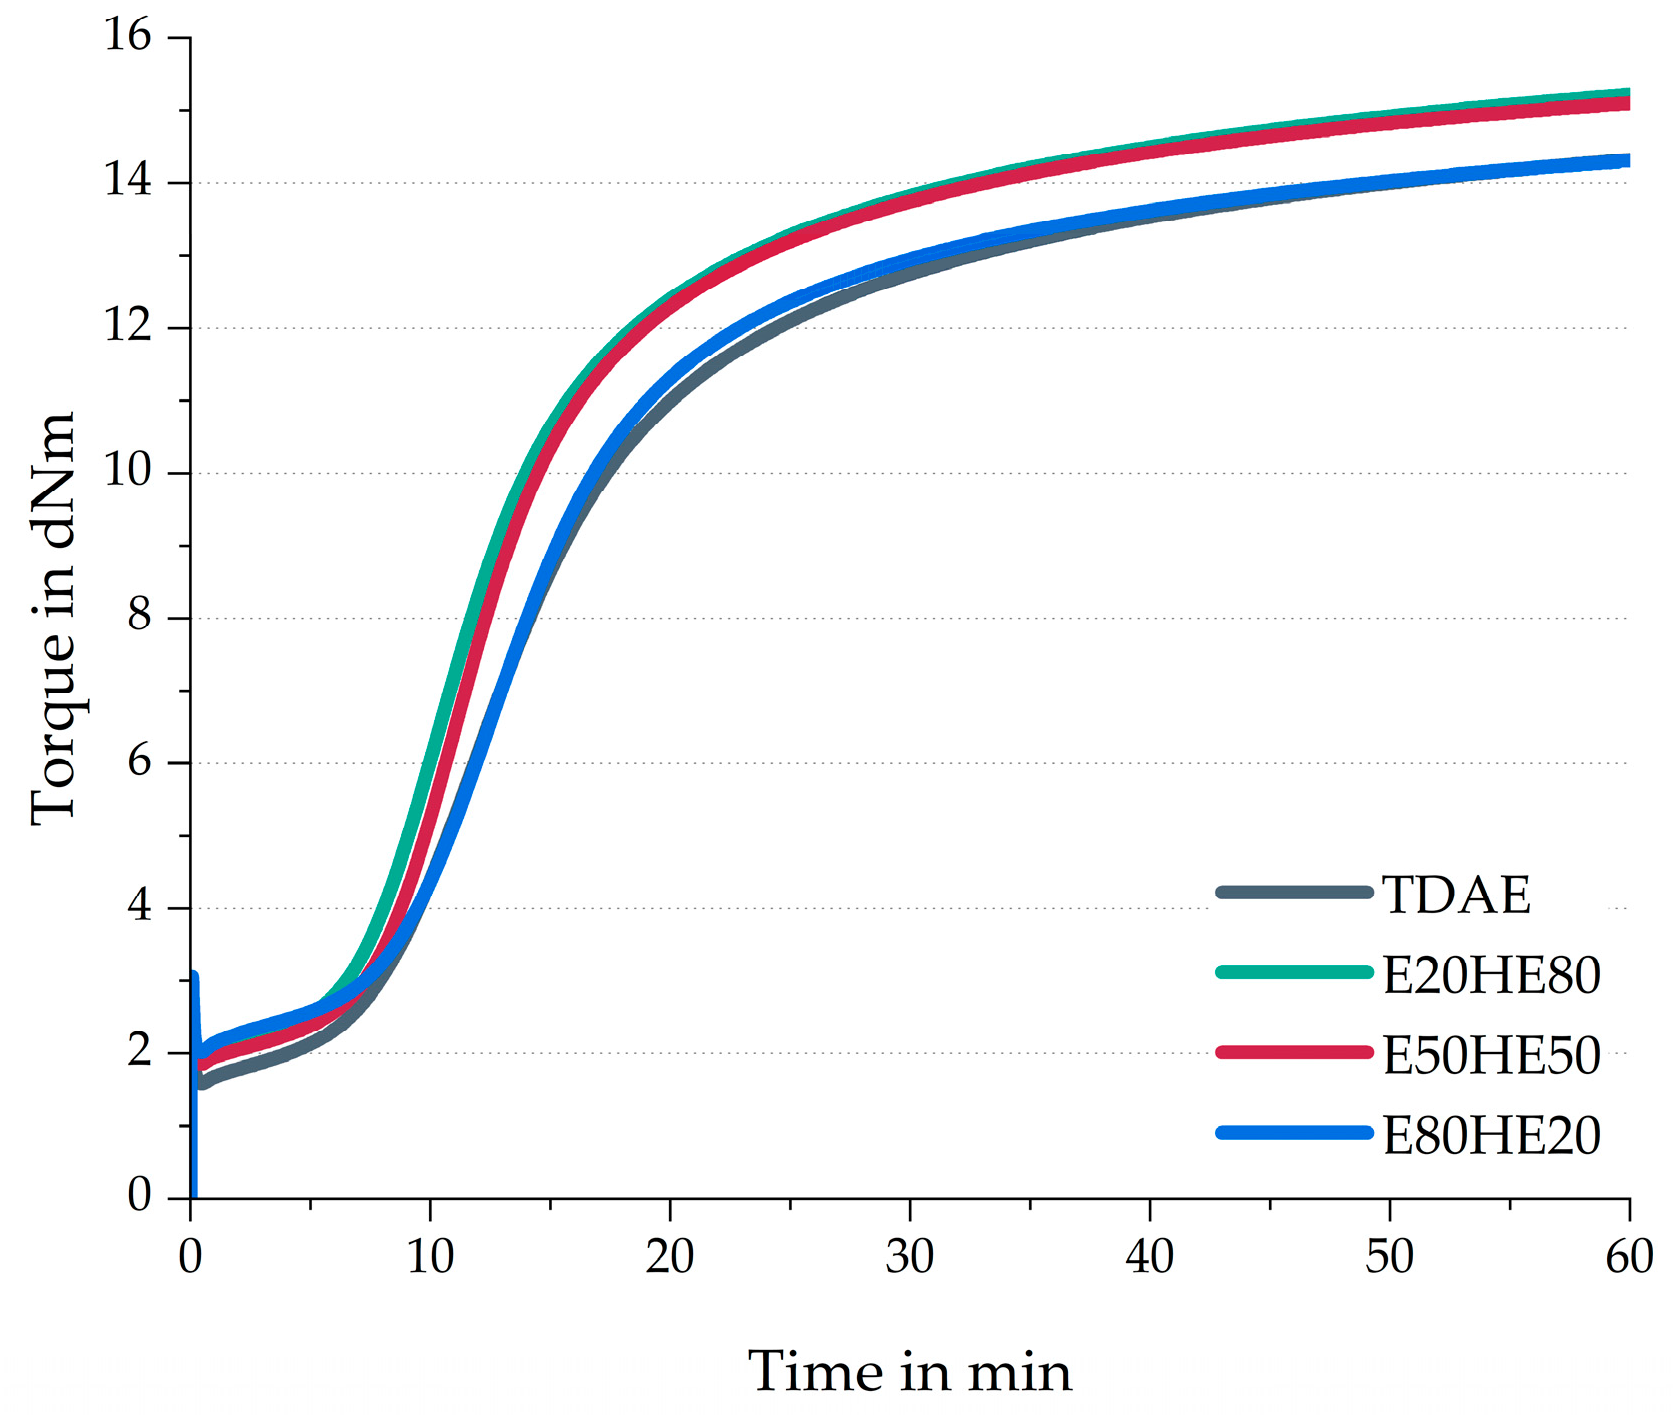
3.1.1. Rheometer Curves and Payne Effect
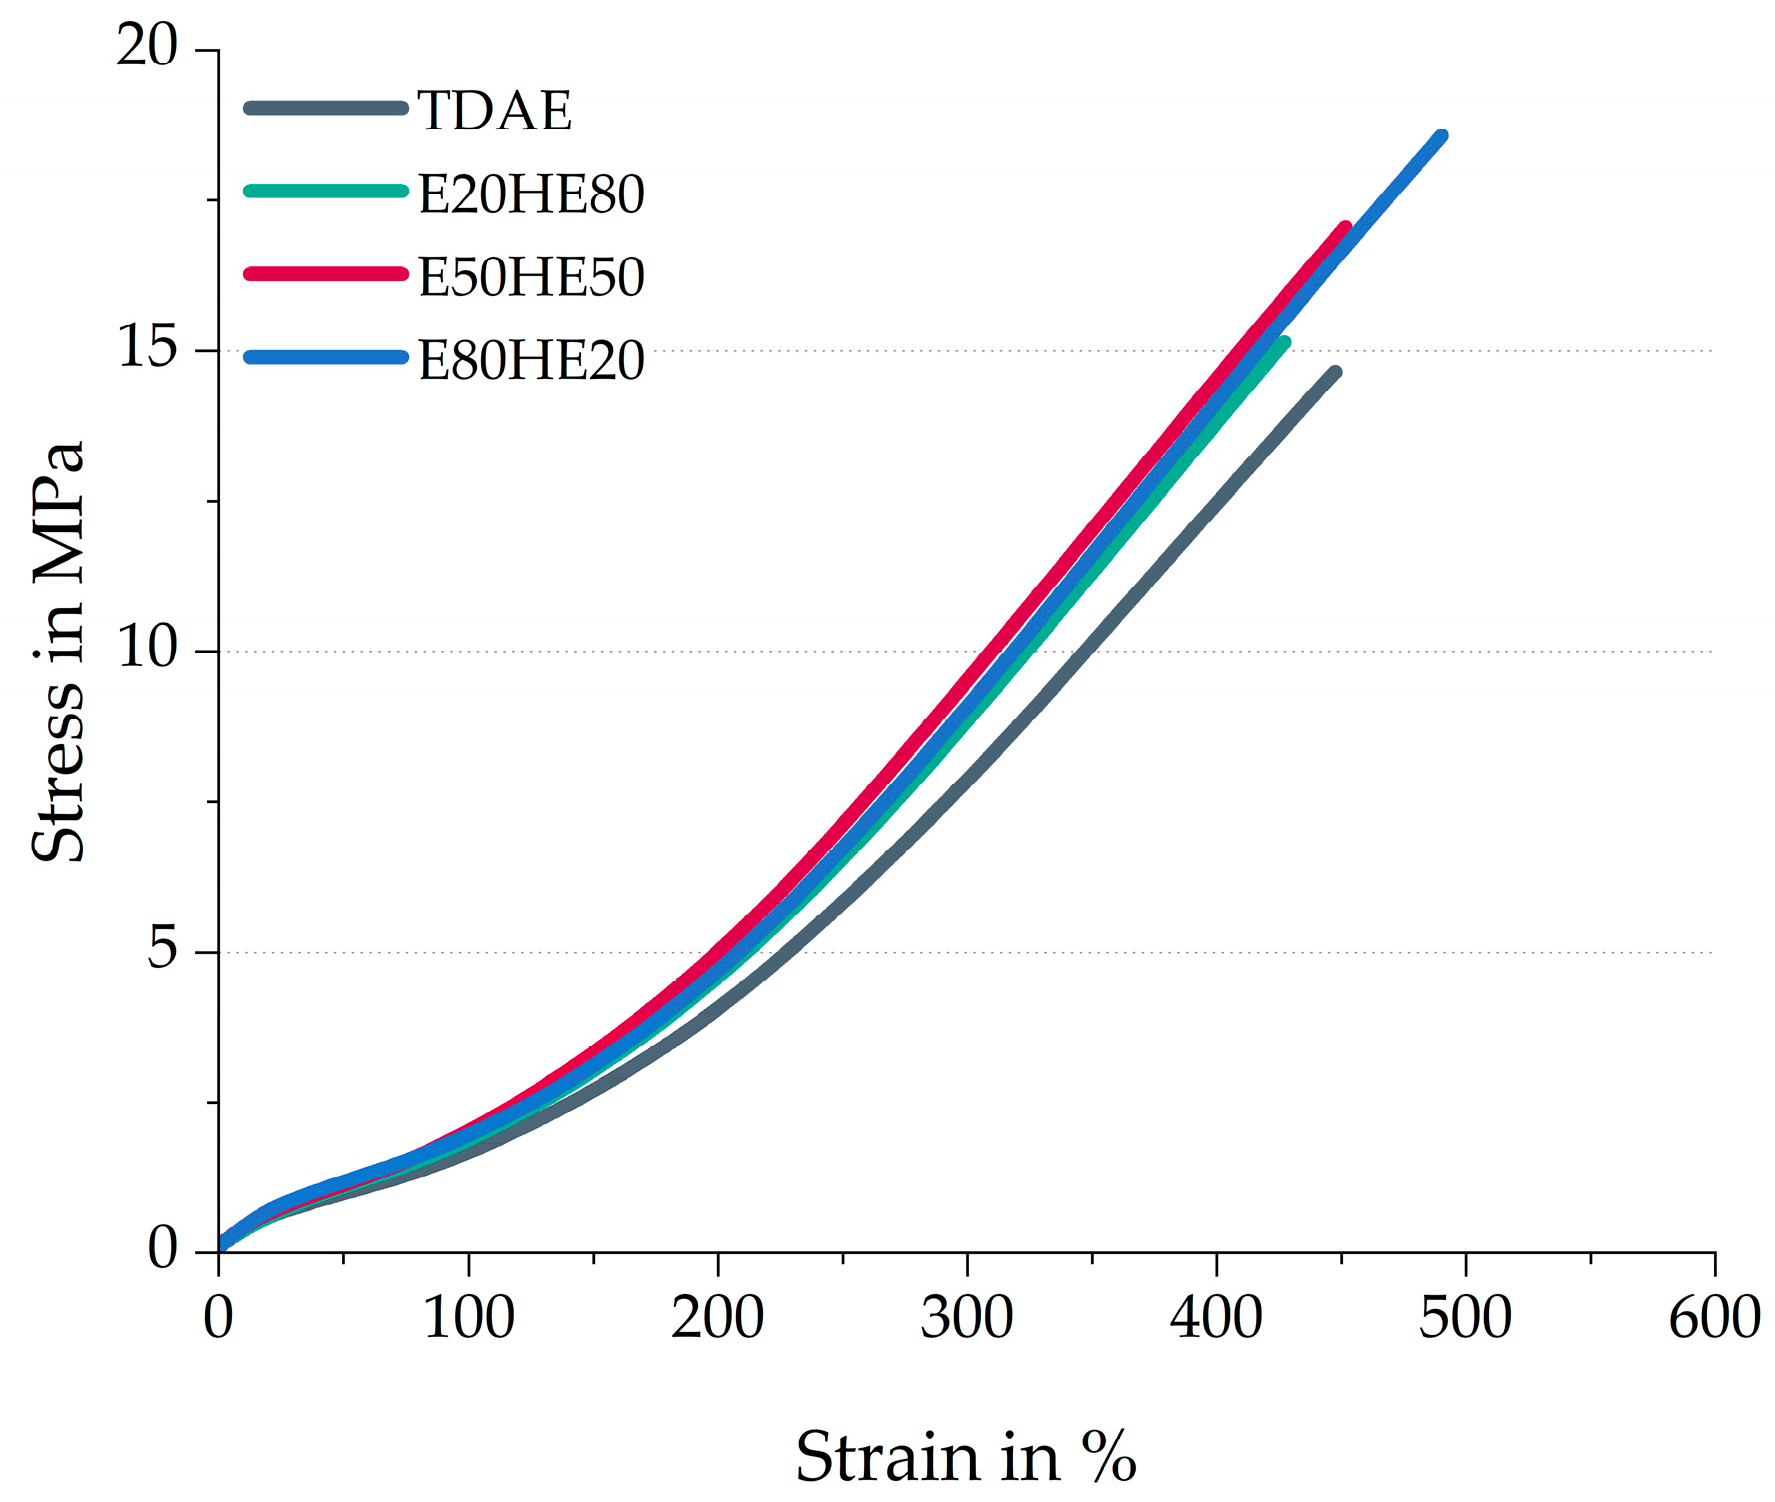
3.1.2. Stress–Strain Behavior and Tire Performance
3.2. Plasticizer Blends with Resin and Different Di-Ester Oils
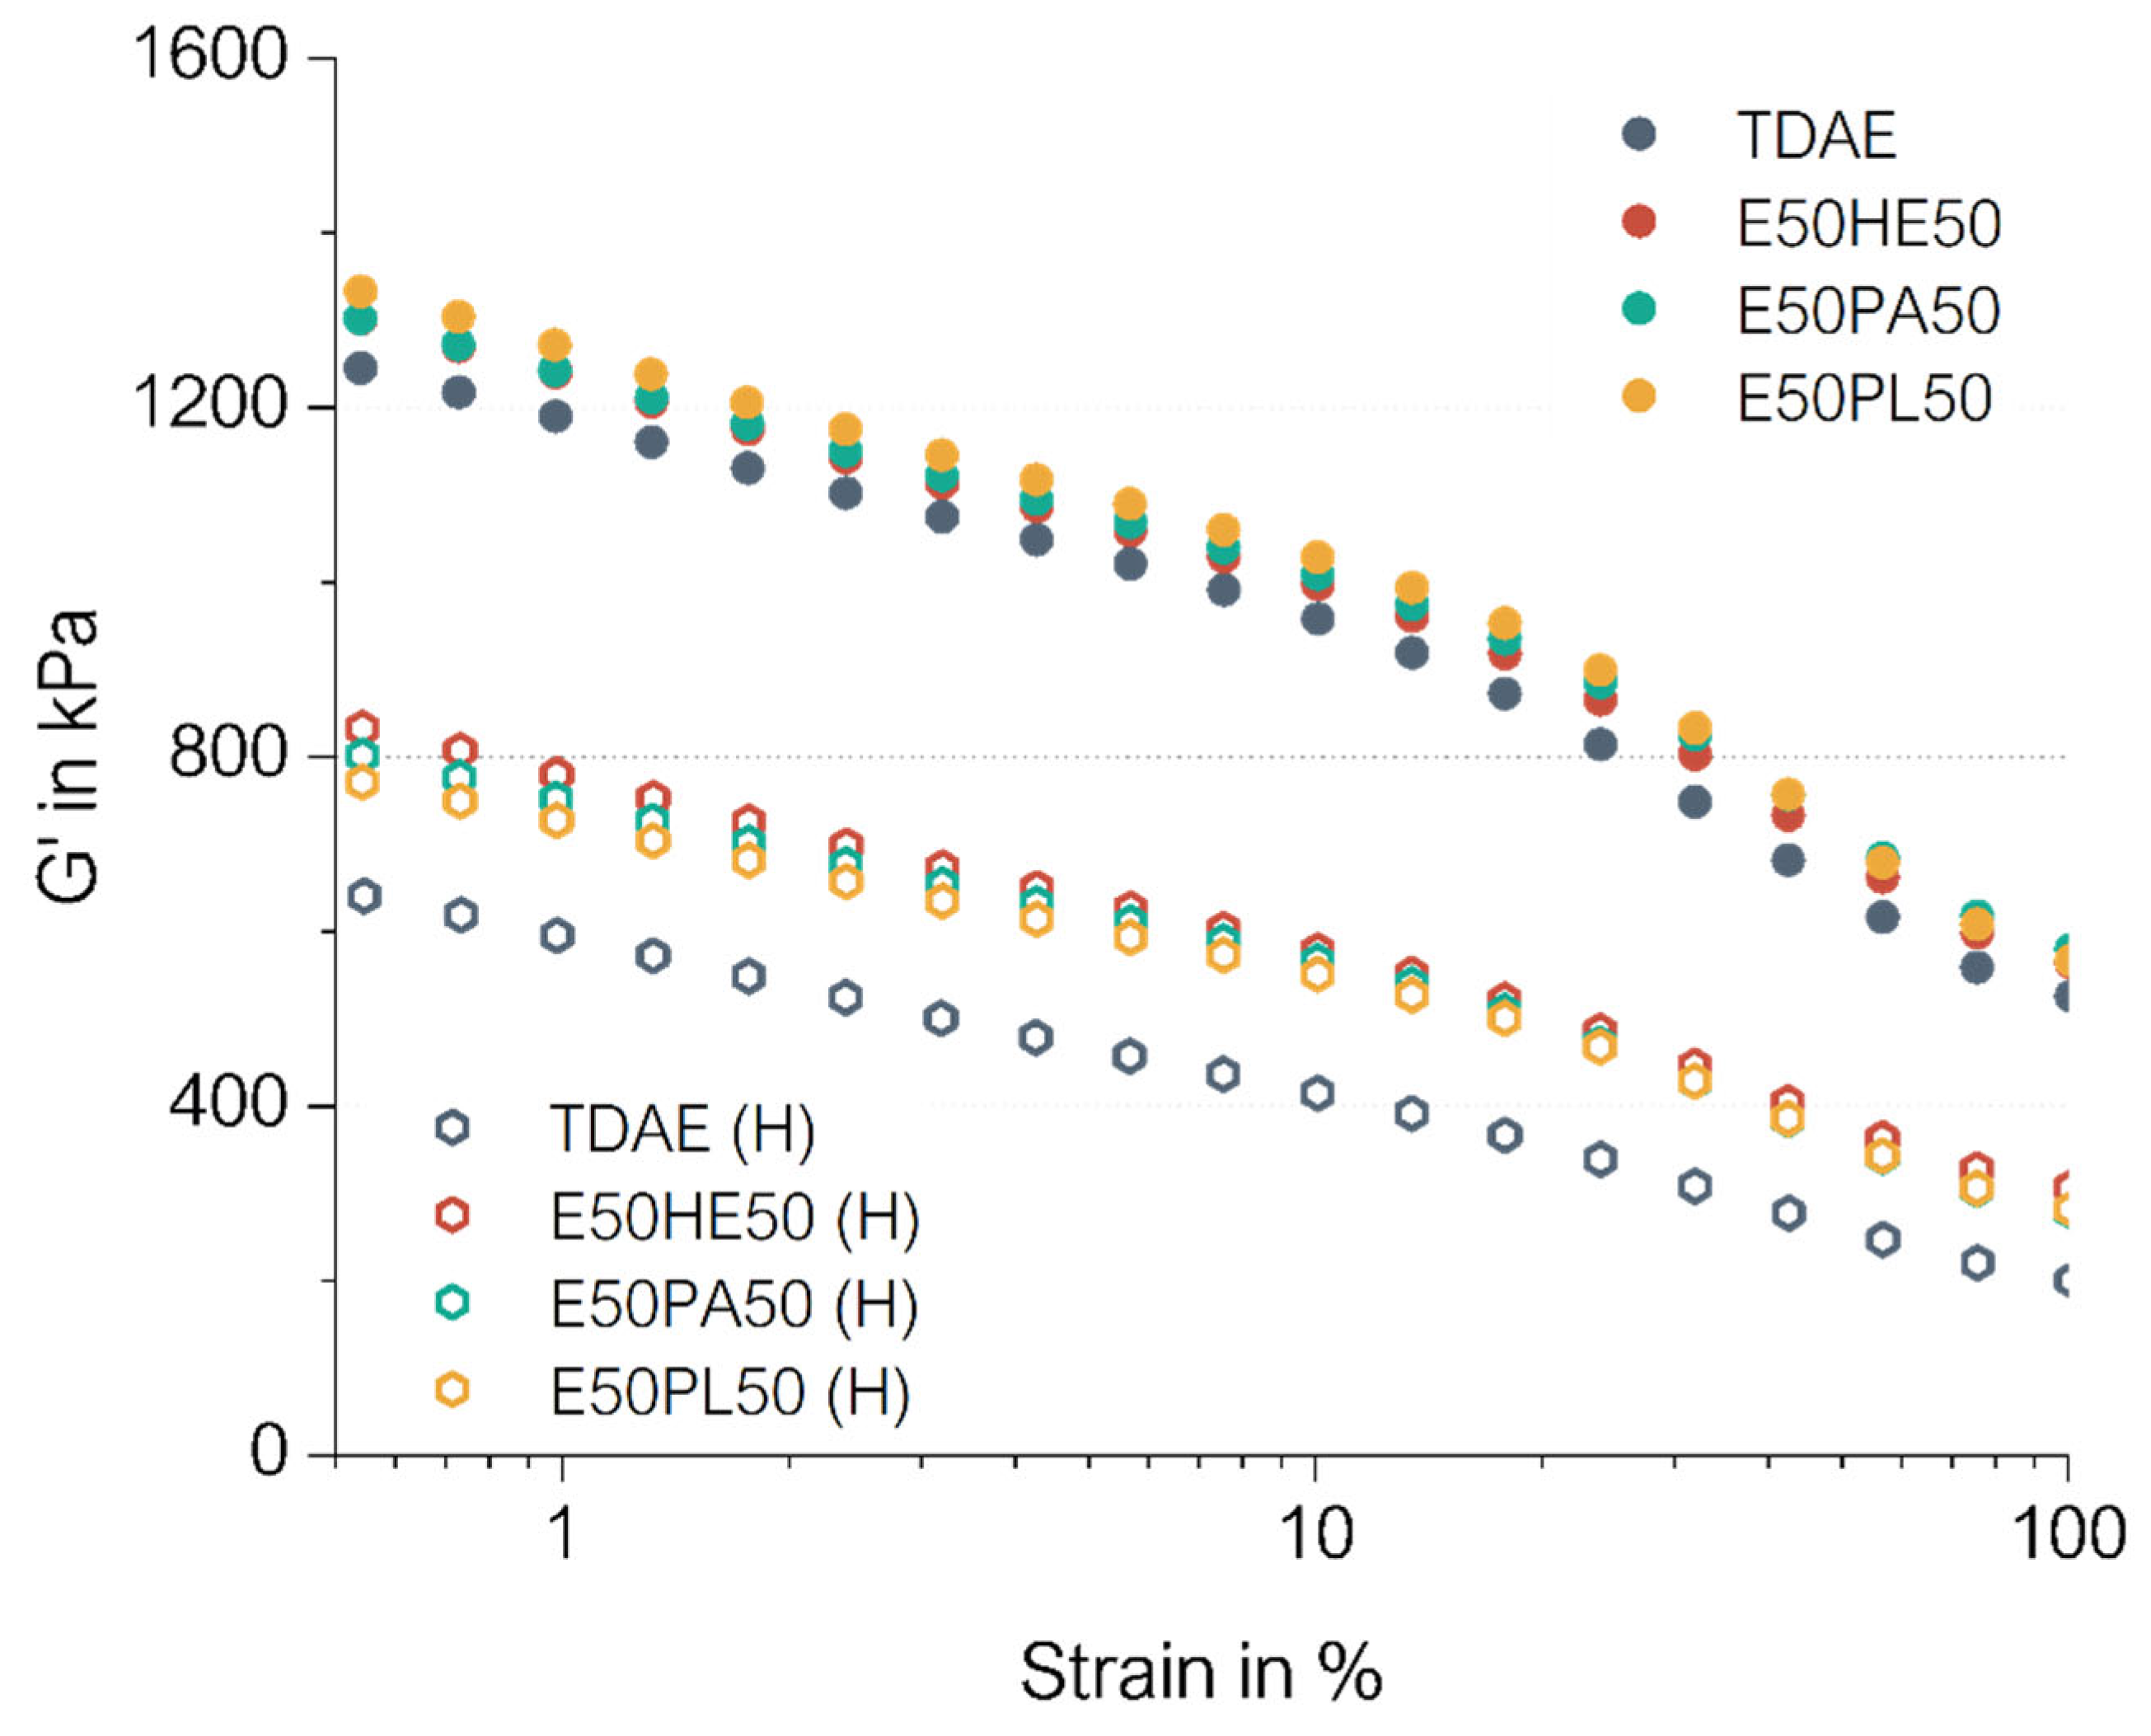
3.2.1. Rheometer Curves and Payne Effect
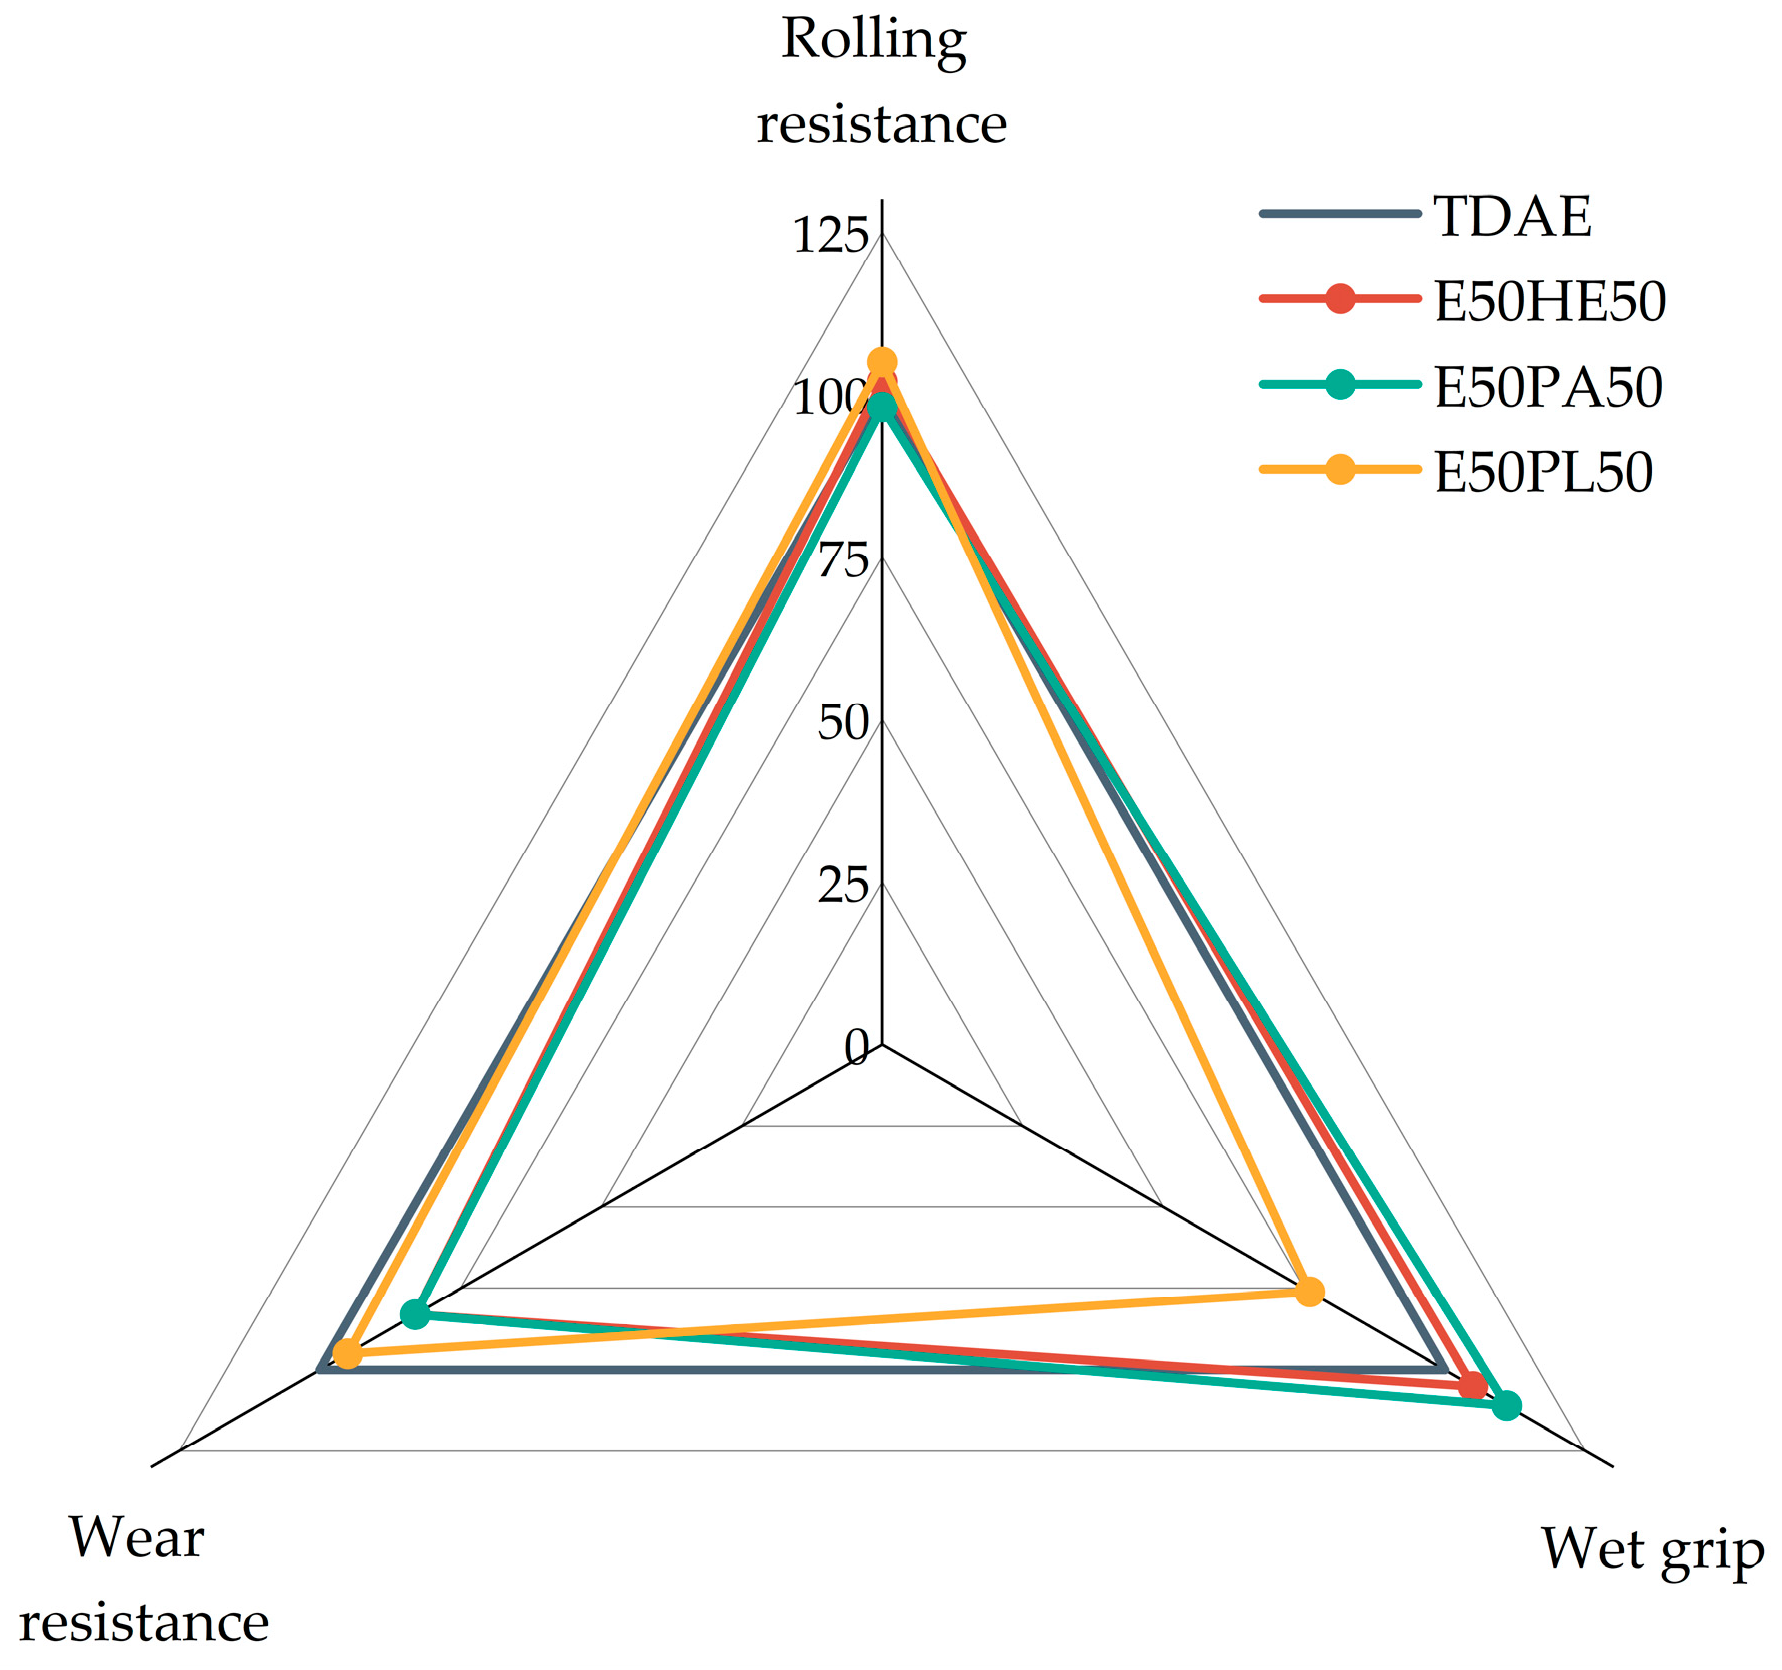
3.2.2. Stress–Strain Behavior and Tire Performance
4. Conclusions
Author Contributions
Funding
Institutional Review Board Statement
Data Availability Statement
Acknowledgments
Conflicts of Interest
References
- Top 10 Companies in Sustainable Tire Market in 2024 Shaping Global Industry Trends. Available online: https://www.emergenresearch.com/blog/top-10-companies-in-sustainable-tire-market?srsltid=AfmBOoqLPuRRTjrjbIVCTvBHVXWQfEaw6UA07K39yMqVMwRElQj3ztL_ (accessed on 25 June 2025).
- Bavkar, V. Sustainable Tire Materials Market: Opportunities, Trends, and Industry Growth. Available online: https://www.marketsandmarkets.com/blog/CM/Sustainable-Tire-Materials-Market-Opportunities-Trends-Industry-Growth (accessed on 5 June 2025).
- Dhamija, D. The Road to Sustainability: Exploring the Green Tires Market. Available online: https://blog.bccresearch.com/the-road-to-sustainability-exploring-the-green-tires-market (accessed on 5 June 2025).
- Sarkar, P.; Bhowmick, A.K. Sustainable Rubbers and Rubber Additives. J. Appl. Polym. Sci. 2018, 135, 45701. [Google Scholar] [CrossRef]
- Bardha, A.; Prasher, S.; Dumont, M.J. Waste Biomass-Derived Rubber Composite Additives: Review of Current Research and Future Investigations Into Biowaste Tire Formulation. Biomass Bioenergy 2024, 183, 107149. [Google Scholar] [CrossRef]
- Chang, B.P.; Gupta, A.; Muthuraj, R.; Mekonnen, T.H. Bioresourced Fillers for Rubber Composite Sustainability: Current Development and Future Opportunities. Green Chem. 2021, 23, 5337–5378. [Google Scholar] [CrossRef]
- Boonmahitthisud, A.; Boonkerd, K. Sustainable Development of Natural Rubber and Its Environmentally Friendly Composites. Curr. Opin. Green Sustain. 2021, 28, 100446. [Google Scholar] [CrossRef]
- Mohamed, N.R.; Othman, N.; Shuib, R.K.; Hayeemasae, N. Perspective on Opportunities of Bio-Based Processing Oil to Rubber Industry: A Short Review. Iran. Polym. J. 2023, 32, 1455–1475. [Google Scholar] [CrossRef]
- Tang, S.; Li, J.; Wang, R.; Zhang, J.; Lu, Y.; Hu, G.; Wang, Z.; Zhang, L. Current Trends in Bio-Based Elastomer Materials. SusMat 2022, 2, 2–33. [Google Scholar] [CrossRef]
- Dadkhah, M.; Messori, M. A Comprehensive Overview of Conventional and Bio-Based Fillers for Rubber Formulations Sustainability. Mater. Today Sustain. 2024, 27, 100886. [Google Scholar] [CrossRef]
- Moneypenny, H.G.; Menting, K.-H.; Gragg, F.M. General Compounding. In Rubber Compounding: Chemistry and Applications; Rogers, B., Ed.; CRC Press: Boca Raton, FL, USA, 2016; pp. 333–378. ISBN 9781482235500. [Google Scholar]
- Rathi, A. Investigating Safe Mineral-Based and Bio-Based Process Oils for Tire Tread Application. Ph.D. Thesis, University of Twente, Enschede, The Netherlands, 2019. [Google Scholar]
- van Elburg, F.; Grunert, F.; Aurisicchio, C.; di Consiglio, M.; di Ronza, R.; Talma, A.; Bernal-Ortega, P.; Blume, A. Exploring the Impact of Bio-Based Plasticizers on the Curing Behavior and Material Properties of a Simplified Tire-Tread Compound. Polymers 2024, 16, 1880. [Google Scholar] [CrossRef] [PubMed]
- IndustryARC. Plasticizers & Tackifiers in Tyres Market by Type 2027. Available online: https://www.industryarc.com/Report/19142/plasticizers-tackifiers-in-tyres-market (accessed on 4 September 2024).
- Duddey, J.E. Resins. In Rubber Compounding: Chemistry and Applications; Rodgers, B., Ed.; CRC Press: Boca Raton, FL, USA, 2016; pp. 379–418. ISBN 9781482235500. [Google Scholar]
- Bernal-Ortega, P.; Gaillard, E.; van Elburg, F.; Blume, A. Use of Hydrocarbon Resins as an Alternative to TDAE Oil in Tire Tread Compounds. Polym. Test. 2023, 126, 108168. [Google Scholar] [CrossRef]
- Bernal-Ortega, P.; van Elburg, F.; Araujo-Morera, J.; Gojzewski, H.; Blume, A. Heading Towards a Fully Sustainable Tire Tread Compound: Use of Bio-Based Resins. Polym. Test. 2024, 133, 108406. [Google Scholar] [CrossRef]
- Lopitaux, G. Rubber Tyre Composition Containing Diester Plasticizer. U.S. Patent US8637597 B2, 28 January 2014. [Google Scholar]
- Sandstrom, P.H.; Rodewald, S.; Ramanathan, A. Tire with Rubber Tread Containing Combination of Resin and Vegetable Oil, Particularly Soybean Oil. U.S. Patent US2014/0135437 A1, 15 May 2014. [Google Scholar]
- BASF. Plastomoll® DOA BMB. Available online: https://products.basf.com/global/en/cp/plastomoll-doa-bmb (accessed on 19 September 2024).
- BASF. Palatinol® 10P BMB. Available online: https://products.basf.com/global/en/cp/palatinol-10-p-bmb (accessed on 19 September 2024).
- BASF. Hexamoll® DINCH BMB. Available online: https://products.basf.com/global/en/cp/hexamoll-dinch-bmb (accessed on 19 September 2024).
- BASF’s New Plastic Additives Reduces CO2 Emissions by 60%. Available online: https://carboncredits.com/basfs-new-plastic-additives-reduces-co2-footprint-by-60/ (accessed on 17 March 2025).
- Farshchi, N.; Abbasian, A. Inverse Gas Chromatography Study of Hansen Solubility Parameters of Rubber Process Oils (DAE, TDAE, MES, and NAP). Rubber Chem. Technol. 2020, 93, 297. [Google Scholar] [CrossRef]
- ISO 48-4:2018; Rubber, Vulcanized or Thermoplastic—Determination of Hardness. ISO: Geneva, Switzerland, 2018.
- ISO 37:2017; Rubber, Vulcanized or Thermoplastic—Determination of Tensile Stress-Strain Properties. ISO: Geneva, Switzerland, 2017.
- ISO 4649:2024; Rubber, Vulcanized or Thermoplastic—Determination of Abrasion Resistance Using a Rotating Cylindrical Drum Device. ISO: Geneva, Switzerland, 2024.
- Aggarwal, A.; Grunert, F.; Ilisch, S.; Stratton, T.; Blume, A. Investigation of Different Ingredients Contributing to the Cure Torque in Silica-Filled SSBR Compounds. In Proceedings of the IRC RubberCon, Edinburgh, UK, 9 May 2023. [Google Scholar]
- Siwarote, B.; Sae-Oui, P.; Wirasate, S.; Suchiva, K. Effects of Bio-Based Oils on Processing Properties and Cure Characteristics of Silica-Filled Natural Rubber Compounds. J. Rubber Res. 2017, 20, 1–19. [Google Scholar] [CrossRef]
- Fröhlich, J.; Niedermeier, W.; Luginsland, H.D. The Effect of Filler-Filler and Filler-Elastomer Interaction on Rubber Reinforcement. Compos. Part A Appl. Sci. Manuf. 2005, 36, 449. [Google Scholar] [CrossRef]
- Bernal-Ortega, P.; Anyszka, R.; Morishita, Y.; di Ronza, R.; Blume, A. Determination of the Crosslink Density of Silica-Filled Styrene Butadiene Rubber Compounds by Different Analytical Methods. Polym. Bull. 2024, 81, 995–1018. [Google Scholar] [CrossRef]
- MonTech USA. Key Factors That Affect DIN Abrasion Testing. Available online: https://www.montechusa.com/key-factors-din-abrasion (accessed on 28 October 2024).
- Whitcomb, K. Measurement of Glass Transition Temperatures by Dynamic Mechanical Analysis and Rheology. Available online: https://www.tainstruments.com/pdf/literature/RH100.pdf (accessed on 17 March 2025).
- Colvin, H. General-Purpose Elastomers. In Rubber Compounding: Chemistry and Applications; Rodgers, B., Ed.; CRC Press: Boca Raton, FL, USA, 2016; pp. 34–76. ISBN 9781482235500. [Google Scholar]
- Babazadeh, K.; Blume, A.; Zeeman, R.; Bandzierz, K. Optimized Laboratory Prediction of Wet Grip Performance of Tires. In Proceedings of the Tire Technology Expo, Hannover, Germany, 23 March 2023. [Google Scholar]
- Veith, A.G. Tire Treadwear: The Joint Influence of Tg, Tread Composition and Environmental Factors. A Proposed “Two-Mechanism” Theory of Treadwear. Polym. Test. 1987, 7, 177. [Google Scholar] [CrossRef]


| Ingredient | Mw in g/mol | ρ in g/cm3 | Tg * in °C | HSP ** in MPa1/2 | Chemical Structure |
|---|---|---|---|---|---|
| TDAE | x | 0.95 | −52 | δD = 15.2 δP = 11.2 δH = 1.0 δtot = 18.9 | Carbon distribution [12]: Caromatic = 25 wt% Cnapthene = 30 wt% Cparaffin = 45 wt% |
| Hexamoll® DINCH | 425 | 0.95 | −90 | δD = 16.1 δP = 1.9 δH = 2.6 δtot = 16.4 | 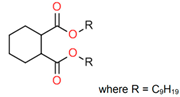 |
| Palatinol® 10P | 447 | 0.96 | −79 | δD = 16.8 δP = 4.2 δH = 2.3 δtot = 17.4 | 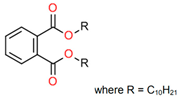 |
| Plastomoll® DOA | 371 | 0.92 | −106 | δD = 16.2 δP = 2.7 δH = 3.4 δtot = 16.7 | 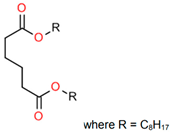 |
| Escorez™ 5300 | 670 | 1.01 | 45 | δD = 17.9 δP = 0.1 δH = 0.1 δtot = 17.9 | Cycloaliphatic hydrocarbon resin |
| Time | Action |
|---|---|
| m:s | Stage 1: pre-heating 80 °C, 70 rpm, fill factor 72% |
| 0:00 | Addition of rubber |
| 1:00 | Addition of 2/3 silica, 2/3 silane |
| 2:30 | Addition of 1/3 silica, 1/3 silane, ZnO, Stearic acid, and plasticizer |
| 4:00 | 15-s ramp sweep |
| 4:15 | Increase of torque (increase temperature to 130 °C) |
| 7:00 | Stop mixing (reaching 140 °C) |
| m:s | Stage 2: pre-heating 80 °C, 80 rpm, fill factor 69% |
| 0:00 | Addition of elastomer masterbatch |
| 0:50 | Addition of DPG |
| 1:00 | Increase of torque (increase temperature to 130 °C) |
| 5:00 | Stop mixing (reaching 140 °C) |
| m:s | Stage 3: pre-heating 50 °C, 50 rpm, fill factor 66% |
| 0:00 | Addition of elastomer masterbatch, curatives (sulfur, and TBBS) |
| 3:00 | Stop mixing |
| Compounds | S-SBR in phr | BR in phr | Silica in phr | TDAE in phr | Hexamoll DINCH in phr | Escorez 5300 in phr |
|---|---|---|---|---|---|---|
| TDAE | 80 | 20 | 80 | 37.5 | X | X |
| E20HE80 | 80 | 20 | 80 | X | 30 | 7.5 |
| E50HE50 | 80 | 20 | 80 | X | 18.75 | 18.75 |
| E80HE20 | 80 | 20 | 80 | X | 7.5 | 30 |
| Compounds | ts2 in min | t90 in min | MH in dNm | ML in dNm | MH-ML in dNm | G’0.56–100% in kPa | G’100% in kPa |
|---|---|---|---|---|---|---|---|
| TDAE | 8.9 | 33.1 | 14.3 | 1.6 | 12.7 | 719 | 525 |
| E20HE80 | 7.9 | 30.6 | 15.2 | 1.9 | 13.3 | 724 | 566 |
| E50HE50 | 8.6 | 30.3 | 15.1 | 1.9 | 13.2 | 738 | 564 |
| E80HE20 | 9.5 | 31.5 | 14.3 | 2.0 | 12.3 | 640 | 610 |
| Compounds | Hardness in Shore A | M100 in MPa | M300 in MPa | Eab in % | Ts in MPa |
|---|---|---|---|---|---|
| TDAE | 52 ± 0 | 1.71 ± 0.04 | 7.95 ± 0.15 | 460 ± 30 | 15.2 ± 1.4 |
| E20HE80 | 51 ± 0 | 1.82 ± 0.09 | 8.52 ± 0.27 | 440 ± 20 | 15.0 ± 1.0 |
| E50HE50 | 54 ± 0 | 1.94 ± 0.05 | 9.18 ± 0.20 | 450 ± 10 | 16.3 ± 0.6 |
| E80HE20 | 54 ± 0 | 1.94 ± 0.05 | 8.82 ± 0.18 | 490 ± 30 | 17.9 ± 1.5 |
| Compounds | ARI in % |
|---|---|
| TDAE | 100 |
| E20HE80 | 92 |
| E50HE50 | 83 |
| E80HE20 | 86 |
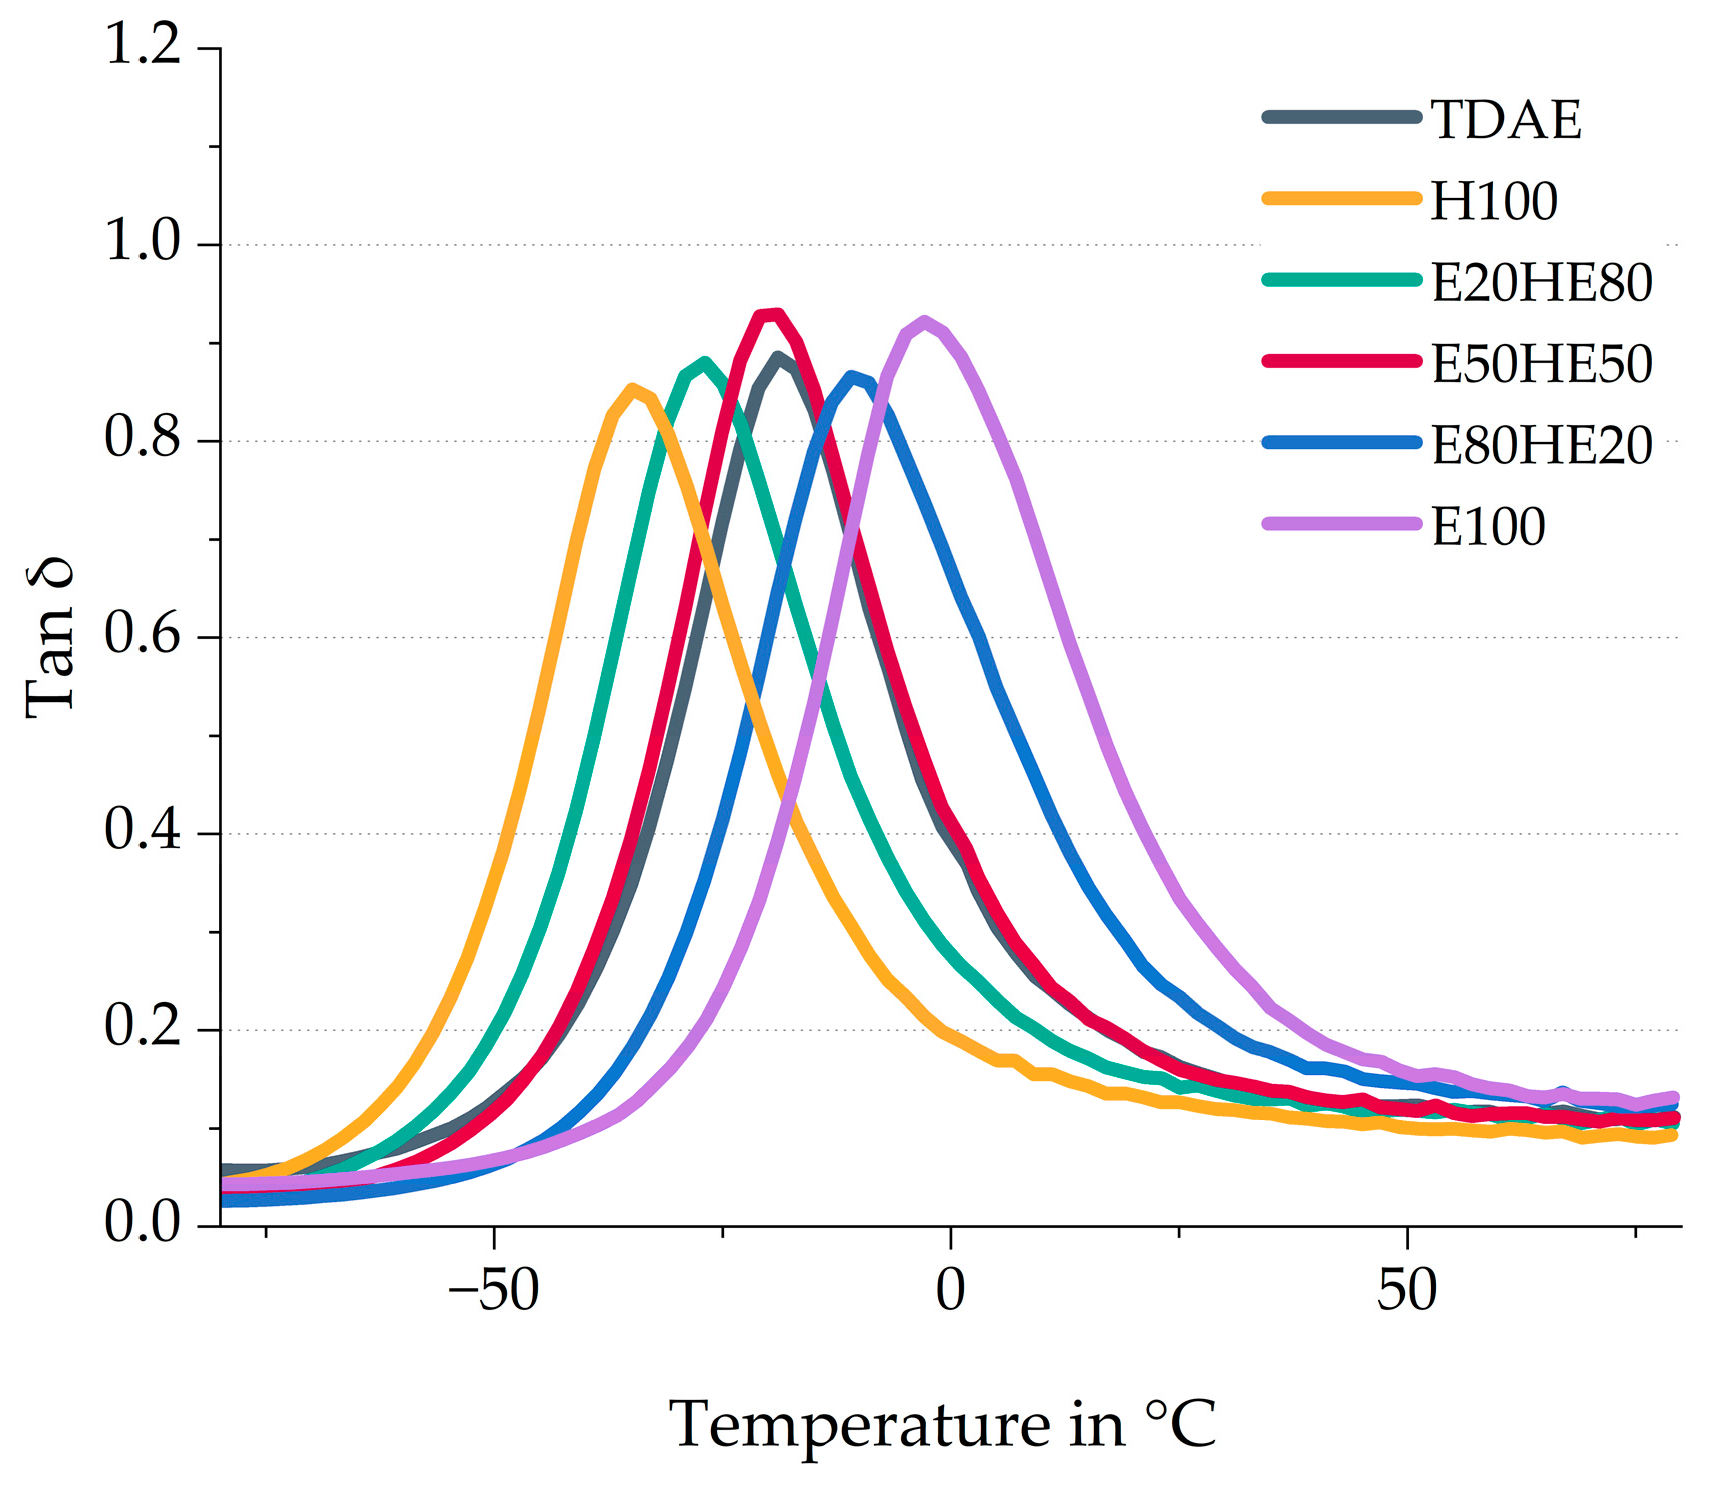
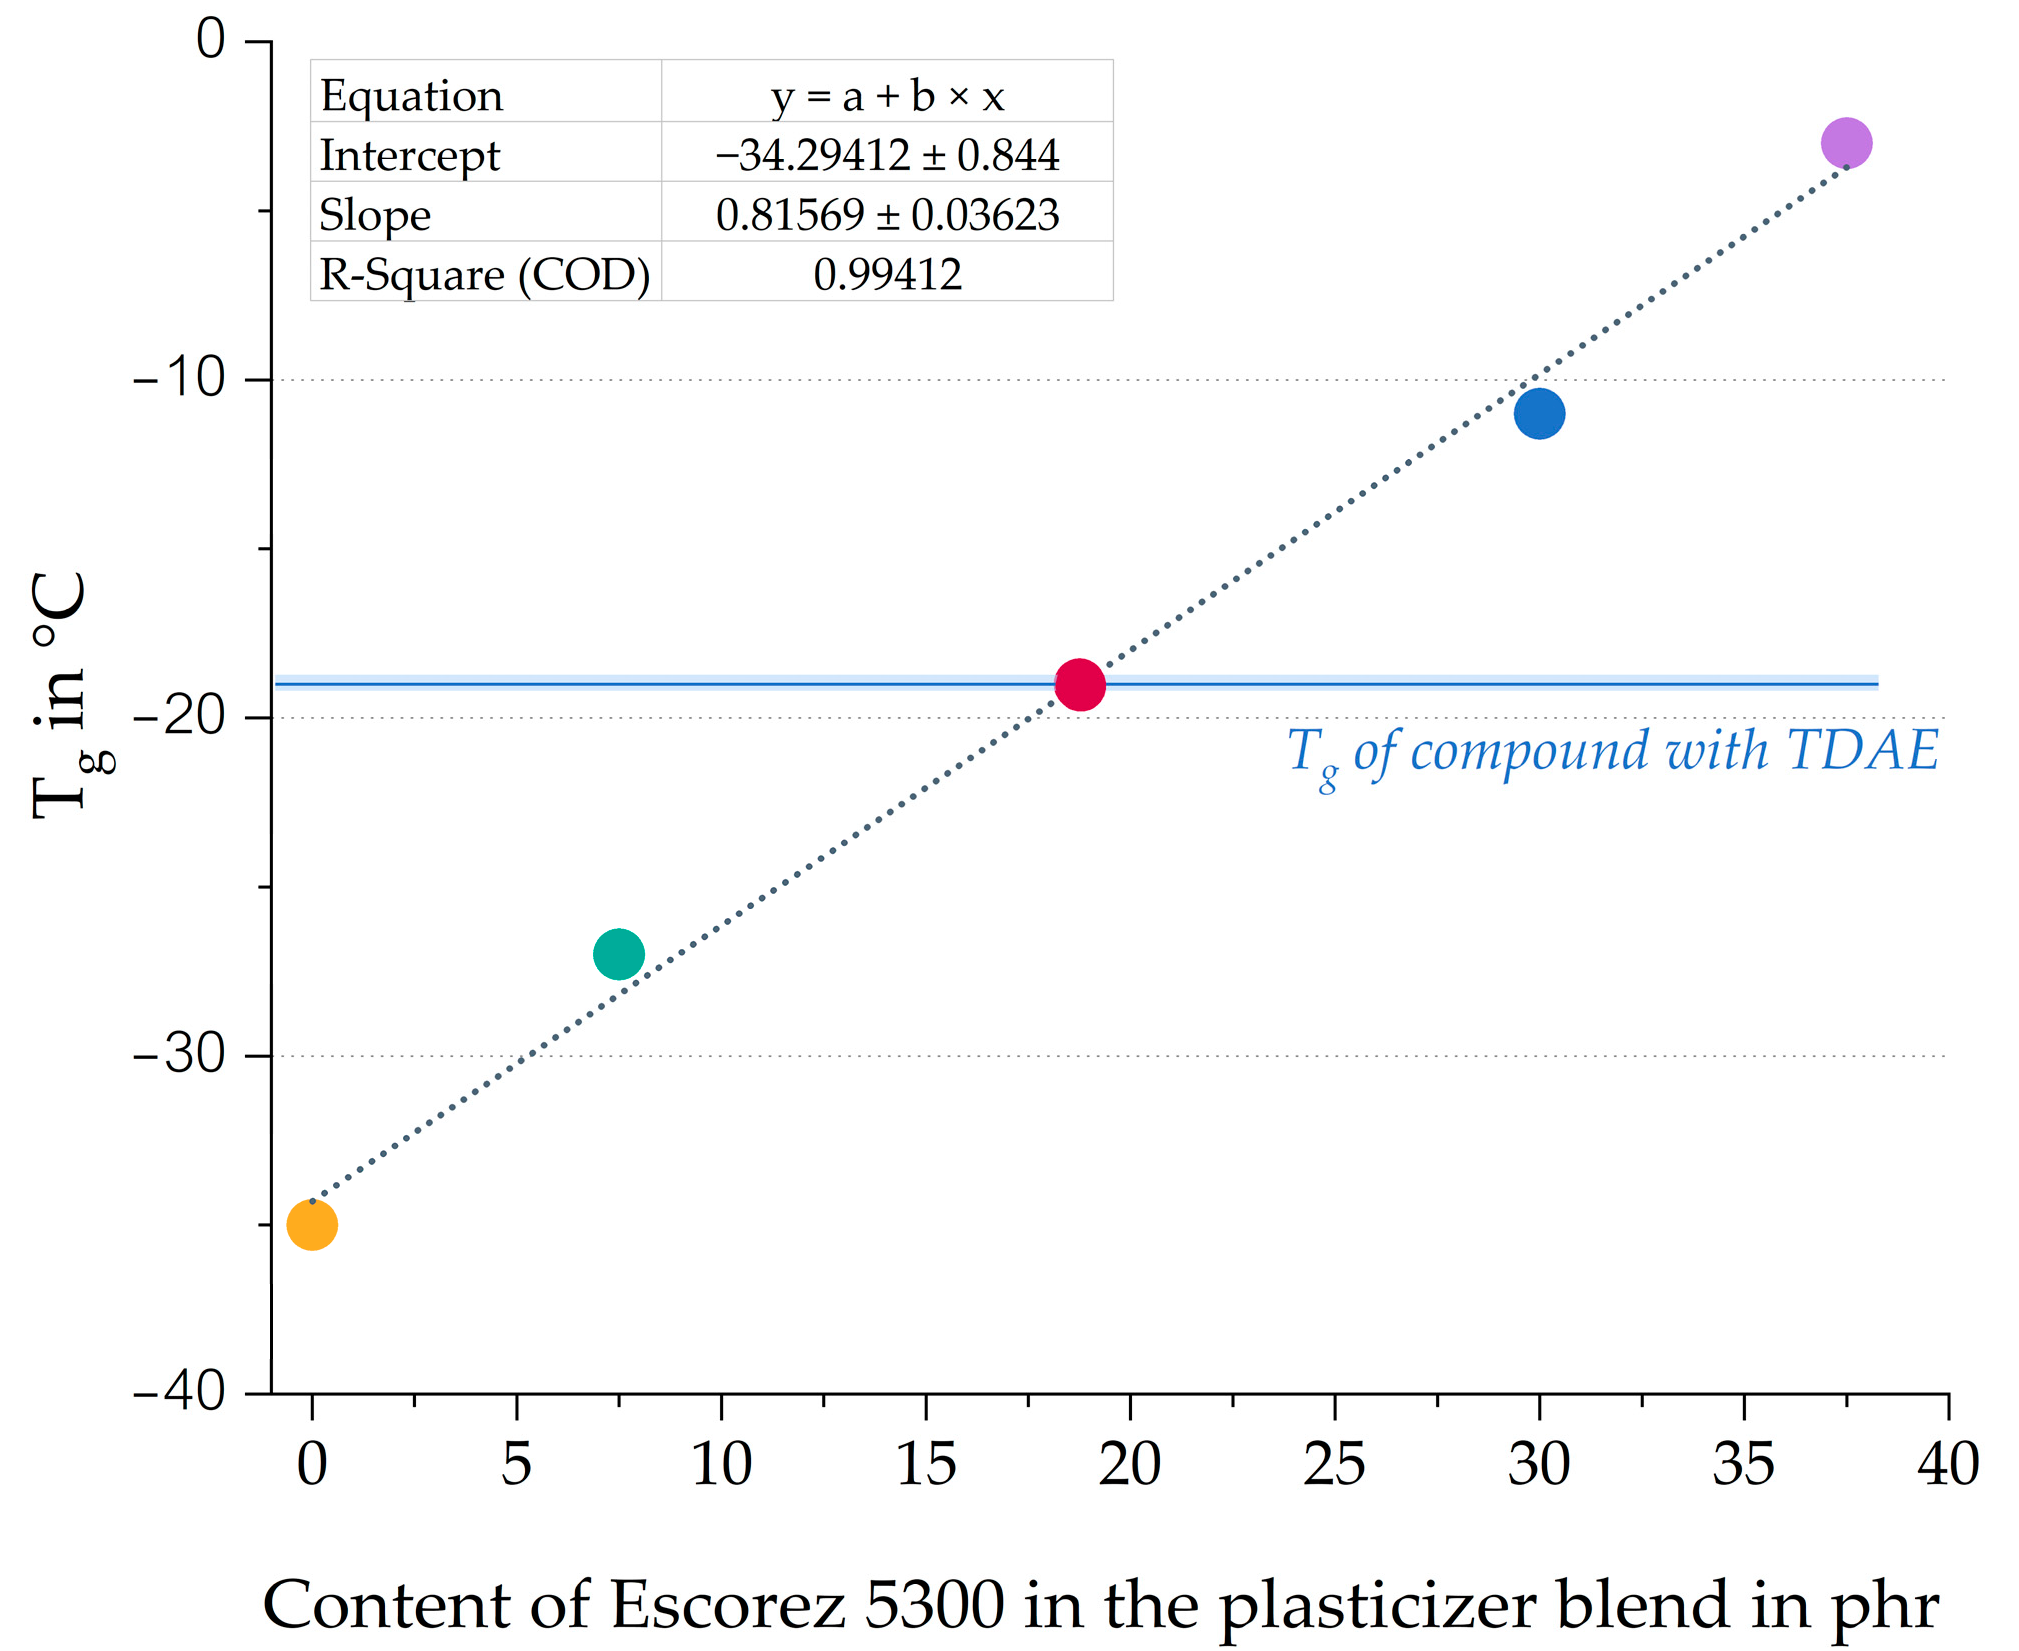
| Compounds | Tg in °C | tan δ at 60 °C | tan δ at 0 °C |
|---|---|---|---|
| TDAE | −19 | 0.117 | 0.406 |
| E20HE80 | −27 | 0.114 | 0.287 |
| E50HE50 | −19 | 0.115 | 0.427 |
| E80HE20 | −11 | 0.136 | 0.692 |
| Compounds | S-SBR in phr | BR in phr | Silica in phr | TDAE in phr | Hexamoll DINCH in phr | Palatinol 10P in phr | Plastomoll DOA in phr | Escorez 5300 in phr |
|---|---|---|---|---|---|---|---|---|
| TDAE | 80 | 20 | 80 | 37.5 | X | X | X | X |
| E50HE50 | 80 | 20 | 80 | X | 18.75 | X | X | 18.75 |
| E50PA50 | 80 | 20 | 80 | X | X | 18.75 | X | 18.75 |
| E50PL50 | 80 | 20 | 80 | X | X | X | 18.75 | 18.75 |
| TDAE (H) | 80 | 20 | 80 | 80 | X | X | X | X |
| E50HE50 (H) | 80 | 20 | 80 | X | 40 | X | X | 40 |
| E50PA50 (H) | 80 | 20 | 80 | X | X | 40 | X | 40 |
| E50PL50 (H) | 80 | 20 | 80 | X | X | X | 40 | 40 |
| Compounds | ts2 in min | t90 in min | MH in dNm | ML in dNm | MH-ML in dNm | G’0.56–100% in kPa | G’100% in kPa |
|---|---|---|---|---|---|---|---|
| TDAE | 8.9 | 33.1 | 14.3 | 1.6 | 12.7 | 719 | 525 |
| E50HE50 | 8.6 | 30.3 | 15.1 | 1.9 | 13.2 | 738 | 564 |
| E50PA50 | 8.6 | 29.6 | 14.8 | 1.8 | 13.0 | 723 | 579 |
| E50PL50 | 9.7 | 30.8 | 15.0 | 1.7 | 13.4 | 766 | 567 |
| TDAE (H) | 13.0 | 37.6 | 5.9 | 0.5 | 5.4 | 440 | 201 |
| E50HE50 (H) | 14.7 | 35.1 | 8.1 | 0.5 | 7.5 | 526 | 306 |
| E50PA50 (H) | 15.2 | 35.6 | 7.9 | 0.6 | 7.3 | 522 | 282 |
| E50PL50 (H) | 15.7 | 35.2 | 8.0 | 0.5 | 7.5 | 489 | 280 |
| Compounds | Hardness in Shore A | M100 in MPa | M300 in MPa | Eab in % | Ts in MPa |
|---|---|---|---|---|---|
| TDAE | 52 ± 0 | 1.71 ± 0.04 | 7.95 ± 0.15 | 460 ± 30 | 15.2 ± 1.4 |
| E50HE50 | 54 ± 0 | 1.94 ± 0.05 | 9.18 ± 0.20 | 450 ± 10 | 16.3 ± 0.6 |
| E50PA50 | 54 ± 0 | 1.94 ± 0.07 | 9.20 ± 0.09 | 430 ± 20 | 15.4 ± 0.9 |
| E50PL50 | 54 ± 0 | 1.93 ± 0.05 | 8.85 ± 0.22 | 430 ± 10 | 14.9 ± 0.5 |
| TDAE (H) | 33 ± 0 | 0.93 ± 0.05 | 3.00 ± 0.12 | 700 ± 20 | 9.0 ± 0.3 |
| E50HE50 (H) | 39 ± 1 | 1.04 ± 0.05 | 4.05 ± 0.10 | 580 ± 20 | 11.1 ± 0.4 |
| E50PA50 (H) | 40 ± 0 | 1.03 ± 0.05 | 3.75 ± 0.19 | 620 ± 30 | 10.9 ± 0.7 |
| E50PL50 (H) | 39 ± 0 | 1.05 ± 0.04 | 4.15 ± 0.09 | 550 ± 30 | 10.6 ± 0.7 |
| Compounds | Tg in °C | tan δ at 60 °C | tan δ at 0 °C |
|---|---|---|---|
| TDAE | −19 | 0.117 | 0.406 |
| E50HE50 | −19 | 0.115 | 0.427 |
| E50PA50 | −19 | 0.120 | 0.453 |
| E50PL50 | −25 | 0.111 | 0.309 |
| TDAE (H) | −21 | 0.151 | 0.377 |
| E50HE50 (H) | −21 | 0.138 | 0.463 |
| E50PA50 (H) | −19 | 0.139 | 0.571 |
| E50PL50 (H) | −31 | 0.130 | 0.285 |
| Compounds | ARI in % |
|---|---|
| TDAE | 100 |
| E50HE50 | 83 |
| E50PA50 | 83 |
| E50PL50 | 95 |
Disclaimer/Publisher’s Note: The statements, opinions and data contained in all publications are solely those of the individual author(s) and contributor(s) and not of MDPI and/or the editor(s). MDPI and/or the editor(s) disclaim responsibility for any injury to people or property resulting from any ideas, methods, instructions or products referred to in the content. |
© 2025 by the authors. Licensee MDPI, Basel, Switzerland. This article is an open access article distributed under the terms and conditions of the Creative Commons Attribution (CC BY) license (https://creativecommons.org/licenses/by/4.0/).
Share and Cite
van Elburg, F.; Grunert, F.; Aurisicchio, C.; di Consiglio, M.; Talma, A.; Bernal-Ortega, P.; Blume, A. Sustainable Rubber Solutions: A Study on Bio-Based Oil and Resin Blends. Polymers 2025, 17, 2111. https://doi.org/10.3390/polym17152111
van Elburg F, Grunert F, Aurisicchio C, di Consiglio M, Talma A, Bernal-Ortega P, Blume A. Sustainable Rubber Solutions: A Study on Bio-Based Oil and Resin Blends. Polymers. 2025; 17(15):2111. https://doi.org/10.3390/polym17152111
Chicago/Turabian Stylevan Elburg, Frances, Fabian Grunert, Claudia Aurisicchio, Micol di Consiglio, Auke Talma, Pilar Bernal-Ortega, and Anke Blume. 2025. "Sustainable Rubber Solutions: A Study on Bio-Based Oil and Resin Blends" Polymers 17, no. 15: 2111. https://doi.org/10.3390/polym17152111
APA Stylevan Elburg, F., Grunert, F., Aurisicchio, C., di Consiglio, M., Talma, A., Bernal-Ortega, P., & Blume, A. (2025). Sustainable Rubber Solutions: A Study on Bio-Based Oil and Resin Blends. Polymers, 17(15), 2111. https://doi.org/10.3390/polym17152111