3.1. Tensile Tests
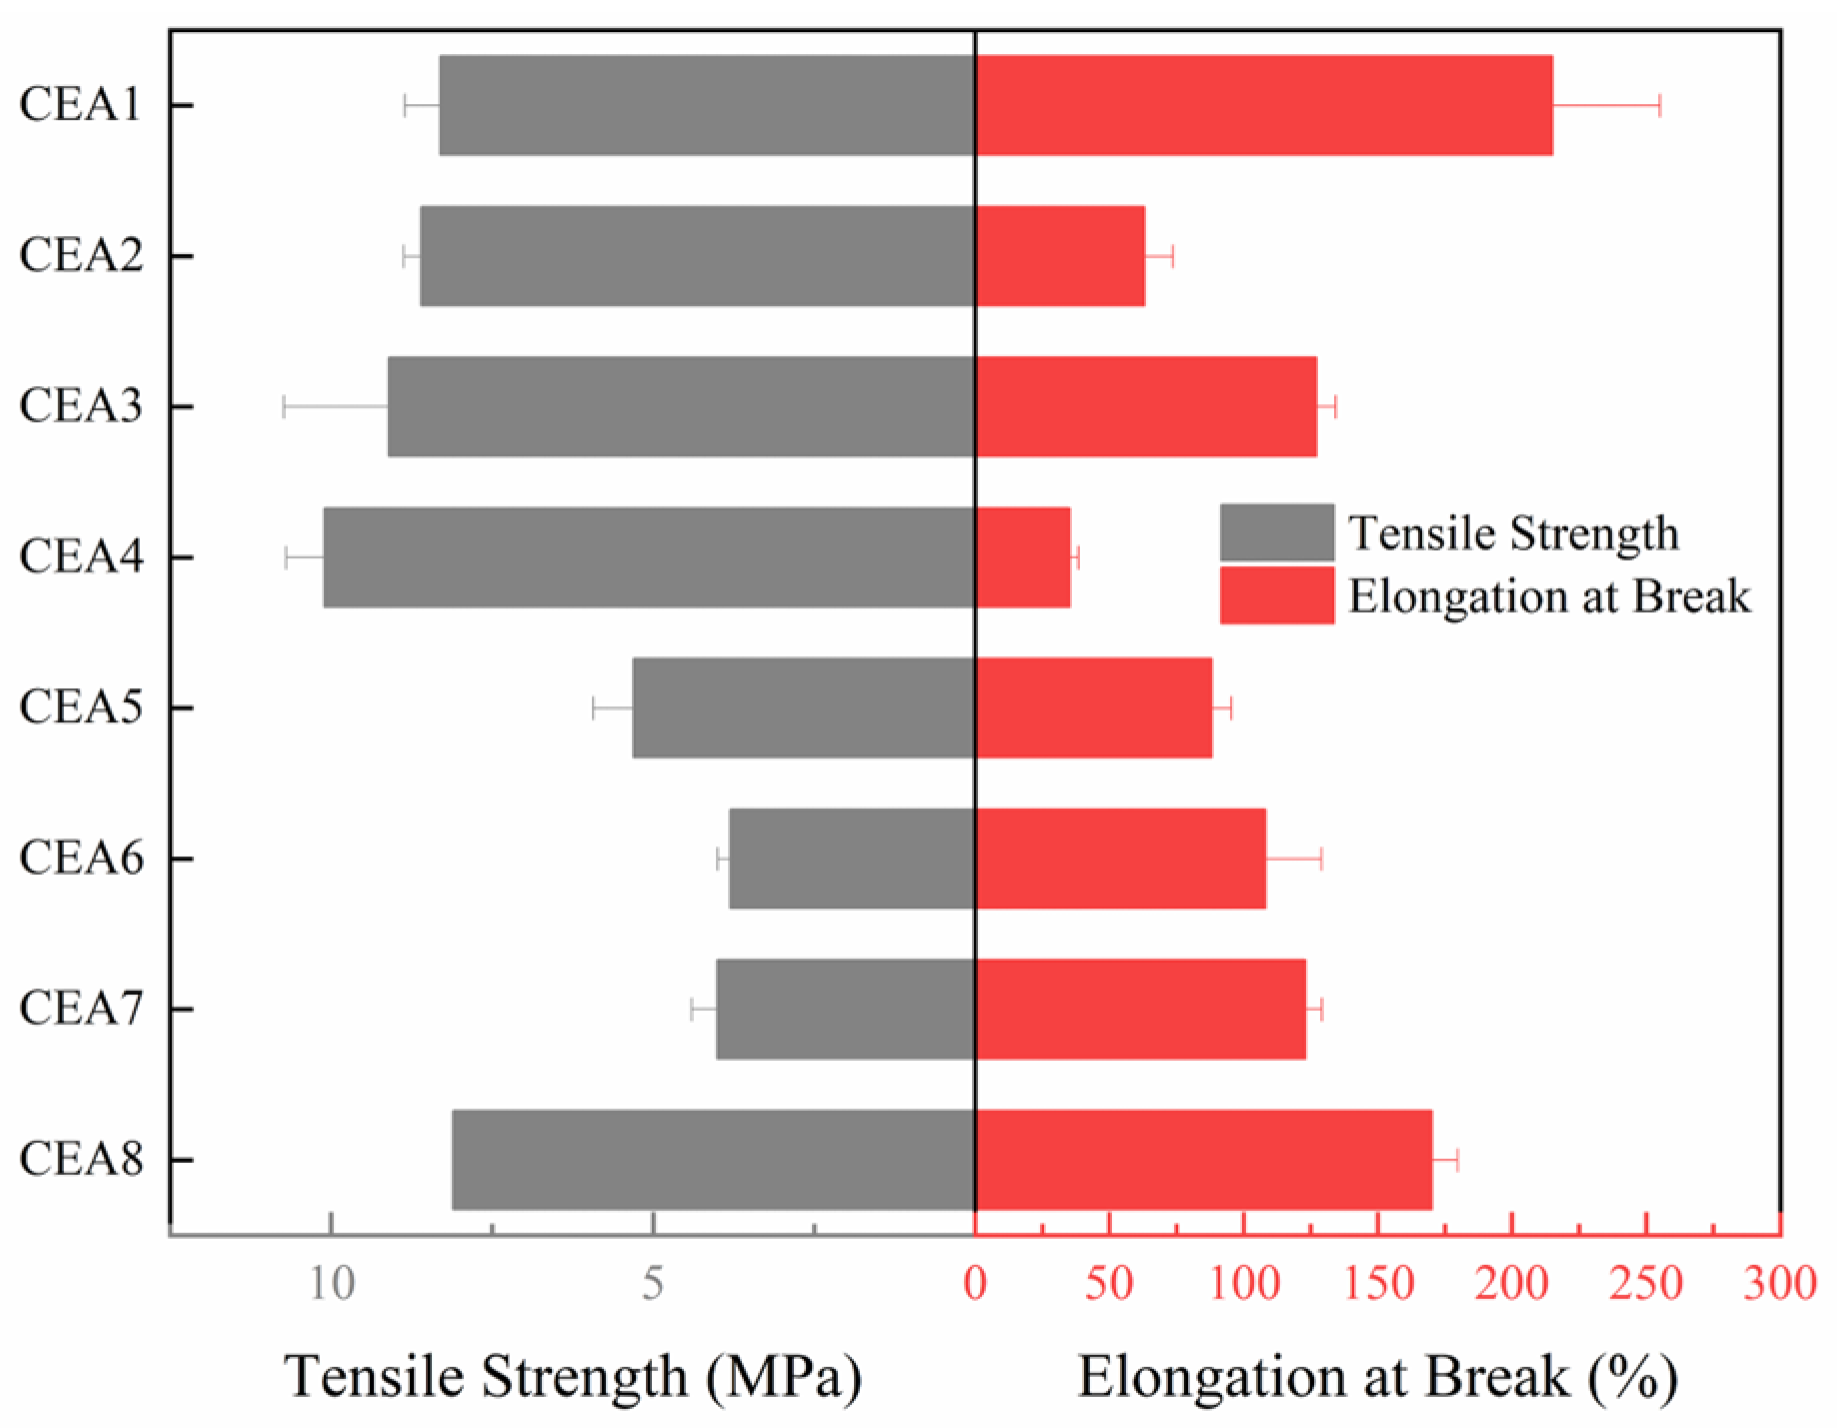
The tensile test is a basic test to evaluate the strength and toughness of epoxy asphalt. Generally, epoxy asphalt exhibits an obvious inverse relationship between tensile strength and elongation at break due to the rigid cross-linked network. As the tensile strength increases, the elongation at break tends to decrease. The tensile test results of eight CEAs are shown in
Figure 3, differing significantly in strength and toughness.
Among the eight formulations, CEA 1, CEA 3, and CEA 8 demonstrate superior performance in both tensile strength and elongation at break, achieving 8.1 MPa/170% and 8.3 MPa/215%, respectively. These results suggest higher cross-linking efficiency and improved phase compatibility. The enhanced performance may be attributed to a better match between the molecular weight and functionality of the thermosetting resin components as well as the reactivity of the selected curing agents. These factors are likely to contribute to a more uniform cross-linked network structure, reducing the stress concentration within the polymer matrix. CEA 2 and CEA 4 exhibit high tensile strength but extremely low elongation at break, indicating a stiffer system with a dense cross-linked network. The restricted molecular mobility in these formulations limits their capacity for energy dissipation, resulting in limited toughness. In contrast, CEA 5, CEA 6, and CEA 7 exhibit approximately half the tensile strength but significantly higher elongation at break. This behavior is attributed to the formation of a more flexible network structure, primarily due to the use of low-rigidity curing agents. The increased chain mobility in these systems enhances ductility but compromises mechanical strength.
To clarify the individual roles of Components A, B, and C in influencing the mechanical and curing behaviors of cold-mix epoxy asphalt, their contributing factors to each test were analyzed. Component A, composed of epoxy resin, polyol, and polyurethane prepolymer, provides the main cross-linked network structure and affects the material type and cross-linking density of the final matrix. In this study, the Component A of eight CEAs has a similar composition, dominated by Bisphenol-A, and the CEAs mainly rely on Component B to regulate mechanical properties. Component B, mainly amine curing agent, controls the rigidity and toughness of CEA through the chain segments of the component matrix and regulates the cross-linking density through the ratio of reactive functional groups (A:B). For instance, CEA 4 shows high strength but brittle failure due to the use of highly rigid aliphatic amine in B4, while B8 allows more flexibility. It also determines the rate and extent of the thermoset reaction. Therefore, Component B plays the most critical role in the mechanical properties (tensile and overlay tests) of CEA. Component C, used as a rheological and curing modifier, influences the activation energy and curing time. The DSC analysis in
Section 3.3 shows how increasing Component C content from 0% to 30% leads to changes in peak curing temperature, activation energy, DSC curve, and the curing time. Therefore, Component C plays a significant role in the curing behaviors (DSC tests) of CEAs.
According to “Specifications for epoxy asphalt pavement design and construction of airports” (MH/T5041-2019) [
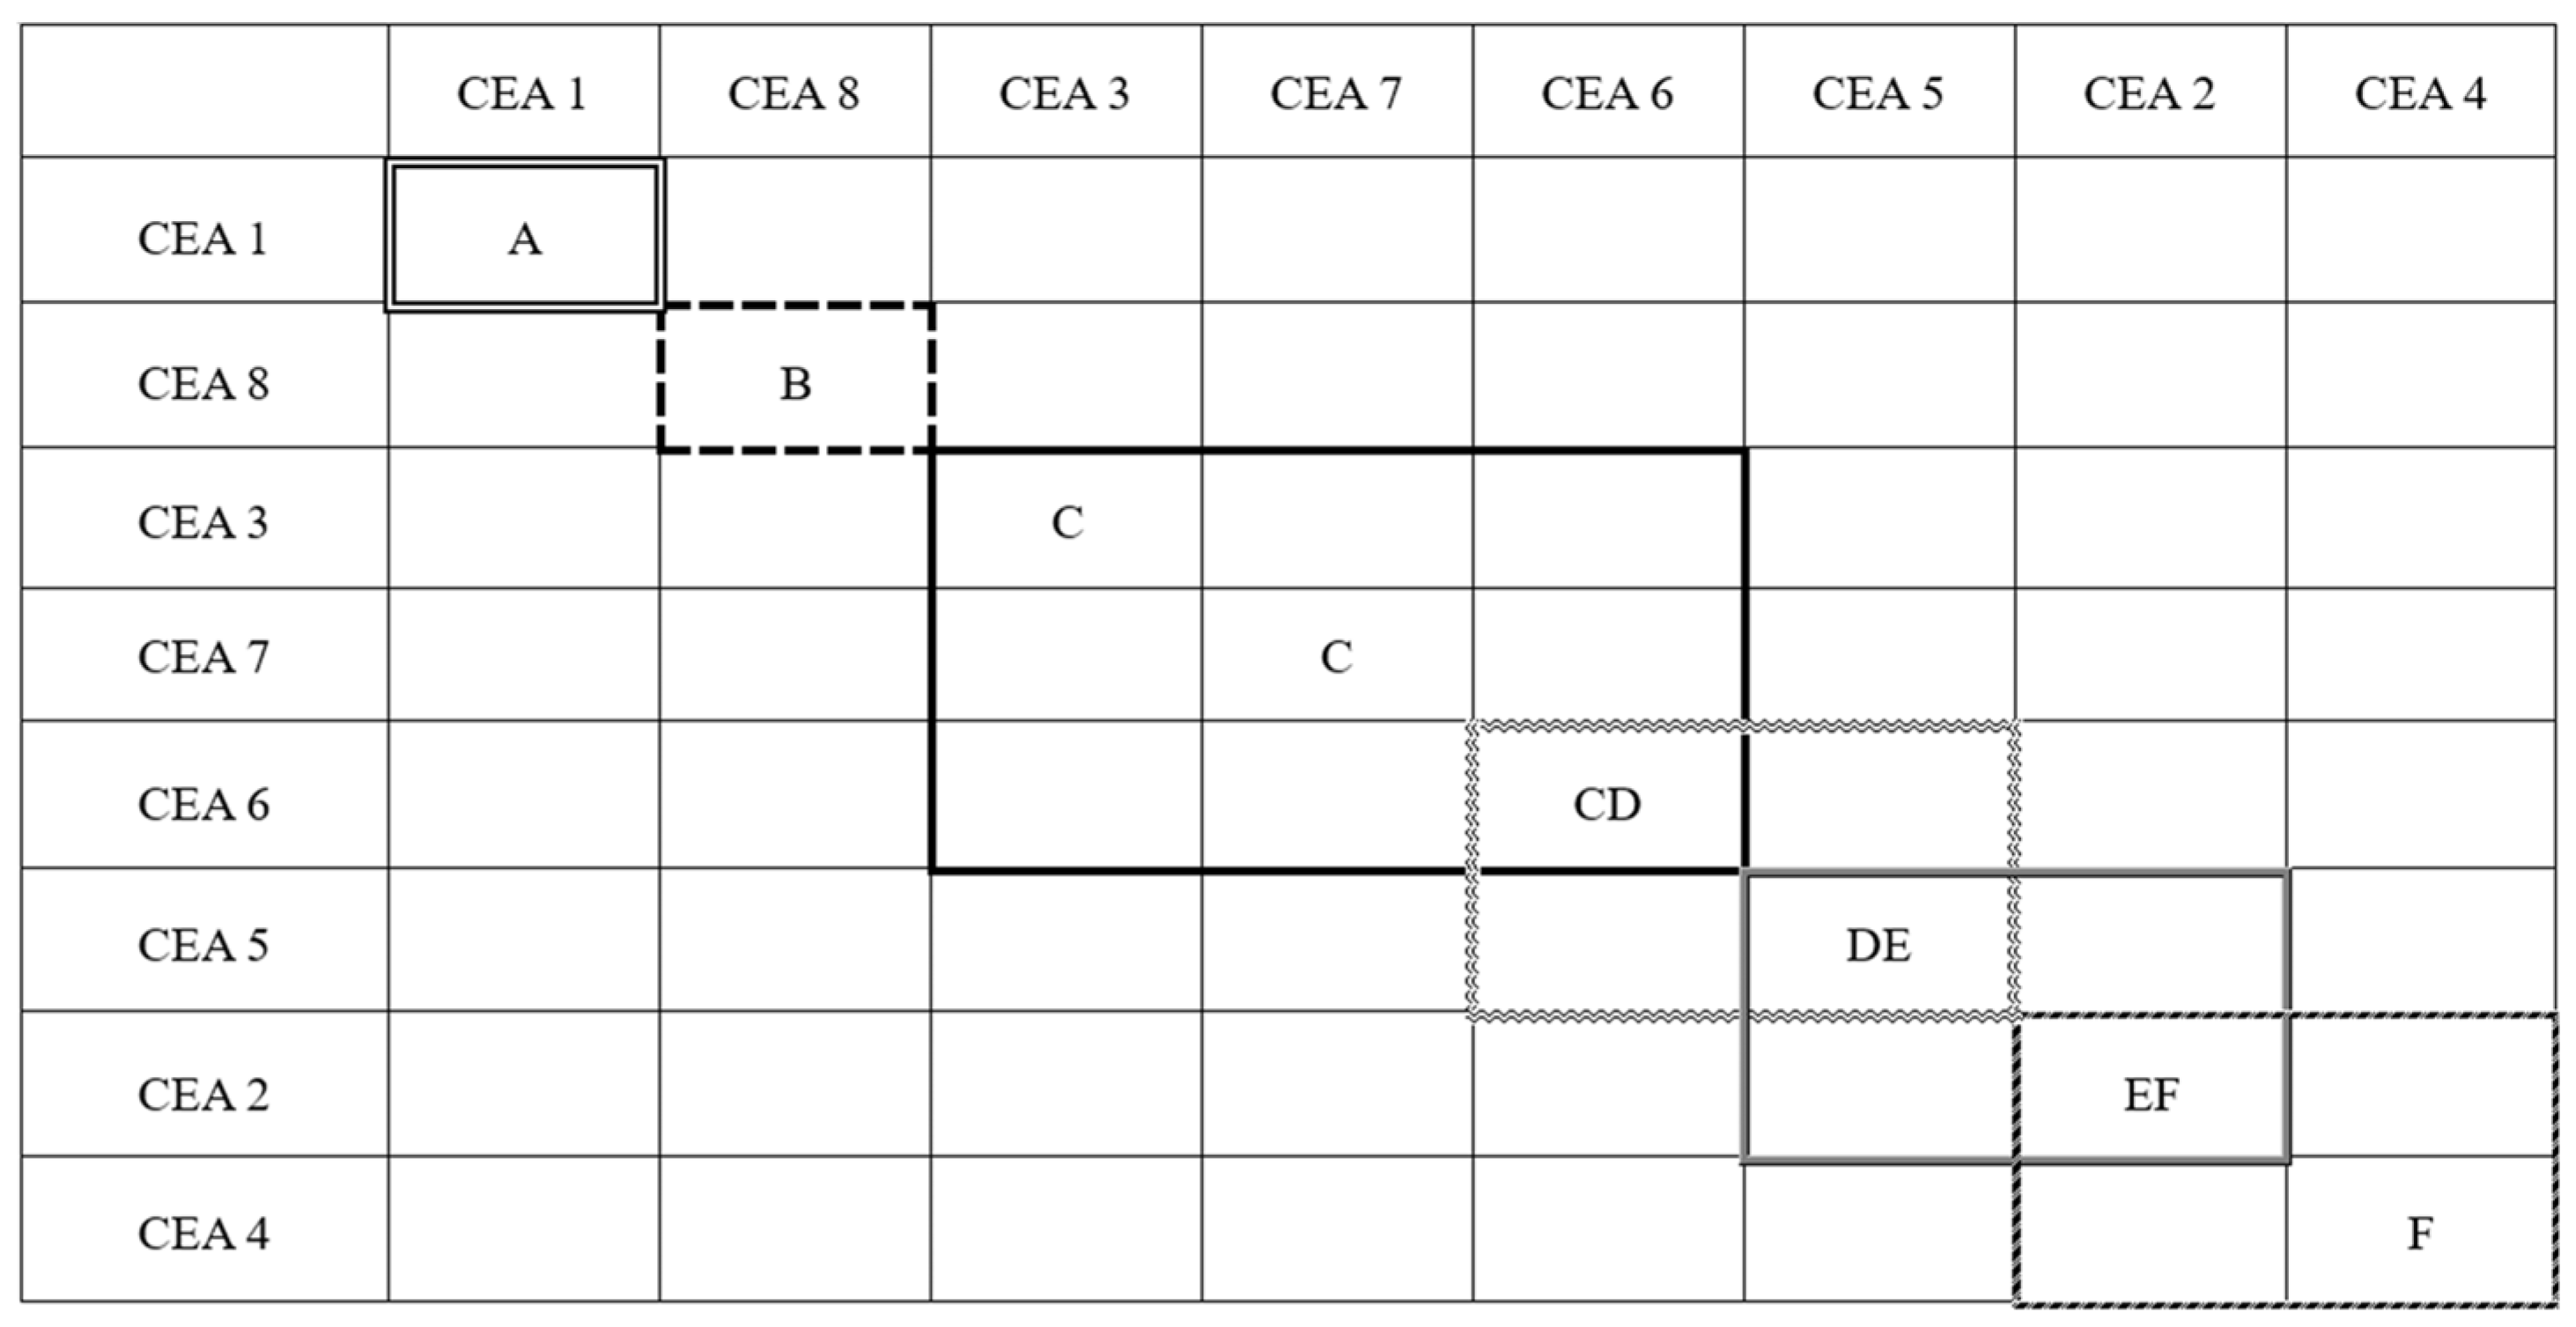
35], the tensile strength of cured epoxy asphalt at 23 °C should not be less than 1 MPa, and the elongation at break should not be less than 100%. Although all CEAs exhibit tensile strength values above the minimum requirement of 2 MPa, CEA 2, CEA 4, and CEA 5 with more rigid epoxy systems and higher cross-linking densities, fail to meet the requirement of elongation at break and demonstrate limited toughness. The brittle CEAs can significantly reduce the overlay’s ability to resist crack propagation when used over cement concrete pavements, especially in low-temperature regions. Therefore, the toughness is a critical parameter for selecting optimal materials for airport runway overlays. To quantitatively compare the performance among the eight CEAs and conduct material optimization, Tukey’s comparison was carried out to rank the elongation at break of the eight CEAs based on tensile test results. CEAs with elongations at break that were not significantly different between groups were categorized into the same level. The Tukey’s comparison results are shown in
Figure 4, where ‘A’ represents the best toughness and ‘F’ stands for the worst. It shows that the CEAs were divided into six levels, and CEA 1 and CEA 8 exhibit the best toughness with a ranking of ‘A’ and ‘B’, respectively. Therefore, based on the principle of maximizing toughness, CEA 1 and CEA 8 are recommended as the most suitable formulations for runway overlay.
3.2. Overlay Tests
Cement concrete pavements at major airports are subjected to heavy single-wheel loads exceeding 260 kN and experience wide temperature gradients from −30 °C to 45 °C. Under daily thermal cycling, the transverse and longitudinal joints undergo cyclic displacements of approximately 0.5 mm. Combined with aircraft landing impacts of 3~5 Hz, these conditions typically lead to reflective cracking in asphalt overlays within just 2~5 years. Reflective cracking originates from the cement concrete base and propagates upward through the asphalt overlay. Its formation can be attributed to horizontal joint movement caused by thermal fluctuations and bending or shear stress induced by dynamic aircraft loads. In asphalt overlay applications for airport pavements, significant displacements occur at cement concrete joints due to the combined effects of diurnal temperature variation and repeated aircraft loading. These displacements create stress concentrations at the interface between asphalt overlay and cement base, initiating microcracks that progressively propagate to the surface as energy accumulates at the crack tip.
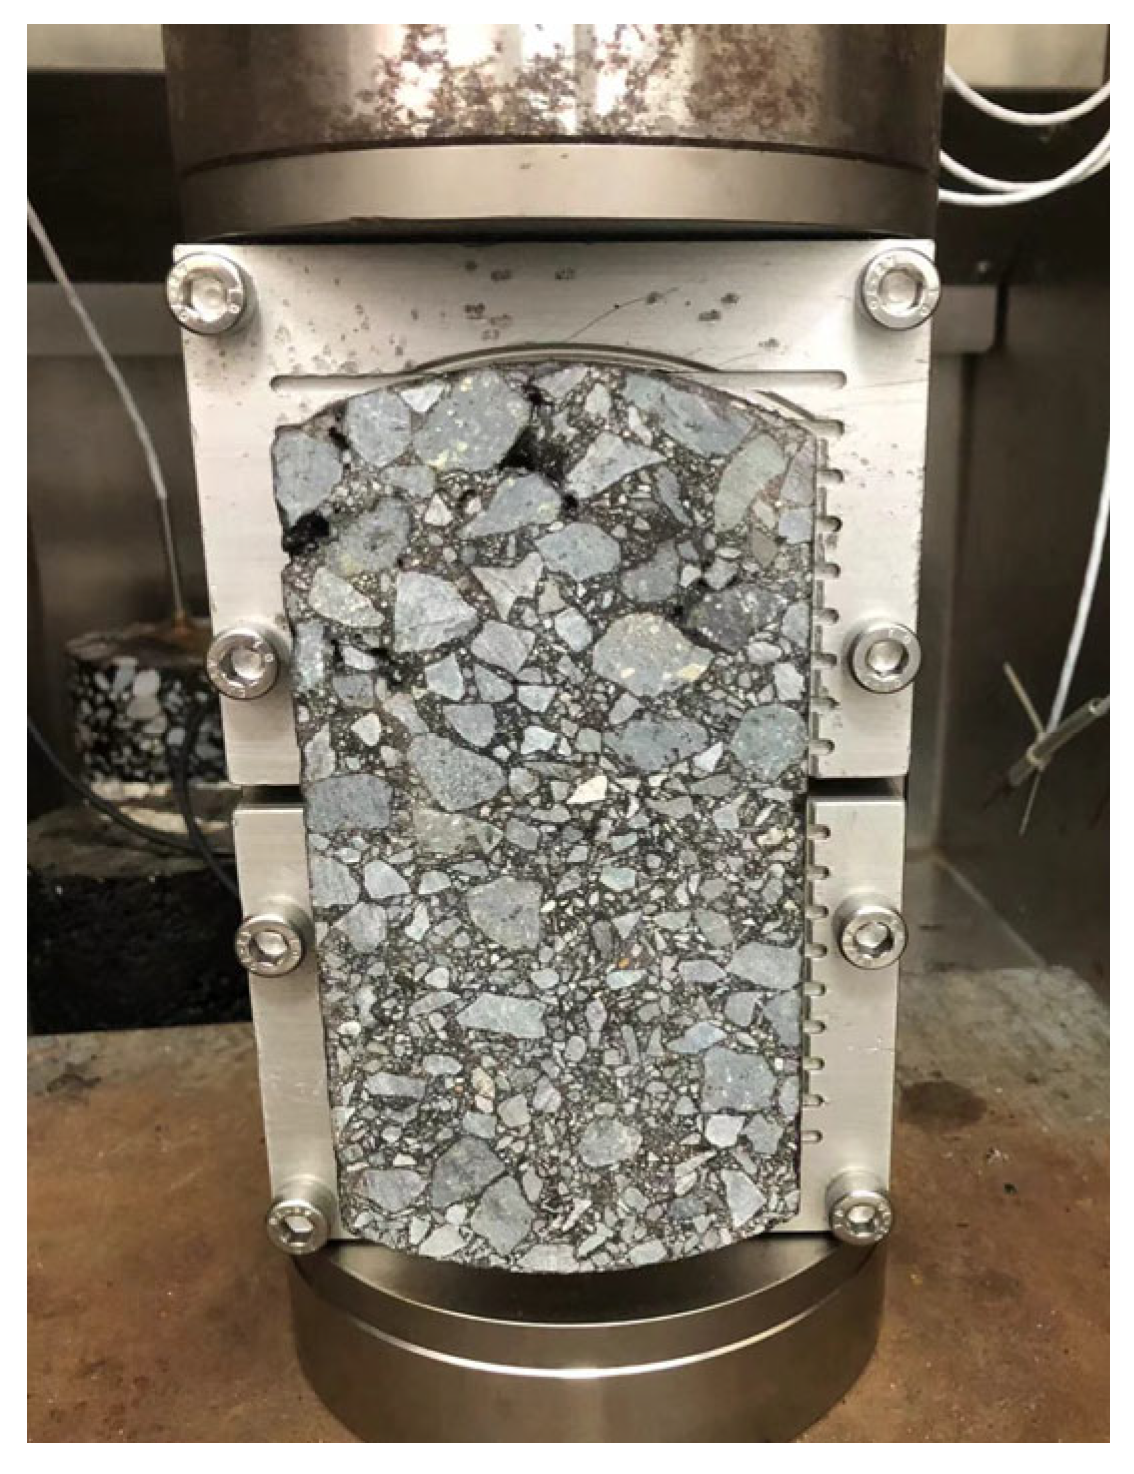
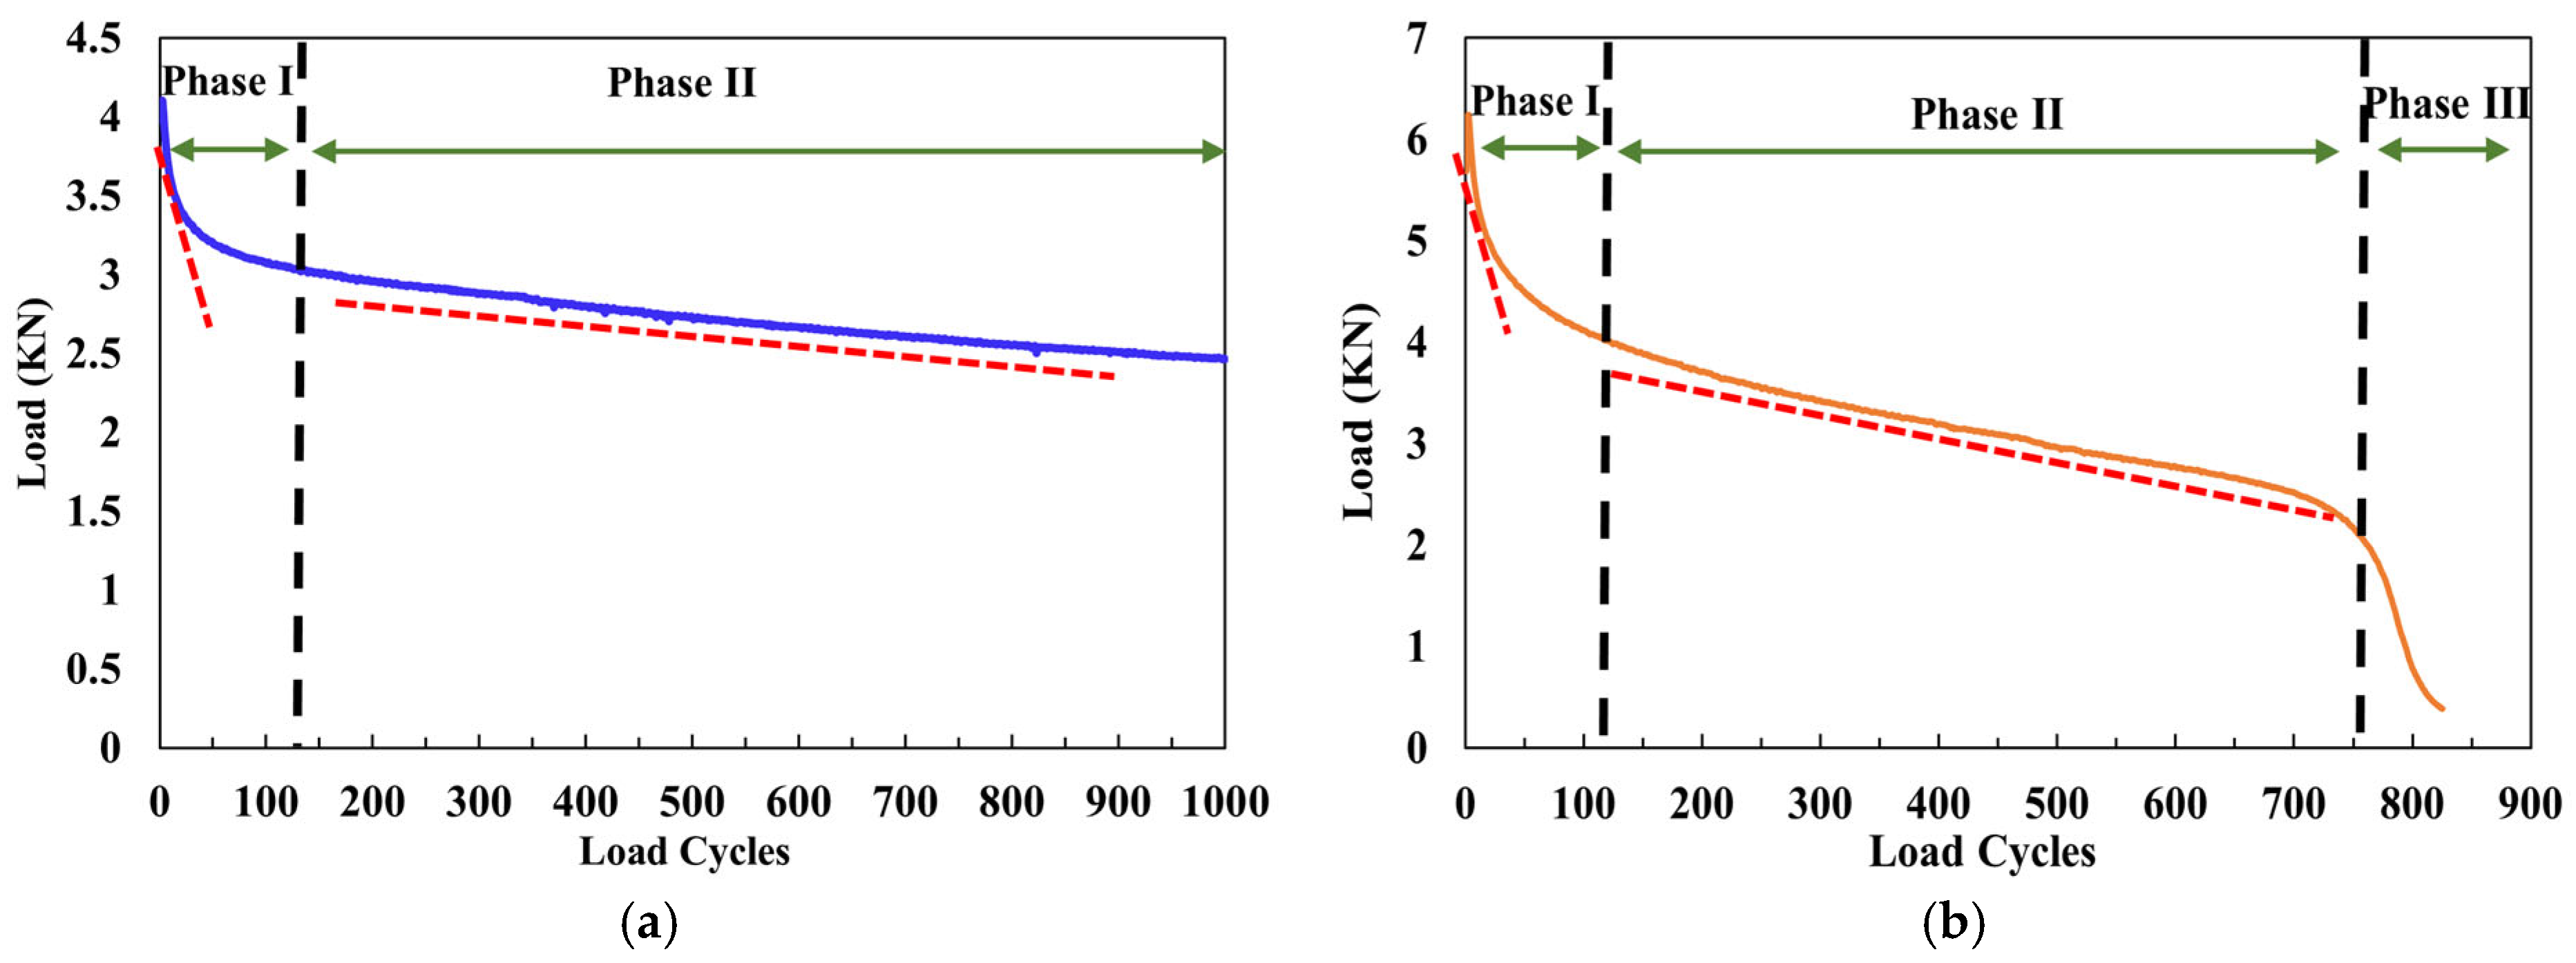
Therefore, the reflective cracking resistance of cold-mix epoxy asphalt mixtures (CEAMs) is a critical indicator for use in airport overlays, which reflects the ability to inhibit crack initiation, delay crack propagation, and dissipate fracture energy. In this study, the reflective cracking resistances of eight CEAMs were evaluated using overlay tests (OTs) under three representative temperatures (10 °C, 20 °C, and 30 °C). Typical load cycle curves in OT are shown in
Figure 5, including two-phase damage and three-phase damage. Phase I is characterized by a rapid load drop, indicating crack initiation at the notch tip and the localized plastic zone. Phase II represents the stable crack propagation stage, generally exhibiting linear decline in the load curve where the material maintains a relatively consistent damage accumulation rate. For those with less than 1000 load cycles, Phase III is clearly identifiable with a sudden drop, representing fracture instability with an inflection point between Phase II and Phase III. In contrast, CEAMs that sustain the full 1000 cycles remain within Phase II without entering the instability phase. The results of load cycles and load reduction in overlay testing are summarized in
Table 4. A higher load cycle or a lower load reduction indicates improved resistance to reflective cracking.
With respect to the effects of temperature, the CEAMs exhibit a significant increase in fatigue life and a notable decrease in load reduction as the test temperature increases. This trend can be attributed to the viscoelastic nature of epoxy asphalt. At lower temperatures, the CEAM becomes stiffer and more brittle due to reduced molecular mobility, which limits its ability to dissipate energy. As a result, stress concentrations induced by joint opening displacements cannot be effectively relieved, making it more susceptible to cracking initiation and propagation. It is worth noting that the deterioration of the load reduction with decreasing temperature is not linear for some CEAMs such as CEAM 2 and CEAM 7, which decrease sharply from 20 °C to 10 °C, which implies that the glass transition temperature (Tg) exists in this temperature interval.
However, CEA 4, CEA 6, and CEA 2 fail prematurely at 251, 546, and 927 cycles, respectively, with high load reductions exceeding 90%, suggesting poor energy dissipation and brittle fracture behavior. This is consistent with the tensile test results that CEAs with low elongations at break are less able to resist reflective cracking. Although performance improved at higher temperatures, these formulations remain below optimal toughness due to excessive brittleness under cold conditions. These results reflect the inherent limitation of highly cross-linked or rigid networks at low temperatures, where molecular mobility is suppressed, resulting in minimal stress relaxation and rapid crack propagation.
As the temperature increases, a clear improvement in reflective cracking resistance was observed. At 20 °C, all CEAMs except CEA 4 reach 1000 cycles, and load reductions decrease significantly, reflecting improved viscoelastic properties. At 30 °C, thermal softening further enhances cracking resistance, with all CEAMs completing 1000 cycles. CEA 8 showed exceptional performance with a minimal load reduction of just 3.0%, followed by CEA 3 (15.1%) and CEA 1 (20.4%). The almost constant load of CEA 8 suggests a continuous and flexible cross-linked network as temperature increases, contributing to enhanced stress dissipation and cracking resistance. CEA 3 also sustains 1000 cycles across all temperatures with an average load reduction of 21.1%, though its 30 °C performance was inferior to CEA 8. CEA 1, which performs well in the tensile tests, exhibits moderate but smooth temperature-dependent toughness. While not as ductile as CEA 8 or CEA 3, its balanced response across the full temperature spectrum suggests good applicability in regions with large temperature variations. In line with the lowest elongation at break, CEA 4 is the only formulation that fails before 300 cycles at 10 °C, with consistently high load reductions ≥ 84% across all temperatures. It indicates that an excessively rigid cross-linked matrix, which restricts energy absorption and strain accommodation, will result in poor resistance to reflective cracking and is, therefore, unsuitable for airport runway overlay.
Based on fatigue life and load retention, the CEAMs were manually categorized as Grade A for CEA8 and CEA3, Grade B for CEA1, Grade C for CEA5, and Grade D for CEA 7, CEA 2, CEA 6, and CEA 4. From an engineering perspective, CEA 8 demonstrates strong potential for applications requiring high cracking resistance under wide temperature ranges and heavy traffic loads, such as stress-absorbing membrane interlayers (SAMI) or overlays on rigid airport runways. Its ability to retain structural integrity and prevent reflective cracks makes it especially suited for airfield pavements with frequent landings. CEA 1, while slightly more temperature sensitive, remains a reliable option for northern climates or regions with large day–night temperature fluctuations. For Grades B and C, performance may be improved by incorporating crumb rubber, mineral fillers, or other toughening agents to enhance low-temperature flexibility and energy dissipation. Additionally, optimized material design with chemical agents may reduce stress concentrations and delay microcrack initiation. For those belonging to Grade D, structural improvements should begin with adjusting the material matrix. A flexible network and an appropriate A:B ratio should be constructed to increase toughness and prevent premature cracking.
Based on the results of the tensile tests and overlay tests, CEA 1 and CEA 8 were identified as the most promising formulations for airport runway overlay applications. To further understand their performance and ensure construction reliability, the curing behaviors and reaction kinetics were investigated in the subsequent sections.
3.3. Curing Behaviors Based on DSC Tests
In field applications of CEAM overlays for airport runways, curing behaviors directly influence both construction workable time and long-term performance. It is critical for CEAMs to balance the need for rapid strength development with sufficiently wide construction time. When curing proceeds too rapidly, viscosity increases prematurely, limiting the workable time and compromising pavement quality. Conversely, if the cure is too slow, pavements will suffer from a late opening time to traffic, especially for time-sensitive maintenance in high-traffic airports.
Based on the tensile and overlay test results, CEA 1 and CEA 8 were selected for further investigation of their curing kinetics. To further enhance their mechanical properties and suitability for concrete pavement overlays, a toughening modifier (Component C) was added with different proportions (0%, 10%, 20%, and 30%), by weight of Component A. The corresponding materials were denoted as CEA 1-0/10/20/30%, and CEA 8-1-0/10/20/30%. In this paper, DSC tests were performed to evaluate the curing process of those eight formulations of CEA 1 and CEA 8 under four non-isothermal heating rates (5, 10, 20, and 30 K/min). The reaction conversion () and peak temperature () can be obtained from heat flow curves. These experimental results were further fitted using classical non-isothermal kinetic models to quantify the curing dynamics. The autocatalytic model was applied to describe the reaction mechanisms, which has proven to be effective for epoxy resins. Additionally, key kinetic parameters such as activation energy () and the pre-exponential factor () were calculated using linearized forms of the Kissinger equation and the Ozawa method. This approach allows a robust comparison of the reactivity and curing behaviors of different CEAs and provides a predictive basis for optimizing curing schedules under variable field conditions.
The basic assumptions of the DSC-based kinetic modeling are as follows: (1) The measured heat flow from DSC testing is directly proportional to the rate of reaction progress, and the total heat released is uniquely related to the degree of conversion. (2) In terms of kinetic modeling, the double-parameter autocatalytic model (Sesták–Berggren equation) assumes that the reaction mechanism can be effectively described by a macroscopic rate function of the form , where is the conversion degree. It further assumes that the reaction is chemically controlled throughout the curing process and does not transition into a diffusion-limited regime, even at high degrees of conversion. (3) Activation energy () is calculated using the iso-conversional Starink method, which assumes a constant within narrow intervals. (4) The Málek method is employed to confirm the suitability of the autocatalytic model by analyzing the peak locations of characteristic functions and . If these functions satisfy the condition with , the curing reaction is well described by an autocatalytic mechanism. (5) The model does not account for potential deviations caused by vitrification effects, localized phase separation, network inhomogeneities, or physical cross-linking.
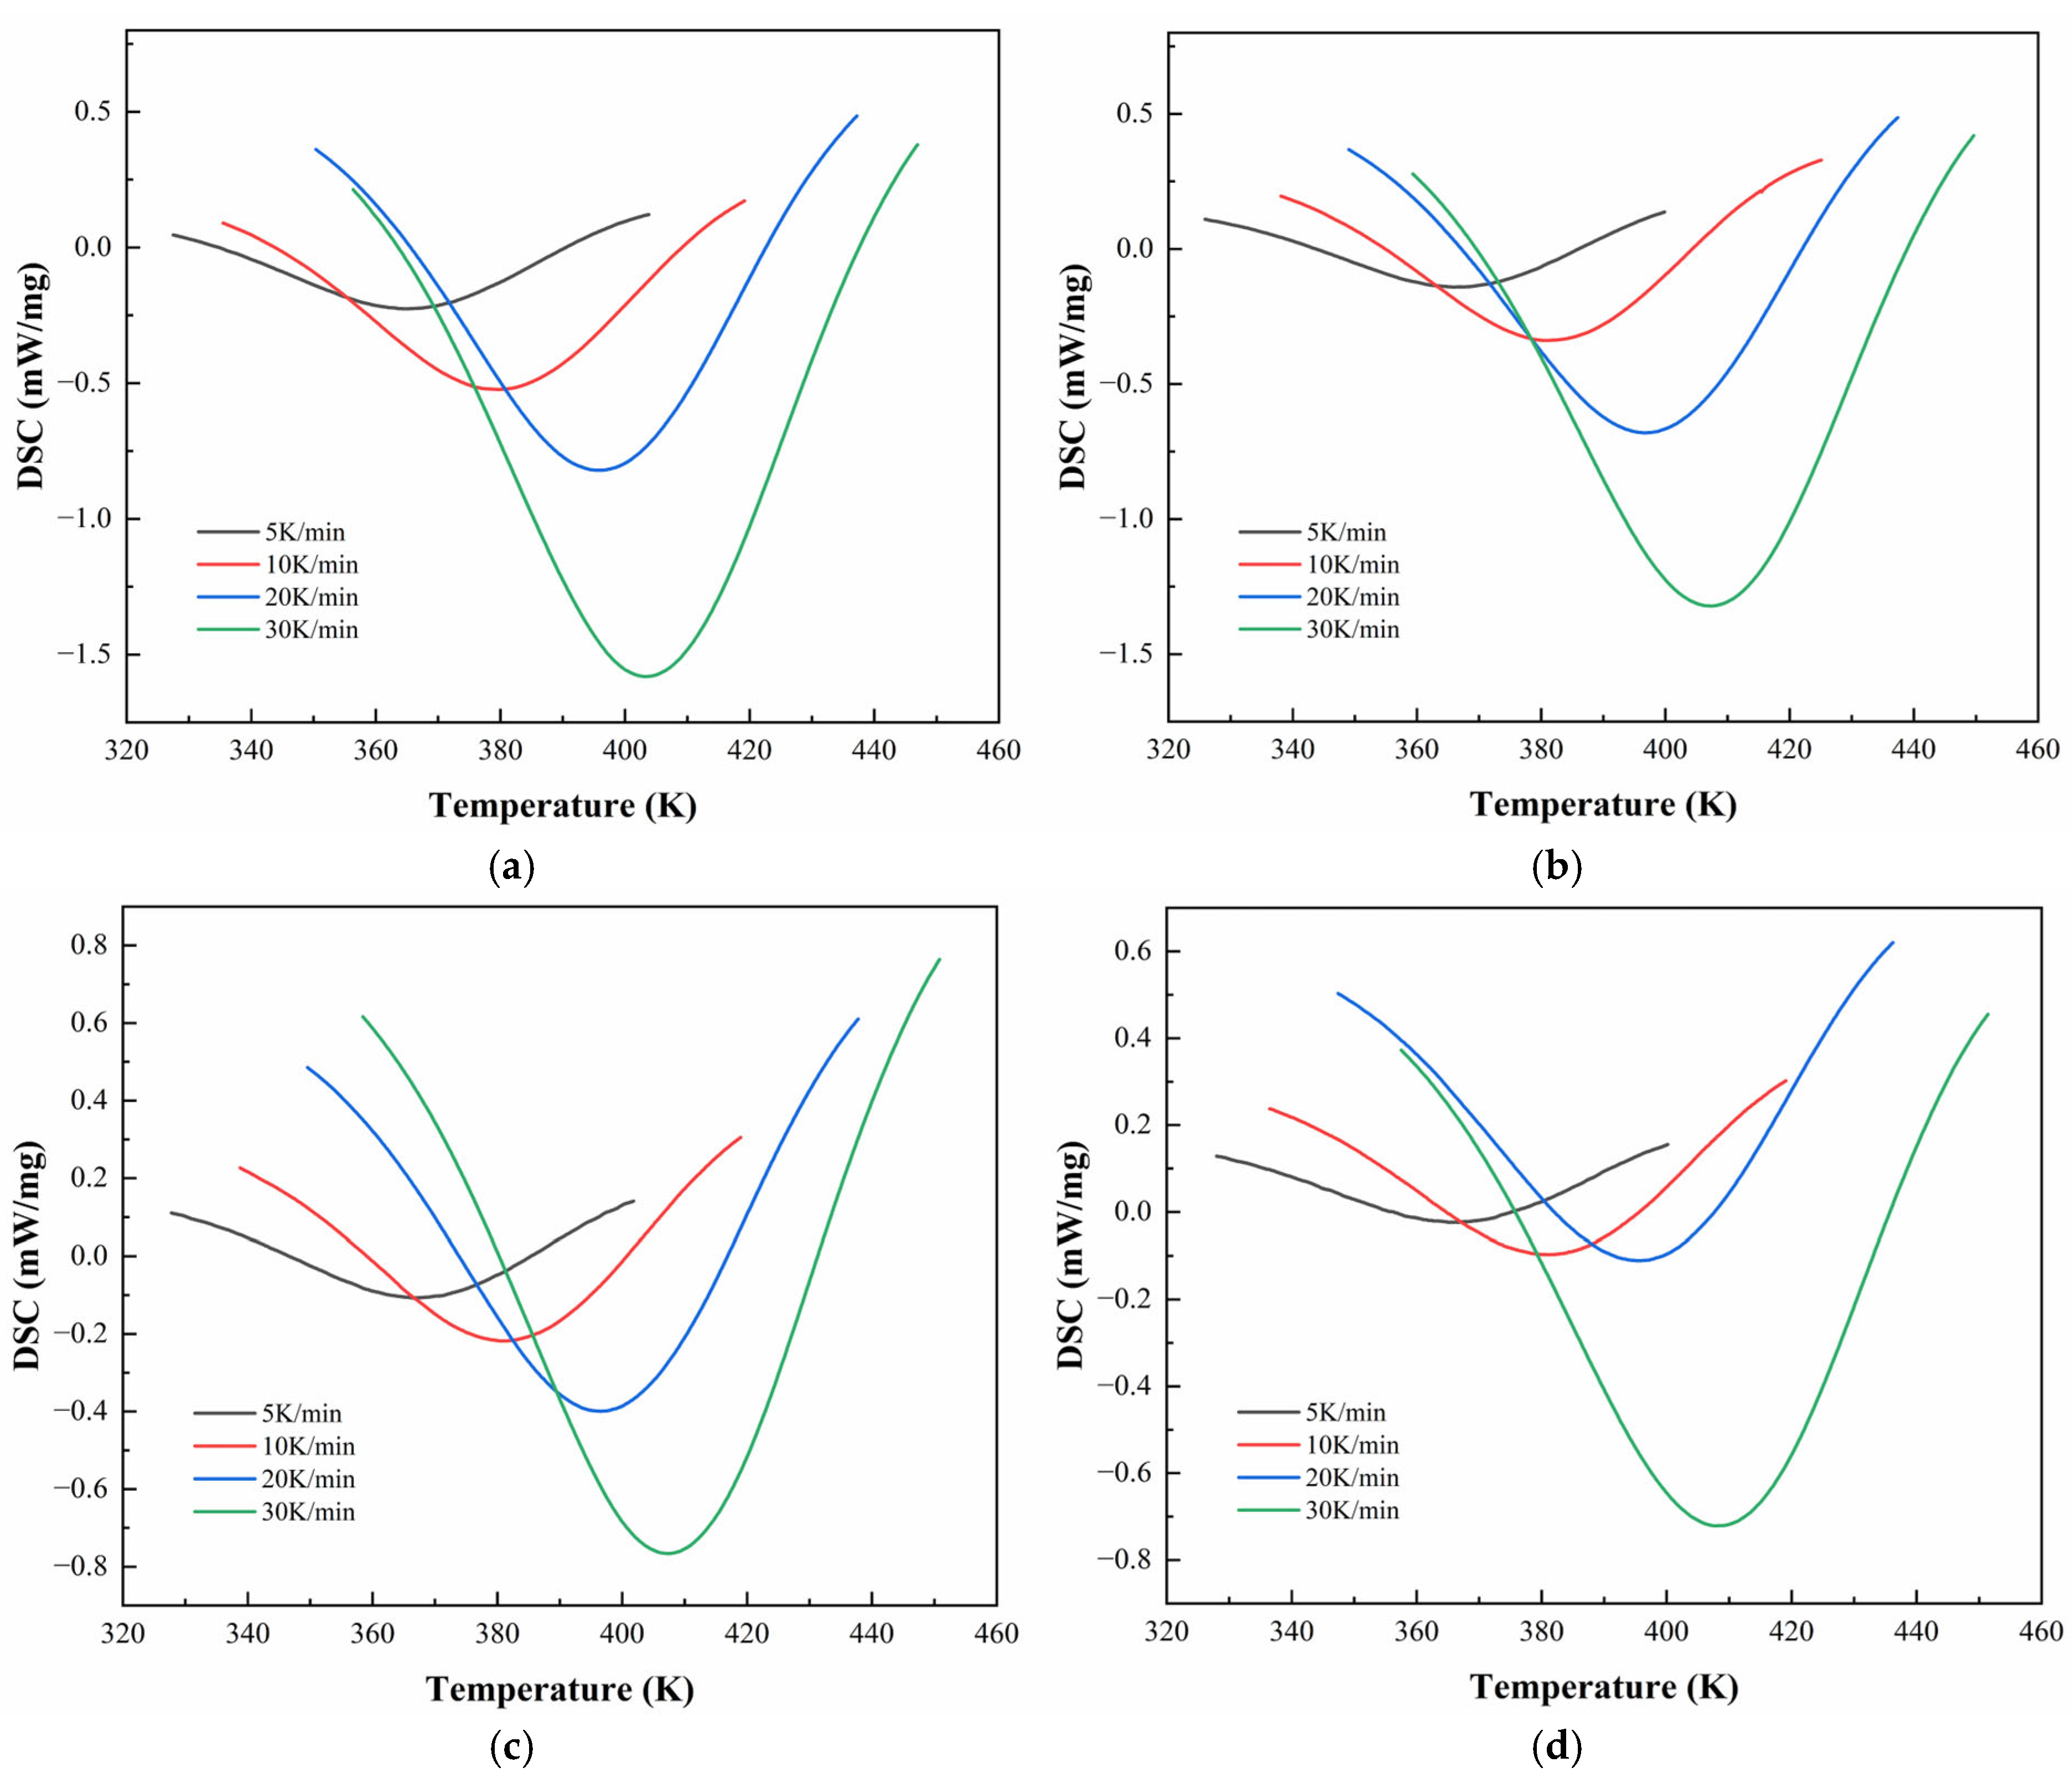
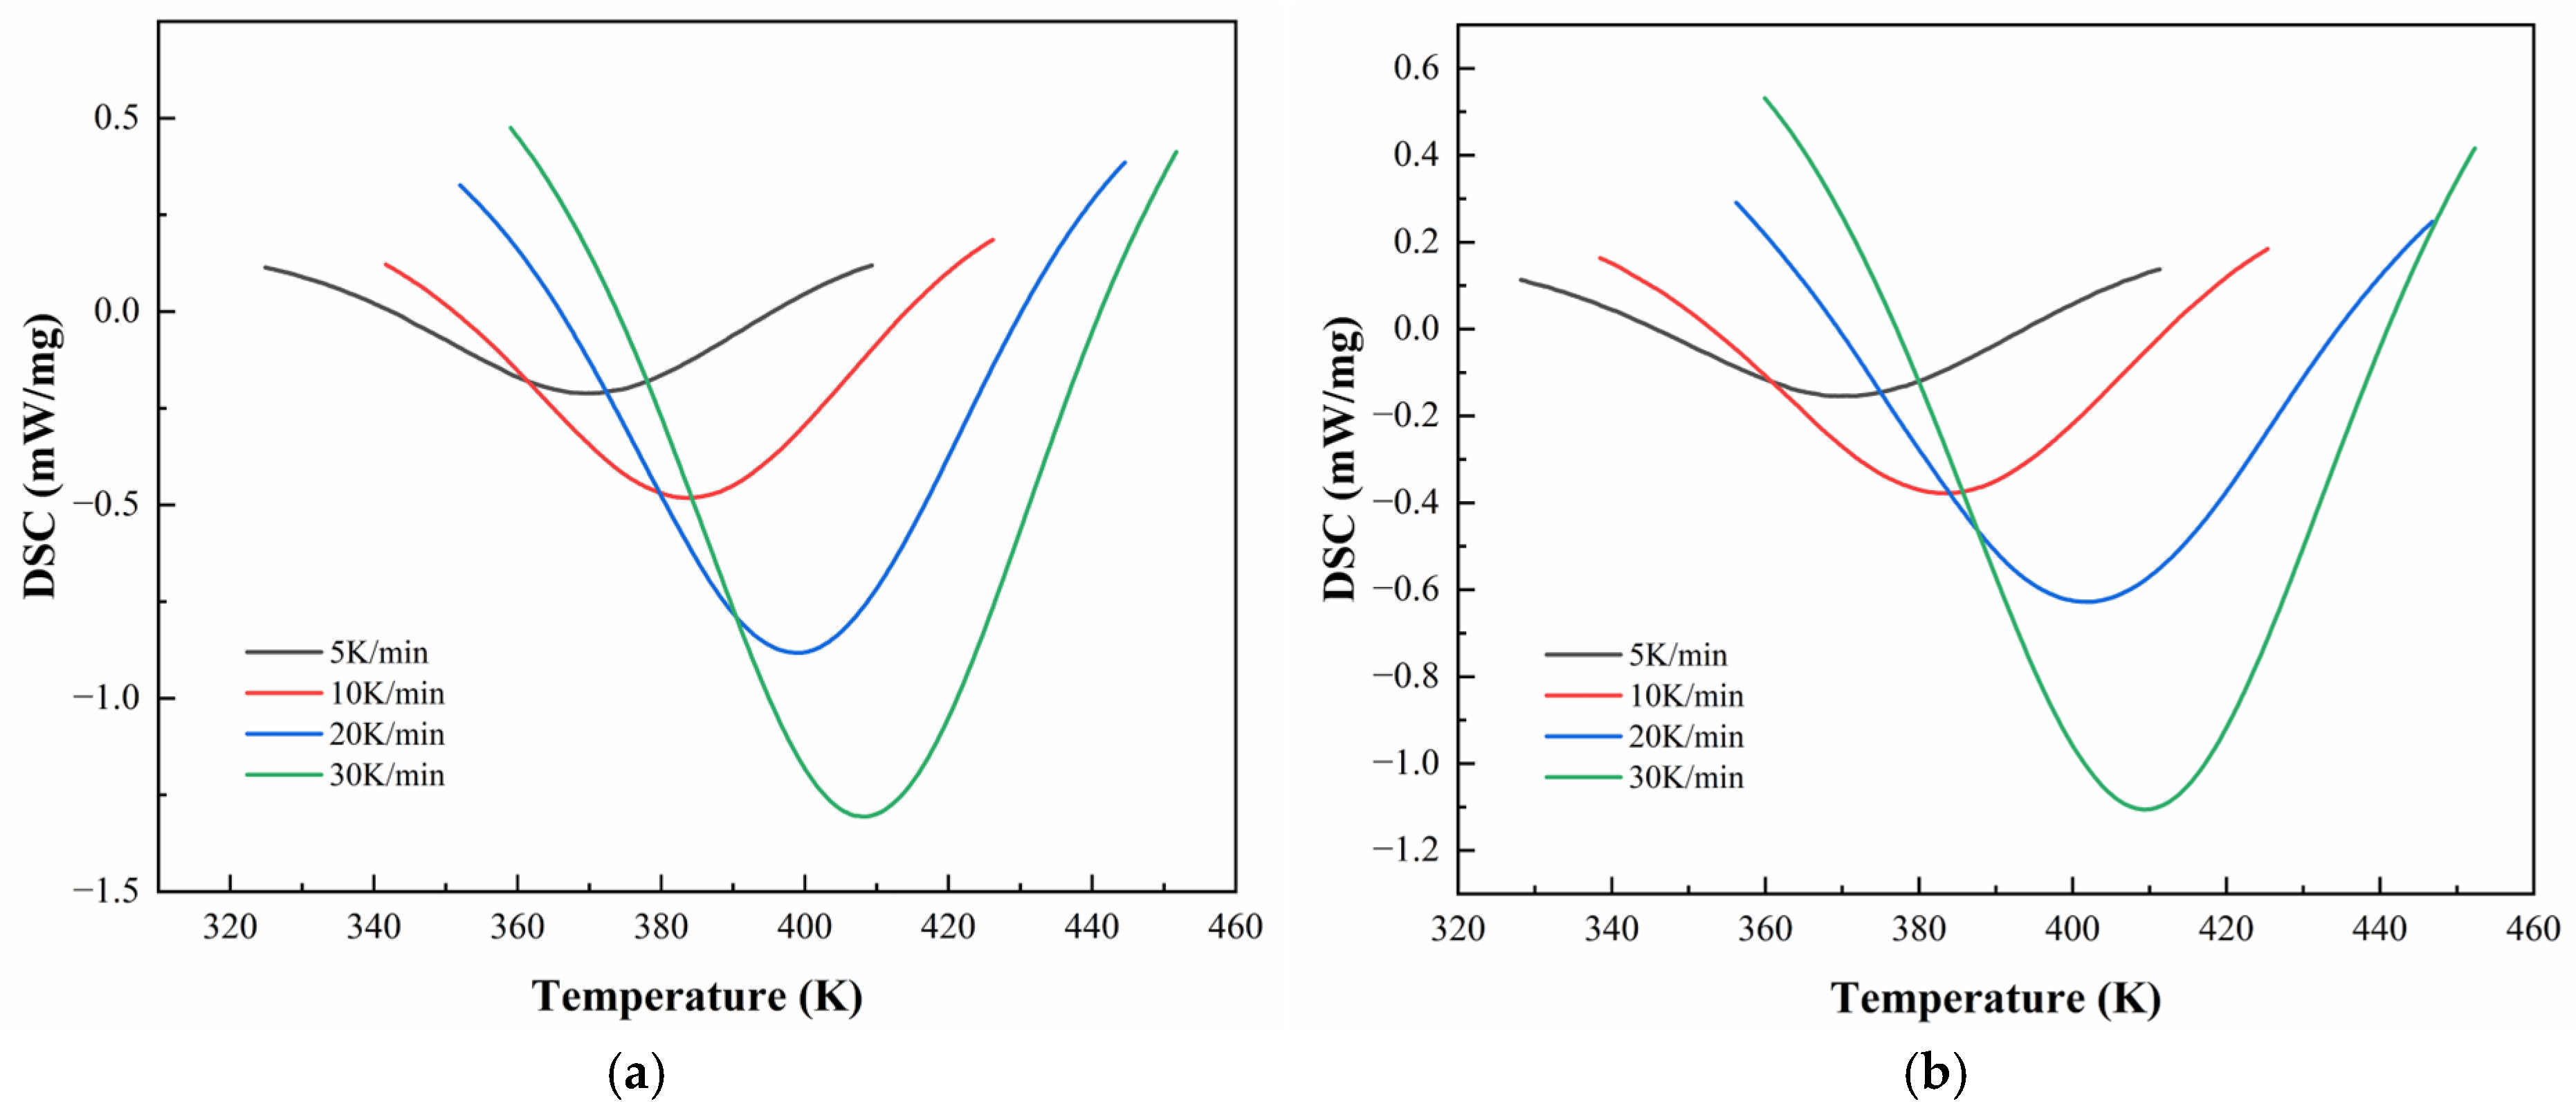
Figure 6 and
Figure 7 illustrate the DSC thermograms of CEA 1 and CEA 8 incorporating different proportions of component C under four heating rates. All curves exhibit a single exothermic peak, indicating that both materials follow a dominant one-step curing reaction, consistent with an autocatalytic mechanism. The peak temperature (
) systematically shifts toward higher temperatures with increasing heating rates, reflecting the kinetic delay associated with thermal diffusion and reaction initiation.
The detailed temperatures corresponding to DSC peaks (
) are summarized in
Table 5. For CEA 1,
increases from 364.6 K to 403.1 K across heating rates, while CEA 8 exhibits slightly higher
values ranging from 369.4 K to 411.5 K. Among various formulations, the incorporation of component C (a reactive toughening agent) leads to a rightward shift in
for both materials, accompanied by a clear reduction in peak height and narrowing of the exothermic curve. This suggests that component C may also serve as a kinetic modulator, which helps moderate the curing rate at moderate levels (10–20%), extending the processing window without sacrificing thermal reactivity. In addition, CEA 1 without Component C demonstrates a lower initial
and higher exothermic enthalpy than CEA 8, indicating a faster cure initiation and higher early-stage cross-linking rate. However, after the addition of Component C, the difference in
between CEA 1 and CEA 8 narrows, effectively aligning their curing windows and improving processing control.
The non-isothermal curing kinetics of the selected CEA 1 and CEA 8 with varying Component C content were quantitatively evaluated using DSC data, based on the assumption that the rate of the epoxy curing reaction is proportional to the heat flow rate. The fundamental kinetic model is given by Equation (3):
where
is the curing degree or conversion rate,
is time, s,
is the curing reaction rate,
is the temperature-dependent reaction rate constant, and
is the kinetic model function. The temperature dependency of the rate constant
follows the Arrhenius equation:
where
is the pre-exponential factor (s
−1),
is the apparent activation energy (J/mol),
is the universal gas constant (8.314 J/mol·K), and
is absolute temperature (K).
Combining both relationships yields the general form of the epoxy curing process:
The apparent activation energy
is a key kinetic parameter that reflects the difficulty of the curing process. A lower
indicates easier reaction progression, while a higher
corresponds to a more sluggish reaction. Since
is not constant during the entire curing process, its evolution with the curing degree (
) can be studied using the iso-conversional method. The Starink method is commonly employed for this purpose and is expressed as [
32]
where
is the heating rate,
is the peak temperature corresponding to a fixed conversion
, and
is the activation energy at that conversion. By plotting
against
for multiple heating rates, the slope of the linear fit allows direct calculation of
at different curing stages.
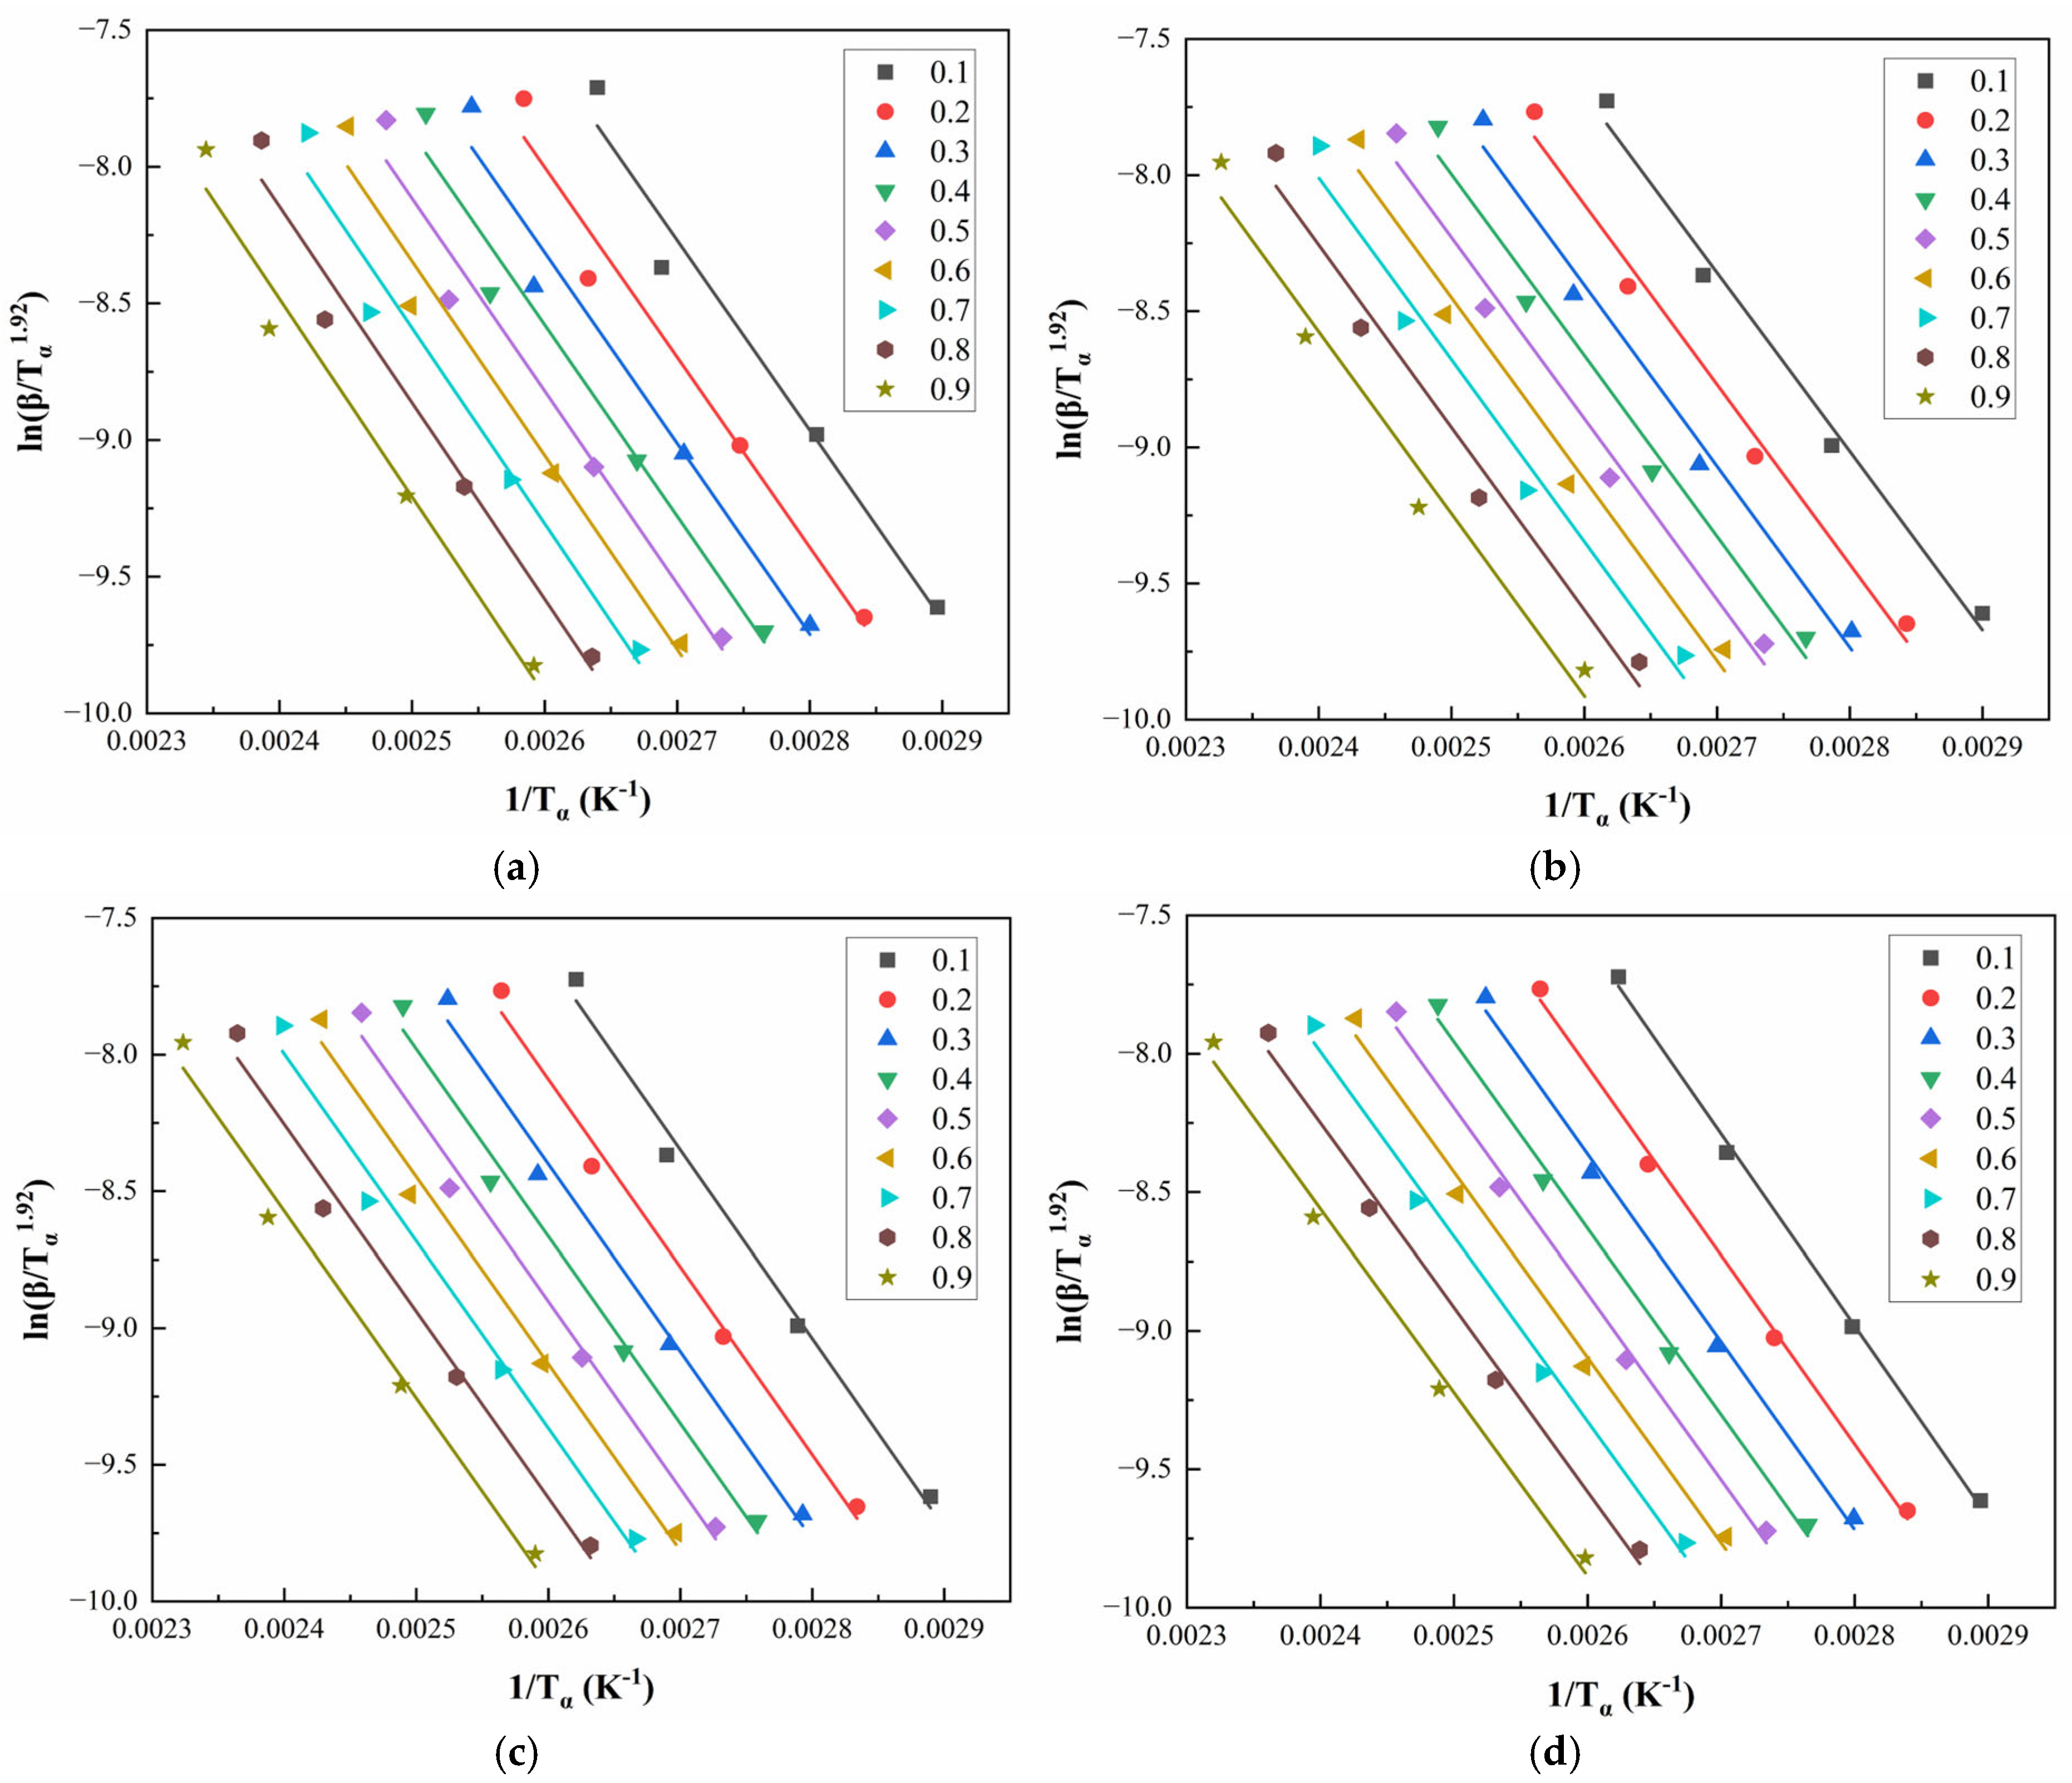
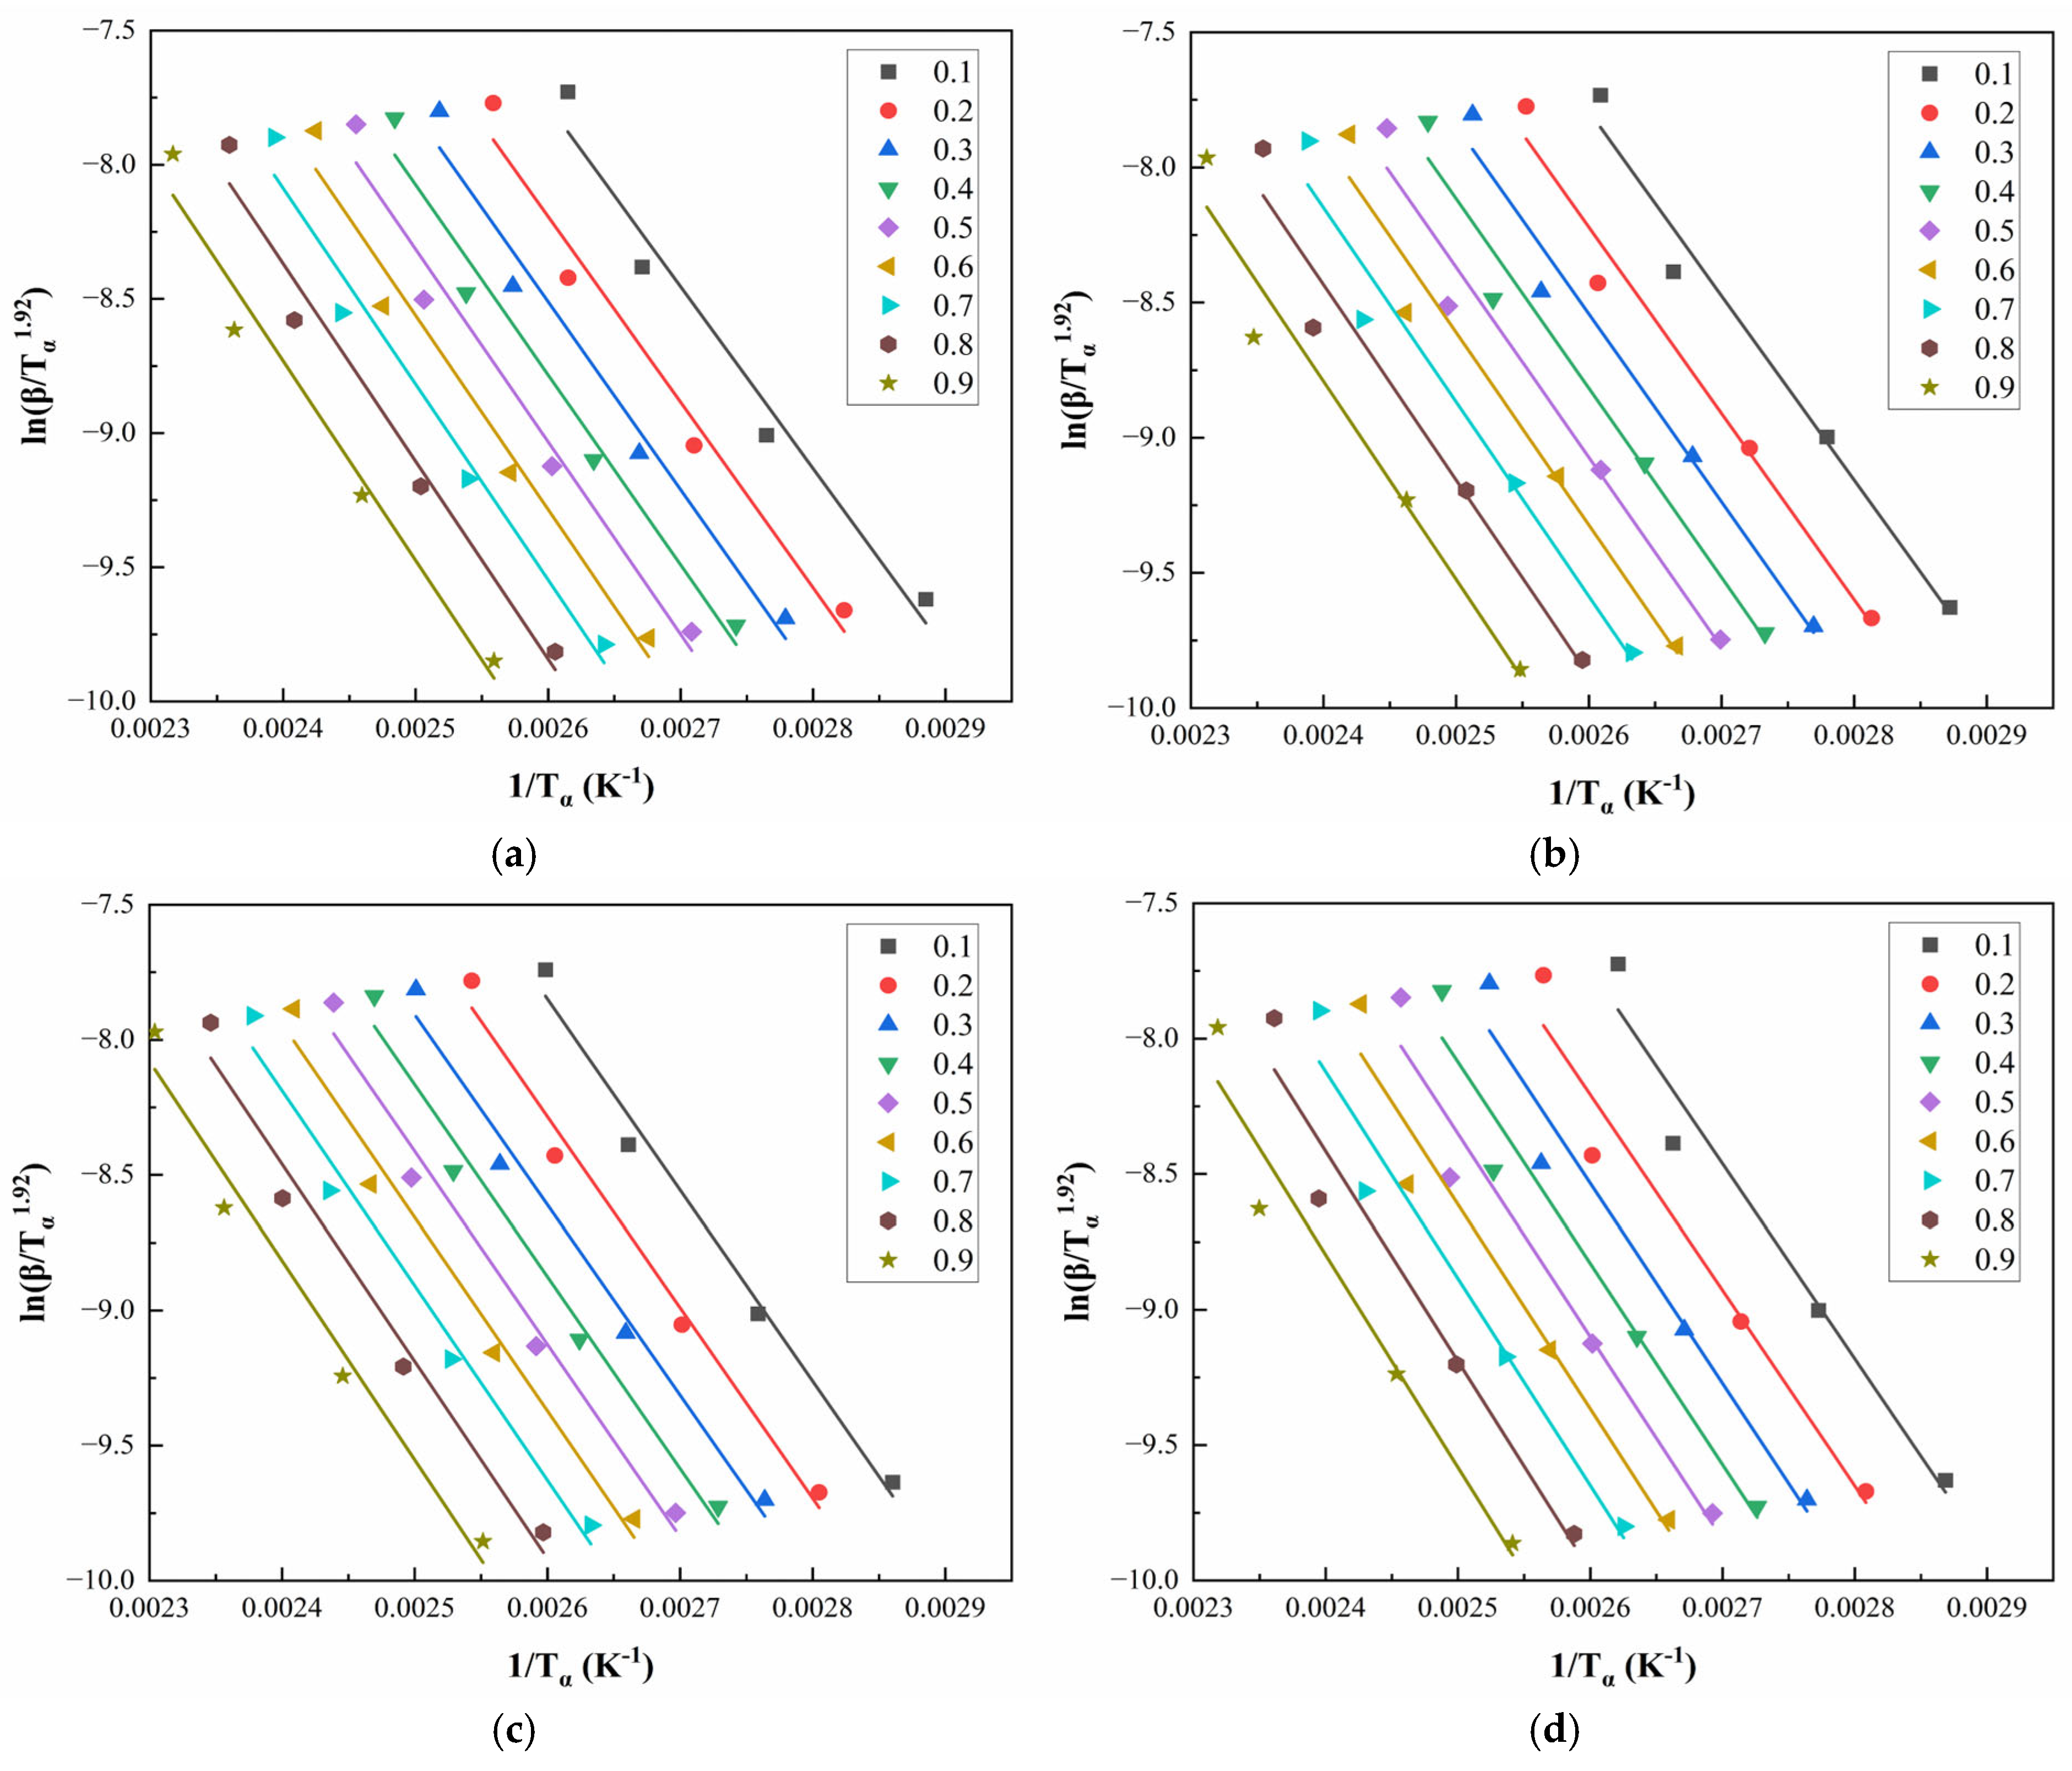
Figure 8 and
Figure 9 illustrate the linear regression results using the Starink method for solving
for CEA 1 and CEA 8, respectively. The calculated activation energy values exhibit a decreasing trend with increasing
, suggesting that the curing reaction becomes progressively easier as it proceeds. This phenomenon may be attributed to two coupled effects. On the one hand, viscosity reduction during early-stage heating improves molecular mobility, thus lowering the energy barrier for molecular diffusion. On the other hand, hydroxyl groups generated during the initial reaction stages may act as catalysts, further reducing the overall activation energy required for continuation. This confirms the autocatalytic nature of the CEA curing process and provides theoretical support for optimizing heating schedules in practical applications.
To describe the complex curing behavior of CEA systems, the selection of an appropriate reaction model is crucial. Previous studies have demonstrated that the curing of thermosetting resins such as epoxy resins is well characterized by an autocatalytic model with two kinetic parameters. In this study, the double-parameter autocatalytic model was adopted as the reaction function
, as shown in Equation (7).
Substituting into the general rate equation leads to the full kinetic model:
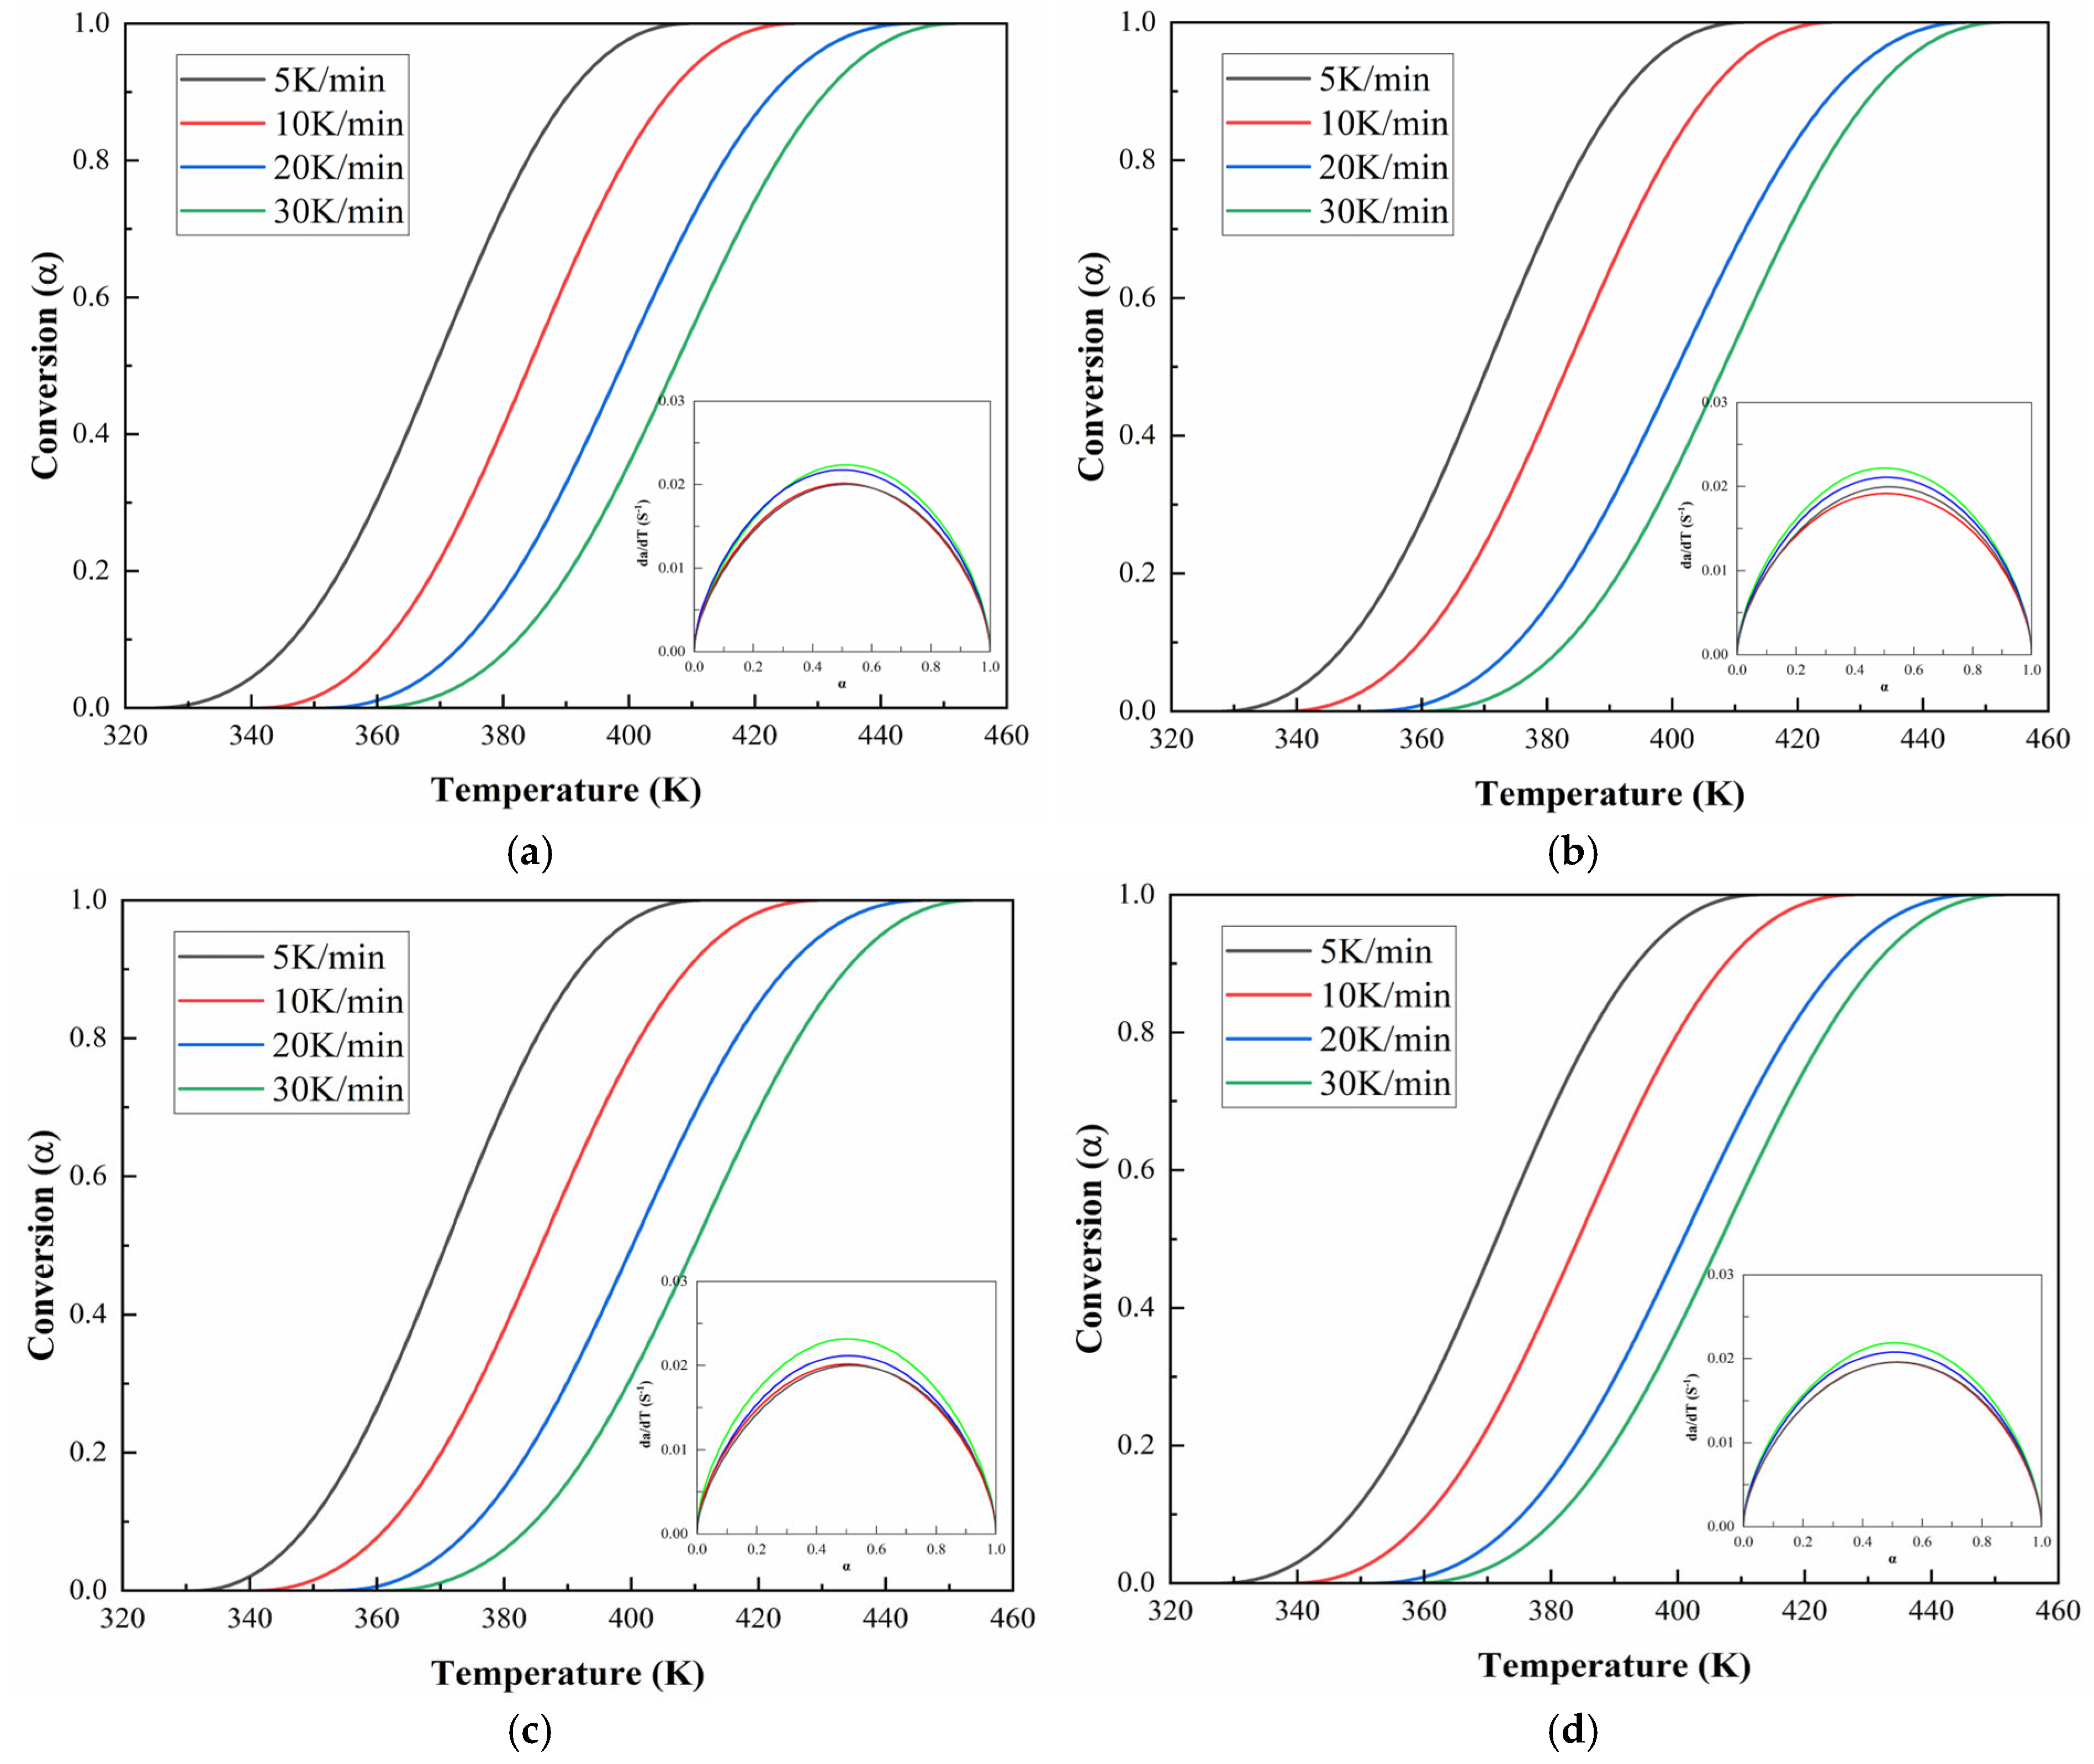
Figure 10 and
Figure 11 demonstrate the evolution of curing degree (
) with temperature under various heating rates for CEA 1 and CEA 8, respectively. The results reveal that at any given temperature, higher heating rates lead to lower curing degrees and sharper conversion curves. This indicates that increasing the heating rate not only accelerates the curing process but also compresses the reaction window, reducing the available working time. The
-T profiles for both CEA 1 and CEA 8 show typical S-shaped autocatalytic reactions. Initially, the conversion remains low, marking the induction period corresponding to early-stage gelation. As the temperature rises, the reaction accelerates rapidly due to increased molecular mobility and greater accessibility of reactive groups, facilitating the formation of a cross-linked three-dimensional network. This middle stage is also where vitrification may begin to occur. As the system approaches the final phase, the depletion of reactive functional groups and the rise in viscosity limit further reaction progress, causing the curing rate to slow and plateau.
This behavior is further supported by the reaction rate curves, where is plotted against . These curves exhibit a bell-shaped profile, with the curing rate peaking at around = 0.5. This indicates that the maximum rate of network formation occurs near the midpoint of the reaction, after which the declining availability of reactants cause a gradual drop in reactivity. The figures strongly support the adoption of a double-parameter autocatalytic model to describe the system kinetics. Moreover, the temperature dependence of the curing rate must be carefully managed in practical applications: although elevated temperatures accelerate curing, Van’t Hoff’s law suggests that the equilibrium conversion of an exothermic reaction may decrease as temperature increases. Therefore, optimization requires balancing between rapid early-stage reaction and high final conversion, particularly in time-sensitive construction environments.
To rigorously determine the reaction model and extract kinetic parameters, the Málek method was applied [
33], which helps to determine two key parameters:
where
, and
is an integral form of the temperature, calculated by Equation (11),
According to the criteria proposed by Málek, the corresponding conversion degrees at their respective peak values of , , and are denoted as , , and . If these functions satisfy the condition with , the curing reaction is well described by an autocatalytic mechanism. This condition was met for both the CEA 1 and CEA 8 systems under all tested conditions, further confirming the applicability of the autocatalytic model for these cold-mix epoxy asphalts.
To determine the kinetic parameters, Equation (8) was logarithmically transformed to allow linear regression fitting:
In this expression, the apparent activation energy can be obtained from Starink analysis, and the term was introduced to simplify the regression. Using data within the conversion range , was plotted against , and linear fitting was performed. The slope of the resulting line provided the overall reaction order , from which the secondary exponent can be calculated. The pre-exponential factor was derived from the intercept.
The resulting parameters for each CEA (reaction exponents
,
, and pre-exponential factor
) are summarized in
Table 6. These values were then substituted into the kinetic expression to establish the complete curing model equations for each CEA formulation, as shown in
Table 7. CEA 8 exhibits slightly higher apparent activation energy (
) than CEA 1, suggesting a more energy-demanding network initiation in CEA 8 systems. Component C has different effects on the
values of CEA 1 and 8, perhaps due to different toughening reactions caused by different resin matrixes. For CEA 1, the addition of Component C results in a lower
, while the highest
(62.2 kJ/mol) was observed in CEA 8 with 30% Component C, indicating that it notably impedes the molecular mobility and slows down the early-stage reaction of CEA 8.
The and values from the Málek method further support the autocatalytic nature of the curing process, as all CEAs satisfy the criteria with , confirming that the dual-parameter autocatalytic model is well suited for describing the complex cross-linking behaviors in this study. The reaction orders and show that most systems maintain consistent autocatalytic features, with ranging from 0.157 to 0.207 and ranging from 1.116 to 1.288. The relatively high values indicate that diffusion-controlled effects and network growth dominate the later stages of curing. Compared with CEA 1, the CEA 8 series tends to exhibit larger values and lower values, especially at higher Component C contents, suggesting a more constrained cross-linking mechanism with slower nucleation but faster propagation once activated. In practice, these distinctions imply that CEA 1–20% and CEA 8–20% offer balanced reactivity and control, making them ideal candidates for applications requiring moderate cure speed with sufficient working time. On the other hand, CEA 8–30% exhibits superior control but may require extended curing time or elevated curing temperatures to reach full cross-link density.
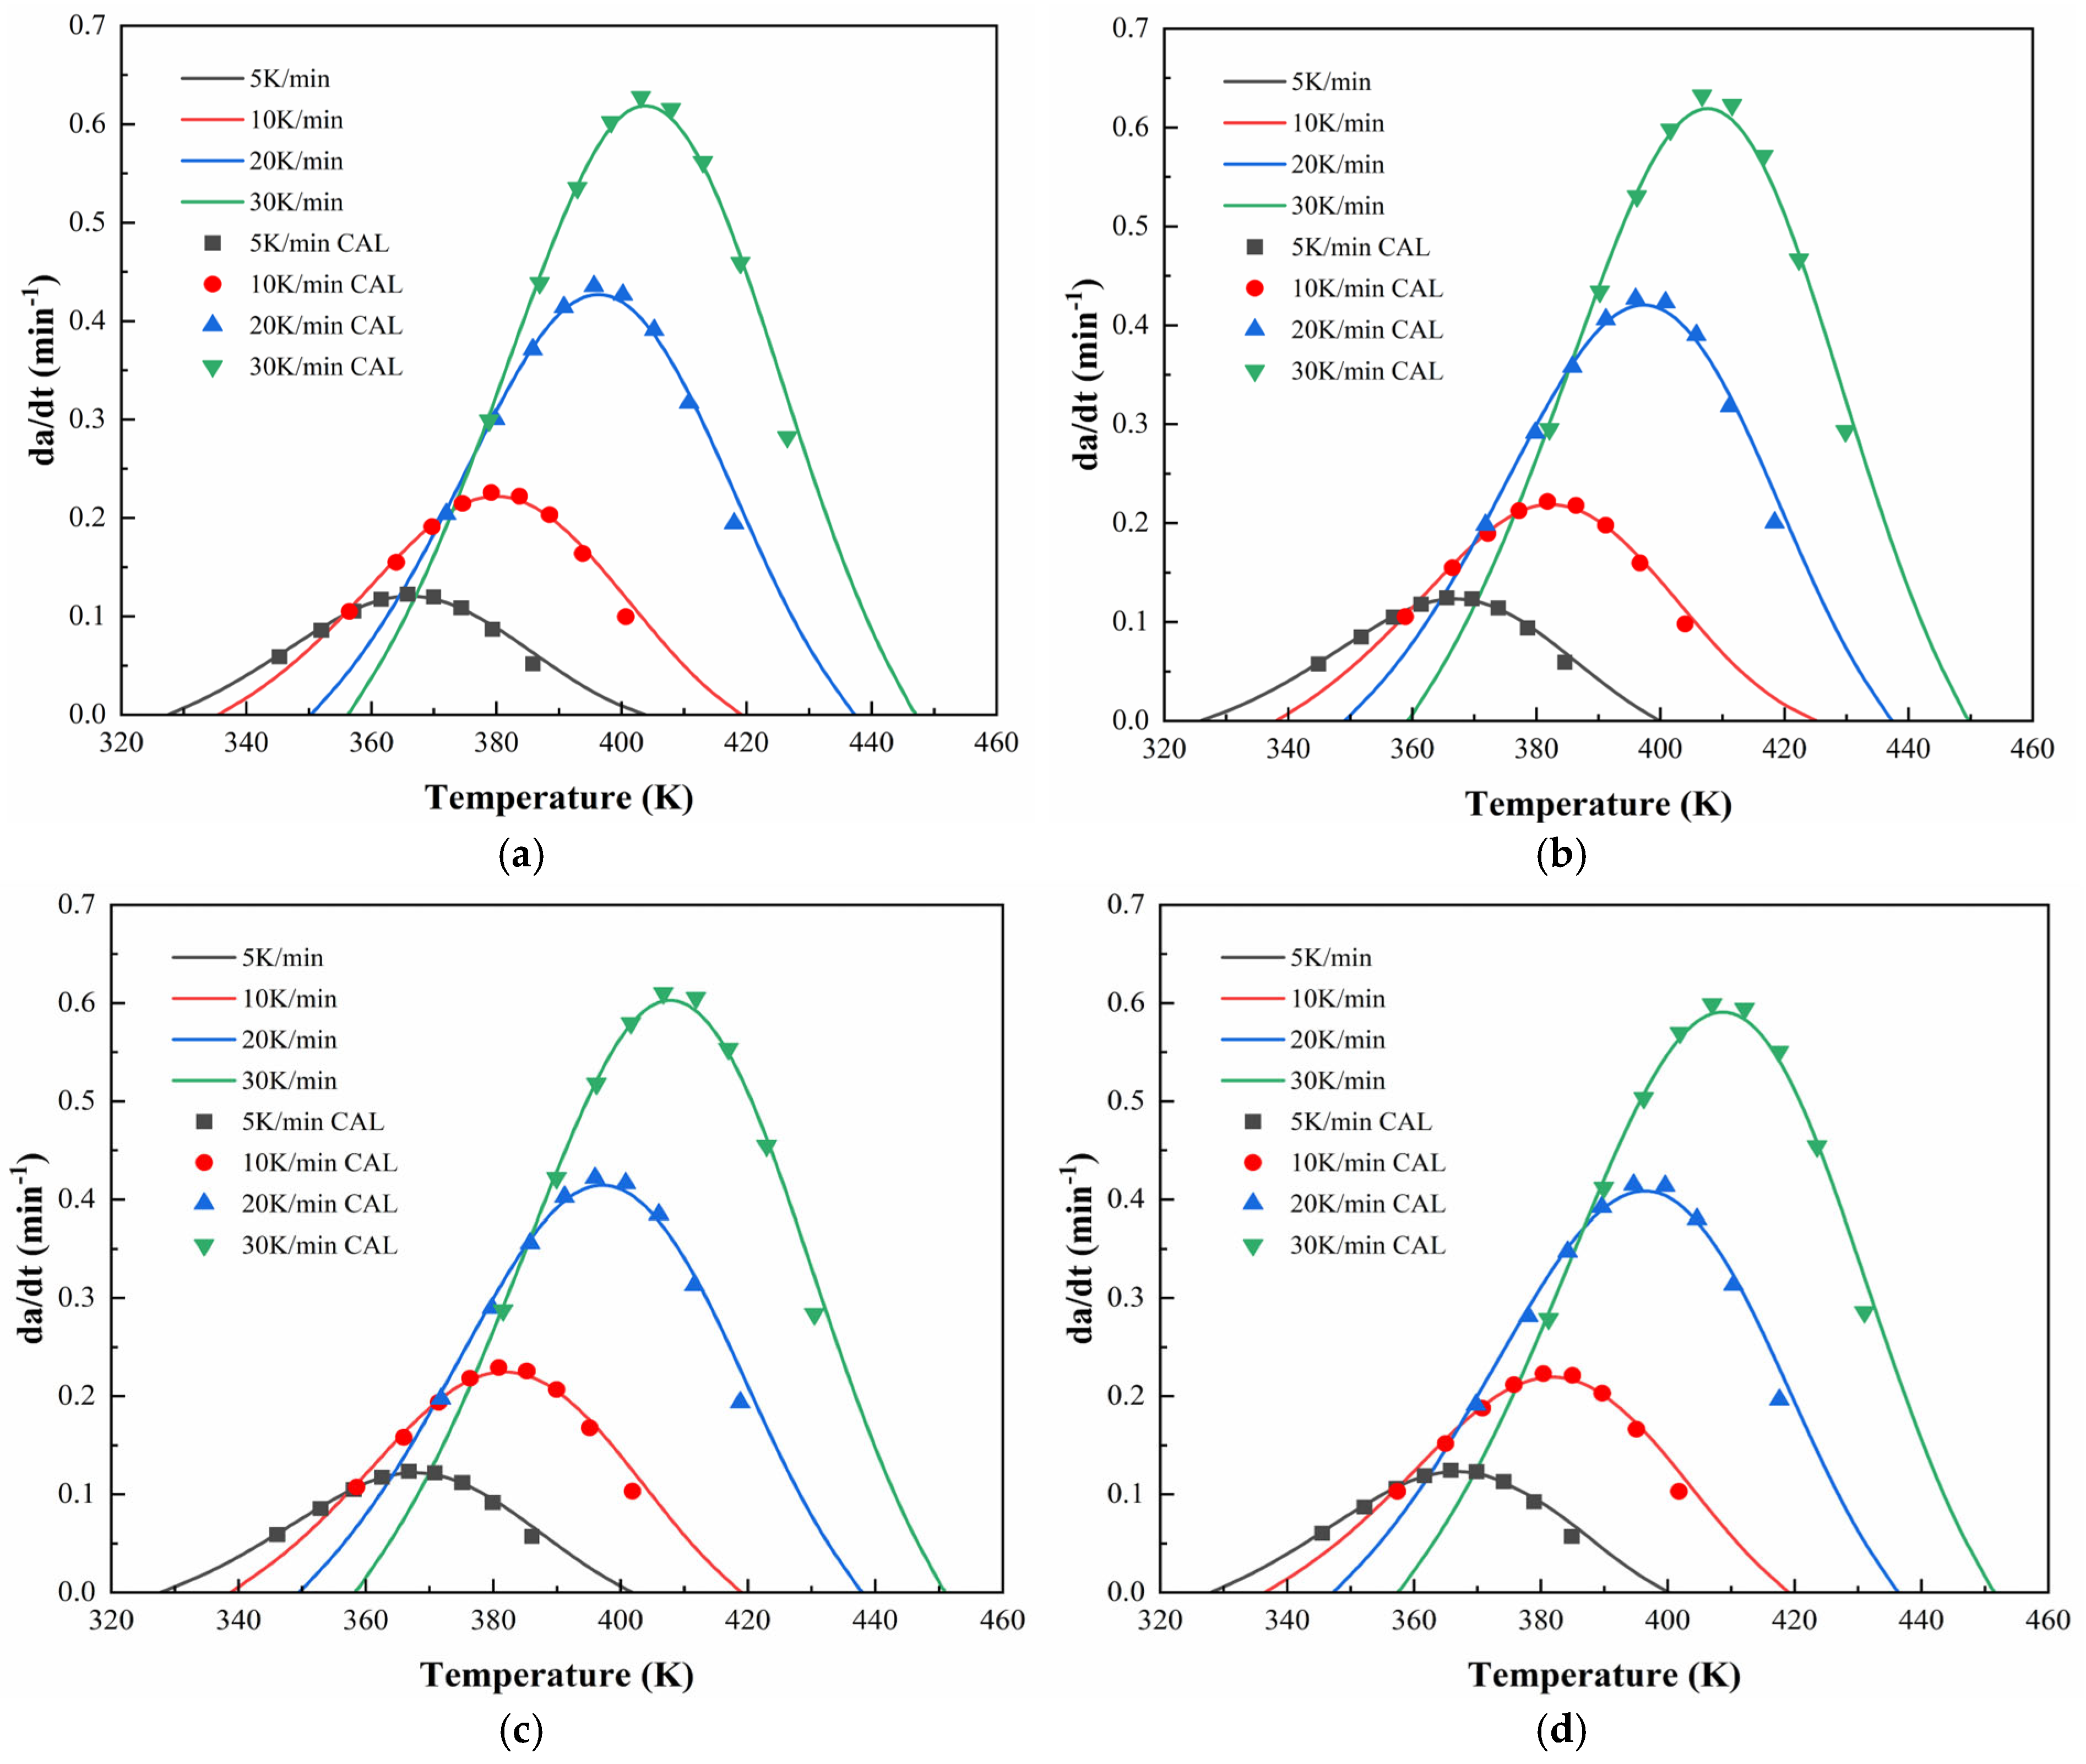
To further validate the applicability of the proposed dual-parameter autocatalytic model,
Figure 12 and
Figure 13 compare the model-predicted curing rate curves with experimental data for CEA 1 and CEA 8, respectively. The close alignment between the calculated and experimental curves confirms the accuracy of the curing model in capturing the full curing behaviors under non-isothermal conditions. It indicates that the Sesták–Berggren equation, a generalized form of the autocatalytic model, provides a robust framework for describing the multi-stage curing behavior of cold-mix epoxy asphalt systems. Specifically, it accommodates both the acceleration phase dominated by autocatalytic effects and the deceleration stage constrained by diffusion and vitrification. As such, the validated kinetic formulation offers not only mechanistic insights but also practical guidance for curing schedules of CEAs to meet construction and performance demands.
Based on the established curing kinetic models for CEAs, the curing times required to reach a curing degree of 95% under different temperatures (50 °C, 60 °C, and 70 °C) were calculated and are summarized in
Table 8. A clear temperature-dependent trend can be observed, where curing time decreases significantly with increasing temperature, consistent with Arrhenius kinetics. CEA 1 exhibits a shorter curing time at all temperatures compared to CEA 8, indicating a higher inherent reactivity and faster initiation of the curing process, which is consistent with previous parameter analyses. This suggests CEA 1 may be preferable for rapid maintenance applications where curing must proceed in a short time or at lower ambient temperatures.
The incorporation of Component C into both CEA 1 and CEA 8 results in marked reductions in curing time. For CEA 1, adding 10% Component C decreases the curing time at 50 °C by 26.2% from 24.8 h to 18.3 h; however, a further increase to 30% Component C does not continue to accelerate curing significantly for CEA 1. In contrast, CEA 8 responds more sensitively to the proportion of Component C. When the content is within 20%, there is no significant effect on curing times. However, a substantial shift occurs at 30% content, with curing time reduced by 60% across all curing temperatures. This can be attributed to the potential catalytic and network modifying roles of Component C, which may lower diffusion barriers or stabilize transitional structures during cross-linking. This demonstrates that despite a slower reaction initiation of CEA 8, the significant acceleration of Component C enables it to meet rapid-curing demands within half a day (only 4.1 h at 70 °C), confirming the role of Component C as a curing accelerator. This is of great importance for non-disruptive constructions of airport runway overlay where minimal closure time is critical.
Compared to conventional HMA or heat-cured epoxy systems, cold-mix epoxy asphalt has several economic and environmental advantages. (1) Cold-mix epoxy asphalt eliminates the need for high-temperature heating, thereby reducing energy consumption and greenhouse gas emissions during construction. (2) The selected CEA in this paper shows superior mechanical performance and durability, therefore enhancing the service life and reducing pavement maintenance, which will significantly decrease carbon emissions and energy consumption. (3) The shortened curing times enabled by Component C allow earlier reopening to traffic, minimizing operational disruption and associated indirect costs. These features collectively enhance the economic and environmental sustainability of CEA in airport overlay applications.
Overall, the kinetic models quantitatively characterize the curing behaviors under non-isothermal conditions and offer predictive capacity for practical applications such as open-time control, construction scheduling, and thermal management during field curing. The time estimation approach highlights the potential of CEA 1 and CEA 8 systems to meet varied application demands, from non-disruptive overlay construction to curing-controlled paving, by adjusting Component C content and curing temperature management.
