
Internal Dynamics of Pyrene-Labeled Polyols Studied Through the Lens of Pyrene Excimer Formation


Abstract
1. Introduction
2. Materials and Methods
2.1. Chemicals
2.2. Instrumentation
2.2.1. Nuclear Magnetic Resonance (NMR)
2.2.2. Mass Spectrometry (MS)
2.2.3. UV–Visible Spectrophotometry (UV-Vis)
2.2.4. Steady-State Fluorescence (SSF)
2.2.5. Time-Resolved Fluorescence (TRF)
2.3. Fluorescence Decay Analysis
2.4. Synthesis of the Pyrene-Labeled Diols (Py2-DOs) and Polyols (Py-POs)
3. Results and Discussion
3.1. Preparation of the Py2-DO and Py-PO Samples
3.2. Calculation of [Py]loc for the Py2-DO and Py-PO Samples
3.3. Analysis of the Fluorescence Spectra
3.4. Model-Free Analysis of the Fluorescence Decays
3.5. Molecular Parametrization of the Constructs to Calculate <k>th
3.6. Accounting for Solvent Effects
4. Conclusions
Supplementary Materials
Author Contributions
Funding
Data Availability Statement
Acknowledgments
Conflicts of Interest
Abbreviations
| IE/IM | Excimer-to-monomer intensity ratio |
| kdiff | Rate constant for diffusive PEF |
| <k> | Average rate constant for PEF |
| MFA | Model-free analysis |
| PEF | Pyrene excimer formation |
| Py2-DO | Pyrene end-labeled diol |
| PyLM | Pyrene labeled macromolecule |
| [Py]loc | Local concentration of ground-state pyrenes |
| Py-PO | Pyrene end-labeled polyol |
| RG | Radius of gyration |
| SSF | Steady-state fluorescence |
| TRF | Time-resolved fluorescence |
| [η] | Intrinsic viscosity |
References
- Jiang, Y.; Chen, J.Z.Y. Theories for Polymer Melts Consisting of Rod—Coil Polymers. In Self-Assembling Systems. Theory and Simulation; John Wiley & Sons: Hoboken, NJ, USA, 2017; pp. 230–253. [Google Scholar]
- Sommer, J.-U. Polymer Physics at Surfaces and Interfaces. In Soft Matter at Aqueous Interfaces; Springer: Berlin/Heidelberg, Germany, 2016; pp. 279–311. [Google Scholar]
- Cho, K.S. Viscoelasticity of Polymers. In Polymer Physics; Springer: Berlin/Heidelberg, Germany, 2016; pp. 231–281. [Google Scholar]
- Sato, T.; Matsuda, Y. Macromolecular Assemblies in Solution: Characterization by Light Scattering. Polym. J. 2009, 41, 241–251. [Google Scholar] [CrossRef]
- Hammel, M. Validation of Macromolecular Flexibility in Solution by Small-Angle X-Ray Scattering. Eur. Biophys. J. 2012, 41, 789–799. [Google Scholar] [CrossRef]
- Venditti, V.; Egner, T.K.; Clore, G.M. Hybrid Approaches to Structural Characterization of Conformational Ensembles of Complex Macromolecular Systems Combining NMR Residual Dipolar Couplings and Solution X-ray Scattering. Chem. Rev. 2016, 116, 6305–6322. [Google Scholar] [CrossRef] [PubMed]
- Guinier, A.; Fournet, G. Small Angle X-Ray Scattering; Wiley: London, UK, 1955; pp. 25–28. [Google Scholar]
- Duhamel, J. Global Analysis of Fluorescence Decays to Probe the Internal Dynamics of Fluorescently Labeled Macromolecules. Langmuir 2014, 30, 2307–2324. [Google Scholar] [CrossRef] [PubMed]
- Demas, J.N. Excited State Lifetime Measurements; Academic Press: New York, NY, USA, 1983; pp. 149–153. [Google Scholar]
- James, D.R.; Ware, W.R. A Fallacy in the Interpretation of Fluorescence Decay Parameters. Chem. Phys. Lett. 1985, 120, 455–459. [Google Scholar] [CrossRef]
- James, D.R.; Ware, W.R. Recovery of Underlying Distributions of Lifetimes from Fluorescence Decay Data. Chem. Phys. Lett. 1986, 126, 7–11. [Google Scholar] [CrossRef]
- Istratov, A.A.; Vyvenko, O.F. Exponential Analysis in Physical Phenomena. Rev. Sci. Instrum. 1999, 70, 1233–1257. [Google Scholar] [CrossRef]
- Patting, M. Evaluation of Time-Resolved Fluorescence Data: Typical Methods and Problems. Springer Ser. Fluoresc. 2008, 5, 233–258. [Google Scholar]
- Noomnarm, U.; Clegg, R.M. Fluorescence Lifetimes: Fundamentals and Interpretation. Photosynth. Res. 2009, 101, 181–194. [Google Scholar] [CrossRef]
- Hofmann, H.; Soranno, A.; Borgia, A.; Gast, K.; Nettels, D.; Schuler, B. Polymer Scaling Laws of Unfolded and Intrinsically Disordered Proteins Quantified with Single-Molecule Spectroscopy. Proc. Natl. Acad. Sci. USA 2012, 109, 16155–16160. [Google Scholar] [CrossRef]
- Jacob, M.H.; D’Souza, R.N.; Lazar, A.I.; Nau, W.M. Diffusion-Enhanced Fōrster Resonance Energy Transfer in Flexible Peptides: From the Haas-Steinberg Partial Differential Equation to a Closed Analytical Expression. Polymers 2023, 15, 705. [Google Scholar] [CrossRef]
- Little, H.; Patel, S.; Duhamel, J. Probing the Inner Local Density of Complex Macromolecules by Pyrene Excimer Formation. Phys. Chem. Chem. Phys. 2023, 25, 26515–26525. [Google Scholar] [CrossRef]
- Wu, C.; Wang, C.; Yan, L.; Yang, C.J. Pyrene Excimer Nucleic Acid Probes for Biomolecule Signaling. J. Biomed. Nanotechnol. 2009, 5, 495–504. [Google Scholar] [CrossRef]
- Ebata, K.; Masuko, M.; Ohtani, H.; Jibu, M. Excimer Formation by Hybridization Using Two Pyrene-Labeled Oligonucleotide Probes. Nucleic Acids Symp. Ser. 1995, 34, 187–188. [Google Scholar]
- Wang, G.; Bobkov, G.V.; Mikhailov, S.N.; Schepers, G.; van Aershot, A.; Rozenski, J.; Van der Auweraer, M.; Herdewijn, P.; De Feyter, S. Detection of RNA Hybridization by Pyrene-Labeled Probes. Chembiochem 2009, 10, 1175–1185. [Google Scholar] [CrossRef] [PubMed]
- Conlon, P.; Yang, C.J.; Wu, Y.; Chen, Y.; Martinez, K.; Kim, Y.; Stevens, Y.; Marti, A.A.; Jockusch, S.; Turro, N.J.; et al. Pyrene Excimer Signalling Molecular Beacons for Probing Nucleic Acids. J. Am. Chem. Soc. 2007, 130, 336–342. [Google Scholar] [CrossRef] [PubMed]
- Krasheninina, O.A.; Novopashina, D.S.; Apartsin, E.K.; Venyaminova, A.G. Recent Advances in Nucleic Acid Targeting Probes and Supramolecular Constructs Based on Pyrene-Modified Oligonucleotides. Molecules 2017, 22, 2108. [Google Scholar] [CrossRef] [PubMed]
- Aparin, I.O.; Proskurin, G.V.; Golovin, A.V.; Ustinov, A.V.; Formanovsky, A.A.; Zatsepin, T.S.; Korshun, V.A. Fine Tuning of Pyrene Excimer Fluorescence in Molecular Beacons by Alteration of the Monomer Structure. J. Org. Chem. 2017, 82, 10015–10024. [Google Scholar] [CrossRef]
- Ingale, S.A.; Seela, F. A Ratiometric Fluorescent On-Off Zn2+ Chemosensor Based on Tripropargylamine Pyrene Azide Click Adduct. J. Org. Chem. 2012, 77, 9352–9356. [Google Scholar] [CrossRef]
- Ni, X.-L.; Zeng, X.; Redshaw, C.; Yamato, T. Ratiometric Fluorescent Receptors for Both Zn2+ and H2PO4− Ions Based on a Pyrenyl-Linked Triazole Modified homooxxacalix[3]arene: A Potential Molecular Traffic Signal with an R-S Latch Logic Circuit. J. Org. Chem. 2011, 76, 5696–5702. [Google Scholar] [CrossRef]
- Ni, X.-L.; Wang, S.; Zeng, X.; Tao, Z.; Yamato, T. Pyrene-Linked Triazole-Modified Homooxxacalix[3]arene: A Unique C3 Symmetry Ratiometric Fluorescent Chemosensor for Pb2+. Org. Lett. 2011, 13, 552–555. [Google Scholar] [CrossRef]
- Thirupathi, P.; Lee, K.-H. A New Peptidyl Fluorescent Chemosensors for the Selective Detection of Mercury Ions Based on Tetrapeptide. Bioorg. Med. Chem. 2013, 21, 7964–7970. [Google Scholar] [CrossRef]
- Karuppannan, S.; Chambron, J.C. Supramolecular Chemical Sensors Based on Pyrene Monomer-Excimer Dual Luminescence. Chem. Asian. J. 2011, 6, 964–984. [Google Scholar] [CrossRef]
- Little, H.; Patel, D.; Suh, D.; Duhamel, J. Accurate Determination of the Average rate Constant of Pyrene Excimer Formation for Pyrene-Labeled Macromolecules from the Analysis of Individual Fluorescence Decays with Sums of Exponentials. J. Phys. Chem. B 2024, 128, 2583–2594. [Google Scholar] [CrossRef] [PubMed]
- Thoma, J.L.; Duhamel, J. Characterization of the Local Volume Probed by the Side Chain Ends of Poly(oligo(ethylene glycol) 1-Pyrenemethyl ether methacrylate) Bottle Brushes in Solution Using Pyrene Excimer Fluorescence. Macromolecules 2021, 54, 9341–9350. [Google Scholar] [CrossRef]
- Thoma, J.; McNelles, S.A.; Adronov, A.; Duhamel, J. Direct Measure of the Local Concentration of Pyrenyl Groups in Pyrene-Labeled Dendrons Derived from the Rate of Fluorescence Collisional Quenching. Polymers 2020, 12, 2919. [Google Scholar] [CrossRef] [PubMed]
- Patel, S.; Duhamel, J. Macromolecular Conformation of Low Generation PAMAM Dendrimers Probed by Pyrene Excimer Formation. Macromolecules 2023, 56, 4012–4021. [Google Scholar] [CrossRef]
- Rumble, J.R. Viscosity of Liquids. In CRC Handbook of Chemistry and Physics, 101st ed.; (Electronic ed.); CRC Press; Taylor & Francis: Abingdon, UK, 1978; pp. 239–242. [Google Scholar]
- Yip, J.; Duhamel, J.; Bahun, G.; Adronov, A. A Study of the Branch Ends of a Series of Pyrene-Labeled Dendrimers Based on Pyrene Excimer Formation. J. Phys. Chem. B 2010, 114, 10254–10265. [Google Scholar] [CrossRef]
- Chen, S.; Duhamel, J.; Bahun, G.; Adronov, A. Effect of Fluorescent Impurities in the Study of Pyrene-Labeled Macromolecules by Fluorescence. J. Phys. Chem. B 2011, 115, 9921–9929. [Google Scholar] [CrossRef]
- Lakowicz, J.R. Principles of Fluorescence Spectroscopy, 3rd ed.; Springer: Singapore, 2006; pp. 9–10, 281. [Google Scholar]
- Winnik, M.A. End-to-end cyclization of polymer chains. Acc. Chem. Res. 1985, 18, 73–79. [Google Scholar] [CrossRef]
- Boileau, S.; Méchin, F.; Martinho, J.M.G.; Winnik, M.A. End-to-end cyclization of a pyrene end-capped poly(bisphenol A-diethylene glycol carbonate). Macromolecules 1989, 22, 215–220. [Google Scholar] [CrossRef]
- Ghiggino, K.P.; Snare, M.J.; Thistlethwaite, P.J. Cyclization dynamics in poly(ethylene oxide). chain length and temperature dependence. Eur. Polym. J. 1985, 21, 265–272. [Google Scholar] [CrossRef]
- Bieri, O.; Wirz, J.; Hellrung, B.; Schutkowski, M.; Drewello, M.; Kiefhaber, T. The speed limit for protein folding measured by triplet–triplet energy transfer. Proc. Natl. Acad. Sci. USA 1999, 96, 9597–9601. [Google Scholar] [CrossRef]
- Krieger, F.; Fierz, B.; Bieri, O.; Drewello, M.; Kiefhaber, T. Dynamics of unfolded polypeptide chains as model for the earliest steps in protein folding. J. Mol. Biol. 2003, 332, 265–274. [Google Scholar] [CrossRef] [PubMed]
- Lapidus, L.J.; Eaton, W.A.; Hofrichter, J. Measuring the rate of intramolecular contact formation in polypeptides. Proc. Natl. Acad. Sci. USA 2000, 97, 7220–7225. [Google Scholar] [CrossRef] [PubMed]
- Neuweiler, H.; Löllmann, M.; Doose, S.; Sauer, M. Dynamics of unfolded polypeptide chains in crowded environment studied by fluorescence correlation spectroscopy. J. Mol. Biol. 2007, 365, 856–869. [Google Scholar] [CrossRef] [PubMed]
- Zachariasse, K.A.; Maçanita, A.L.; Kühnle, W. Chain Length Dependence of Intramolecular Excimer Formation with 1,n-bis(1-pyrenecarboxy)alkanes for n = 1–16, 22, and 32. J. Phys. Chem. B 1999, 103, 9356–9365. [Google Scholar] [CrossRef]


 ) Py2-DO and (
 ,
, )Py-PO samples. The black solid line represents the function A × nC−B used to fit the experimental <k> values obtained for the Py2-DO samples.
) Py2-DO and (,)Py-PO samples. The black solid line represents the function A × nC−B used to fit the experimental <k> values obtained for the Py2-DO samples.
)Py-PO samples. The black solid line represents the function A × nC−B used to fit the experimental <k> values obtained for the Py2-DO samples.
) Py2-DO and (,)Py-PO samples. The black solid line represents the function A × nC−B used to fit the experimental <k> values obtained for the Py2-DO samples.

 ) THF, (
 ) dioxane, (
 ) DMF, and (
 ) DMSO.
) THF, () dioxane, () DMF, and () DMSO.
) DMSO.
) THF, () dioxane, () DMF, and () DMSO.
 ) THF, () dioxane,() DMF, and () DMSO.
) THF, () dioxane,() DMF, and () DMSO.
) THF, () dioxane,() DMF, and () DMSO.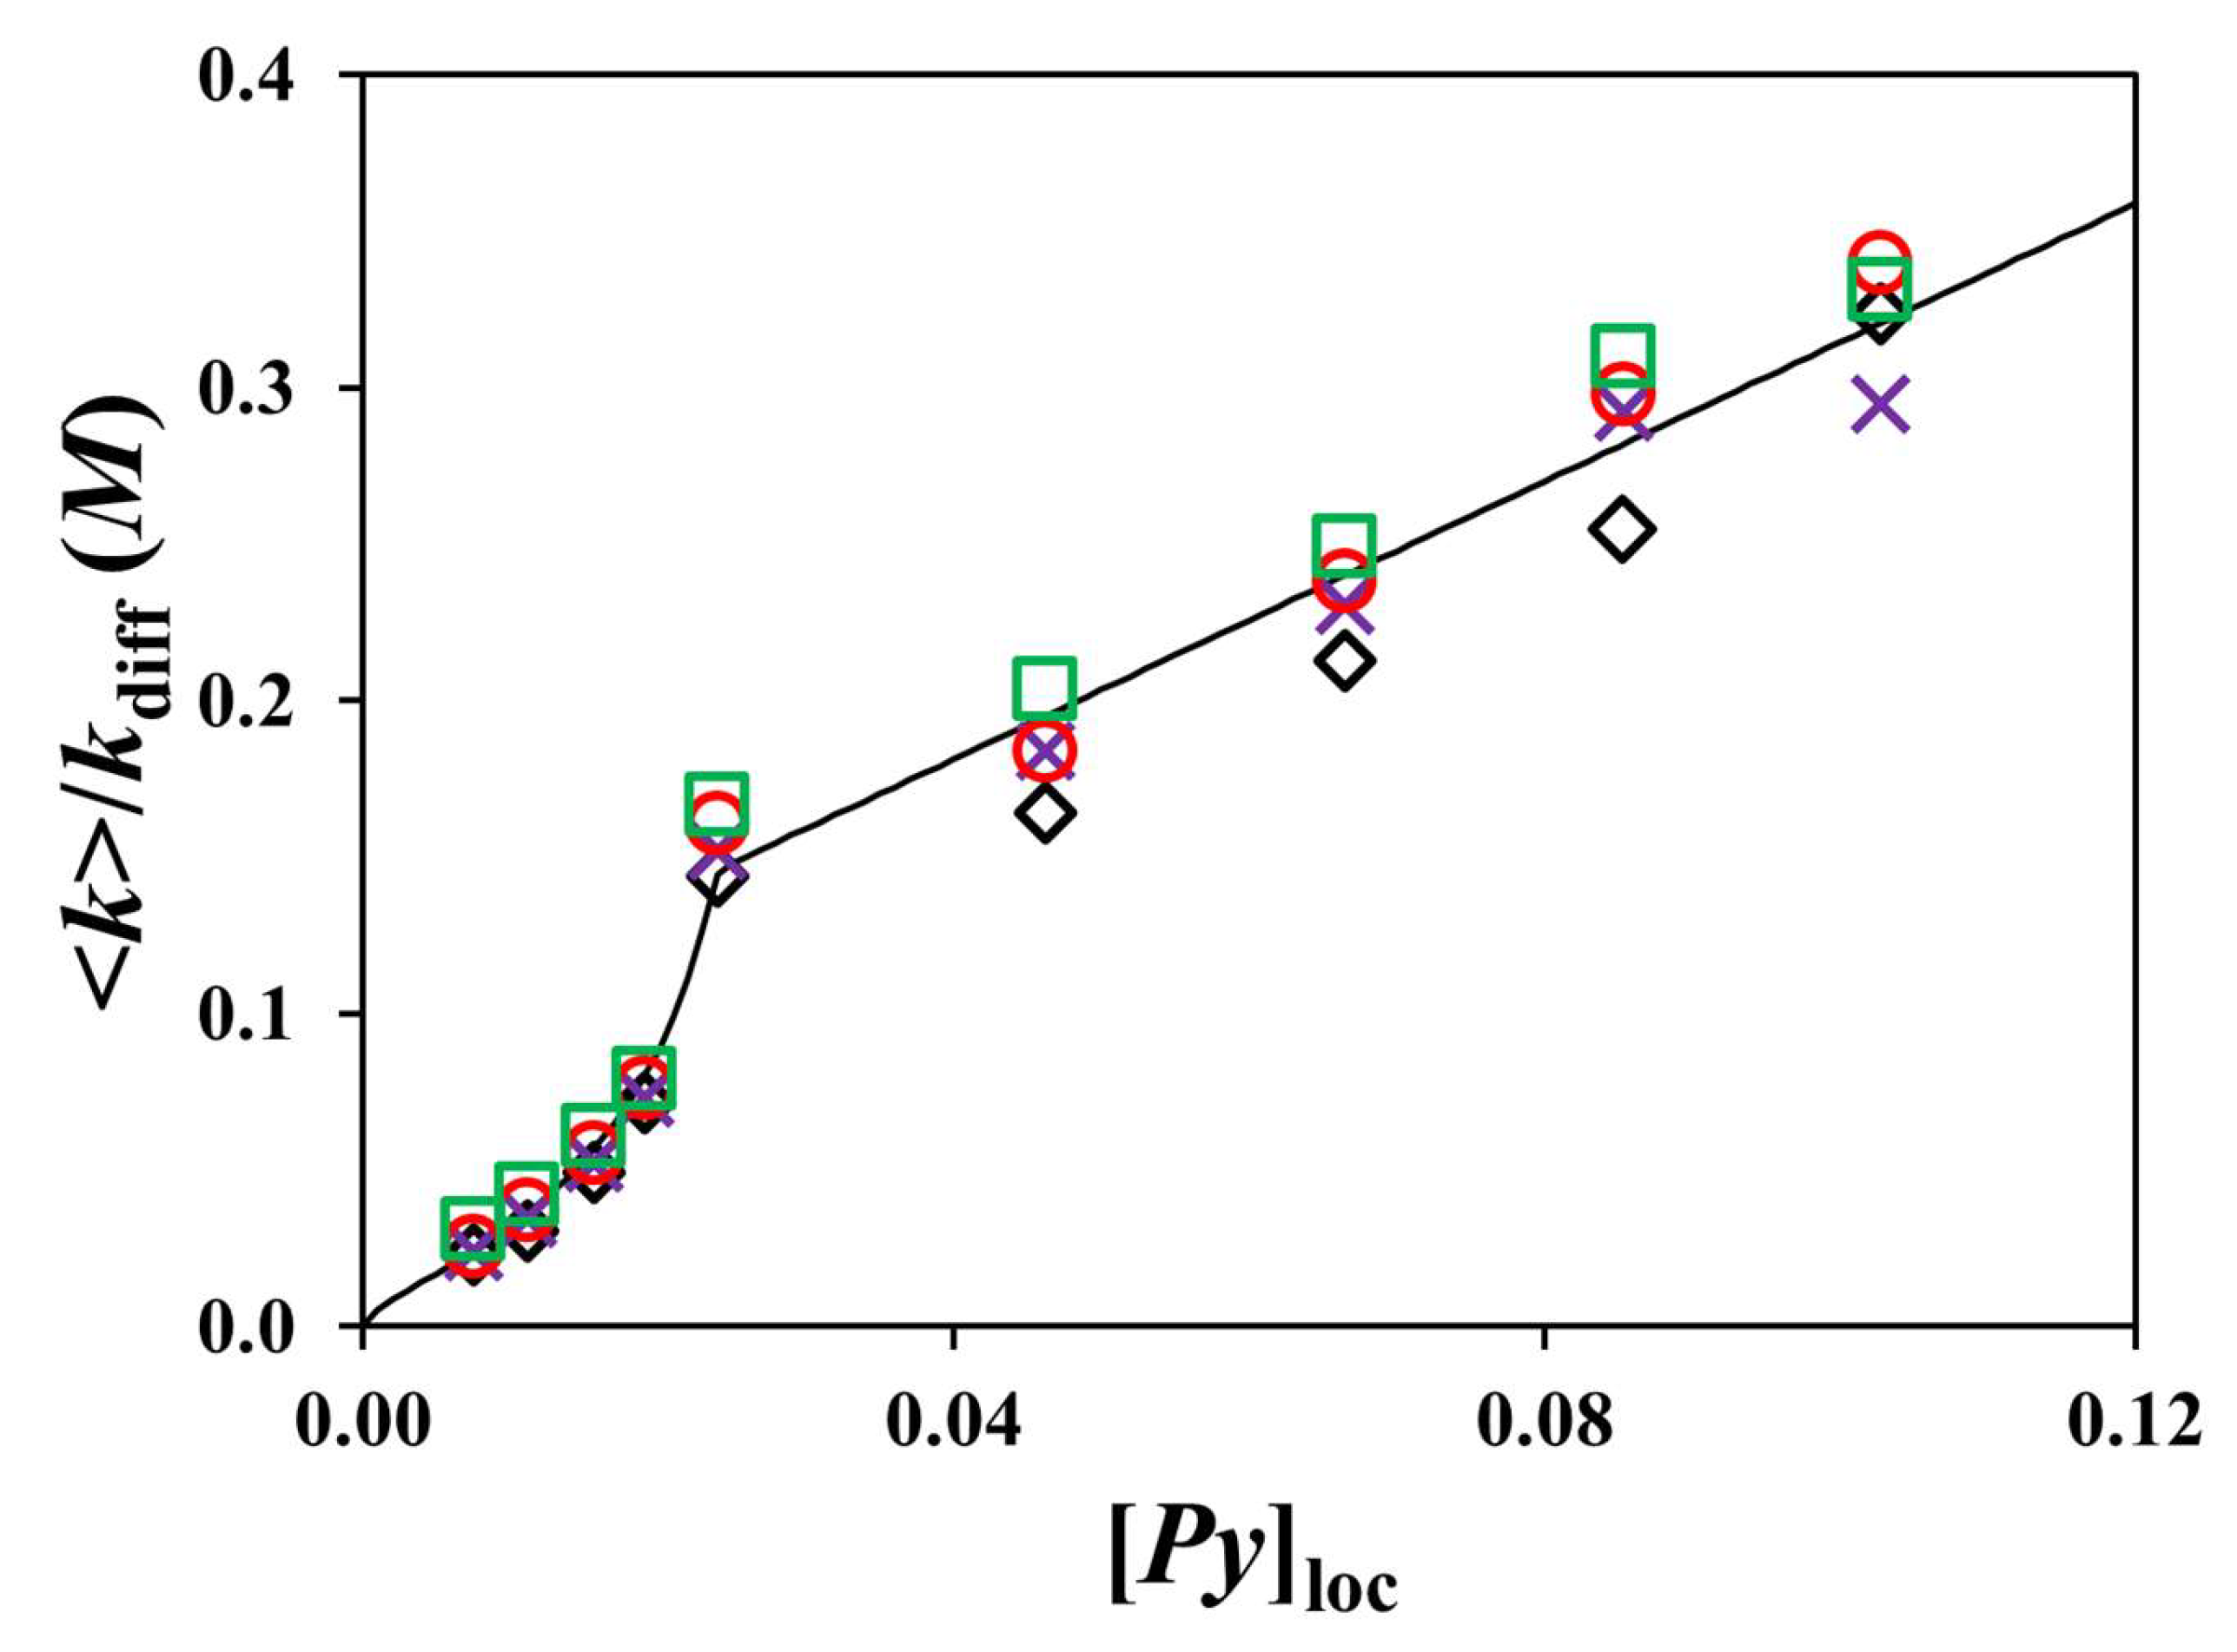

| Py-PO | nC | nPy | nPy/(LPy/l)3 |
|---|---|---|---|
| Py2-HexadecDiol | 16 | 1 | 0.008 |
| Py2-DecDiol | 10 | 1 | 0.011 |
| Py2-HexDiol | 6 | 1 | 0.016 |
| Py2-ButDiol | 4 | 1 | 0.019 |
| Py2-EG | 2 | 1 | 0.024 |
| Py3-Glycerol | 3 | 2 | 0.046 |
| Py4-Erythritol | 4 | 3 | 0.067 |
| Py5-Adonitol | 5 | 4 | 0.085 |
| Py6-Sorbitol | 6 | 5 | 0.103 |
| Solvent | A (ns−1) | B |
|---|---|---|
| THF | 0.484 | 0.895 |
| dioxane | 0.367 | 0.876 |
| DMF | 0.391 | 0.873 |
| DMSO | 0.264 | 0.792 |
Disclaimer/Publisher’s Note: The statements, opinions and data contained in all publications are solely those of the individual author(s) and contributor(s) and not of MDPI and/or the editor(s). MDPI and/or the editor(s) disclaim responsibility for any injury to people or property resulting from any ideas, methods, instructions or products referred to in the content. |
© 2025 by the authors. Licensee MDPI, Basel, Switzerland. This article is an open access article distributed under the terms and conditions of the Creative Commons Attribution (CC BY) license (https://creativecommons.org/licenses/by/4.0/).
Share and Cite
Frasca, F.; Duhamel, J. Internal Dynamics of Pyrene-Labeled Polyols Studied Through the Lens of Pyrene Excimer Formation. Polymers 2025, 17, 1979. https://doi.org/10.3390/polym17141979
Frasca F, Duhamel J. Internal Dynamics of Pyrene-Labeled Polyols Studied Through the Lens of Pyrene Excimer Formation. Polymers. 2025; 17(14):1979. https://doi.org/10.3390/polym17141979
Chicago/Turabian StyleFrasca, Franklin, and Jean Duhamel. 2025. "Internal Dynamics of Pyrene-Labeled Polyols Studied Through the Lens of Pyrene Excimer Formation" Polymers 17, no. 14: 1979. https://doi.org/10.3390/polym17141979
APA StyleFrasca, F., & Duhamel, J. (2025). Internal Dynamics of Pyrene-Labeled Polyols Studied Through the Lens of Pyrene Excimer Formation. Polymers, 17(14), 1979. https://doi.org/10.3390/polym17141979