
Development and Characterization of Peruvian Native Potato Starch/PVA-Based pH-Sensitive Films Incorporated with Purple Potato Anthocyanin Extract for Food Packaging


Abstract
1. Introduction
2. Materials and Methods
2.1. Materials
2.2. Production of Intelligent Films (IFs)
2.3. Characterization of IFs
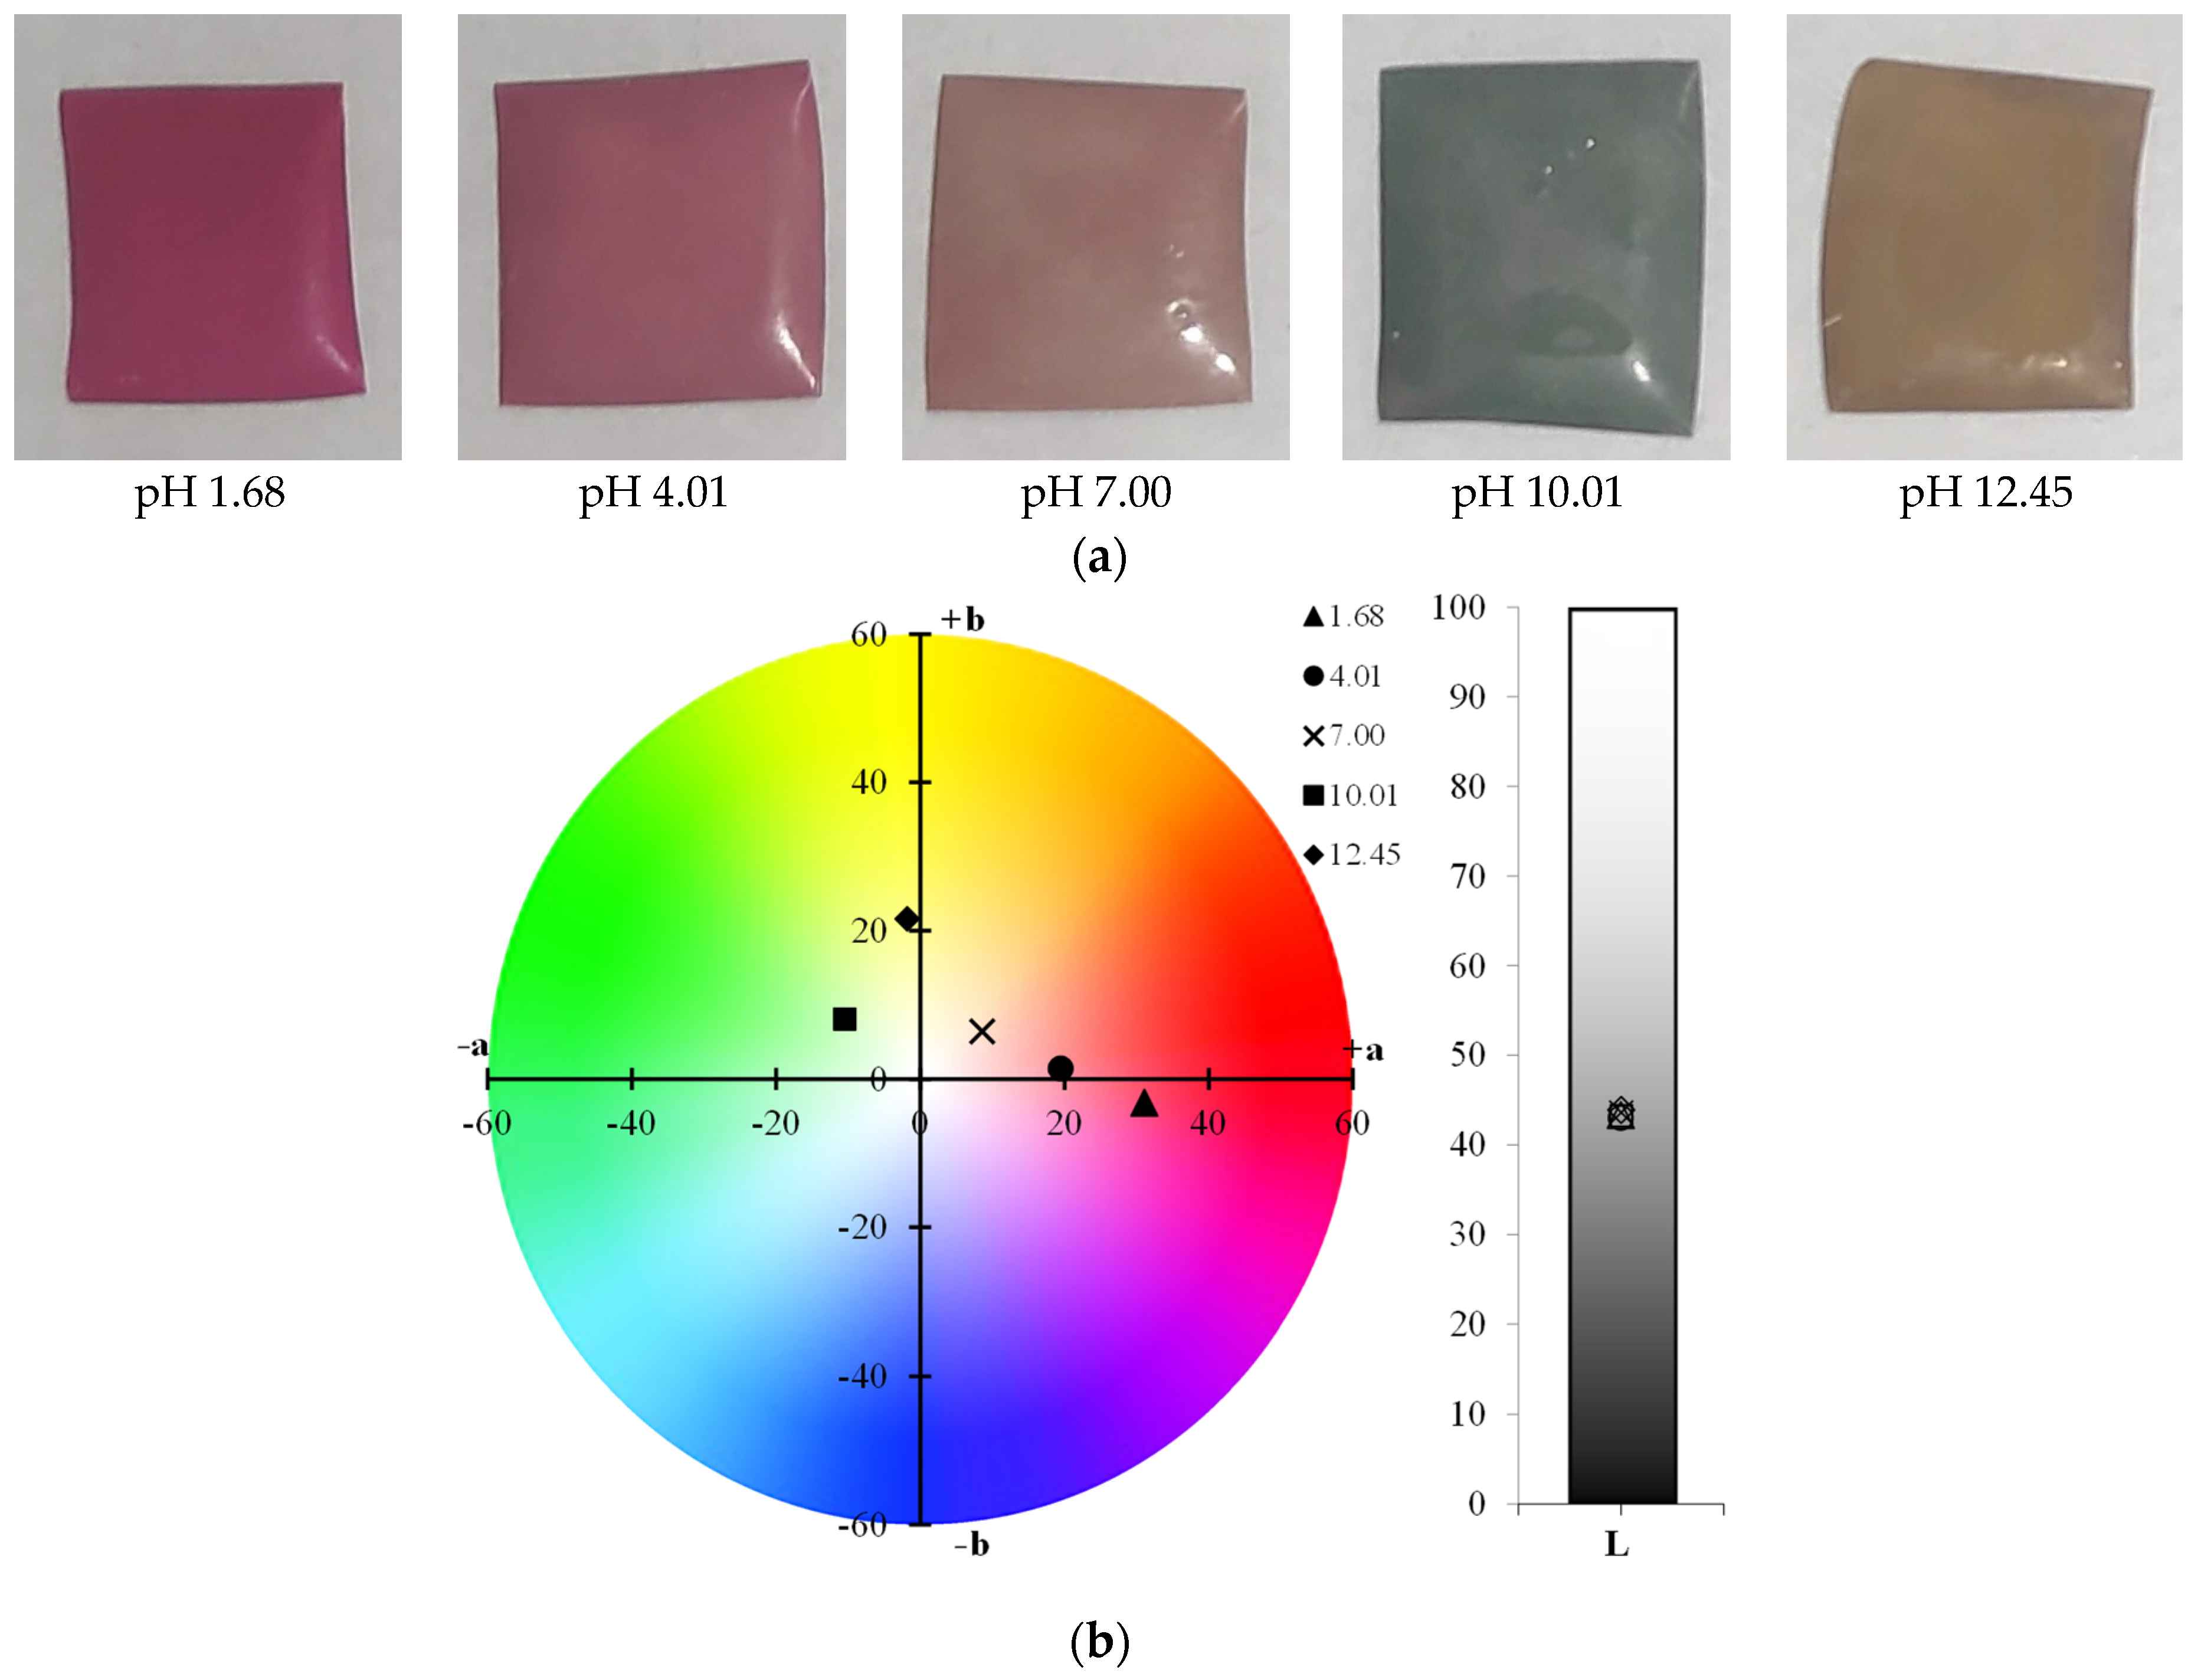
2.3.1. Visual Aspect and Color Parameters
2.3.2. Moisture Content and Solubility
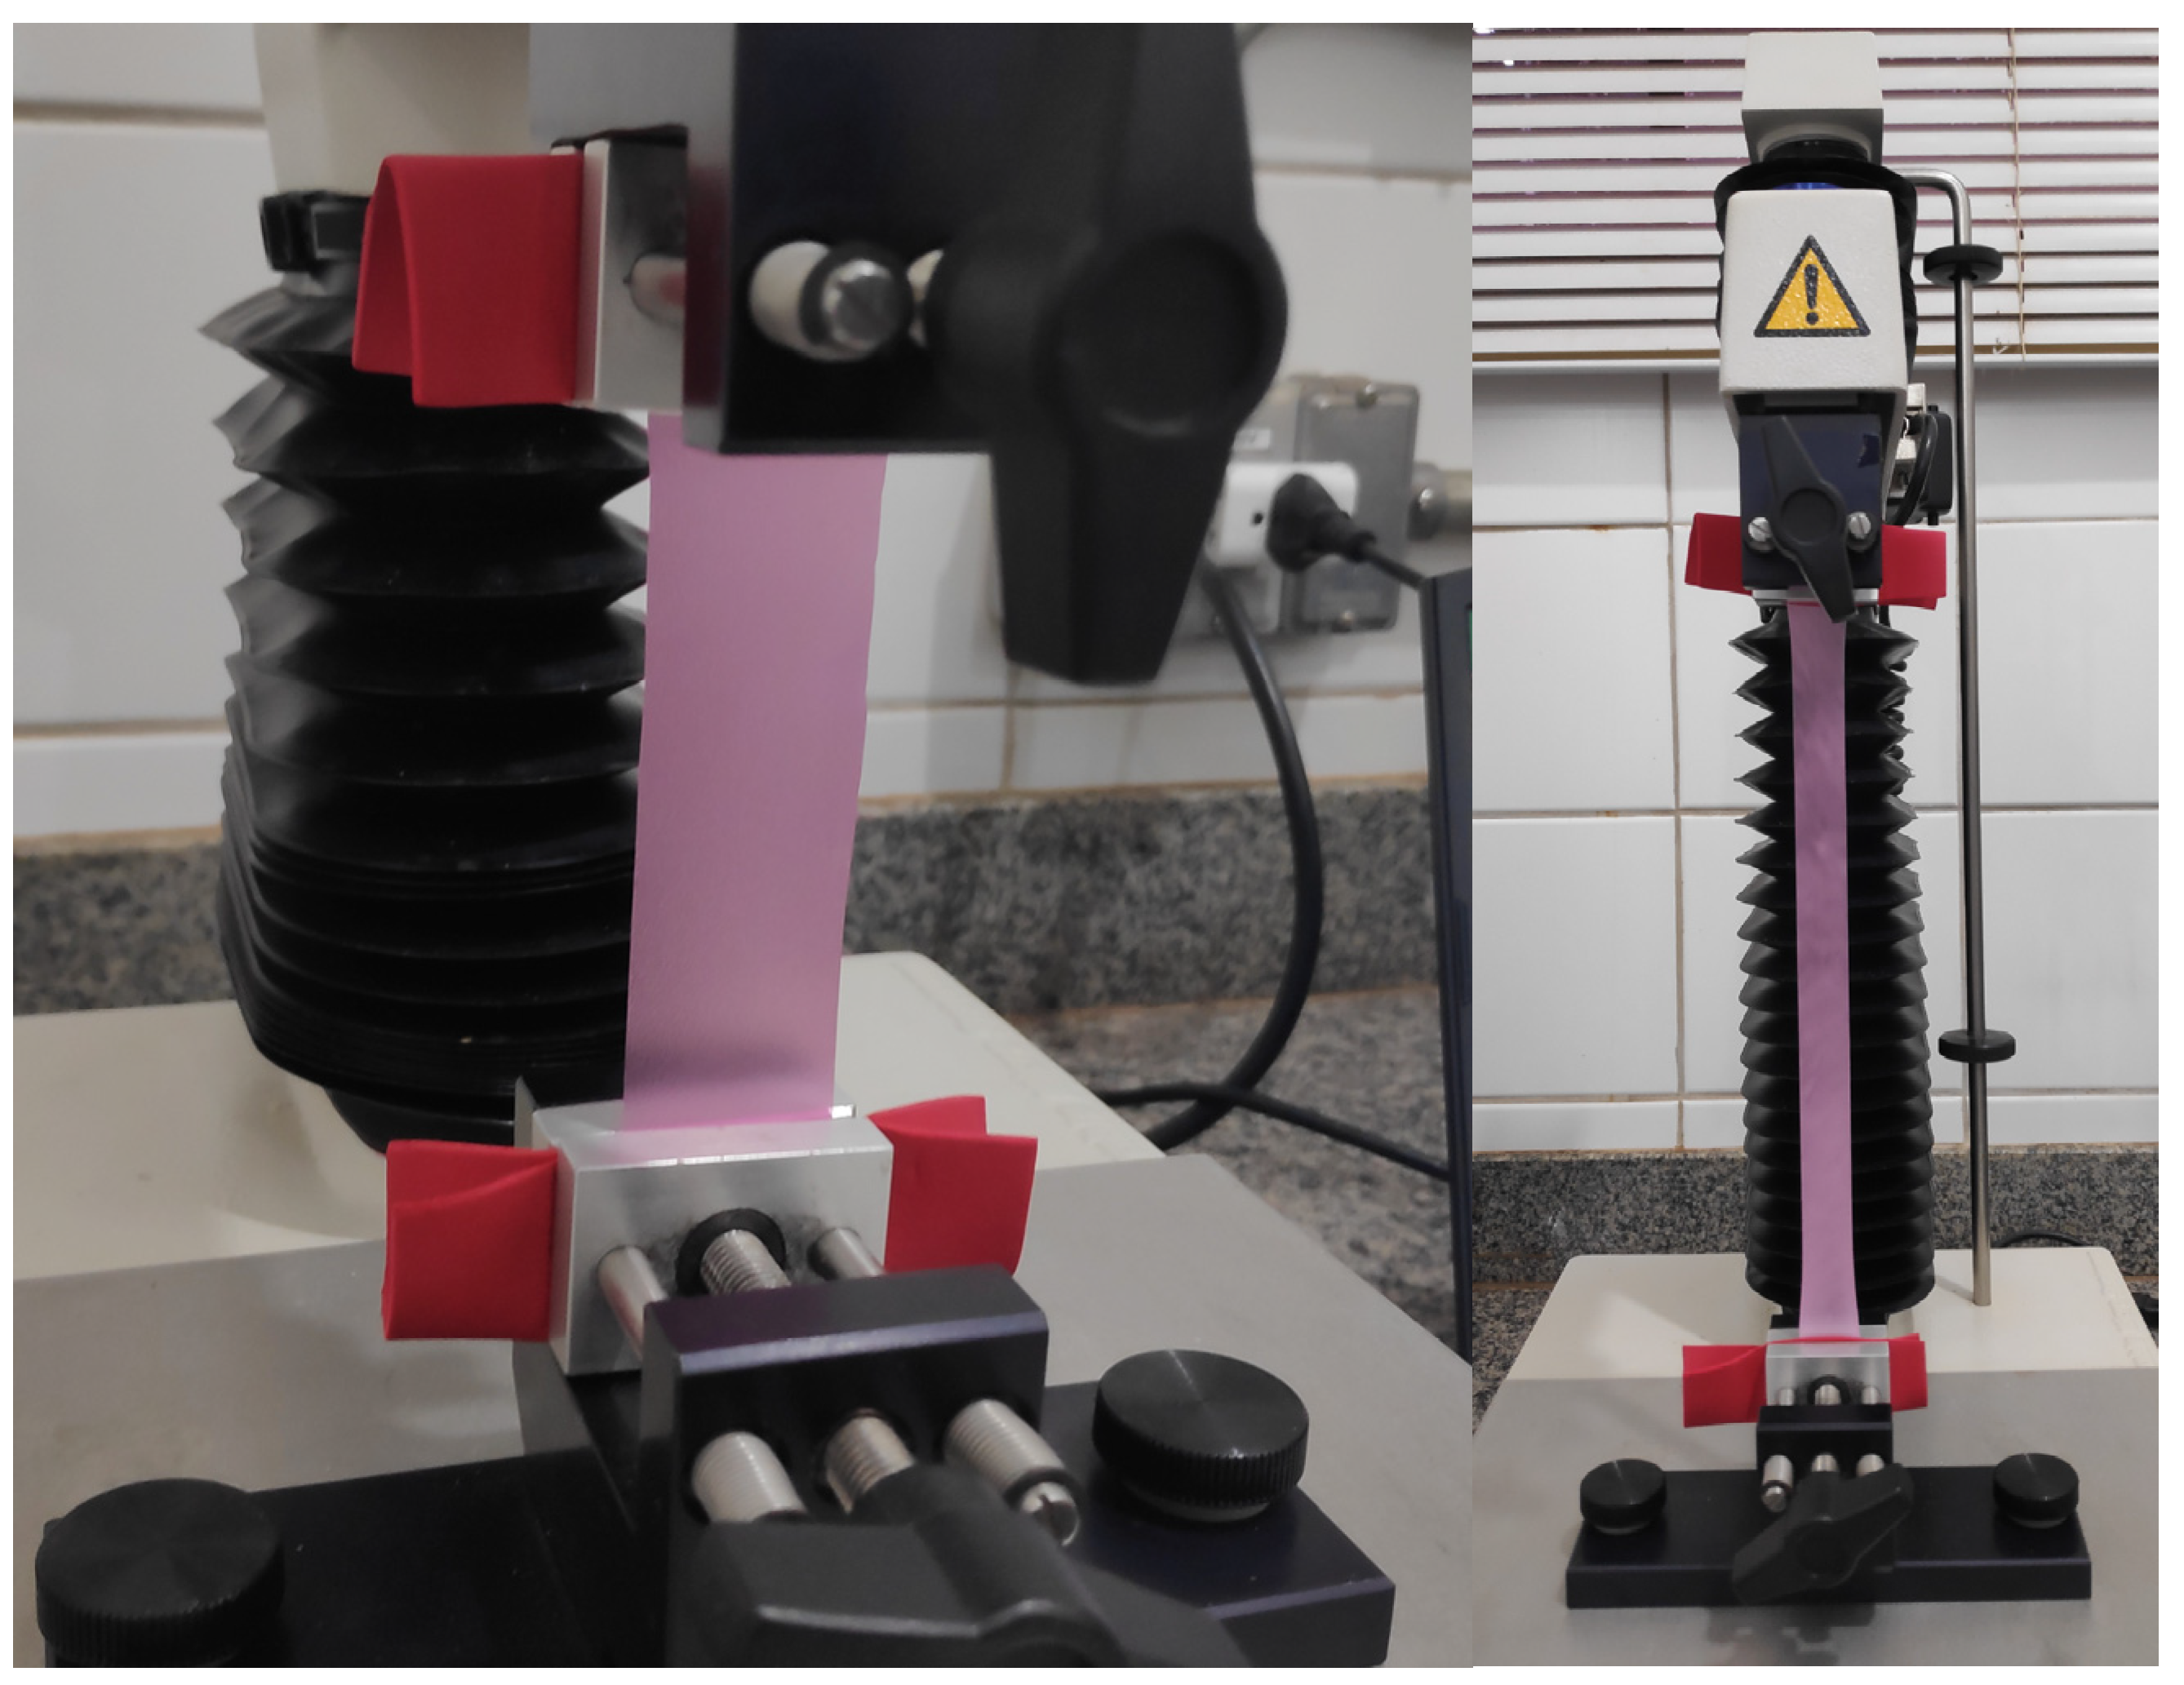
2.3.3. Mechanical Properties
2.3.4. Contact Angle
2.3.5. Scanning Electron Microscopy (SEM)
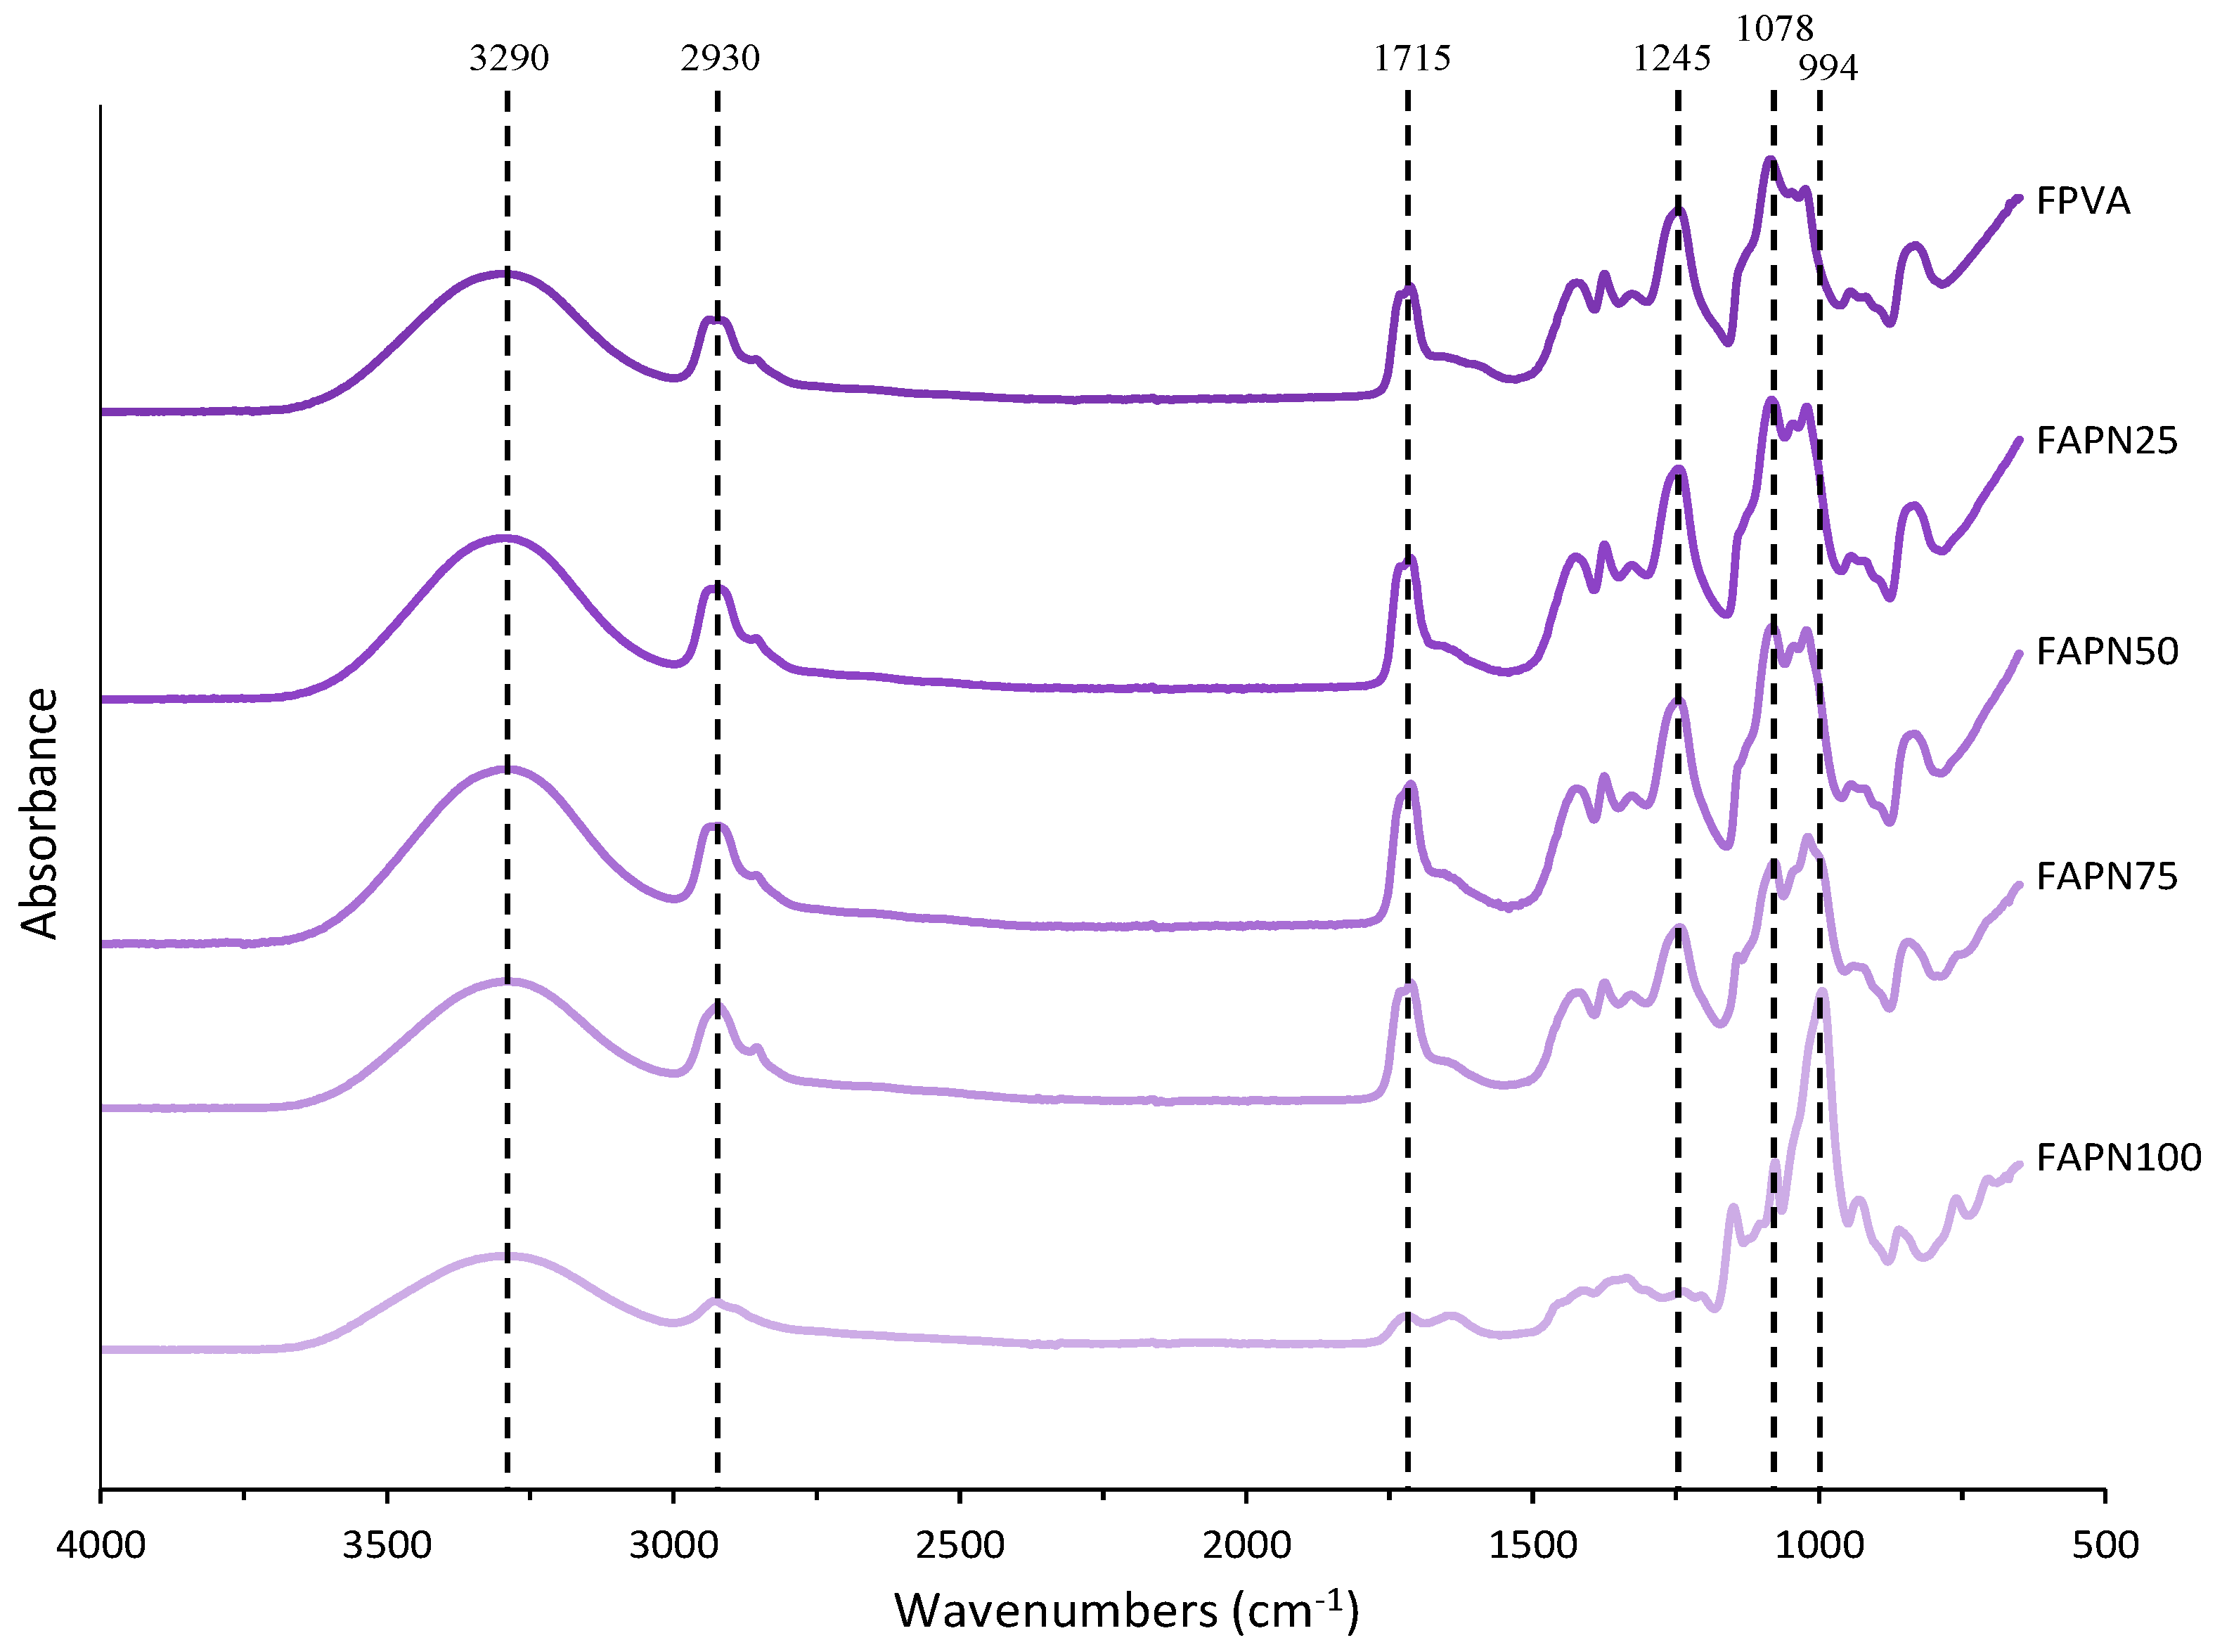
2.3.6. Fourier Transform Infrared Spectroscopy (FTIR)
2.3.7. X-Ray Diffraction (XRD)
2.3.8. Color Stability
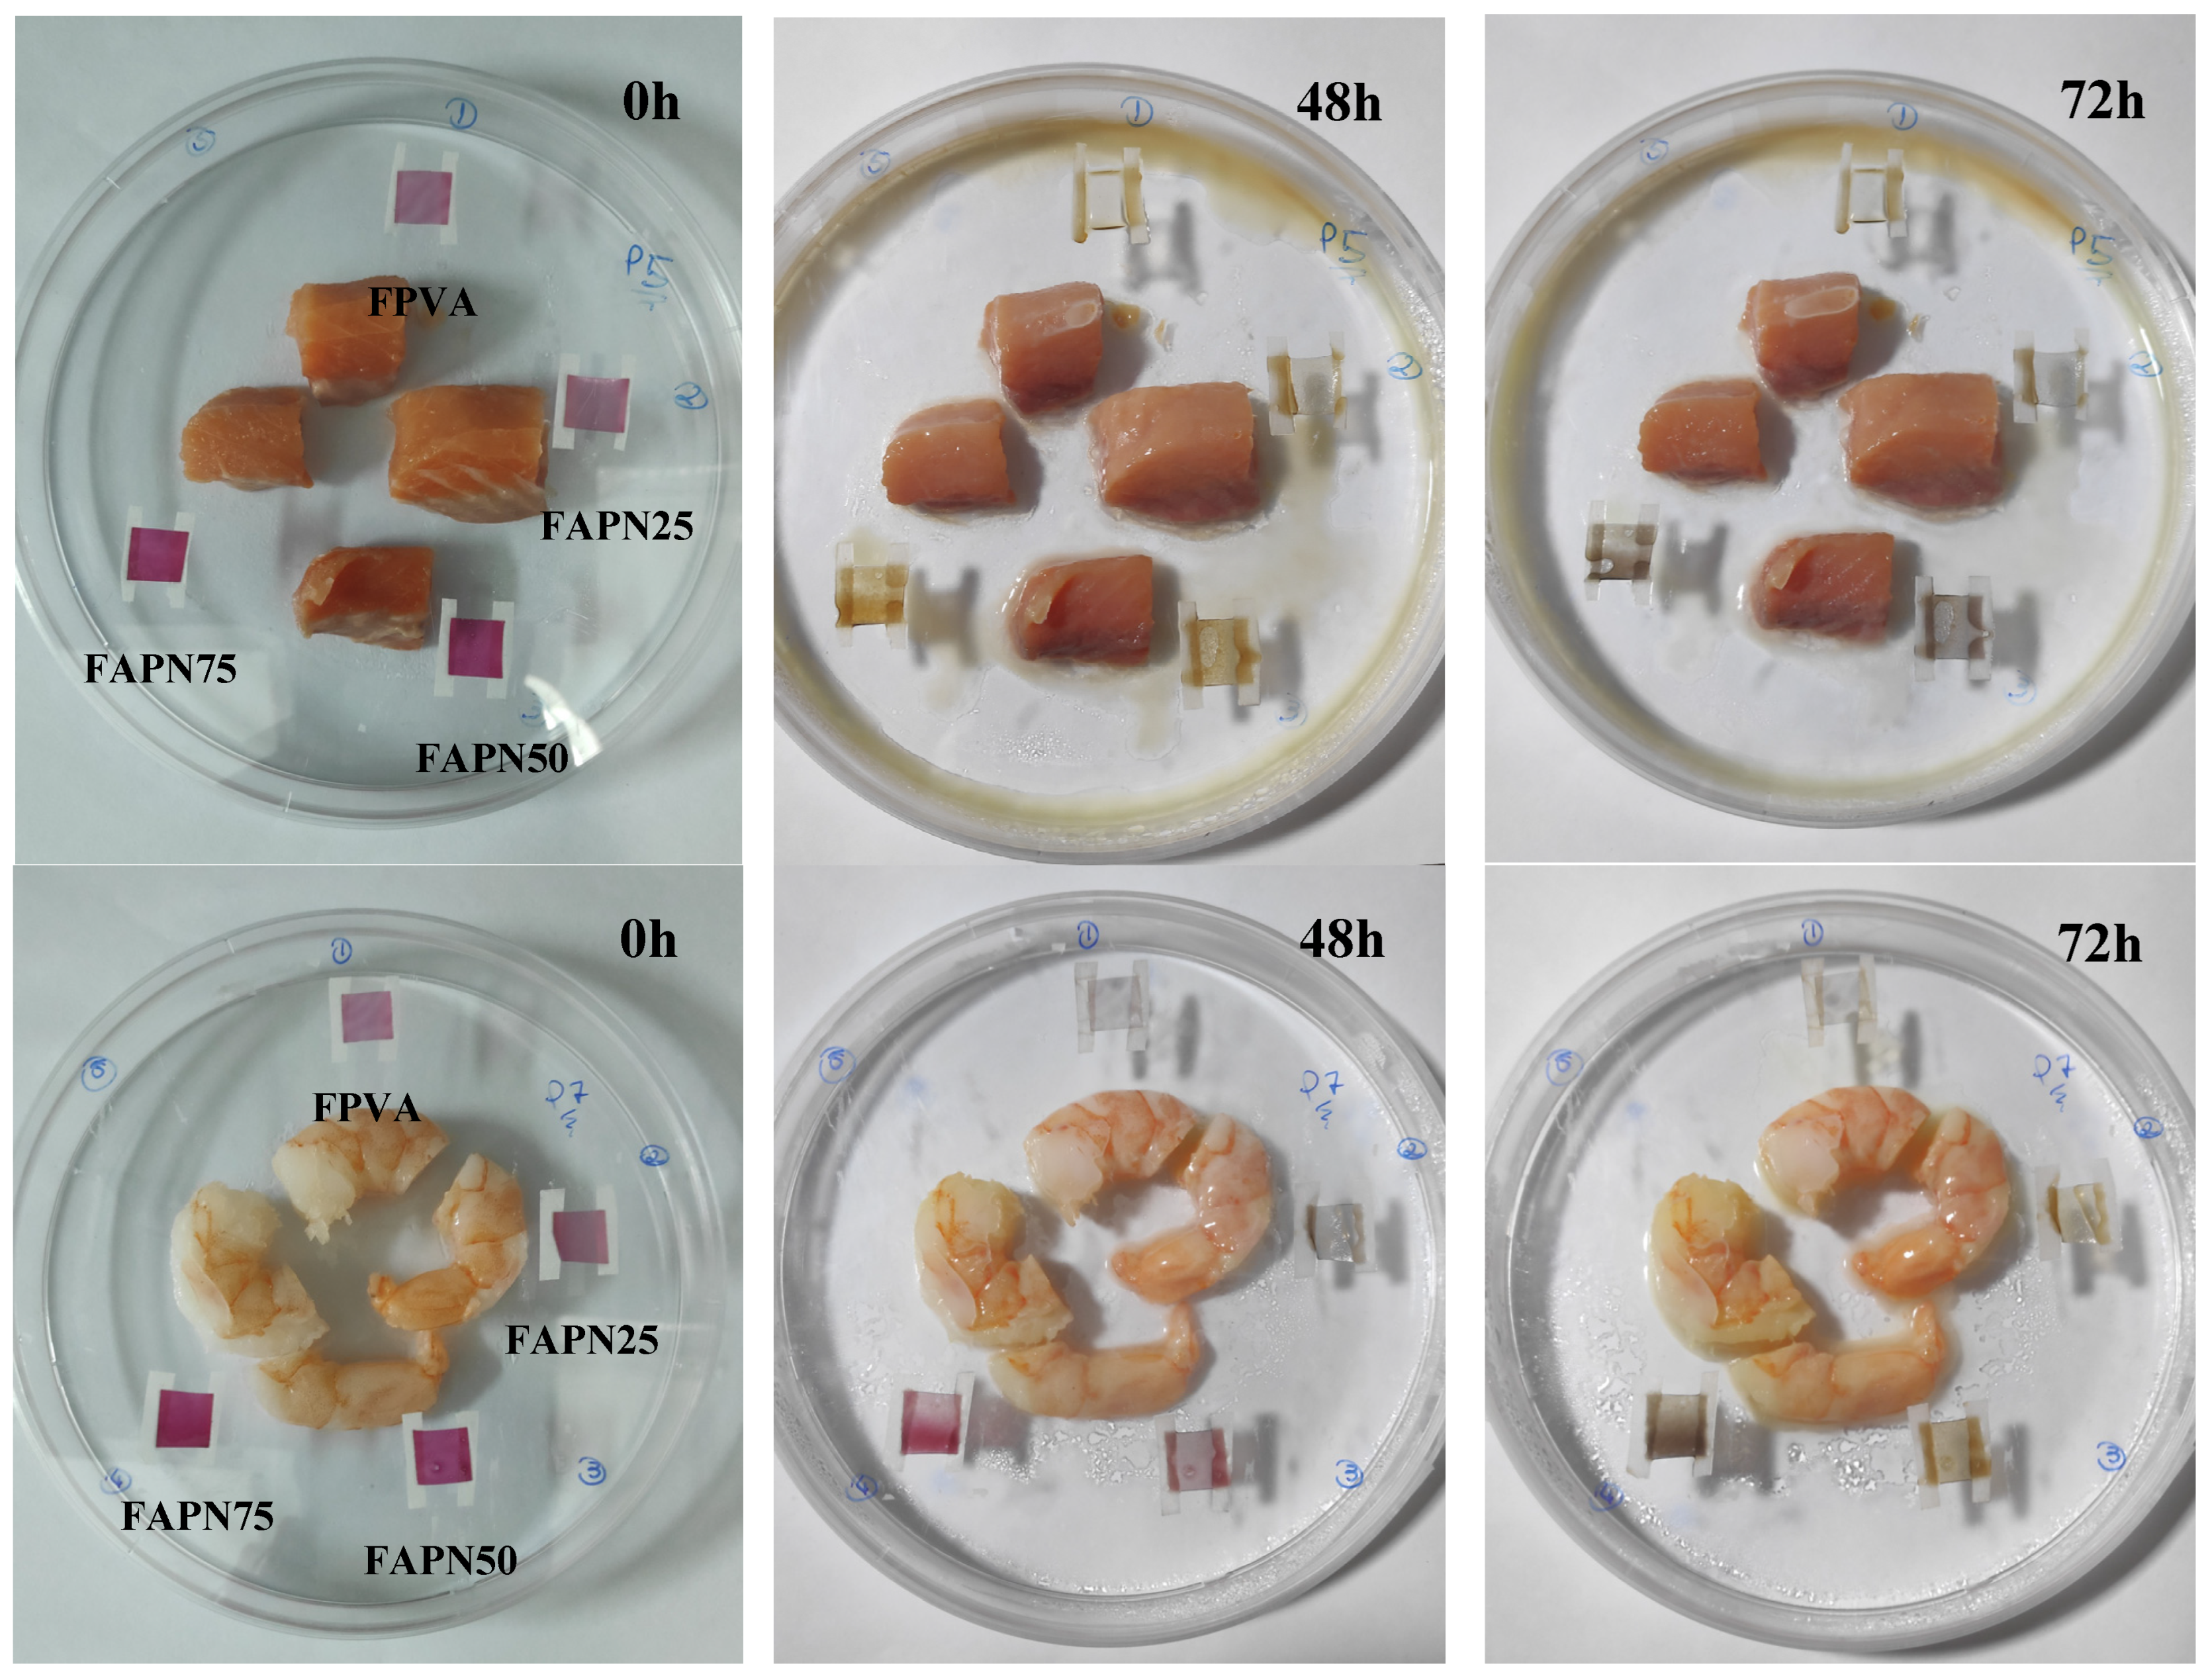
2.3.9. Application of pH-Responsive Films in Monitoring Food Freshness
2.4. Statistical Analysis
3. Results and Discussion
3.1. Production of Intelligent Films
3.2. Characterization of IFs
3.2.1. Visual Aspect and Color Parameters
3.2.2. Moisture Content and Solubility
3.2.3. Mechanical Properties
3.2.4. Contact Angle
3.2.5. Scanning Electron Microscopy (SEM)
3.2.6. Fourier Transform Infrared Spectroscopy (FTIR)
3.2.7. X-Ray Diffraction (XRD)
3.2.8. Color Stability
3.2.9. Application of pH-Responsive Films in Monitoring Food Freshness
4. Conclusions
Author Contributions
Funding
Institutional Review Board Statement
Data Availability Statement
Acknowledgments
Conflicts of Interest
References
- Deng, H.; Su, J.; Zhang, W.; Khan, A.; Sani, M.A.; Goksen, G.; Kashyap, P.; Ezati, P.; Rhim, J.-W. A Review of Starch/Polyvinyl Alcohol (PVA) Blend Film: A Potential Replacement for Traditional Plastic-Based Food Packaging Film. Int. J. Biol. Macromol. 2024, 273, 132926. [Google Scholar] [CrossRef] [PubMed]
- Huang, K.; Wang, Y.; Xu, Z.; Zou, Z.; Tang, Q.; Li, H.; Peng, D. Novel Intelligent Packaging Films Based on Starch/PVA with Cu-ICA Nanocrystal as Functional Compatibilizer for Monitoring Food Freshness. Int. J. Biol. Macromol. 2024, 271, 132373. [Google Scholar] [CrossRef]
- Lim, H.J.; Tang, S.Y.; Chan, K.W.; Manickam, S.; Yu, L.J.; Tan, K.W. A Starch/Gelatin-Based Halochromic Film with Black Currant Anthocyanin and Nanocellulose-Stabilized Cinnamon Essential Oil Pickering Emulsion: Towards Real-Time Salmon Freshness Assessment. Int. J. Biol. Macromol. 2024, 274, 133329. [Google Scholar] [CrossRef] [PubMed]
- Chavez-Marquez, E.; Bernedo, M.S.B.; de Jara, E.M.; Quequezana-Bedregal, M.J.; Gutierrez-Oppe, E.E.; de Alcântara Pessôa Filho, P. Development of Intelligent and Active Potato Starch Films Based on Purple Corn Cob Extract and Molle Essential Oil. Int. J. Biol. Macromol. 2023, 242, 125080. [Google Scholar] [CrossRef] [PubMed]
- Bao, Y.; Cui, H.; Tian, J.; Ding, Y.; Tian, Q.; Zhang, W.; Wang, M.; Zang, Z.; Sun, X.; Li, D.; et al. Novel PH Sensitivity and Colorimetry-Enhanced Anthocyanin Indicator Films by Chondroitin Sulfate Co-Pigmentation for Shrimp Freshness Monitoring. Food Control 2022, 131, 108441. [Google Scholar] [CrossRef]
- Choi, I.; Lee, J.Y.; Lacroix, M.; Han, J. Intelligent PH Indicator Film Composed of Agar/Potato Starch and Anthocyanin Extracts from Purple Sweet Potato. Food Chem. 2017, 218, 122–128. [Google Scholar] [CrossRef]
- Neciosup-Puican, A.A.; Barreda, E.F.; Quinayá, C.P. Stability and Content of Anthocyanins in Peruvian Purple Potato INIA 328-Kulli Papa. LWT 2024, 199, 116125. [Google Scholar] [CrossRef]
- Chi, W.; Liu, W.; Li, J.; Wang, L. Simultaneously Realizing Intelligent Color Change and High Haze of κ-Carrageenan Film by Incorporating Black Corn Seed Powder for Visually Monitoring Pork Freshness. Food Chem. 2023, 402, 134257. [Google Scholar] [CrossRef]
- Liu, L.; Wu, W.; Zheng, L.; Yu, J.; Sun, P.; Shao, P. Intelligent Packaging Films Incorporated with Anthocyanins-Loaded Ovalbumin-Carboxymethyl Cellulose Nanocomplexes for Food Freshness Monitoring. Food Chem. 2022, 387, 132908. [Google Scholar] [CrossRef]
- Silva-Pereira, M.C.; Teixeira, J.A.; Pereira-Júnior, V.A.; Stefani, R. Chitosan/Corn Starch Blend Films with Extract from Brassica Oleraceae (Red Cabbage) as a Visual Indicator of Fish Deterioration. LWT 2015, 61, 258–262. [Google Scholar] [CrossRef]
- Gao, L.; Sun, H.; Nagassa, M.; Li, X.; Pei, H.; Liu, S.; Gu, Y.; He, S. Edible Film Preparation by Anthocyanin Extract Addition into Acetylated Cassava Starch/Sodium Carboxymethyl Cellulose Matrix for Oxidation Inhibition of Pumpkin Seeds. Int. J. Biol. Macromol. 2024, 267, 131439. [Google Scholar] [CrossRef] [PubMed]
- Wu, X.; Yan, X.; Zhang, J.; Wu, X.; Luan, M.; Zhang, Q. Preparation and Characterization of PH-Sensitive Intelligent Packaging Films Based on Cassava Starch/Polyvinyl Alcohol Matrices Containing Aronia Melanocarpa Anthocyanins. LWT 2024, 194, 115818. [Google Scholar] [CrossRef]
- Zhu, B.; Lu, W.; Qin, Y.; Cheng, G.; Yuan, M.; Li, L. An Intelligent PH Indicator Film Based on Cassava Starch/Polyvinyl Alcohol Incorporating Anthocyanin Extracts for Monitoring Pork Freshness. J. Food Process. Preserv. 2021, 45, e15822. [Google Scholar] [CrossRef]
- Qin, Y.; Liu, Y.; Yuan, L.; Yong, H.; Liu, J. Preparation and Characterization of Antioxidant, Antimicrobial and PH-Sensitive Films Based on Chitosan, Silver Nanoparticles and Purple Corn Extract. Food Hydrocoll. 2019, 96, 102–111. [Google Scholar] [CrossRef]
- Lekurwale, S.; Mahajan, S.; Banerjee, S.K.; Banerjee, S. Systematic Evaluations and Integration of Assam Indigenous Joha Rice Starch in Intelligent Packaging Films for Monitoring Food Freshness Using Beetroot Extract. Int. J. Biol. Macromol. 2024, 277, 134332. [Google Scholar] [CrossRef]
- Cano, A.; Cháfer, M.; Chiralt, A.; González-Martínez, C. Development and Characterization of Active Films Based on Starch-PVA, Containing Silver Nanoparticles. Food Packag. Shelf Life 2016, 10, 16–24. [Google Scholar] [CrossRef]
- Bonilla, J.; Talón, E.; Atarés, L.; Vargas, M.; Chiralt, A. Effect of the Incorporation of Antioxidants on Physicochemical and Antioxidant Properties of Wheat Starch–Chitosan Films. J. Food Eng. 2013, 118, 271–278. [Google Scholar] [CrossRef]
- Aguilar-Méndez, M.A.; Martín-Martínez, E.S.; Tomás, S.A.; Cruz-Orea, A.; Jaime-Fonseca, M.R. Gelatine–Starch Films: Physicochemical Properties and Their Application in Extending the Post-harvest Shelf Life of Avocado (Persea Americana). J. Sci. Food Agric. 2008, 88, 185–193. [Google Scholar] [CrossRef]
- Thakur, R.; Pristijono, P.; Scarlett, C.J.; Bowyer, M.; Singh, S.P.; Vuong, Q.V. Starch-Based Films: Major Factors Affecting Their Properties. Int. J. Biol. Macromol. 2019, 132, 1079–1089. [Google Scholar] [CrossRef]
- Liu, F.; Ren, J.; Yang, Q.; Zhang, Q.; Zhang, Y.; Xiao, X.; Cao, Y. Improving Water Resistance and Mechanical Properties of Starch-Based Films by Incorporating Microcrystalline Cellulose in a Dynamic Network Structure. Int. J. Biol. Macromol. 2024, 260, 129404. [Google Scholar] [CrossRef]
- Meng, L.; Li, S.; Yang, W.; Simons, R.; Yu, L.; Chen, Y. Enhancing Water Resistance of Interface between Starch Films and Acrylated Epoxidized Soybean Oil Coating. Prog. Org. Coat. 2022, 163, 106646. [Google Scholar] [CrossRef]
- Domene-López, D.; Delgado-Marín, J.J.; Martin-Gullon, I.; García-Quesada, J.C.; Montalbán, M.G. Comparative Study on Properties of Starch Films Obtained from Potato, Corn and Wheat Using 1-Ethyl-3-Methylimidazolium Acetate as Plasticizer. Int. J. Biol. Macromol. 2019, 135, 845–854. [Google Scholar] [CrossRef] [PubMed]
- Vu, H.P.N.; Lumdubwong, N. Starch Behaviors and Mechanical Properties of Starch Blend Films with Different Plasticizers. Carbohydr. Polym. 2016, 154, 112–120. [Google Scholar] [CrossRef]
- Ballesteros-Mártinez, L.; Pérez-Cervera, C.; Andrade-Pizarro, R. Effect of Glycerol and Sorbitol Concentrations on Mechanical, Optical, and Barrier Properties of Sweet Potato Starch Film. NFS J. 2020, 20, 1–9. [Google Scholar] [CrossRef]
- Adelnia, H.; Ensandoost, R.; Shebbrin Moonshi, S.; Gavgani, J.N.; Vasafi, E.I.; Ta, H.T. Freeze/Thawed Polyvinyl Alcohol Hydrogels: Present, Past and Future. Eur. Polym. J. 2022, 164, 110974. [Google Scholar] [CrossRef]
- Sin, L.T.; Rahman, W.A.W.A.; Rahmat, A.R.; Samad, A.A. Computational Modeling and Experimental Infrared Spectroscopy of Hydrogen Bonding Interactions in Polyvinyl Alcohol–Starch Blends. Polymer 2010, 51, 1206–1211. [Google Scholar] [CrossRef]
- Hashim, S.B.H.; Tahir, H.E.; Lui, L.; Zhang, J.; Zhai, X.; Mahdi, A.A.; Ibrahim, N.A.; Mahunu, G.K.; Hassan, M.M.; Xiaobo, Z.; et al. Smart Films of Carbohydrate-Based/Sunflower Wax/Purple Chinese Cabbage Anthocyanins: A Biomarker of Chicken Freshness. Food Chem. 2023, 399, 133824. [Google Scholar] [CrossRef]
- Pang, S.; Wang, Y.; Jia, H.; Hao, R.; Jan, M.; Li, S.; Pu, Y.; Dong, X.; Pan, J. The Properties of PH-Responsive Gelatin-Based Intelligent Film as Affected by Ultrasound Power and Purple Cabbage Anthocyanin Dose. Int. J. Biol. Macromol. 2023, 230, 123156. [Google Scholar] [CrossRef]
- Liu, D.; Cui, Z.; Shang, M.; Zhong, Y. A Colorimetric Film Based on Polyvinyl Alcohol/Sodium Carboxymethyl Cellulose Incorporated with Red Cabbage Anthocyanin for Monitoring Pork Freshness. Food Packag. Shelf Life 2021, 28, 100641. [Google Scholar] [CrossRef]
- Dong, S.; Zhang, Y.; Lu, D.; Gao, W.; Zhao, Q.; Shi, X. Multifunctional Intelligent Film Integrated with Purple Sweet Potato Anthocyanin and Quercetin-Loaded Chitosan Nanoparticles for Monitoring and Maintaining Freshness of Shrimp. Food Packag. Shelf Life 2023, 35, 101022. [Google Scholar] [CrossRef]
- Li, C.; Sun, J.; Yun, D.; Wang, Z.; Tang, C.; Liu, J. A New Method to Prepare Color-Changeable Smart Packaging Films Based on the Cooked Purple Sweet Potato. Food Hydrocoll. 2023, 137, 108397. [Google Scholar] [CrossRef]
- Zhao, M.; Nuerjiang, M.; Bai, X.; Feng, J.; Kong, B.; Sun, F.; Li, Y.; Xia, X. Monitoring Dynamic Changes in Chicken Freshness at 4 °C and 25 °C Using PH-Sensitive Intelligent Films Based on Sodium Alginate and Purple Sweet Potato Peel Extracts. Int. J. Biol. Macromol. 2022, 216, 361–373. [Google Scholar] [CrossRef] [PubMed]
- Wu, Y.; Li, C. A Smart Film Incorporating Anthocyanins and Tea Polyphenols into Sodium Carboxymethyl Cellulose/Polyvinyl Alcohol for Application in Mirror Carp. Int. J. Biol. Macromol. 2022, 223, 404–417. [Google Scholar] [CrossRef]
- Moradi, M.; Tajik, H.; Almasi, H.; Forough, M.; Ezati, P. A Novel PH-Sensing Indicator Based on Bacterial Cellulose Nanofibers and Black Carrot Anthocyanins for Monitoring Fish Freshness. Carbohydr. Polym. 2019, 222, 115030. [Google Scholar] [CrossRef] [PubMed]
- Huang, X.; Du, L.; Li, Z.; Xue, J.; Shi, J.; Tahir, H.E.; Zhai, X.; Zhang, J.; Zhang, N.; Sun, W.; et al. A Visual Bi-Layer Indicator Based on Mulberry Anthocyanins with High Stability for Monitoring Chinese Mitten Crab Freshness. Food Chem. 2023, 411, 135497. [Google Scholar] [CrossRef]
- Wang, F.; Xie, C.; Tang, H.; Hao, W.; Wu, J.; Sun, Y.; Sun, J.; Liu, Y.; Jiang, L. Development, Characterization and Application of Intelligent/Active Packaging of Chitosan/Chitin Nanofibers Films Containing Eggplant Anthocyanins. Food Hydrocoll. 2023, 139, 108496. [Google Scholar] [CrossRef]
- Wang, L.; Yang, C.; Deng, X.; Peng, J.; Zhou, J.; Xia, G.; Zhou, C.; Shen, Y.; Yang, H. A PH-Sensitive Intelligent Packaging Film Harnessing Dioscorea zingiberensis Starch and Anthocyanin for Meat Freshness Monitoring. Int. J. Biol. Macromol. 2023, 245, 125485. [Google Scholar] [CrossRef]
- Remedio, L.N.; Garcia, V.A.D.S.; Rochetti, A.L.; Berretta, A.A.; Yoshida, C.M.P.; Fukumasu, H.; Vanin, F.M.; de Carvalho, R.A. Hydroxypropyl Methylcellulose Orally Disintegration Films Produced by Tape Casting with the Incorporation of Green Propolis Ethanolic Extract Using the Printing Technique. Food Hydrocoll. 2023, 135, 108176. [Google Scholar] [CrossRef]
- AOAC Official Methods of Analysis of AOAC International; Association of Officiating Analytical Chemists: Washington, DC, USA, 2005.
- Gontard, N.; Duchez, C.; Cuq, J.; Guilbert, S. Edible Composite Films of Wheat Gluten and Lipids-Water Vapor Permeability and Other Physical Properties. Int. J. Food Sci. Technol. 1994, 29, 39–50. [Google Scholar] [CrossRef]
- Shahbazi, M.; Rajabzadeh, G.; Ettelaie, R.; Rafe, A. Kinetic Study of K-Carrageenan Degradation and Its Impact on Mechanical and Structural Properties of Chitosan/k-Carrageenan Film. Carbohydr. Polym. 2016, 142, 167–176. [Google Scholar] [CrossRef]
- Guo, X.; Ren, C.; Zhang, Y.; Cui, H.; Shi, C. Stability of Zein-based Films and Their Mechanism of Change during Storage at Different Temperatures and Relative Humidity. J. Food Process. Preserv. 2020, 44, e14671. [Google Scholar] [CrossRef]
- Mohammadalinejhad, S.; Almasi, H.; Moradi, M. Immobilization of Echium Amoenum Anthocyanins into Bacterial Cellulose Film: A Novel Colorimetric PH Indicator for Freshness/Spoilage Monitoring of Shrimp. Food Control 2020, 113, 107169. [Google Scholar] [CrossRef]
- Zheng, R.; Liao, G.; Kang, J.; Xiong, S.; Liu, Y. An Intelligent Myofibrillar Protein Film for Monitoring Fish Freshness by Recognizing Differences in Anthocyanin (Lycium Ruthenicum)-Induced Color Change. Food Res. Int. 2024, 192, 114777. [Google Scholar] [CrossRef] [PubMed]
- Wu, W.; Liu, L.; Zhou, Y.; Shao, P. Highly Ammonia-Responsive Starch/PVA Film with Gas Absorption System as the ‘Bridge’ for Visually Spoilage Monitoring of Animal-Derived Food. Food Chem. 2024, 430, 137032. [Google Scholar] [CrossRef] [PubMed]
- Liu, Z.; Dong, Y.; Men, H.; Jiang, M.; Tong, J.; Zhou, J. Post-Crosslinking Modification of Thermoplastic Starch/PVA Blend Films by Using Sodium Hexametaphosphate. Carbohydr. Polym. 2012, 89, 473–477. [Google Scholar] [CrossRef]
- Qin, Y.; Yun, D.; Xu, F.; Chen, D.; Kan, J.; Liu, J. Smart Packaging Films Based on Starch/Polyvinyl Alcohol and Lycium Ruthenicum Anthocyanins-Loaded Nano-Complexes: Functionality, Stability and Application. Food Hydrocoll. 2021, 119, 106850. [Google Scholar] [CrossRef]
- Patil, S.; Bharimalla, A.K.; Mahapatra, A.; Dhakane-Lad, J.; Arputharaj, A.; Kumar, M.; Raja, A.S.M.; Kambli, N. Effect of Polymer Blending on Mechanical and Barrier Properties of Starch-Polyvinyl Alcohol Based Biodegradable Composite Films. Food Biosci. 2021, 44, 101352. [Google Scholar] [CrossRef]
- Hiremani, V.D.; Sataraddi, S.; Bayannavar, P.K.; Gasti, T.; Masti, S.P.; Kamble, R.R.; Chougale, R.B. Mechanical, Optical and Antioxidant Properties of 7-Hydroxy-4-Methyl Coumarin Doped Polyvinyl Alcohol/Oxidized Maize Starch Blend Films. SN Appl. Sci. 2020, 2, 1877. [Google Scholar] [CrossRef]
- Nizam, N.H.M.; Rawi, N.F.M.; Ramle, S.F.M.; Aziz, A.A.; Abdullah, C.K.; Rashedi, A.; Kassim, M.H.M. Physical, Thermal, Mechanical, Antimicrobial and Physicochemical Properties of Starch Based Film Containing Aloe Vera: A Review. J. Mater. Res. Technol. 2021, 15, 1572–1589. [Google Scholar] [CrossRef]
- Gómez-Bachar, L.; Vilcovsky, M.; González-Seligra, P.; Famá, L. Effects of PVA and Yerba Mate Extract on Extruded Films of Carboxymethyl Cassava Starch/PVA Blends for Antioxidant and Mechanically Resistant Food Packaging. Int. J. Biol. Macromol. 2024, 268, 131464. [Google Scholar] [CrossRef]
- Zhao, Z.; Liu, H.; Tang, J.; He, B.; Yu, H.; Xu, X.; Li, C.; Wang, C.; Liu, Y.; Su, Y.; et al. Pork Preservation by Antimicrobial Films Based on Potato Starch (PS) and Polyvinyl Alcohol (PVA) and Incorporated with Clove Essential Oil (CLO) Pickering Emulsion. Food Control 2023, 154, 109988. [Google Scholar] [CrossRef]
- Forghani, S.; Zeynali, F.; Almasi, H.; Hamishehkar, H. Characterization of Electrospun Nanofibers and Solvent-Casted Films Based on Centaurea Arvensis Anthocyanin-Loaded PVA/κ-Carrageenan and Comparing Their Performance as Colorimetric PH Indicator. Food Chem. 2022, 388, 133057. [Google Scholar] [CrossRef]
- Maftoonazad, N.; Ramaswamy, H. Design and Testing of an Electrospun Nanofiber Mat as a PH Biosensor and Monitor the PH Associated Quality in Fresh Date Fruit (Rutab). Polym. Test. 2019, 75, 76–84. [Google Scholar] [CrossRef]
- Wang, P.; Qin, H.; He, D.; Zou, Z.; Xu, L.; Tang, Q. Developing Colorimetric Ammonia-Sensing Nanocomposite Films Based on Potato Starch/PVA and ZnCu-BTC Nanorods for Real-Time Monitoring Food Freshness. Int. J. Biol. Macromol. 2024, 277, 134376. [Google Scholar] [CrossRef] [PubMed]
- Negim, E.; Rakhmetullayeva, R.; Yeligbayeva, G.; Urkimbaeva, P.; Primzharova, S.; Kaldybekov, D.; Khatib, J.; Mun, G.; W., C. Improving Biodegradability of Polyvinyl Alcohol/Starch Blend Films for Packaging Applications. Int. J. Basic Appl. Sci. 2014, 3, 263–273. [Google Scholar] [CrossRef]
- Priya, C.N.; Muthuvinayagam, M.; Vahini, M. Environmental Friendly Solid Blend Polymer Electrolytes Based on PVA:Starch:Ceric Ammonium Nitrate for Electric Double Layer Capacitor (EDLC) Applications. J. Mater. Sci. 2023, 58, 773–786. [Google Scholar] [CrossRef]
- Zheng, L.; Liu, L.; Yu, J.; Farag, M.A.; Shao, P. Intelligent Starch/Chitosan-Based Film Incorporated by Anthocyanin-Encapsulated Amylopectin Nanoparticles with High Stability for Food Freshness Monitoring. Food Control 2023, 151, 109798. [Google Scholar] [CrossRef]
- Zhai, X.; Shi, J.; Zou, X.; Wang, S.; Jiang, C.; Zhang, J.; Huang, X.; Zhang, W.; Holmes, M. Novel Colorimetric Films Based on Starch/Polyvinyl Alcohol Incorporated with Roselle Anthocyanins for Fish Freshness Monitoring. Food Hydrocoll. 2017, 69, 308–317. [Google Scholar] [CrossRef]
- Yong, H.; Liu, J. Recent Advances in the Preparation, Physical and Functional Properties, and Applications of Anthocyanins-Based Active and Intelligent Packaging Films. Food Packag. Shelf Life 2020, 26, 100550. [Google Scholar] [CrossRef]
- Yun, D.; Li, C.; Wang, Z.; Xu, F.; Chen, D.; Liu, J. Preparation of Cost-Effective and Hydrophobic Freshness Indicating Labels Based on Passion Fruit Peel Powder and Stearic Acid. Food Biosci. 2023, 53, 102758. [Google Scholar] [CrossRef]
- Li, N.; Qin, H.; Tang, Q.; Peng, D.; Luo, X.; Li, H.; Zou, Z. Development and Application of Intelligent Packaging Films Based on Carboxymethyl Starch/PVA with Cu-LTE Nanocrystal as Functional Compatibilizer. Food Packag. Shelf Life 2024, 43, 101306. [Google Scholar] [CrossRef]
- Poudel, R.; Dutta, N.; Karak, N. A Mechanically Robust Biodegradable Bioplastic of Citric Acid Modified Plasticized Yam Starch with Anthocyanin as a Fish Spoilage Auto-Detecting Smart Film. Int. J. Biol. Macromol. 2023, 242, 125020. [Google Scholar] [CrossRef] [PubMed]
- Anugrah, D.S.B.; Darmalim, L.V.; Sinanu, J.D.; Pramitasari, R.; Subali, D.; Prasetyanto, E.A.; Cao, X.T. Development of Alginate-Based Film Incorporated with Anthocyanins of Red Cabbage and Zinc Oxide Nanoparticles as Freshness Indicator for Prawns. Int. J. Biol. Macromol. 2023, 251, 126203. [Google Scholar] [CrossRef] [PubMed]


| Formulation | pH | L* | a* | b* | c* | h* | ΔE |
|---|---|---|---|---|---|---|---|
| FPVA | 1.68 | 57.8 ± 1.1 a | 39.1 ± 1.7 a | −9.3 ± 0.2 a | 40.2 ± 1.6 a | 359.77 ± 0.01 a | 6.9 ± 1.0 a |
| 4.01 | 64.7 ± 0.5 b | 20.2 ± 0.5 b | −2.3 ± 0.2 b | 20.3 ± 0.5 b | 359.89 ± 0.01 a | 25.4 ± 0.6 b | |
| 7.00 | 69.5 ± 0.9 c | 10.6 ± 0.9 c | 5.2 ± 0.3 c | 11.8 ± 0.8 d | 0.45 ± 0.05 c | 38.2 ± 1.2 c | |
| 10.01 | 63.7 ± 1.2 b | −11.9 ± 0.2 e | 8.1 ± 0.5 d | 14.4 ± 0.5 c | 179.40 ± 0.02 b | 55.4 ± 0.2 d | |
| 12.45 | 70.6 ± 0.5 c | −0.7 ± 0.1 d | 22.2 ± 0.1 e | 22.2 ± 0.1 b | 178.46 ± 0.01 b | 55.4 ± 0.3 d | |
| FAPN25 | 1.68 | 68.9 ± 0.3 a | 9.5 ± 0.7 a | 1.4 ± 1.1 a | 9.6 ± 0.6 b | 0.15 ± 0.12 a | 28.9 ± 0.9 a |
| 4.01 | 72.7 ± 1.2 b | 4.8 ± 0.3 b | 1.3 ± 0.4 a | 5.0 ± 0.2 d | 0.26 ± 0.09 a | 33.1 ± 0.9 b | |
| 7.00 | 70.7 ± 1.9 a,b | 5.1 ± 0.9 b | 5.0 ± 0.4 b | 7.1 ± 0.6 c | 0.78 ± 0.11 b | 33.3 ± 1.4 b | |
| 10.01 | 71.3 ± 0.5 a,b | 2.9 ± 0.9 c | 2.6 ± 0.5 a | 3.9 ± 0.9 d | 0.74 ± 0.10 b | 32.6 ± 0.7 b | |
| 12.45 | 76.8 ± 0.7 c | −3.7 ± 0.1 d | 11.9 ± 0.3 c | 12.5 ± 0.3 a | 178.73 ± 0.01 c | 41.9 ± 0.1 c | |
| FAPN50 | 1.68 | 55.3 ± 3.7 a | 25.1 ± 1.3 a | −4.5 ± 0.7 a | 25.5 ± 1.3 a | 359.82 ± 0.02 a | 17.6 ± 2.4 a |
| 4.01 | 57.6 ± 1.4 a | 20.9 ± 0.6 b | −2.2 ± 0.3 b | 21.0 ± 0.5 b | 359.89 ± 0.02 b | 25.4 ± 1.2 b | |
| 7.00 | 69.7 ± 0.2 b | 6.3 ± 0.1 c | 5.6 ± 0.1 c | 8.5 ± 0.1 d | 0.73 ± 0.01 e | 43.6 ± 0.1 c | |
| 10.01 | 59.4 ± 2.2 a | −11.5 ± 0.2 e | 7.7 ± 0.4 c | 13.9 ± 0.4 c | 179.41 ± 0.01 c | 55.7 ± 0.8 d | |
| 12.45 | 58.5 ± 0.9 a | −0.8 ± 0.2 d | 23.9 ± 1.6 d | 23.9 ± 1.6 a | 178.46 ± 0.01 d | 56.4 ± 0.9 d | |
| FAPN75 | 1.68 | 46.4 ± 1.0 b | 32.1 ± 0.6 a | −0.5 ± 0.4 a | 32.1 ± 0.6 a | 359.04 ± 0.77 a | 9.6 ± 1.2 a |
| 4.01 | 49.6 ± 0.6 b | 19.9 ± 1.0 b | 3.6 ± 0.2 b | 20.3 ± 1.0 b | 10.33 ± 0.09 e | 20.5 ± 1.1 b | |
| 7.00 | 53.6 ± 0.5 a | 10.5 ± 0.4 c | 11.7 ± 0.1 d | 15.7 ± 0.2 c | 48.20 ± 1.38 d | 32.3 ± 0.6 c | |
| 10.01 | 47.7 ± 0.6 b | −8.9 ± 0.8 e | 8.9 ± 0.4 c | 12.6 ± 0.3 d | 134.83 ± 3.99 b | 47.9 ± 0.7 e | |
| 12.45 | 48.0 ± 2.8 b | 3.4 ± 0.2 d | 19.5 ± 0.9 e | 19.8 ± 0.9 b | 80.08 ± 0.73 c | 37.7 ± 0.4 d | |
| FAPN100 | 1.68 | 43.3 ± 1.1 a | 31.1 ± 0.8 a | −3.2 ± 0.6 a | 31.3 ± 0.8 a | 354.14 ± 1.06 a | 9.1 ± 0.2 a |
| 4.01 | 43.0 ± 0.6 a | 19.5 ± 0.5 b | 1.4 ± 0.3 b | 19.5 ± 0.5 c | 4.22 ± 0.99 d | 17.8 ± 0.6 b | |
| 7.00 | 43.6 ± 1.2 a | 8.6 ± 0.4 c | 6.4 ± 0.2 c | 10.7 ± 0.3 d | 36.43 ± 1.73 c | 29.2 ± 0.6 c | |
| 10.01 | 43.3 ± 1.0 a | −10.5 ± 0.4 d | 8.1 ± 0.2 d | 13.3 ± 0.3 e | 179.34 ± 0.02 b | 48.8 ± 0.3 e | |
| 12.45 | 43.9 ± 0.6 a | −1.8 ± 0.3 e | 21.6 ± 0.3 e | 21.7 ± 0.3 b | 178.51 ± 0.01 b | 42.3 ± 0.1 d |
| Formulation | MC (g/100 g) | S (%) | T (mm) |
|---|---|---|---|
| FPVA | 7.5 ± 0.4 a | 98.4 ± 0.3 a | 0.10 ± 0.02 |
| FAPN25 | 6.6 ± 0.5 a | 96.1 ± 1.1 a | 0.12 ± 0.03 |
| FAPN50 | 6.9 ± 0.3 a | 66.7 ± 1.5 b | 0.12 ± 0.02 |
| FAPN75 | 6.9 ± 0.3 a | 52.1 ± 3.4 c | 0.11 ± 0.03 |
| FAPN100 | 6.8 ± 0.2 a | 35.1 ± 3.5 d | 0.08 ± 0.01 |
| Formulation | TS (MPa) | ε (%) | YM (MPa) | CA0 (°) | CA30 (°) |
|---|---|---|---|---|---|
| FPVA | 40.6 ± 6.8 a | 277.6 ± 42.5 a | 52.1 ± 14.6 a | 59.8 ± 9.6 a | 59.3 ± 8.9 a |
| FAPN25 | 15.9 ± 1.8 b,c | 86.1 ± 19.1 b | 81.5 ± 28.1 a | 78.7 ± 5.8 a | 77.0 ± 5.2 a |
| FAPN50 | 17.2 ± 1.7 b | 63.6 ± 13.2 c | 274.1 ± 70.4 b | 68.1 ± 11.3 a | 68.4 ± 9.2 a |
| FAPN75 | 16.4 ± 2.4 b | 5.5 ± 0.9 d | 978.3 ± 251.7 c | 64.8 ± 11.9 a | 63.7 ± 9.6 a |
| FAPN100 | 13.3 ± 1.3 c | 2.6 ± 0.9 d | 1127.9 ± 113.2 d | 59.3 ± 8.4 a | 56.2 ± 7.5 a |
| FPVA | FAPN25 | FAPN50 | FAPN75 | FAPN100 | |
|---|---|---|---|---|---|
| Surface |  | 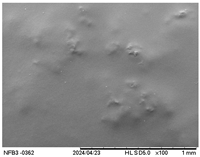 |  | 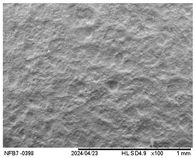 | 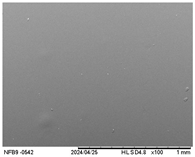 |
| Internal | 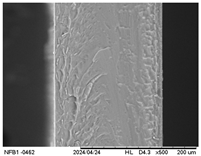 | 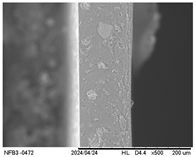 |  | 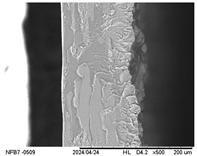 | 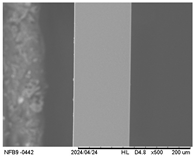 |
| Formulation | L* | a* | b* |
|---|---|---|---|
| FPVA | 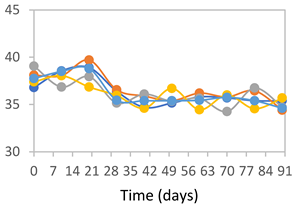 | 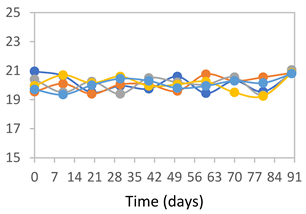 | 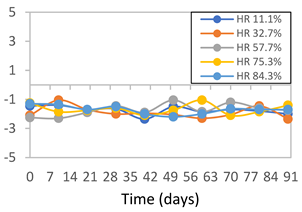 |
| FAPN25 | 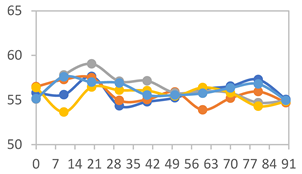 | 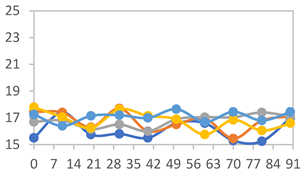 | 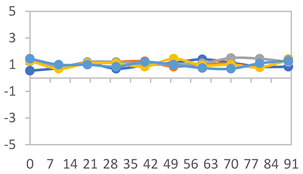 |
| FAPN50 |  |  | 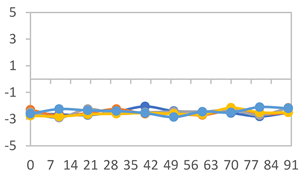 |
| FAPN75 | 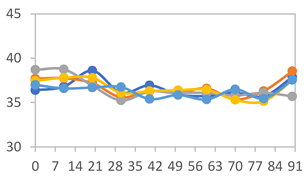 | 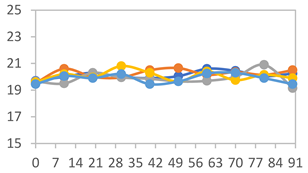 | 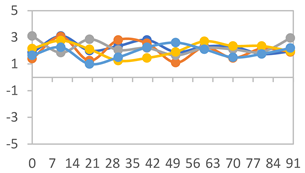 |
| FAPN100 | 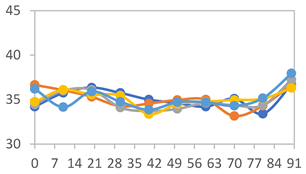 | 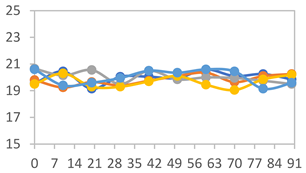 | 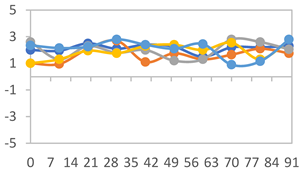 |
| Formulation | L* | a* | b* |
|---|---|---|---|
| FPVA | 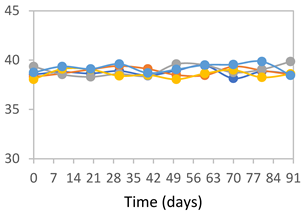 | 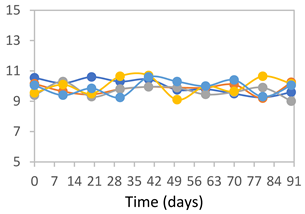 | 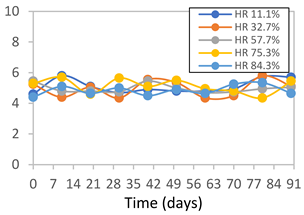 |
| FAPN25 | 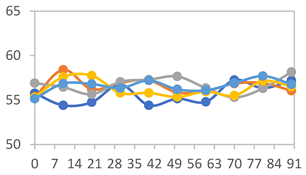 |  | 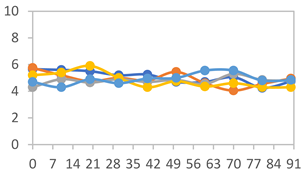 |
| FAPN50 | 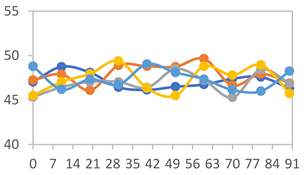 | 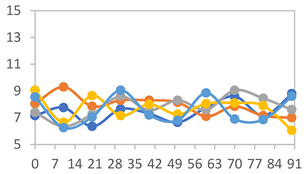 | 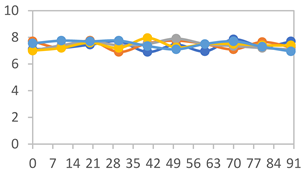 |
| FAPN75 | 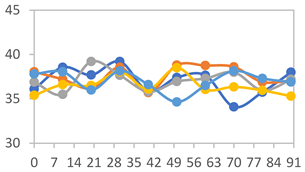 | 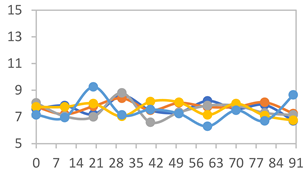 | 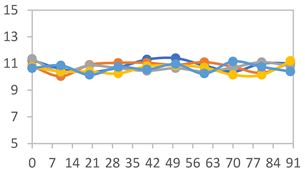 |
| FAPN100 | 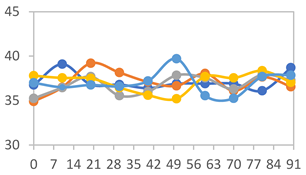 | 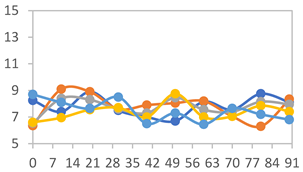 |  |
| Formulation | L* | a* | b* |
|---|---|---|---|
| FPVA | 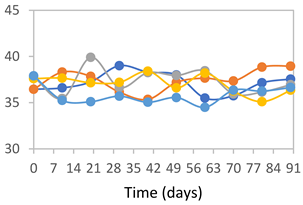 |  |  |
| FAPN25 | 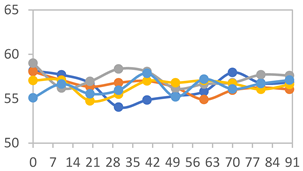 | 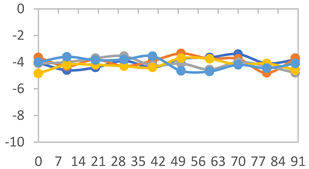 |  |
| FAPN50 |  | 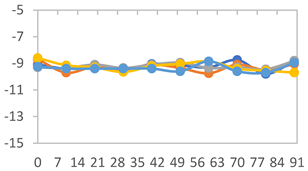 |  |
| FAPN75 | 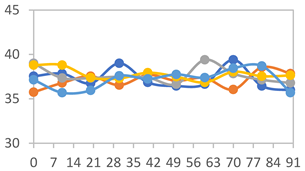 |  | 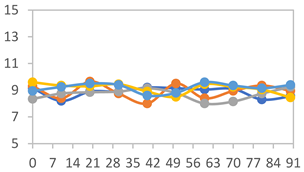 |
| FAPN100 |  | 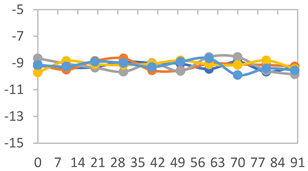 |  |
| Formulation | Time (h) | L | a* | b* | c* | h* | ΔE (t = 30 min) |
|---|---|---|---|---|---|---|---|
| FPVA | 0 h | 40.7 ± 4.1 a | 10.4 ± 1.2 a | −2.9 ± 0.2 a | 10.8 ± 1.1 a | 354.8 ± 4.4 a | - |
| 24 h | 38.8 ± 2.5 a | 8.0 ± 1.6 b | −1.9 ± 0.4 a | 8.3 ± 1.5 b | 355.8 ± 1.6 a | 3.53 ± 2.33 a | |
| 48 h | 38.8 ± 1.3 a | −0.6 ± 0.2 c | 3.1 ± 0.8 b | 3.2 ± 0.8 d | 100.3 ± 2.6 b | 13.40 ± 1.84 b | |
| 72 h | 39.6 ± 1.1 a | −0.3 ± 0.5 c | 5.8 ± 2.3 c | 5.8 ± 2.3 c | 94.0 ± 6.1 b | 14.56 ± 2.20 b | |
| FAPN25 | 0 h | 48.0 ± 1.2 a | 6.7 ± 0.4 a | −1.9 ± 0.3 a | 6.9 ± 0.3 a | 354.1 ± 5.6 a | - |
| 24 h | 45.3 ± 0.1 a | 4.0 ± 0.1 b | −0.9 ± 0.0 b | 4.1 ± 0.1 b | 351.5 ± 6.0 a | 3.80 ± 0.04 a | |
| 48 h | 45.6 ± 0.1 a | −0.4 ± 0.1 c | 1.8 ± 0.1 c | 1.8 ± 0.1 d | 102.6 ± 1.0 b | 8.11 ± 0.04 b | |
| 72 h | 46.4 ± 0.1 a | −0.4 ± 0.2 c | 3.2 ± 0.1 d | 3.2 ± 0.1 c | 96.3 ± 3.7 b | 8.60 ± 0.15 b | |
| FAPN50 | 0 h | 43.0 ± 1.9 a | 10.5 ± 1.4 a | −1.8 ± 0.4 a | 10.6 ± 1.5 a | 353.7 ± 1.3 a | - |
| 24 h | 36.7 ± 4.2 b | 10.0 ± 1.3 a | −1.3 ± 0.2 a | 10.1 ± 1.2 a | 351.3 ± 2.6 a | 7.54 ± 2.86 a | |
| 48 h | 38.4 ± 2.4 b | 2.4 ± 1.7 b | 1.2 ± 0.9 b | 3.1 ± 0.9 c | 33.7 ± 37.2 c | 9.98 ± 2.66 b | |
| 72 h | 37.4 ± 1.6 b | 0.6 ± 0.7 b | 5.5 ± 1.3 c | 5.6 ± 1.4 b | 84.8 ± 5.1 b | 13.60 ± 1.65 c | |
| FAPN75 | 0 h | 42.3 ± 1.6 a | 7.0 ± 1.5 a | −1.7 ± 0.4 a | 7.2 ± 1.5 a | 353.8 ± 4.5 a | - |
| 24 h | 36.5 ± 2.1 b | 8.2 ± 1.1 a | −1.2 ± 0.3 a,b | 8.3 ± 1.1 a | 352.8 ± 1.9 a | 6.14 ± 1.53 a | |
| 48 h | 35.2 ± 0.7 b | 1.9 ± 2.0 b | 0.6 ± 0.9 b | 2.7 ± 0.7 b | 157.7 ± 162.2 b | 9.56 ± 1.92 b | |
| 72 h | 37.0 ± 1.4 b | 1.0 ± 0.3 b | 6.0 ± 2.1 c | 6.1 ± 2.1 a | 80.2 ± 4.9 b | 11.49 ± 1.46 c |
| Formulation | Time (h) | L | a* | b* | c* | h* | ΔE (t = 30 min) |
|---|---|---|---|---|---|---|---|
| FPVA | 0 h | 41.1 ± 1.8 a | 9.5 ± 2.1 a | −3.0 ± 0.4 a | 9.9 ± 2.0 a | 353.8 ± 7.5 a | - |
| 24 h | 39.1 ± 2.4 a | 8.5 ± 1.4 a | −2.3 ± 0.1 a | 8.8 ± 1.3 a | 353.7 ± 6.2 a | 3.34 ± 2.48 a | |
| 48 h | 40.3 ± 1.5 a | 1.3 ± 1.1 b | 0.5 ± 0.6 c | 1.6 ± 0.9 b | 34.0 ± 33.5 c | 9.14 ± 2.66 b | |
| 72 h | 40.6 ± 1.4 a | 0.0 ± 0.6 b | 3.4 ± 1.9 b | 3.5 ± 1.9 b | 86.1 ± 15.6 b | 11.64 ± 2.89 b | |
| FAPN25 | 0 h | 50.8 ± 2.0 a | 7.8 ± 0.8 a | −1.7 ± 1.8 a | 8.1 ± 0.8 a | 355.7 ± 6.9 a | - |
| 24 h | 49.1 ± 2.2 a,b | 6.8 ± 0.6 a | −1.8 ± 0.2 a | 7.0 ± 0.6 a | 354.7 ± 3.9 a | 3.40 ± 2.45 a | |
| 48 h | 45.3 ± 2.6 b,c | −0.1 ± 0.2 b | 1.8 ± 0.7 b | 1.8 ± 0.7 c | 96.5 ± 12.5 b | 10.42 ± 1.33 b | |
| 72 h | 44.5 ± 2.8 c | 0.2 ± 0.5 b | 3.8 ± 0.4 b | 3.8 ± 0.4 b | 88.1 ± 7.7 b | 11.69 ± 2.13 b | |
| FAPN50 | 0 h | 42.8 ± 1.6 a | 9.1 ± 1.4 b | −2.3 ± 0.2 a | 9.3 ± 1.3 a | 353.8 ± 5.3 a | - |
| 24 h | 39.1 ± 3.2 b | 11.8 ± 1.6 a | −1.6 ± 0.2 a,b | 11.9 ± 1.6 a | 352.4 ± 1.1 a | 5.59 ± 2.78 a | |
| 48 h | 38.9 ± 2.9 b | 4.0 ± 0.6 c | 0.6 ± 0.8 a,b | 4.0 ± 0.7 b | 128.2 ± 176.8 b | 7.59 ± 3.06 a | |
| 72 h | 39.4 ± 0.6 b | 1.1 ± 0.7 d | 5.8 ± 3.0 c | 5.9 ± 3.0 b | 77.1 ± 7.3 b | 12.04 ± 2.77 b | |
| FAPN75 | 0 h | 42.1 ± 2.0 a | 8.2 ± 1.5 b | −1.5 ± 0.1 a | 8.3 ± 1.5 b | 353.9 ± 2.1 a | - |
| 24 h | 35.1 ± 1.0 b | 10.7 ± 1.7 a | −1.4 ± 0.3 a | 10.8 ± 1.7 a | 351.6 ± 2.5 a | 7.83 ± 2.27 a | |
| 48 h | 36.7 ± 1.6 b | 5.3 ± 0.7 c | −0.2 ± 0.4 b | 5.3 ± 0.7 c | 237.9 ± 182.1 a | 6.71 ± 2.53 a | |
| 72 h | 34.6 ± 1.6 b | 0.3 ± 0.2 d | 2.5 ± 1.4 c | 2.5 ± 1.4 d | 82.0 ± 7.0 b | 11.94 ± 1.75 b |
Disclaimer/Publisher’s Note: The statements, opinions and data contained in all publications are solely those of the individual author(s) and contributor(s) and not of MDPI and/or the editor(s). MDPI and/or the editor(s) disclaim responsibility for any injury to people or property resulting from any ideas, methods, instructions or products referred to in the content. |
© 2025 by the authors. Licensee MDPI, Basel, Switzerland. This article is an open access article distributed under the terms and conditions of the Creative Commons Attribution (CC BY) license (https://creativecommons.org/licenses/by/4.0/).
Share and Cite
Remedio, L.N.; Parada-Quinayá, C. Development and Characterization of Peruvian Native Potato Starch/PVA-Based pH-Sensitive Films Incorporated with Purple Potato Anthocyanin Extract for Food Packaging. Polymers 2025, 17, 1813. https://doi.org/10.3390/polym17131813
Remedio LN, Parada-Quinayá C. Development and Characterization of Peruvian Native Potato Starch/PVA-Based pH-Sensitive Films Incorporated with Purple Potato Anthocyanin Extract for Food Packaging. Polymers. 2025; 17(13):1813. https://doi.org/10.3390/polym17131813
Chicago/Turabian StyleRemedio, Leandro Neodini, and Carolina Parada-Quinayá. 2025. "Development and Characterization of Peruvian Native Potato Starch/PVA-Based pH-Sensitive Films Incorporated with Purple Potato Anthocyanin Extract for Food Packaging" Polymers 17, no. 13: 1813. https://doi.org/10.3390/polym17131813
APA StyleRemedio, L. N., & Parada-Quinayá, C. (2025). Development and Characterization of Peruvian Native Potato Starch/PVA-Based pH-Sensitive Films Incorporated with Purple Potato Anthocyanin Extract for Food Packaging. Polymers, 17(13), 1813. https://doi.org/10.3390/polym17131813