

Optimization and Characterization of Crosslinked Chitosan-Based Oleogels Based on Mechanical Properties of Conventional Solid Fats

 , , ,
, , ,  , , and
Abstract

1. Introduction
2. Materials and Methods
2.1. Samples, Reagents, and Solvents
2.2. Chitosan-Based Oleogel Preparation
2.3. Experimental Design
2.4. Analysis of Response Variables: Oil Loss, Hardness, and Adhesiveness of Oleogels
2.5. Multiresponse Optimization by Desirability Function and Verification of Models
2.6. Determination of Microstructure and Rheological Properties of Optimized Oleogels
2.6.1. Microstructure of Oleogels
2.6.2. Rheological Measurements
2.7. Statistical Analyses
3. Results and Discussion
3.1. Model Fitting
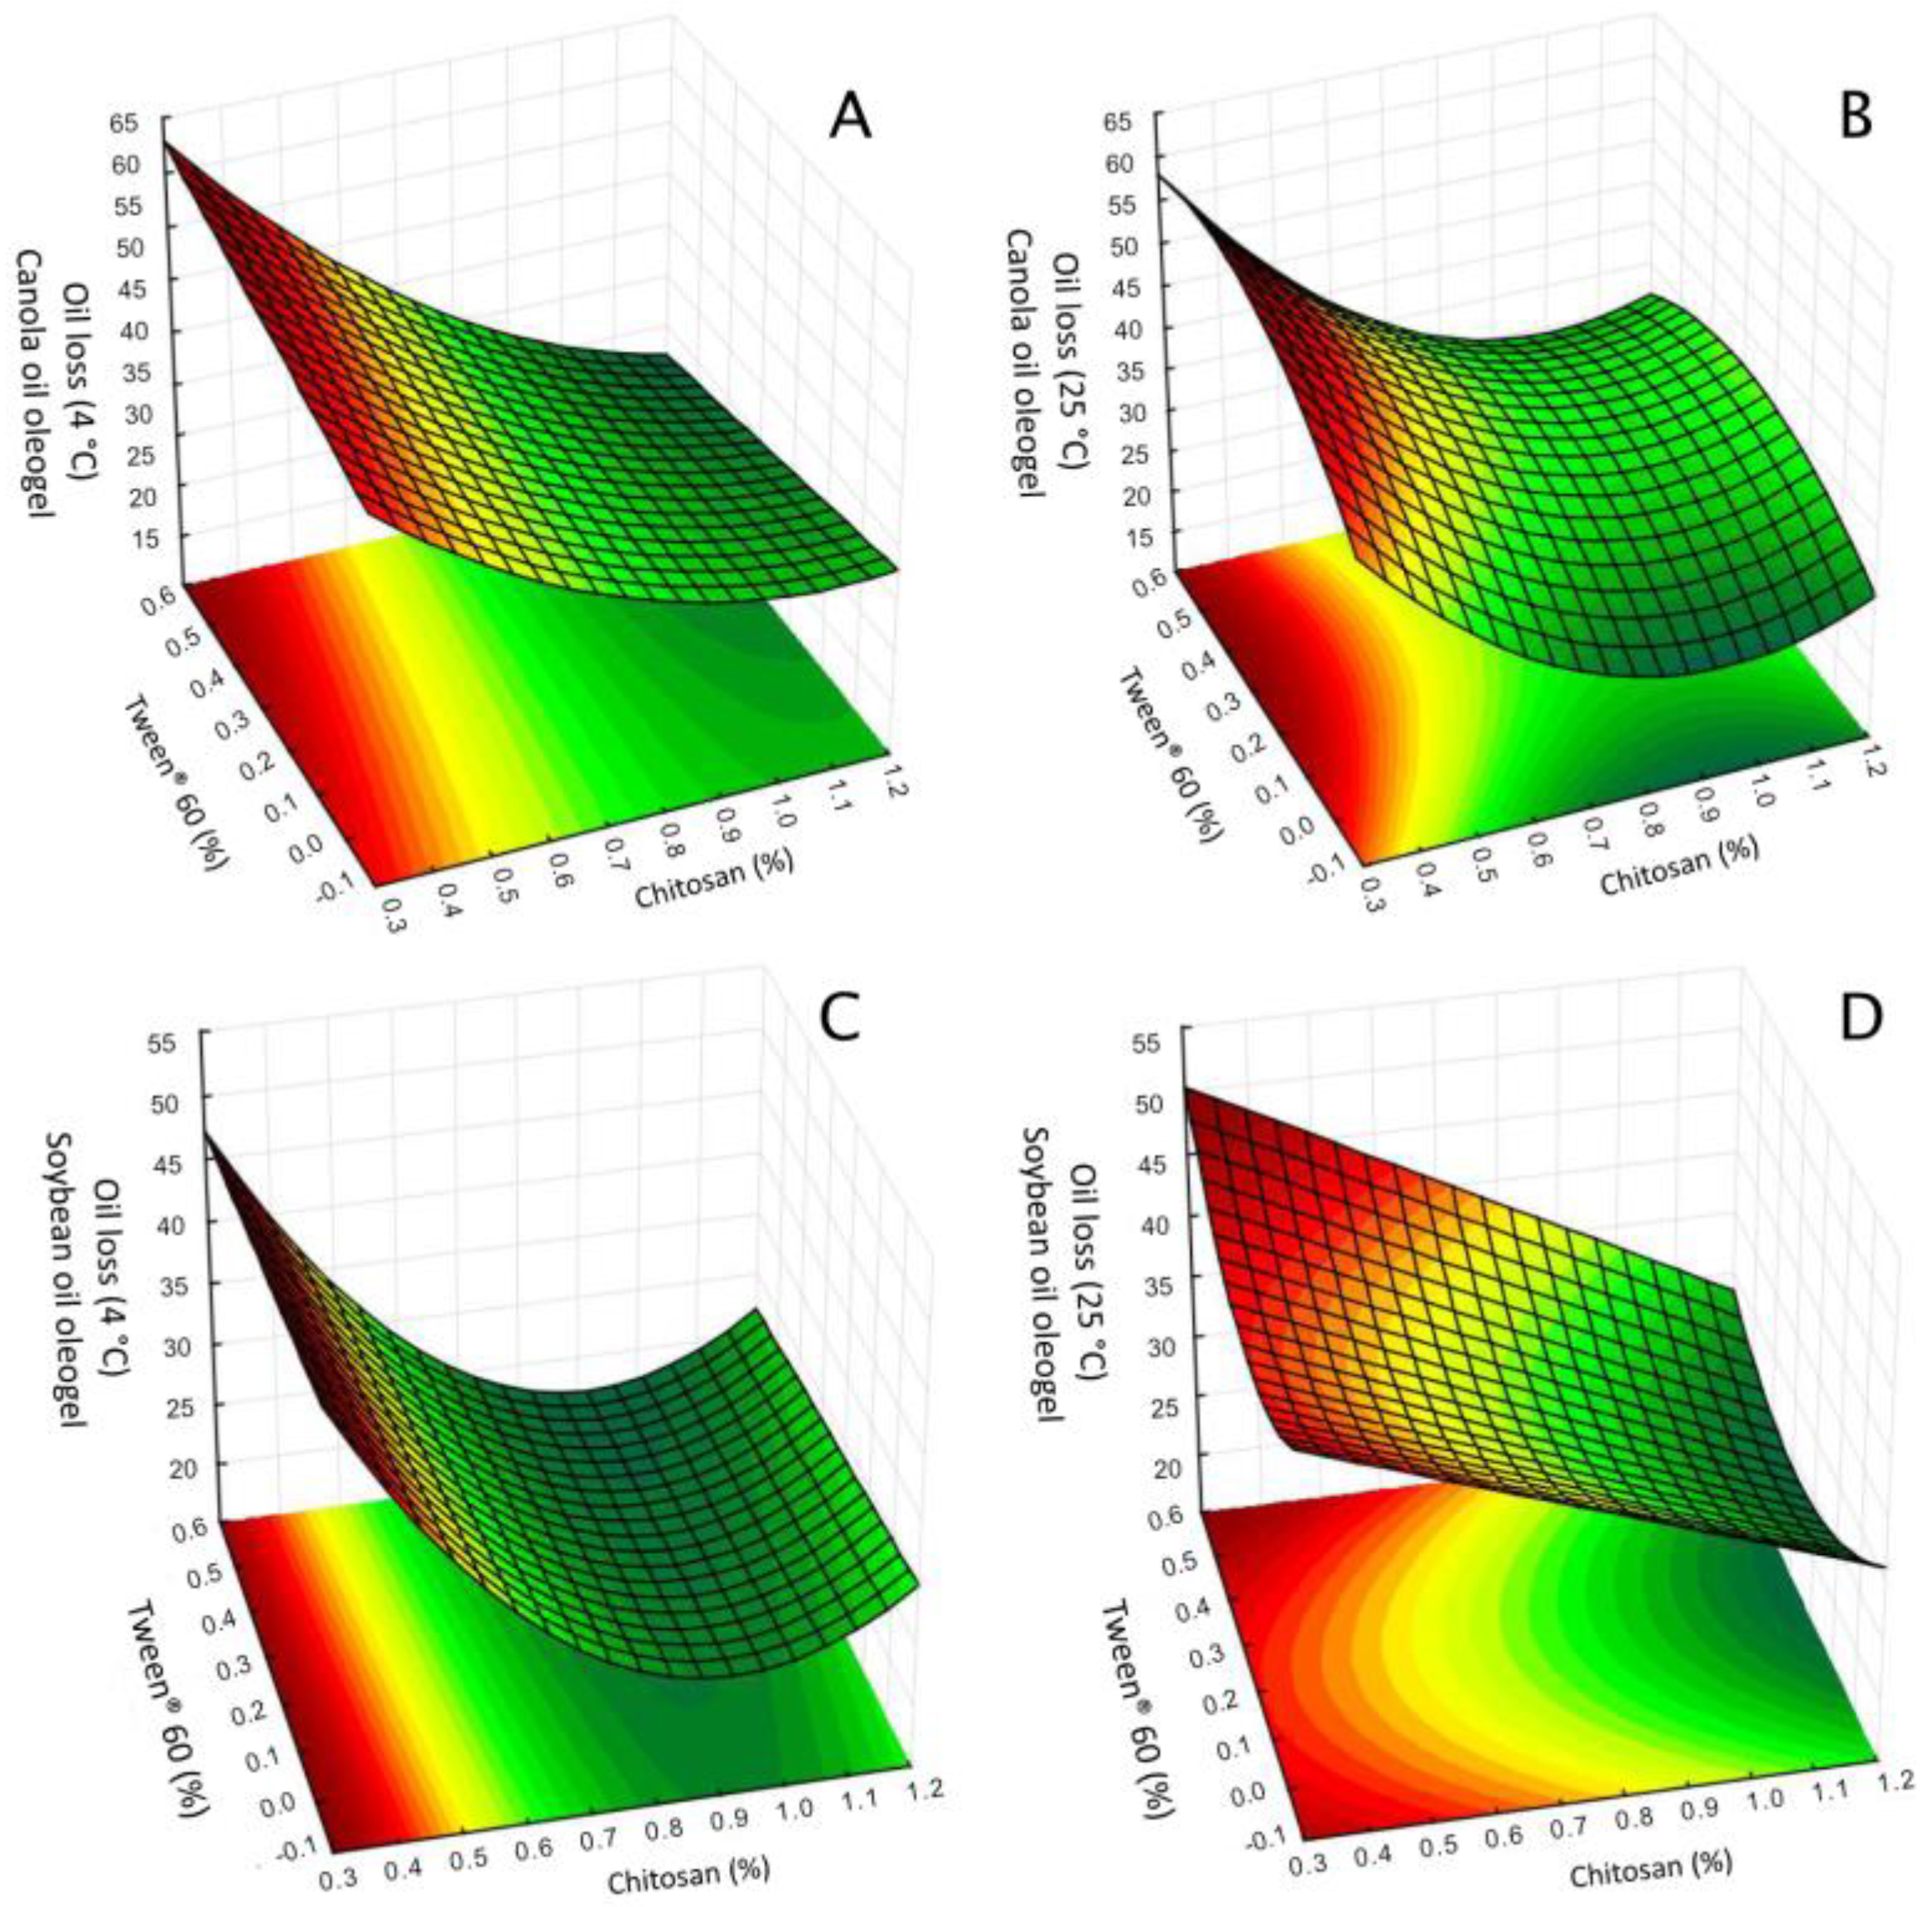
3.1.1. Oil Loss
3.1.2. Hardness
3.1.3. Adhesiveness
3.2. Model Validation and Multiobjective Optimization
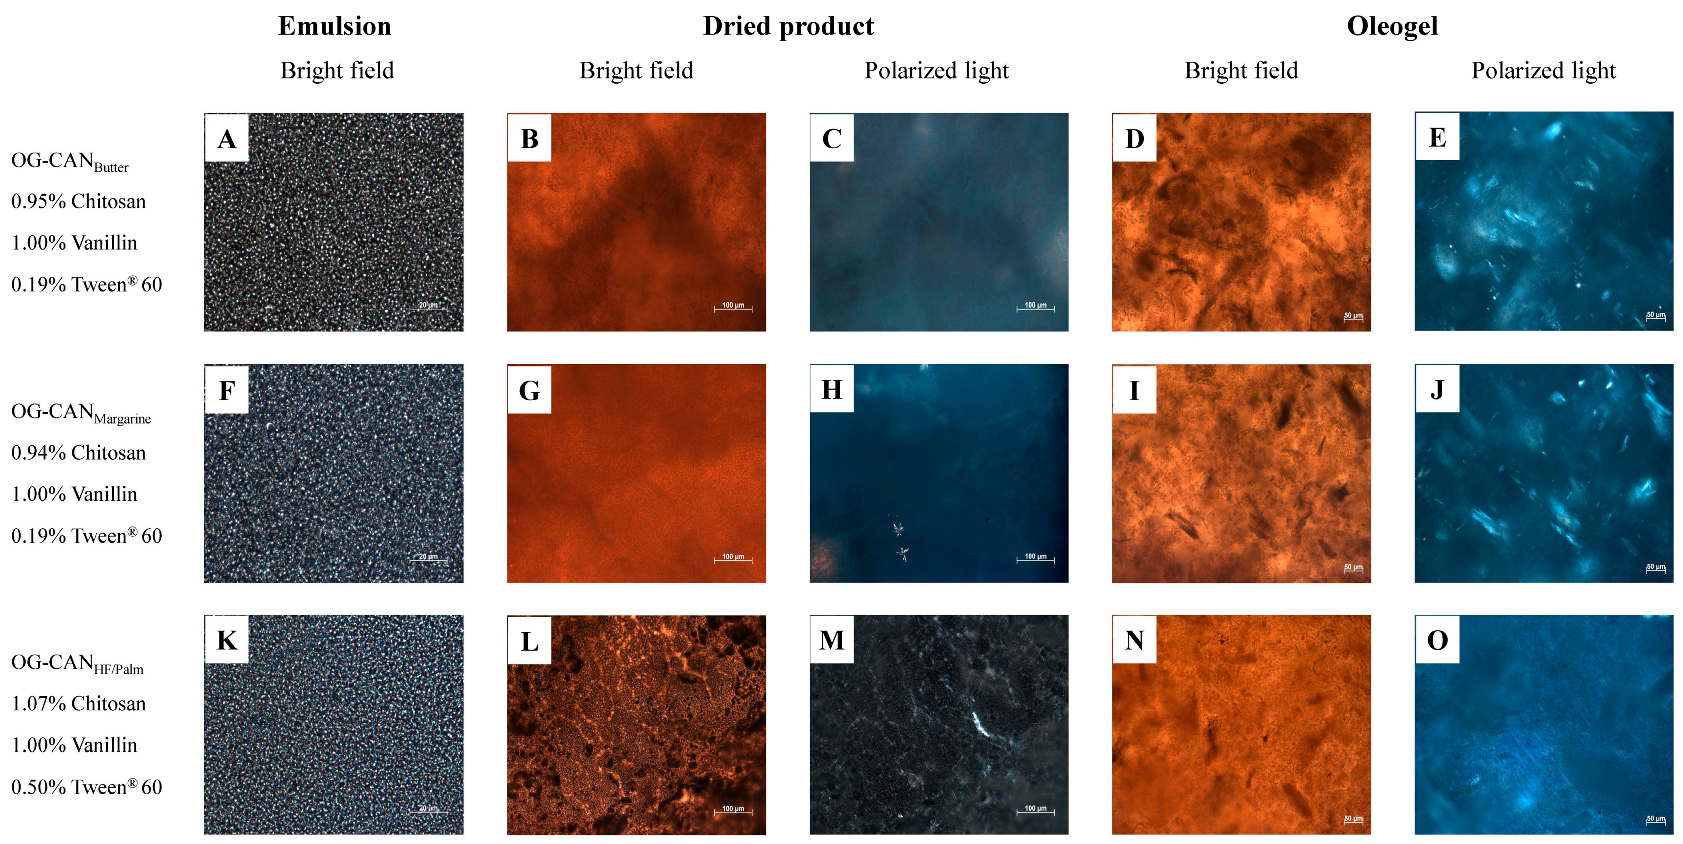
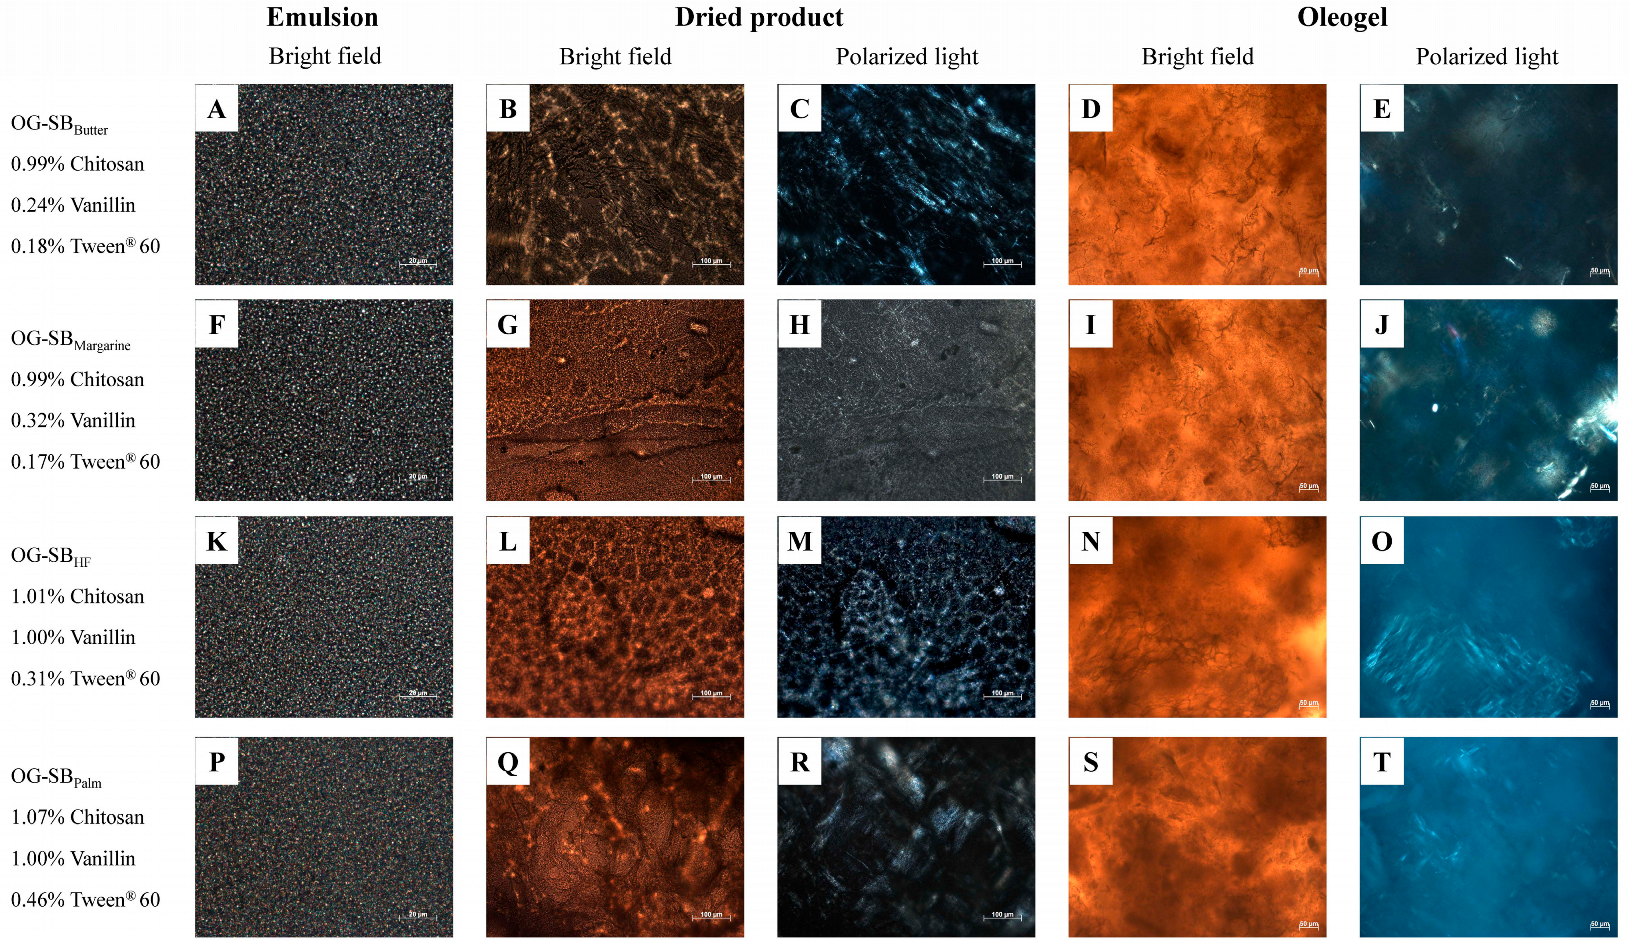
3.3. Microstructure of Optimized Oleogels
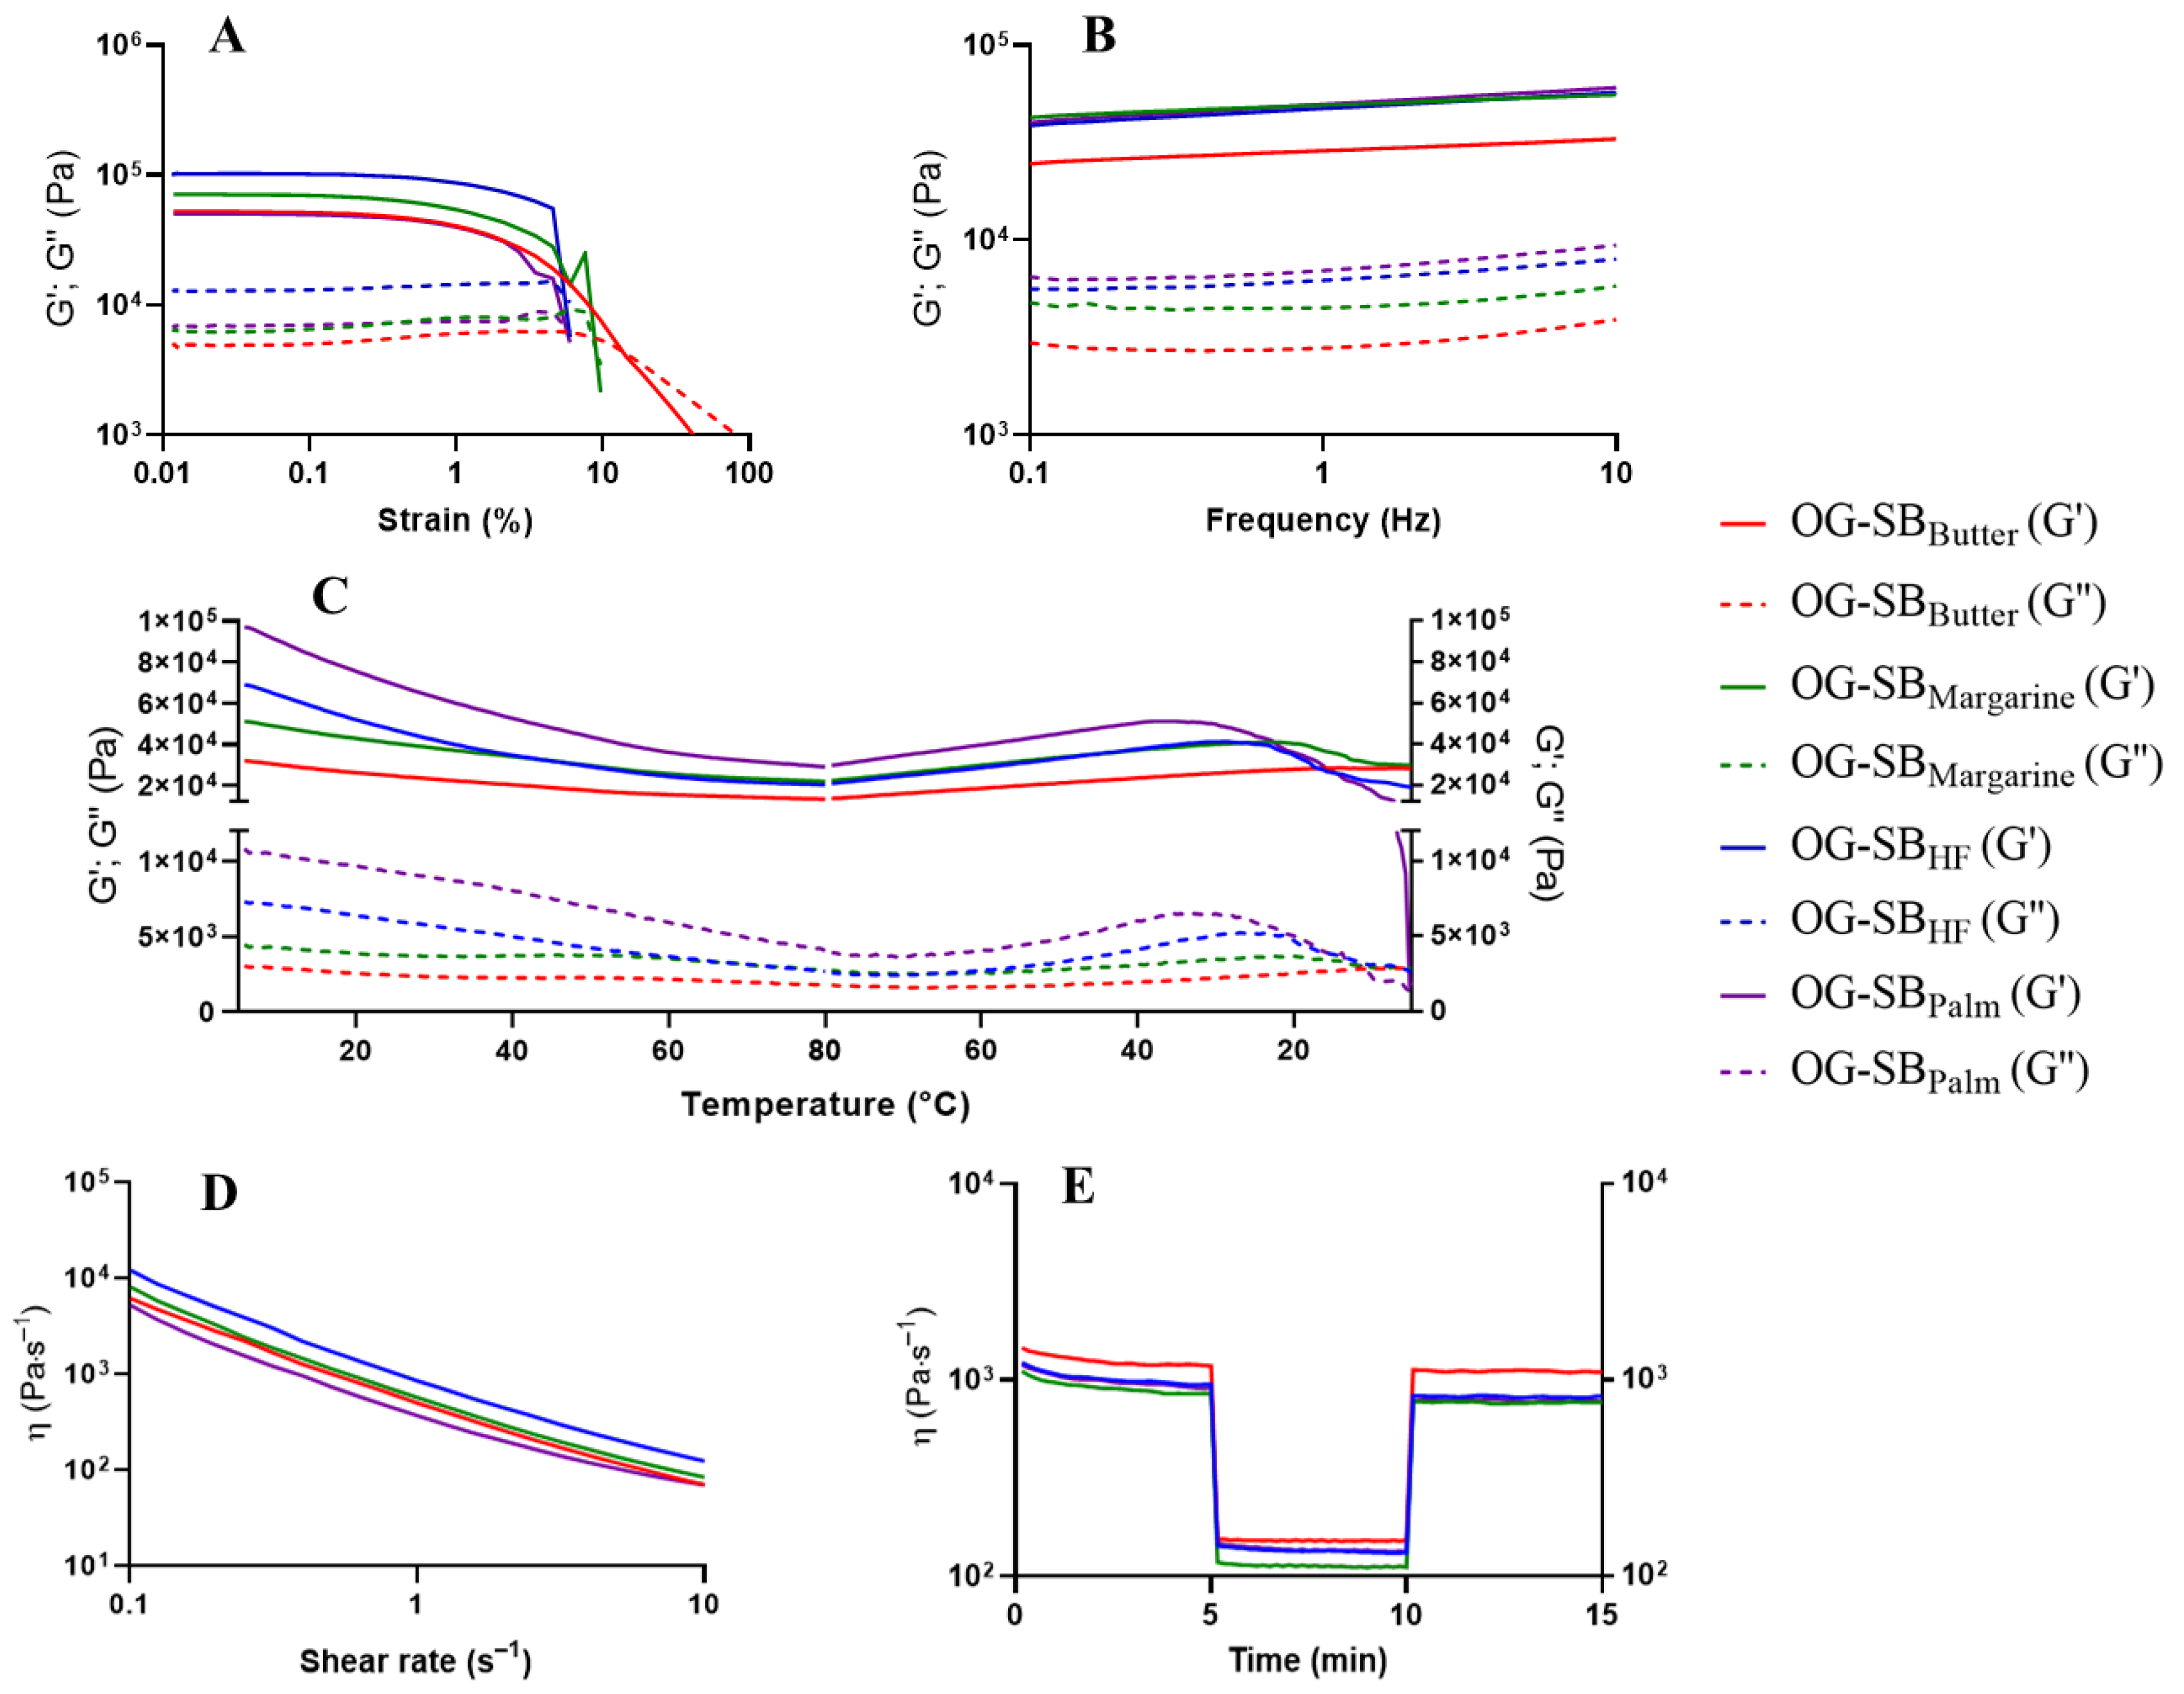
3.4. Rheological Behavior of Optimized Oleogels
3.4.1. Oscillatory Amplitude Strain Sweep Test
3.4.2. Frequency Sweep Test
3.4.3. Temperature Ramp Test
3.4.4. Shear-Thinning Behavior and Structure Recovery Properties
4. Conclusions
Supplementary Materials
Author Contributions
Funding
Institutional Review Board Statement
Data Availability Statement
Conflicts of Interest
References
- Patel, A.R.; Nicholson, R.A.; Marangoni, A.G. Application of fat mimetics for the replacement of saturated and hydrogenated fat in food products. Curr. Opin. Food Sci. 2020, 33, 61–68. [Google Scholar] [CrossRef]
- Pascua, Y.; Koç, H.; Foegeding, E.A. Food structure: Roles of mechanical properties and oral processing in determining sensory texture of soft materials. Colloid. Interface Sci. 2013, 18, 324–333. [Google Scholar] [CrossRef]
- WHO. REPLACE Trans Fat: An Action Package to Eliminate Industrially Produced Trans-Fatty Acids. Module 2: How-to Guide for Determining the Best Replacement Oils and Intervention to Promote Their Use; World Health Organization: Geneva, Switzerland, 2020; Available online: https://apps.who.int/iris/handle/10665/324821 (accessed on 6 July 2022).
- Tan, T.H.; Chan, E.S.; Manja, M.; Tang, T.K.; Phuah, E.T.; Lee, Y.Y. Production, health implications and applications of oleogels as fat replacer in food system: A review. J. Am. Oil Chem. Soc. 2023, 100, 681–697. [Google Scholar] [CrossRef]
- Silva, T.L.T.; Fernandes, D.G.; Arellano, D.B. The combination of monoglycerides, wax and hardfat on oleogels structuration. Braz. J. Food Technol. 2022, 25, e2021137. [Google Scholar] [CrossRef]
- Brito, G.B.; Peixoto, V.O.D.S.; Martins, M.T.; Rosário, D.K.; Ract, J.N.; Conte-Júnior, C.A.; Torres, A.G.; Castelo-Branco, V.N. Development of chitosan-based oleogels via crosslinking with vanillin using an emulsion templated approach: Structural characterization and their application as fat-replacer. Food Struct. 2022, 32, 100264. [Google Scholar] [CrossRef]
- Bascuas, S.; Hernando, I.; Moraga, G.; Quiles, A. Structure and stability of edible oleogels prepared with different unsaturated oils and hydrocolloids. Int. J. Food Sci. Technol. 2020, 55, 1458–1467. [Google Scholar] [CrossRef]
- Aranaz, I.; Alcántara, A.R.; Civera, M.C.; Arias, C.; Elorza, B.; Heras Caballero, A.; Acosta, N. Chitosan: An overview of its properties and applications. Polymers 2021, 13, 3256. [Google Scholar] [CrossRef]
- Zhu, J.; Tian, D.; Chen, X.; Huang, T.; Chen, X. Preparation of Chitosan-phenolic Aldehyde Fragrance Oleogels and Comparative Study of their Structure and Properties. Food Bioprocess Technol. 2024, 17, 4204–4214. [Google Scholar] [CrossRef]
- Miao, W.; McClements, D.J.; Zhang, Z.; Lin, Q.; Ji, H.; Wang, J.; Jim, Z.; Li, G.; Jiang, L.; Wen, J.; et al. Fabrication and characterization of emulsion-template oleogels assembled from octenyl succinic anhydride starch/chitosan electrostatic complexes. Food Hydrocoll. 2024, 151, 109882. [Google Scholar] [CrossRef]
- Farooq, S.; Ahmad, M.I.; Zhang, Y.; Chen, M.; Zhang, H. Preparation, characterization and digestive mechanism of plant-derived oil bodies-based oleogels structure by chitosan and vanillin. Food Hydrocoll. 2023, 136, 108247. [Google Scholar] [CrossRef]
- Farooq, S.; Ahmad, M.I.; Zhang, Y.; Zhang, H. Impact of interfacial layer number and Schiff base cross-linking on the microstructure, rheological properties and digestive lipolysis of plant-derived oil bodies-based oleogels. Food Hydrocoll. 2023, 138, 108473. [Google Scholar] [CrossRef]
- Lama, M.; Montes, L.; Franco, D.; Franco-Uría, A.; Moreira, R. Chitosan-Based Oleogels: Emulsion Drying Kinetics and Physical, Rheological, and Textural Characteristics of Olive Oil Oleogels. Mar. Drugs 2024, 22, 318. [Google Scholar] [CrossRef]
- Silva, T.L.T.; Arellano, D.B.; Martini, S. Interactions between candelilla wax and saturated triacylglycerols in oleogels. Food Res. Int. 2019, 121, 900–909. [Google Scholar] [CrossRef] [PubMed]
- Thakur, D.; Singh, A.; Prabhakar, P.K.; Meghwal, M.; Upadhyay, A. Optimization and characterization of soybean oil-carnauba wax oleogel. LWT 2022, 157, 113108. [Google Scholar] [CrossRef]
- Wang, X.; Wang, S.; Nan, Y.; Liu, G. The effects of oil type and crystallization temperature on the physical property of oleogel loaded-vitamin C prepared by emulsion templated approach. Food Funct. 2020, 11, 8028–8037. [Google Scholar] [CrossRef]
- Meng, Z.; Qi, K.; Guo, Y.; Wang, Y.; Liu, Y. Effects of thickening agents on the formation and properties of edible oleogels based on hydroxypropyl methyl cellulose. Food Chem. 2018, 246, 137–149. [Google Scholar] [CrossRef]
- Castelo-Branco, V.N.; Santana, I.; Di-Sarli, V.O.; Freitas, S.P.; Torres, A.G. Antioxidant capacity is a surrogate measure of the quality and stability of vegetable oils. Eur. J. Lipid Sci. Technol. 2016, 118, 224–235. [Google Scholar] [CrossRef]
- Cerqueira, M.A.; Fasolin, L.H.; Picone, C.S.; Pastrana, L.M.; Cunha, R.L.; Vicente, A.A. Structural and mechanical properties of organogels: Role of oil and gelator molecular structure. Food Res. Int. 2017, 96, 161–170. [Google Scholar] [CrossRef]
- Sivakanthan, S.; Fawzia, S.; Mundree, S.; Madhujith, T.; Karim, A. Investigation of the influence of minor components and fatty acid profile of oil on properties of beeswax and stearic acid-based oleogels. Food Res. Int. 2024, 184, 114213. [Google Scholar] [CrossRef]
- Scharfe, M.; Niksch, J.; Flöter, E. Influence of minor oil components on sunflower, rice bran, candelilla, and beeswax oleogels. Eur. J. Lipid Sci. Technol. 2022, 124, e2100068. [Google Scholar] [CrossRef]
- Giacintucci, V.; Di Mattia, C.D.; Sacchetti, G.; Flamminii, F.; Gravelle, A.J.; Baylis, B.; Dutcher, J.R.; Marangoni, A.G.; Pittia, P. Ethylcellulose oleogels with extra virgin olive oil: The role of oil minor components on microstructure and mechanical strength. Food Hydrocoll. 2018, 84, 508–514. [Google Scholar] [CrossRef]
- Abdolmaleki, K.; Alizadeh, L.; Nayebzadeh, K.; Hosseini, S.M.; Shahin, R. Oleogel production based on binary and ternary mixtures of sodium caseinate, xanthan gum, and guar gum: Optimization of hydrocolloids concentration and drying method. J. Texture Stud. 2020, 51, 290–299. [Google Scholar] [CrossRef]
- Valoppi, F.; Calligaris, S.; Barba, L.; Šegatin, N.; Poklar Ulrih, N.; Nicoli, M.C. Influence of oil type on formation, structure, thermal, and physical properties of monoglyceride-based organogel. Eur. J. Lipid Sci. Technol. 2016, 119, 1500549. [Google Scholar] [CrossRef]
- Laredo, T.; Barbut, S.; Marangoni, A.G. Molecular interactions of polymer oleogelation. Soft Matter 2011, 7, 2734–2743. [Google Scholar] [CrossRef]
- Patel, A.R.; Babaahmadi, M.; Lesaffer, A.; Dewettinck, K. Rheological profiling of organogels prepared at critical gelling concentrations of natural waxes in a triacylglycerol solvent. J. Agric. Food Chem. 2015, 63, 4862–4869. [Google Scholar] [CrossRef]
- Dassanayake, L.S.K.; Kodali, D.R.; Ueno, S.; Sato, K. Crystallization kinetics of organogels prepared by rice bran wax and vegetable oils. J. Oleo Sci. 2012, 61, 1–9. [Google Scholar] [CrossRef]
- Jiang, Z.; Bai, X. Effects of polysaccharide concentrations on the formation and physical properties of emulsion-templated oleogels. Molecules 2022, 27, 5391. [Google Scholar] [CrossRef]
- Espert, M.; Salvador, A.; Sanz, T. Cellulose ether oleogels obtained by emulsion-templated approach without additional thickeners. Food Hydrocoll. 2020, 109, 106085. [Google Scholar] [CrossRef]
- Speranza, A.; Corradini, M.G.; Hartman, T.G.; Ribnicky, D.; Oren, A.; Rogers, M.A. Influence of emulsifier structure on lipid bioaccessibility in oil–water nanoemulsions. J. Agric. Food Chem. 2013, 61, 6505–6515. [Google Scholar] [CrossRef]
- Vershkov, B.; Davidovich-Pinhas, M. The effect of preparation temperature and composition on bigel performance as fat replacers. Food Funct. 2023, 14, 3838–3848. [Google Scholar] [CrossRef]
- Palla, C.; Giacomozzi, A.; Genovese, D.B.; Carrín, M.E. Multi-objective optimization of high oleic sunflower oil and monoglycerides oleogels: Searching for rheological and textural properties similar to margarine. Food Struct. 2017, 14, 17–25. [Google Scholar] [CrossRef]
- Pandolsook, S.; Kupongsak, S. Influence of bleached rice bran wax on the physicochemical properties of organogels and water-in-oil emulsions. J. Food Eng. 2017, 214, 182–192. [Google Scholar] [CrossRef]
- Öǧütcü, M.; Yılmaz, E. Oleogels of virgin olive oil with carnauba wax and monoglyceride as spreadable products. Grasas y Aceites 2014, 65, e040. [Google Scholar] [CrossRef]
- Tanislav, A.E.; Puscas, A.; Paucean, A.; Muresan, A.E.; Semeniuc, C.A.; Muresan, V.; Mudura, E. Evaluation of structural behavior in the process dynamics of oleogel-based tender dough products. Gels 2022, 8, 317. [Google Scholar] [CrossRef]
- Gioielli, L.A.; Simões, I.S.; Rodrigues, J.N. Crystal morphology and interactions of binary and ternary mixtures of hydrogenated fats. J. Food Eng. 2003, 57, 347–355. [Google Scholar] [CrossRef]
- Li, Y.; Wu, C.; Wu, T.; Wang, L.; Chen, S.; Ding, T.; Hu, Y. Preparation and characterization of citrus essential oils loaded in chitosan microcapsules by using different emulsifiers. J. Food Eng. 2018, 217, 108–114. [Google Scholar] [CrossRef]
- Liu, H.; Lu, Y.; Zhang, J. A comprehensive investigation of the viscoelasticity and time-dependent yielding transition of waxy crude oils. J. Rheol. 2018, 62, 527–541. [Google Scholar] [CrossRef]
- Svärd, M.; Gracin, S.; Rasmuson, Å.C. Oiling out or molten hydrate—Liquid–liquid phase separation in the system vanillin–water. J. Pharm. Sci. 2007, 96, 2283–2295. [Google Scholar] [CrossRef]


| Runs 1 | Independent Variables | |||||
|---|---|---|---|---|---|---|
| Chitosan | Vanillin | Tween® 60 | ||||
| 1 | −1 | 0.42% | −1 | 0.05% | −1 | 0.00% |
| 2 | −1 | 0.42% | −1 | 0.05% | +1 | 0.50% |
| 3 | −1 | 0.42% | +1 | 1.00% | −1 | 0.00% |
| 4 | −1 | 0.42% | +1 | 1.00% | +1 | 0.50% |
| 5 | +1 | 1.07% | −1 | 0.05% | −1 | 0.00% |
| 6 | +1 | 1.07% | −1 | 0.05% | +1 | 0.50% |
| 7 | +1 | 1.07% | +1 | 1.00% | −1 | 0.00% |
| 8 | +1 | 1.07% | +1 | 1.00% | +1 | 0.50% |
| 9 | −1 | 0.42% | 0 | 0.52% | 0 | 0.25% |
| 10 | +1 | 1.07% | 0 | 0.52% | 0 | 0.25% |
| 11 | 0 | 0.75% | −1 | 0.05% | 0 | 0.25% |
| 12 | 0 | 0.75% | +1 | 1.00% | 0 | 0.25% |
| 13 | 0 | 0.75% | 0 | 0.52% | −1 | 0.00% |
| 14 | 0 | 0.75% | 0 | 0.52% | +1 | 0.50% |
| 15 (C) 2 | 0 | 0.75% | 0 | 0.52% | 0 | 0.25% |
| 16 (C) 2 | 0 | 0.75% | 0 | 0.52% | 0 | 0.25% |
| 17 (C) 2 | 0 | 0.75% | 0 | 0.52% | 0 | 0.25% |
| Runs | Independent Variables | Oil Loss (%) 1 | |||||
|---|---|---|---|---|---|---|---|
| Chitosan (%) | Vanillin (%) | Tween® 60 (%) | 4 °C | 25 °C | |||
| Canola | Soybean | Canola | Soybean | ||||
| 1 | 0.42 | 0.05 | 0.00 | 37.9 ± 3.58 | 39.0 ± 1.34 | 44.0 ± 0.00 | 43.3 ± 1.71 |
| 2 | 0.42 | 0.05 | 0.50 | 38.5 ± 0.38 | 37.7 ± 1.96 | 48.7 ± 0.58 | 42.5 ± 2.05 |
| 3 | 0.42 | 1.00 | 0.00 | 30.6 ± 0.65 | 38.5 ± 0.69 | 39.4 ± 0.83 | 40.4 ± 0.61 |
| 4 | 0.42 | 1.00 | 0.50 | 37.7 ± 0.72 | 40.9 ± 2.04 | 53.0 ± 0.23 | 48.3 ± 2.14 |
| 5 | 1.07 | 0.05 | 0.00 | 22.0 ± 0.97 | 28.1 ± 1.41 | 26.4 ± 1.62 | 30.2 ± 0.71 |
| 6 | 1.07 | 0.05 | 0.50 | 21.2 ± 1.78 | 24.0 ± 0.64 | 36.0 ± 2.17 | 30.9 ± 0.04 |
| 7 | 1.07 | 1.00 | 0.00 | 22.6 ± 0.41 | 26.7 ± 1.18 | 30.3 ± 1.75 | 30.3 ± 0.66 |
| 8 | 1.07 | 1.00 | 0.50 | 16.8 ± 1.86 | 22.1 ± 0.27 | 30.8 ± 2.63 | 29.6 ± 1.07 |
| 9 | 0.42 | 0.52 | 0.25 | 42.7 ± 1.16 | 41.0 ± 0.88 | 50.2 ± 1.35 | 43.1 ± 2.58 |
| 10 | 1.07 | 0.52 | 0.25 | 18.7 ± 0.08 | 23.5 ± 2.09 | 29.3 ± 1.69 | 29.9 ± 0.66 |
| 11 | 0.75 | 0.05 | 0.25 | 26.0 ± 1.00 | 29.1 ± 0.19 | 37.6 ± 0.12 | 35.7 ± 1.33 |
| 12 | 0.75 | 1.00 | 0.25 | 28.7 ± 1.91 | 24.8 ± 1.81 | 34.7 ± 0.82 | 30.8 ± 0.88 |
| 13 | 0.75 | 0.52 | 0.00 | 22.0 ± 0.82 | 26.8 ± 2.22 | 30.3 ± 1.22 | 34.5 ± 0.80 |
| 14 | 0.75 | 0.52 | 0.50 | 25.4 ± 0.51 | 24.9 ± 1.12 | 30.5 ± 1.29 | 30.7 ± 0.04 |
| 15 | 0.75 | 0.52 | 0.25 | 24.3 ± 0.87 | 23.1 ± 1.71 | 35.3 ± 3.05 | 30.3 ± 2.36 |
| 16 | 0.75 | 0.52 | 0.25 | 30.0 ± 2.38 | 25.2 ± 2.31 | 35.2 ± 0.75 | 31.0 ± 0.12 |
| 17 | 0.75 | 0.52 | 0.25 | 28.7 ± 1.99 | 22.6 ± 0.04 | 37.5 ± 0.29 | 31.0 ± 0.40 |
| Mean | 27.9 | 29.3 | 37.0 | 34.8 | |||
| Variables | Oil Loss | |||
|---|---|---|---|---|
| 4 °C | 25 °C | |||
| Oleogels Containing Canola Oil | Effect | p-Value | Effect | p-Value |
| Chitosan (L) | −17.2 | 0.0000 | −16.5 | 0.0000 |
| Chitosan (Q) | 7.96 | 0.0001 | 10.8 | 0.0000 |
| Vanillin (Q) | - | - | 3.68 | 0.0111 |
| Tween® 60 (L) | - | - | 5.74 | 0.0000 |
| Tween® 60 (Q) | −6.05 | 0.0014 | −7.78 | 0.0000 |
| Chitosan (L) x Tween® 60 (L) | −3.58 | 0.0019 | −2.04 | 0.0144 |
| R2 | 0.88 | 0.89 | ||
| R2 adjusted | 0.86 | 0.87 | ||
| p-value of model | 0.0000 | 0.0000 | ||
| Oleogels containing soybean oil | Effect | p-value | Effect | p-value |
| Chitosan (L) | −14.5 | 0.0000 | −13.3 | 0.0000 |
| Chitosan (Q) | 13.9 | 0.0000 | 9.74 | 0.0000 |
| Tween® 60 (L) | −1.88 | 0.0129 | - | - |
| Chitosan (L) × Tween® 60 (L) | −2.47 | 0.0044 | −1.74 | 0.0130 |
| Vanillin (L) × Tween® 60 (L) | - | - | 1.80 | 0.0105 |
| R2 | 0.93 | 0.90 | ||
| R2 adjusted | 0.92 | 0.88 | ||
| p-value of model | 0.0000 | 0.0000 | ||
| Runs | Independent Variables | Hardness (N) | |||||
|---|---|---|---|---|---|---|---|
| Chitosan (%) | Vanillin (%) | Tween® 60 (%) | 4 °C | 25 °C | |||
| Canola | Soybean | Canola | Soybean | ||||
| 1 | 0.42 | 0.05 | 0.00 | 4.31 ± 0.01 | 4.81 ± 0.26 | 4.16 ± 0.00 | 4.67 ± 0.12 |
| 2 | 0.42 | 0.05 | 0.50 | 6.44 ± 0.42 | 10.4 ± 0.81 | 2.94 ± 0.46 | 7.19 ± 0.44 |
| 3 | 0.42 | 1.00 | 0.00 | 6.92 ± 0.23 | 7.48 ± 0.88 | 6.38 ± 1.09 | 6.59 ± 0.54 |
| 4 | 0.42 | 1.00 | 0.50 | 5.63 ± 0.01 | 8.29 ± 1.06 | 3.37 ± 0.05 | 7.15 ± 0.64 |
| 5 | 1.07 | 0.05 | 0.00 | 14.4 ± 0.51 | 17.9 ± 2.19 | 11.2 ± 1.36 | 16.9 ± 1.59 |
| 6 | 1.07 | 0.05 | 0.50 | 19.7 ± 0.23 | 26.4 ± 5.37 | 14.3 ± 0.27 | 29.7 ± 1.58 |
| 7 | 1.07 | 1.00 | 0.00 | 22.7 ± 0.78 | 15.5 ± 0.66 | 10.6 ± 0.05 | 19.0 ± 0.10 |
| 8 | 1.07 | 1.00 | 0.50 | 26.7 ± 0.20 | 37.8 ± 1.47 | 25.6 ± 3.53 | 35.5 ± 2.35 |
| 9 | 0.42 | 0.52 | 0.25 | 5.22 ± 0.21 | 5.88 ± 0.09 | 3.71 ± 0.18 | 6.93 ± 0.64 |
| 10 | 1.07 | 0.52 | 0.25 | 27.8 ± 0.82 | 25.2 ± 0.28 | 16.6 ± 2.34 | 24.5 ± 2.28 |
| 11 | 0.75 | 0.05 | 0.25 | 13.4 ± 0.40 | 14.4 ± 0.57 | 8.02 ± 1.57 | 12.1 ± 1.16 |
| 12 | 0.75 | 1.00 | 0.25 | 16.7 ± 1.33 | 21.2 ± 1.53 | 11.1 ± 0.11 | 18.8 ± 0.75 |
| 13 | 0.75 | 0.52 | 0.00 | 11.3 ± 0.28 | 7.39 ± 0.24 | 9.70 ± 0.85 | 6.03 ± 0.02 |
| 14 | 0.75 | 0.52 | 0.50 | 16.2 ± 2.00 | 23.9 ± 2.40 | 11.4 ± 0.02 | 18.7 ± 0.91 |
| 15 | 0.75 | 0.52 | 0.25 | 13.3 ± 0.76 | 20.8 ± 1.62 | 9.20 ± 0.85 | 16.0 ± 0.39 |
| 16 | 0.75 | 0.52 | 0.25 | 13.2 ± 0.16 | 18.4 ± 1.22 | 10.7 ± 0.71 | 16.2 ± 0.73 |
| 17 | 0.75 | 0.52 | 0.25 | 10.9 ± 0.89 | 18.1 ± 0.42 | 9.68 ± 1.00 | 14.8 ± 1.00 |
| Mean | 13.8 | 16.7 | 9.92 | 15.3 | |||
| Variables | Hardness | |||
|---|---|---|---|---|
| 4 °C | 25 °C | |||
| Oleogel containing canola oil | Effect | p-value | Effect | p-value |
| Chitosan (L) | 16.6 | 0.0000 | 11.5 | 0.0000 |
| Chitosan (Q) | 2.39 | 0.0057 | - | - |
| Vanillin (L) | 4.08 | 0.0000 | 3.27 | 0.0000 |
| Vanillin (Q) | - | - | - | - |
| Tween® 60 (L) | 2.99 | 0.0000 | 3.12 | 0.0000 |
| Tween® 60 (Q) | −3.12 | 0.0006 | - | - |
| Chitosan (L) × Vanillin (L) | 3.37 | 0.0000 | 2.00 | 0.0043 |
| Chitosan (L) × Tween® 60 (L) | 2.08 | 0.0003 | 5.58 | 0.0000 |
| Vanillin (L) × Tween® 60 (L) | −1.18 | 0.0216 | 2.54 | 0.0006 |
| R2 | 0.94 | 0.92 | ||
| R2 adjusted | 0.92 | 0.90 | ||
| p-value of model | 0.0000 | 0.0000 | ||
| Runs | Independent Variables | Adhesiveness (N·s−1) | |||||
|---|---|---|---|---|---|---|---|
| Chitosan (%) | Vanillin (%) | Tween® 60 (%) | 4 °C | 25 °C | |||
| Canola | Soybean | Canola | Soybean | ||||
| 1 | 0.42 | 0.05 | 0.00 | 2.87 ± 0.14 | 3.02 ± 0.16 | 2.68 ± 0.15 | 3.48 ± 1.10 |
| 2 | 0.42 | 0.05 | 0.50 | 5.12 ± 0.26 | 5.56 ± 0.46 | 1.98 ± 0.14 | 4.48 ± 0.97 |
| 3 | 0.42 | 1.00 | 0.00 | 3.96 ± 0.11 | 4.66 ± 0.34 | 3.46 ± 0.00 | 4.85 ± 1.95 |
| 4 | 0.42 | 1.00 | 0.50 | 3.34 ± 0.20 | 4.50 ± 0.61 | 2.26 ± 0.25 | 5.11 ± 0.18 |
| 5 | 1.07 | 0.05 | 0.00 | 6.28 ± 0.37 | 7.41 ± 0.85 | 4.02 ± 0.51 | 5.04 ± 1.12 |
| 6 | 1.07 | 0.05 | 0.50 | 9.99 ± 0.49 | 8.36 ± 0.18 | 7.68 ± 0.05 | 10.4 ± 2.60 |
| 7 | 1.07 | 1.00 | 0.00 | 9.24 ± 0.08 | 5.86 ± 0.40 | 5.65 ± 0.41 | 8.01 ± 0.00 |
| 8 | 1.07 | 1.00 | 0.50 | 11.5 ± 0.68 | 10.0 ± 0.02 | 10.8 ± 1.44 | 10.8 ± 1.15 |
| 9 | 0.42 | 0.52 | 0.25 | 3.25 ± 0.02 | 4.84 ± 0.48 | 2.47 ± 0.03 | 4.82 ± 0.39 |
| 10 | 1.07 | 0.52 | 0.25 | 9.86 ± 0.05 | 8.60 ± 0.22 | 8.08 ± 0.84 | 7.79 ± 0.60 |
| 11 | 0.75 | 0.05 | 0.25 | 8.20 ± 0.47 | 7.76 ± 0.81 | 5.14 ± 0.05 | 6.54 ± 1.29 |
| 12 | 0.75 | 1.00 | 0.25 | 9.08 ± 0.59 | 8.66 ± 0.50 | 6.55 ± 0.62 | 8.68 ± 0.12 |
| 13 | 0.75 | 0.52 | 0.00 | 5.10 ± 0.28 | 6.63 ± 0.17 | 3.69 ± 0.12 | 2.70 ± 0.30 |
| 14 | 0.75 | 0.52 | 0.50 | 9.65 ± 1.44 | 12.2 ± 1.76 | 7.34 ± 0.75 | 8.26 ± 0.77 |
| 15 | 0.75 | 0.52 | 0.25 | 6.72 ± 0.40 | 8.49 ± 0.73 | 6.68 ± 0.19 | 10.4 ± 0.31 |
| 16 | 0.75 | 0.52 | 0.25 | 7.61 ± 0.10 | 6.39 ± 0.45 | 6.51 ± 0.38 | 8.57 ± 1.23 |
| 17 | 0.75 | 0.52 | 0.25 | 6.76 ± 0.56 | 7.55 ± 0.40 | 7.74 ± 0.30 | 7.16 ± 0.21 |
| Mean | 7.00 | 7.10 | 5.45 | 6.90 | |||
| Variables | Adhesiveness | |||
|---|---|---|---|---|
| 4 °C | 25 °C | |||
| Oleogel containing canola oil | Effect | p-value | Effect | p-value |
| Chitosan (L) | 5.67 | 0.0000 | 4.67 | 0.0000 |
| Chitosan (Q) | −2.80 | 0.0000 | −1.92 | 0.0006 |
| Vanillin (L) | 0.94 | 0.0007 | 1.44 | 0.0000 |
| Vanillin (Q) | 1.38 | 0.0043 | - | - |
| Tween® 60 (L) | 2.44 | 0.0000 | 2.11 | 0.0000 |
| Tween® 60 (Q) | - | - | −1.43 | 0.0065 |
| Chitosan (L) × Vanillin (L) | 1.30 | 0.0001 | 0.91 | 0.0050 |
| Chitosan (L) × Tween® 60 (L) | 1.09 | 0.0005 | 2.67 | 0.0000 |
| Vanillin (L) × Tween® 60 (L) | −1.07 | 0.0006 | - | - |
| R2 | 0.93 | 0.93 | ||
| R2 adjusted | 0.91 | 0.91 | ||
| p-value of model | 0.0000 | 0.0000 | ||
| Targeted Solid Fat | Butter | Margarine | Partially Hydrogenated Fat | Palm Fat | ||
|---|---|---|---|---|---|---|
| Brand #1 | Brand #2 | Brand #1 | Brand #2 | |||
| Optimized formulation | 0.99% Chitosan 0.24% Vanillin 0.18% Tween | 0.99% Chitosan 0.32% Vanillin 0.17% Tween | 1.07% Chitosan 1.00% Vanillin 0.50% Tween | 1.01% Chitosan 1.00% Vanillin 0.31% Tween | 1.07% Chitosan 1.00% Vanillin 0.50% Tween | 1.07% Chitosan 1.00% Vanillin 0.46% Tween |
| Oil loss (%) | ||||||
| Target 1 | 28.7 | 28.7 | 28.7 | 28.7 | 28.7 | 28.7 |
| Predicted | 28.6 ± 1.27 | 28.7 ± 1.21 | 28.5 ± 1.93 | 27.5 ± 1.46 | 28.5 ± 1.93 | 27.8 ± 1.73 |
| Observed | 30.6 ± 0.59 | 31.1 ± 0.07 | 29.6 ± 1.07 | 27.5 ± 2.00 | 29.6 ± 1.07 | 26.7 ± 0.48 |
| RSE (%) | +6.8 | +8.5 | +3.7 | −0.2 | +3.7 | +3.8 |
| Hardness (N) | ||||||
| Target 2 | 10.8 | 11.0 | 34.7 | 26.4 | 60.0 | 30.7 |
| Predicted | 19.7 ± 1.12 | 19.7 ± 1.07 | 33.9 ± 1.70 | 26.4 ± 1.29 | 33.9 ± 1.70 | 32.8 ± 1.52 |
| Observed | 20.1 ± 0.37 | 19.5 ± 1.37 | 35.5 ± 2.35 | 31.0 ± 4.53 | 35.5 ± 2.35 | 30.6 ± 6.30 |
| RSE (%) | +2.2 | −0.9 | +4.7 | +17.5 | +4.7 | −6.7 |
| Adhesiveness (N·s−1) | ||||||
| Target 2 | 8.03 | 8.05 | 26.8 | 14.2 | 37.8 | 19.6 |
| Predicted | 8.03 ± 1.25 | 8.05 ± 1.20 | 11.3 ± 1.91 | 10.4 ± 1.45 | 11.3 ± 1.91 | 11.4 ± 1.71 |
| Observed | 10.1 ± 1.55 | 9.35 ± 0.62 | 10.8 ± 1.15 | 11.9 ± 1.24 | 10.8 ± 1.15 | 13.0 ± 0.99 |
| RSE (%) | +25.7 | +16.1 | −4.8 | +14.0 | −4.8 | +14.3 |
| Global desirability | 0.94 | 0.94 | 0.83 | 0.89 | 0.72 | 0.87 |
| Targeted Solid Fat | Butter | Margarine | Partially Hydrogenated Fat | Palm Fat | ||
|---|---|---|---|---|---|---|
| Brand #1 | Brand #2 | Brand #1 | Brand #2 | |||
| Optimized formulation | 0.95% Chitosan 1.00% Vanillin 0.19% Tween | 0.94% Chitosan 1.00% Vanillin 0.19% Tween | 1.07% Chitosan 1.00% Vanillin 0.50% Tween | 1.07% Chitosan 1.00% Vanillin 0.50% Tween | 1.07% Chitosan 1.00% Vanillin 0.50% Tween | 1.07% Chitosan 1.00% Vanillin 0.50% Tween |
| Oil loss (%) | ||||||
| Target 1 | 25.2 | 25.2 | 25.2 | 25.2 | 25.2 | 25.2 |
| Predicted | 31.3 ± 1.81 | 31.4 ± 1.79 | 31.2 ± 2.59 | 31.2 ± 2.59 | 31.2 ± 2.59 | 31.2 ± 2.59 |
| Observed | 30.9 ± 0.41 | 30.6 ± 0.85 | 30.8 ± 2.63 | 30.8 ± 2.63 | 30.8 ± 2.63 | 30.8 ± 2.63 |
| RSE (%) | −1.3 | −2.6 | +1.2 | +1.2 | +1.2 | +1.2 |
| Hardness (N) | ||||||
| Target 2 | 10.8 | 11.0 | 34.7 | 26.4 | 60.0 | 30.7 |
| Predicted | 14.9 ± 1.47 | 14.8 ± 1.46 | 22.7 ± 2.10 | 22.7 ± 2.10 | 22.7 ± 2.10 | 22.7 ± 2.10 |
| Observed | 16.2 ± 1.59 | 14.7 ± 4.91 | 25.6 ± 3.53 | 25.6 ± 3.53 | 25.6 ± 3.53 | 25.6 ± 3.53 |
| RSE (%) | +8.8 | −0.2 | +12.9 | +12.9 | +12.9 | +12.9 |
| Adhesiveness (N·s−1) | ||||||
| Target 2 | 8.03 | 8.05 | 26.8 | 14.2 | 37.8 | 19.6 |
| Predicted | 8.03 ± 0.69 | 8.05 ± 0.68 | 10.7 ± 0.98 | 10.7 ± 0.98 | 10.7 ± 0.98 | 10.7 ± 0.98 |
| Observed | 8.73 ± 0.20 | 7.03 ± 0.34 | 10.8 ± 1.44 | 10.8 ± 1.44 | 10.8 ± 1.44 | 10.8 ± 1.44 |
| RSE (%) | +8.8 | −12.6 | +1.3 | +1.3 | +1.3 | +1.3 |
| Global desirability | 0.88 | 0.88 | 0.68 | 0.79 | 0.63 | 0.72 |
| Optimized Formulations | Linear Viscoelastic Region | Crossover Point | ||||
|---|---|---|---|---|---|---|
| G′ (Pa) | G″ (Pa) | σcritical (Pa) | γcritical (%) | Yield σ (Pa) | Yield γ (%) | |
| Canola oil oleogels | ||||||
| OG-CANButter (0.95% chitosan, 1.00% vanillin, 0.19% Tween) | 7481.8 | 951.5 | 17.9 | 0.251 | 197.3 | 18.7 |
| OG-CANMargarine (0.94% chitosan, 1.00% vanillin, 0.19% Tween) | 2790.0 | 364.9 | 6.7 | 0.252 | 85.0 | 26.3 |
| OG-CANHF/Palm (1.07% chitosan, 1.00% vanillin, 0.50% Tween) | 22,537.7 | 2738.9 | 33.2 | 0.156 | 221.7 | 8.8 |
| Soybean oil oleogels | ||||||
| OG-SBButter (0.99% chitosan, 0.24% vanillin, 0.18% Tween) | 52,571.1 | 4922.7 | 119.4 | 0.238 | 841.2 | 13.6 |
| OG-SBMargarine (0.99% chitosan, 0.32% vanillin, 0.17% Tween) | 70,921.9 | 6284.5 | 157.2 | 0.234 | 1326.7 | 15.0 |
| OG-SBHF (1.01% chitosan, 1.00% vanillin, 0.31% Tween) | 102,712.6 | 12,872.0 | 351.3 | 0.357 | 2356.2 | 11.9 |
| OG-SBPalm (1.07% chitosan, 1.00% vanillin, 0.46% Tween) | 50,298.7 | 6912.1 | 144.3 | 0.301 | 764.7 | 7.8 |
Disclaimer/Publisher’s Note: The statements, opinions and data contained in all publications are solely those of the individual author(s) and contributor(s) and not of MDPI and/or the editor(s). MDPI and/or the editor(s) disclaim responsibility for any injury to people or property resulting from any ideas, methods, instructions or products referred to in the content. |
© 2025 by the authors. Licensee MDPI, Basel, Switzerland. This article is an open access article distributed under the terms and conditions of the Creative Commons Attribution (CC BY) license (https://creativecommons.org/licenses/by/4.0/).
Share and Cite
Brito, G.B.; Pinho-Jr, J.d.S.; Guimarães, A.d.S.; Conte-Júnior, C.A.; Nele, M.; Perrone, D.; Castelo-Branco, V.N. Optimization and Characterization of Crosslinked Chitosan-Based Oleogels Based on Mechanical Properties of Conventional Solid Fats. Polymers 2025, 17, 1526. https://doi.org/10.3390/polym17111526
Brito GB, Pinho-Jr JdS, Guimarães AdS, Conte-Júnior CA, Nele M, Perrone D, Castelo-Branco VN. Optimization and Characterization of Crosslinked Chitosan-Based Oleogels Based on Mechanical Properties of Conventional Solid Fats. Polymers. 2025; 17(11):1526. https://doi.org/10.3390/polym17111526
Chicago/Turabian StyleBrito, Gabriela Baptista, Jorge da Silva Pinho-Jr, André da Silva Guimarães, Carlos Adam Conte-Júnior, Marcio Nele, Daniel Perrone, and Vanessa Naciuk Castelo-Branco. 2025. "Optimization and Characterization of Crosslinked Chitosan-Based Oleogels Based on Mechanical Properties of Conventional Solid Fats" Polymers 17, no. 11: 1526. https://doi.org/10.3390/polym17111526
APA StyleBrito, G. B., Pinho-Jr, J. d. S., Guimarães, A. d. S., Conte-Júnior, C. A., Nele, M., Perrone, D., & Castelo-Branco, V. N. (2025). Optimization and Characterization of Crosslinked Chitosan-Based Oleogels Based on Mechanical Properties of Conventional Solid Fats. Polymers, 17(11), 1526. https://doi.org/10.3390/polym17111526