
Impact of BMI and PRP Platelet and Red Blood Cell Content on the Coagulation Kinetics of Ortho-R/PRP Mixtures


Abstract
1. Introduction
2. Materials and Methods
2.1. Preparation of the Ortho-R Freeze-Dried Formulation
2.2. Donor Recruitment
- Inclusion criteria:
- Donors were healthy (state of complete physical, mental and social well-being);
- Donors felt well on the day of the blood draw;
- Donors were not fasting on the day of the blood draw;
- Donors had not given blood for 56 days (men) or 84 days (women);
- Donors were aged between 18 and 75 years;
- Donors were able give their free and informed consent.
- Exclusion criteria:
- Donors had a fever > 37.5 °C;
- Donors had previously been diagnosed with a coagulopathy (e.g., hemophilia, Von Willebrand disease, clotting factor deficiencies) or blood abnormalities (e.g., low hemoglobin);
- Donors had received a vaccine and/or had had surgery in the last 56 days;
- Donors were pregnant or were nursing and had given birth less than 6 months before;
- Donors were taking medications that affect blood clotting (except low-dose aspirin), including warfarin, frusemide, penicillin and ranitidine;
- Donors had infectious diseases, HIV/AIDS, sepsis and/or hepatitis A, B, C.
2.3. Blood Draw and Isolation of PRP
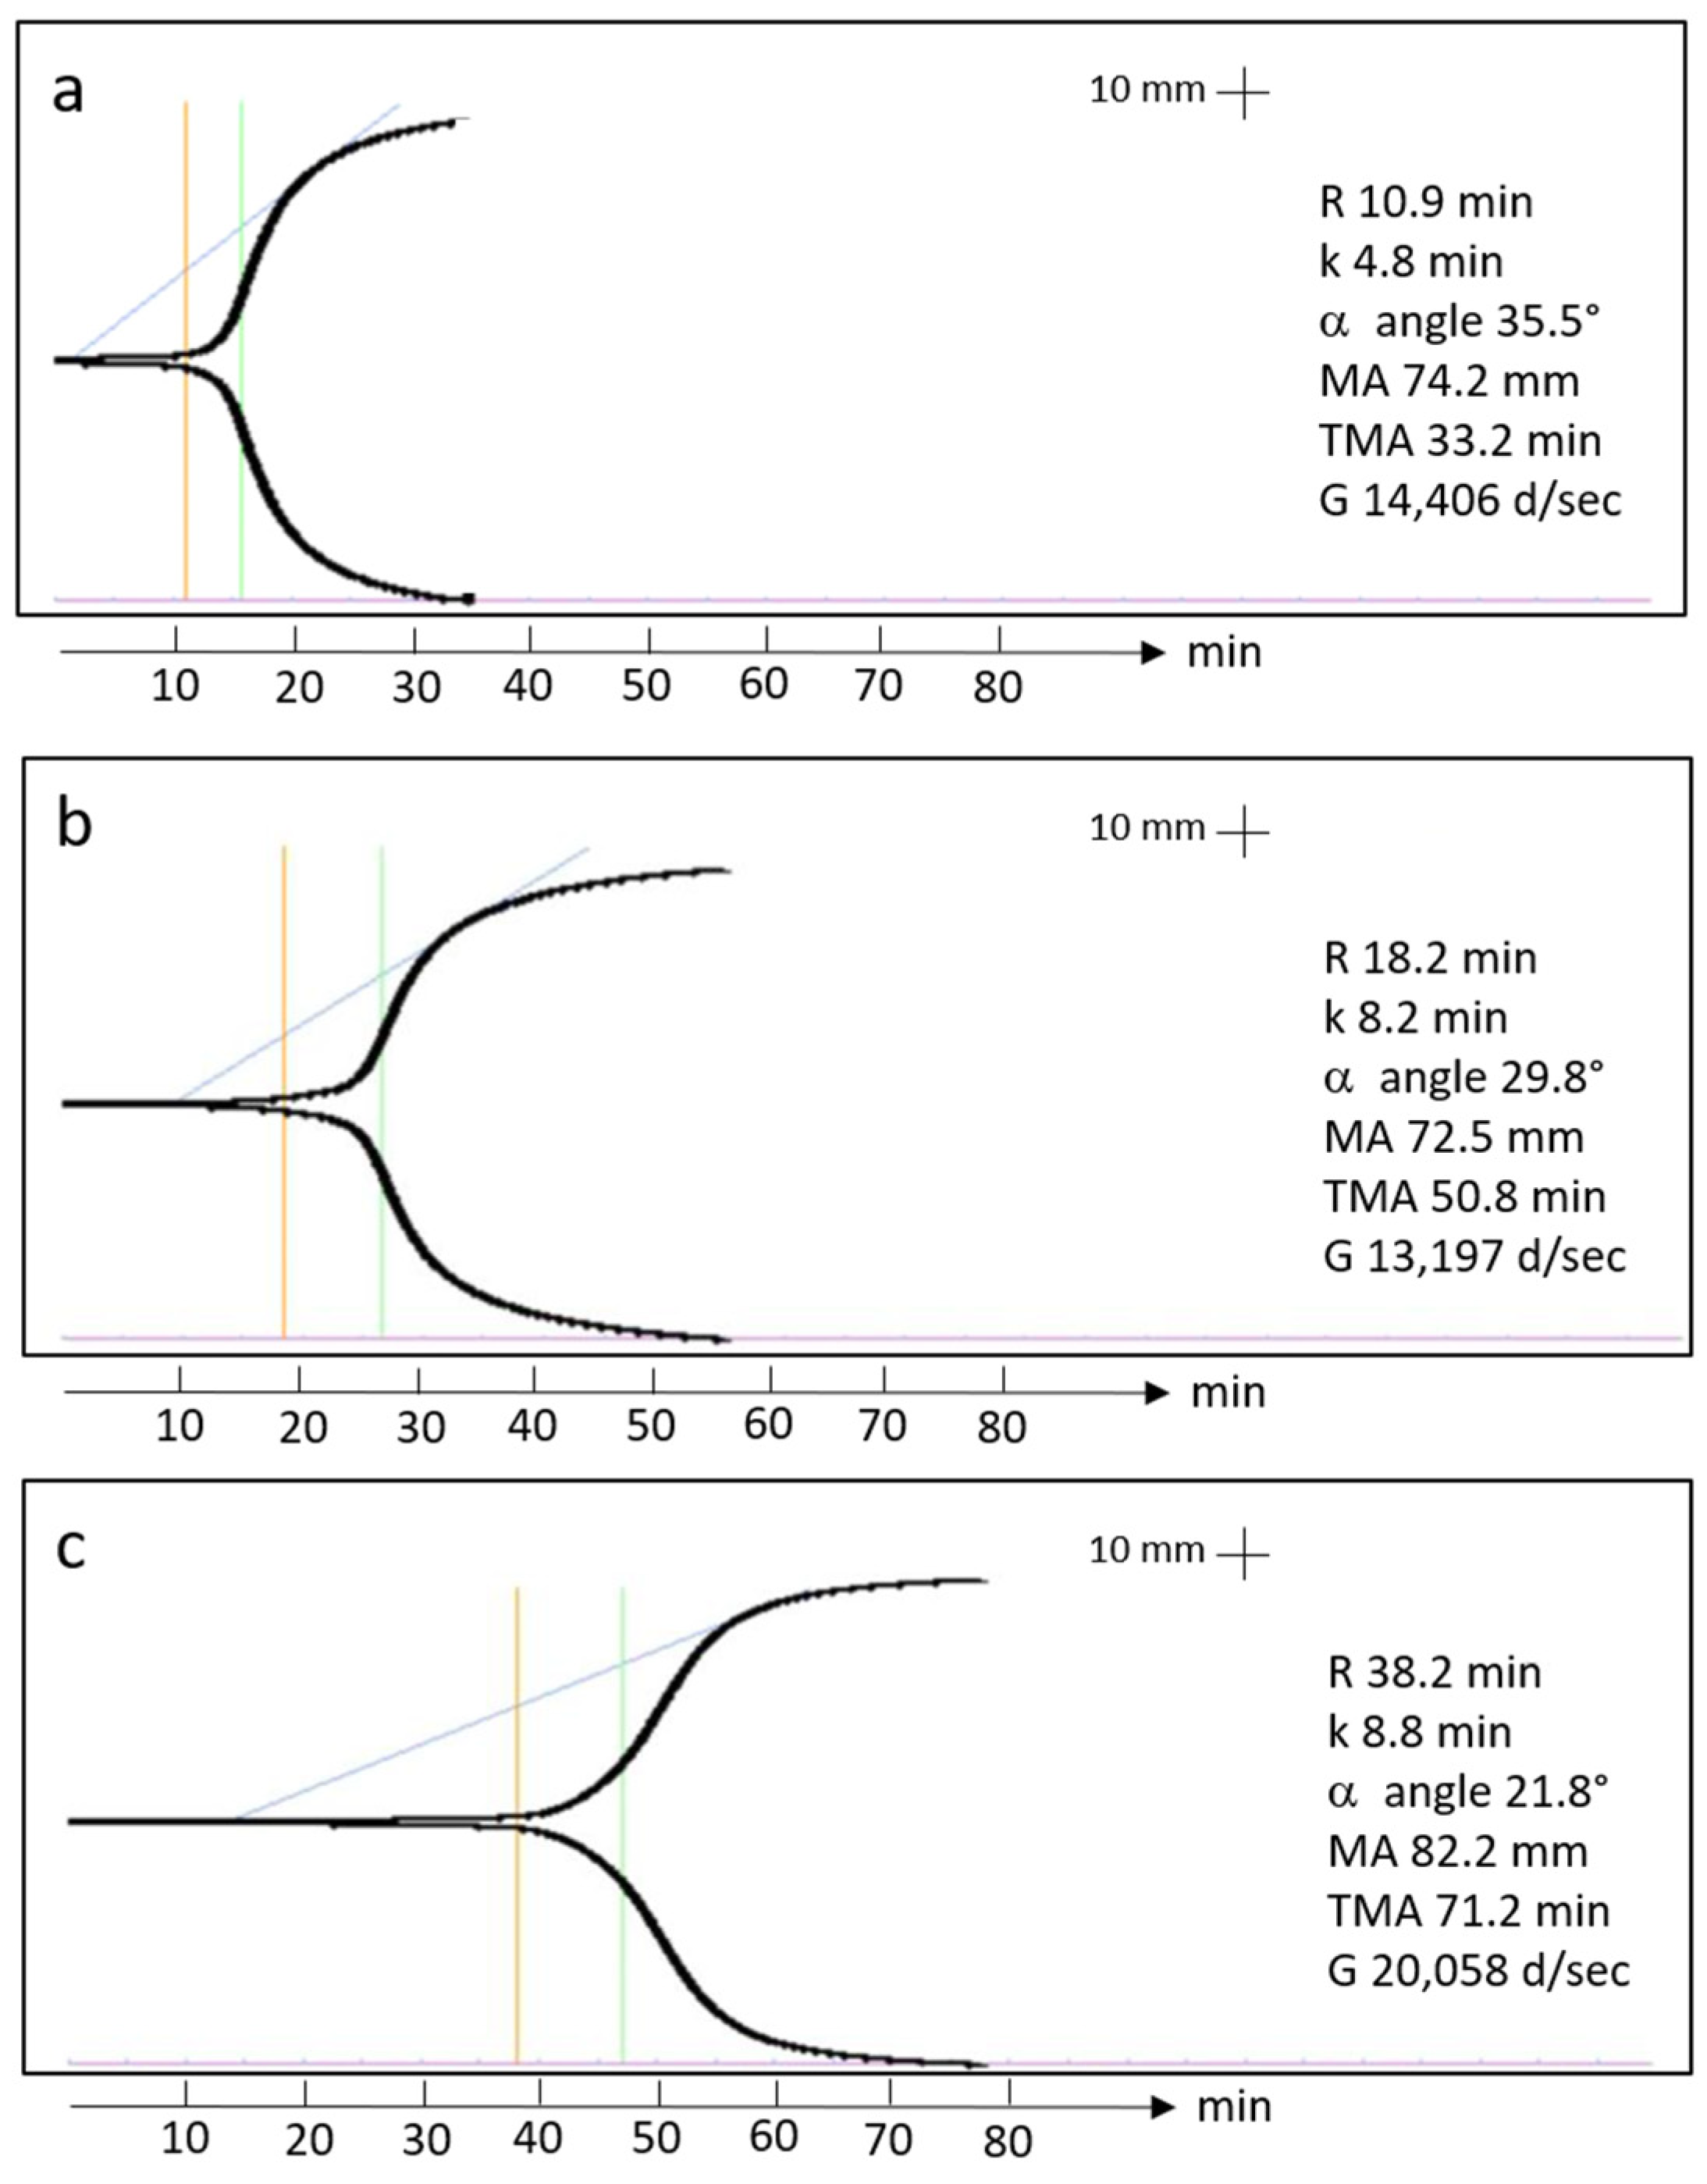
2.4. Thromboelastography
2.5. Statistical Analysis
3. Results
3.1. Donors
3.2. PRP Isolation
3.3. TEG Data
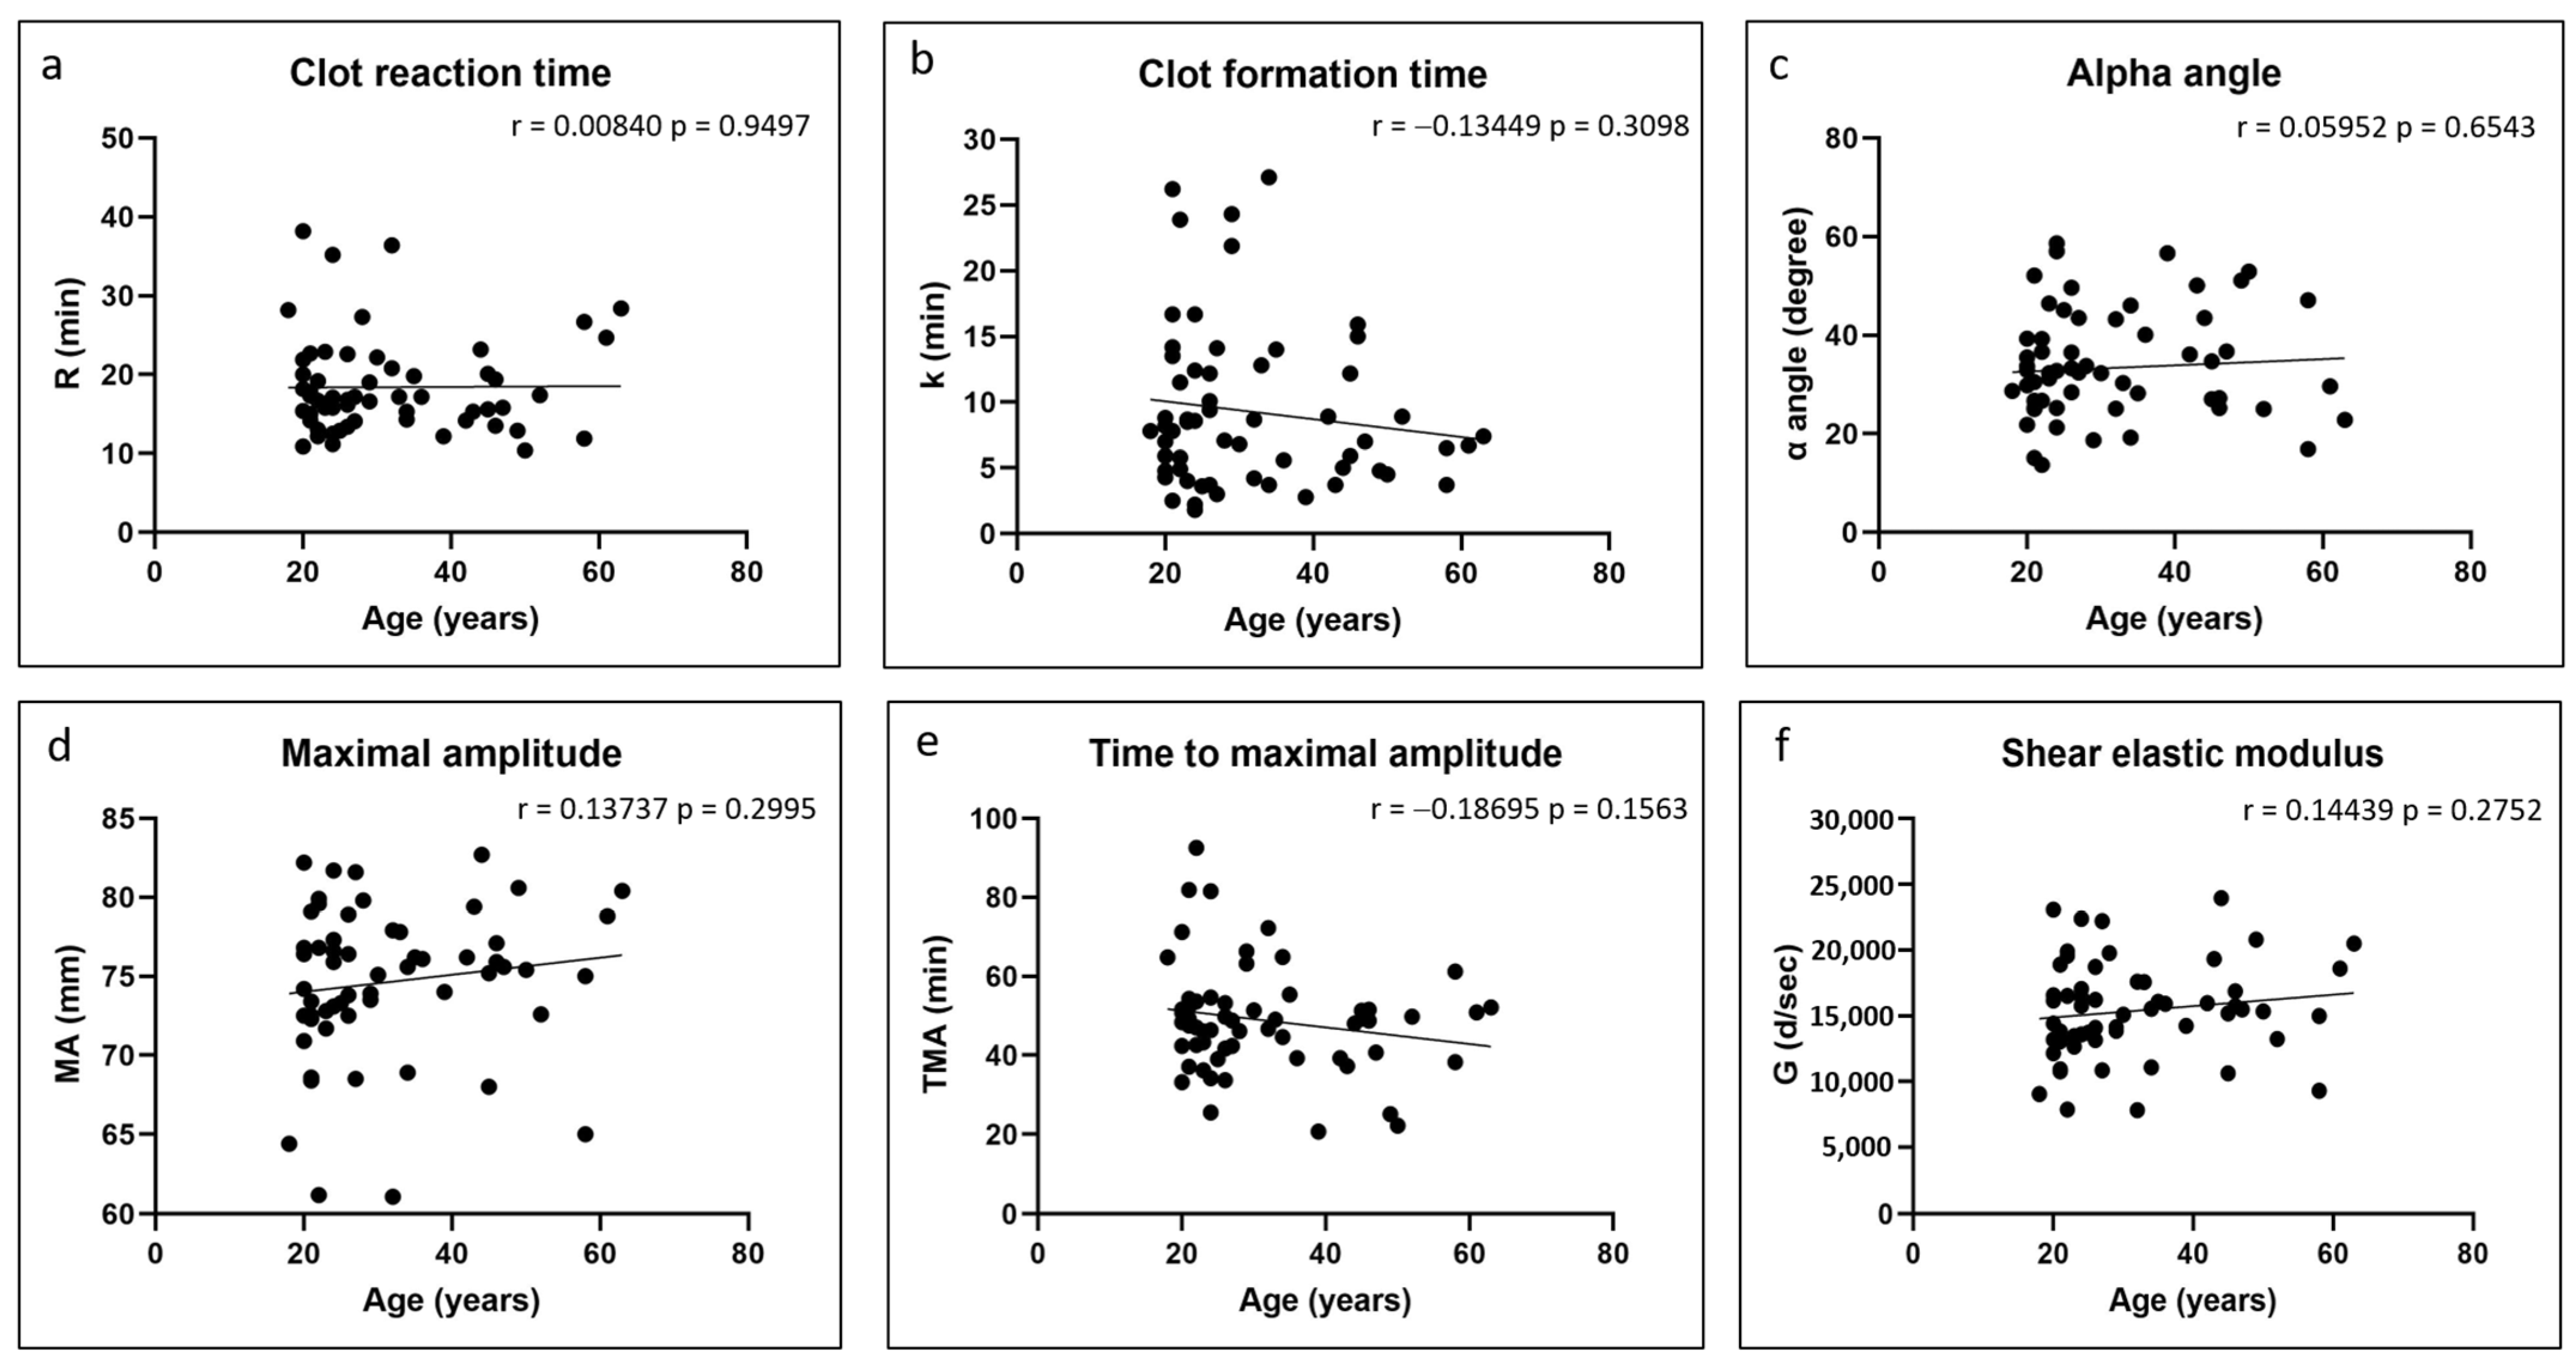
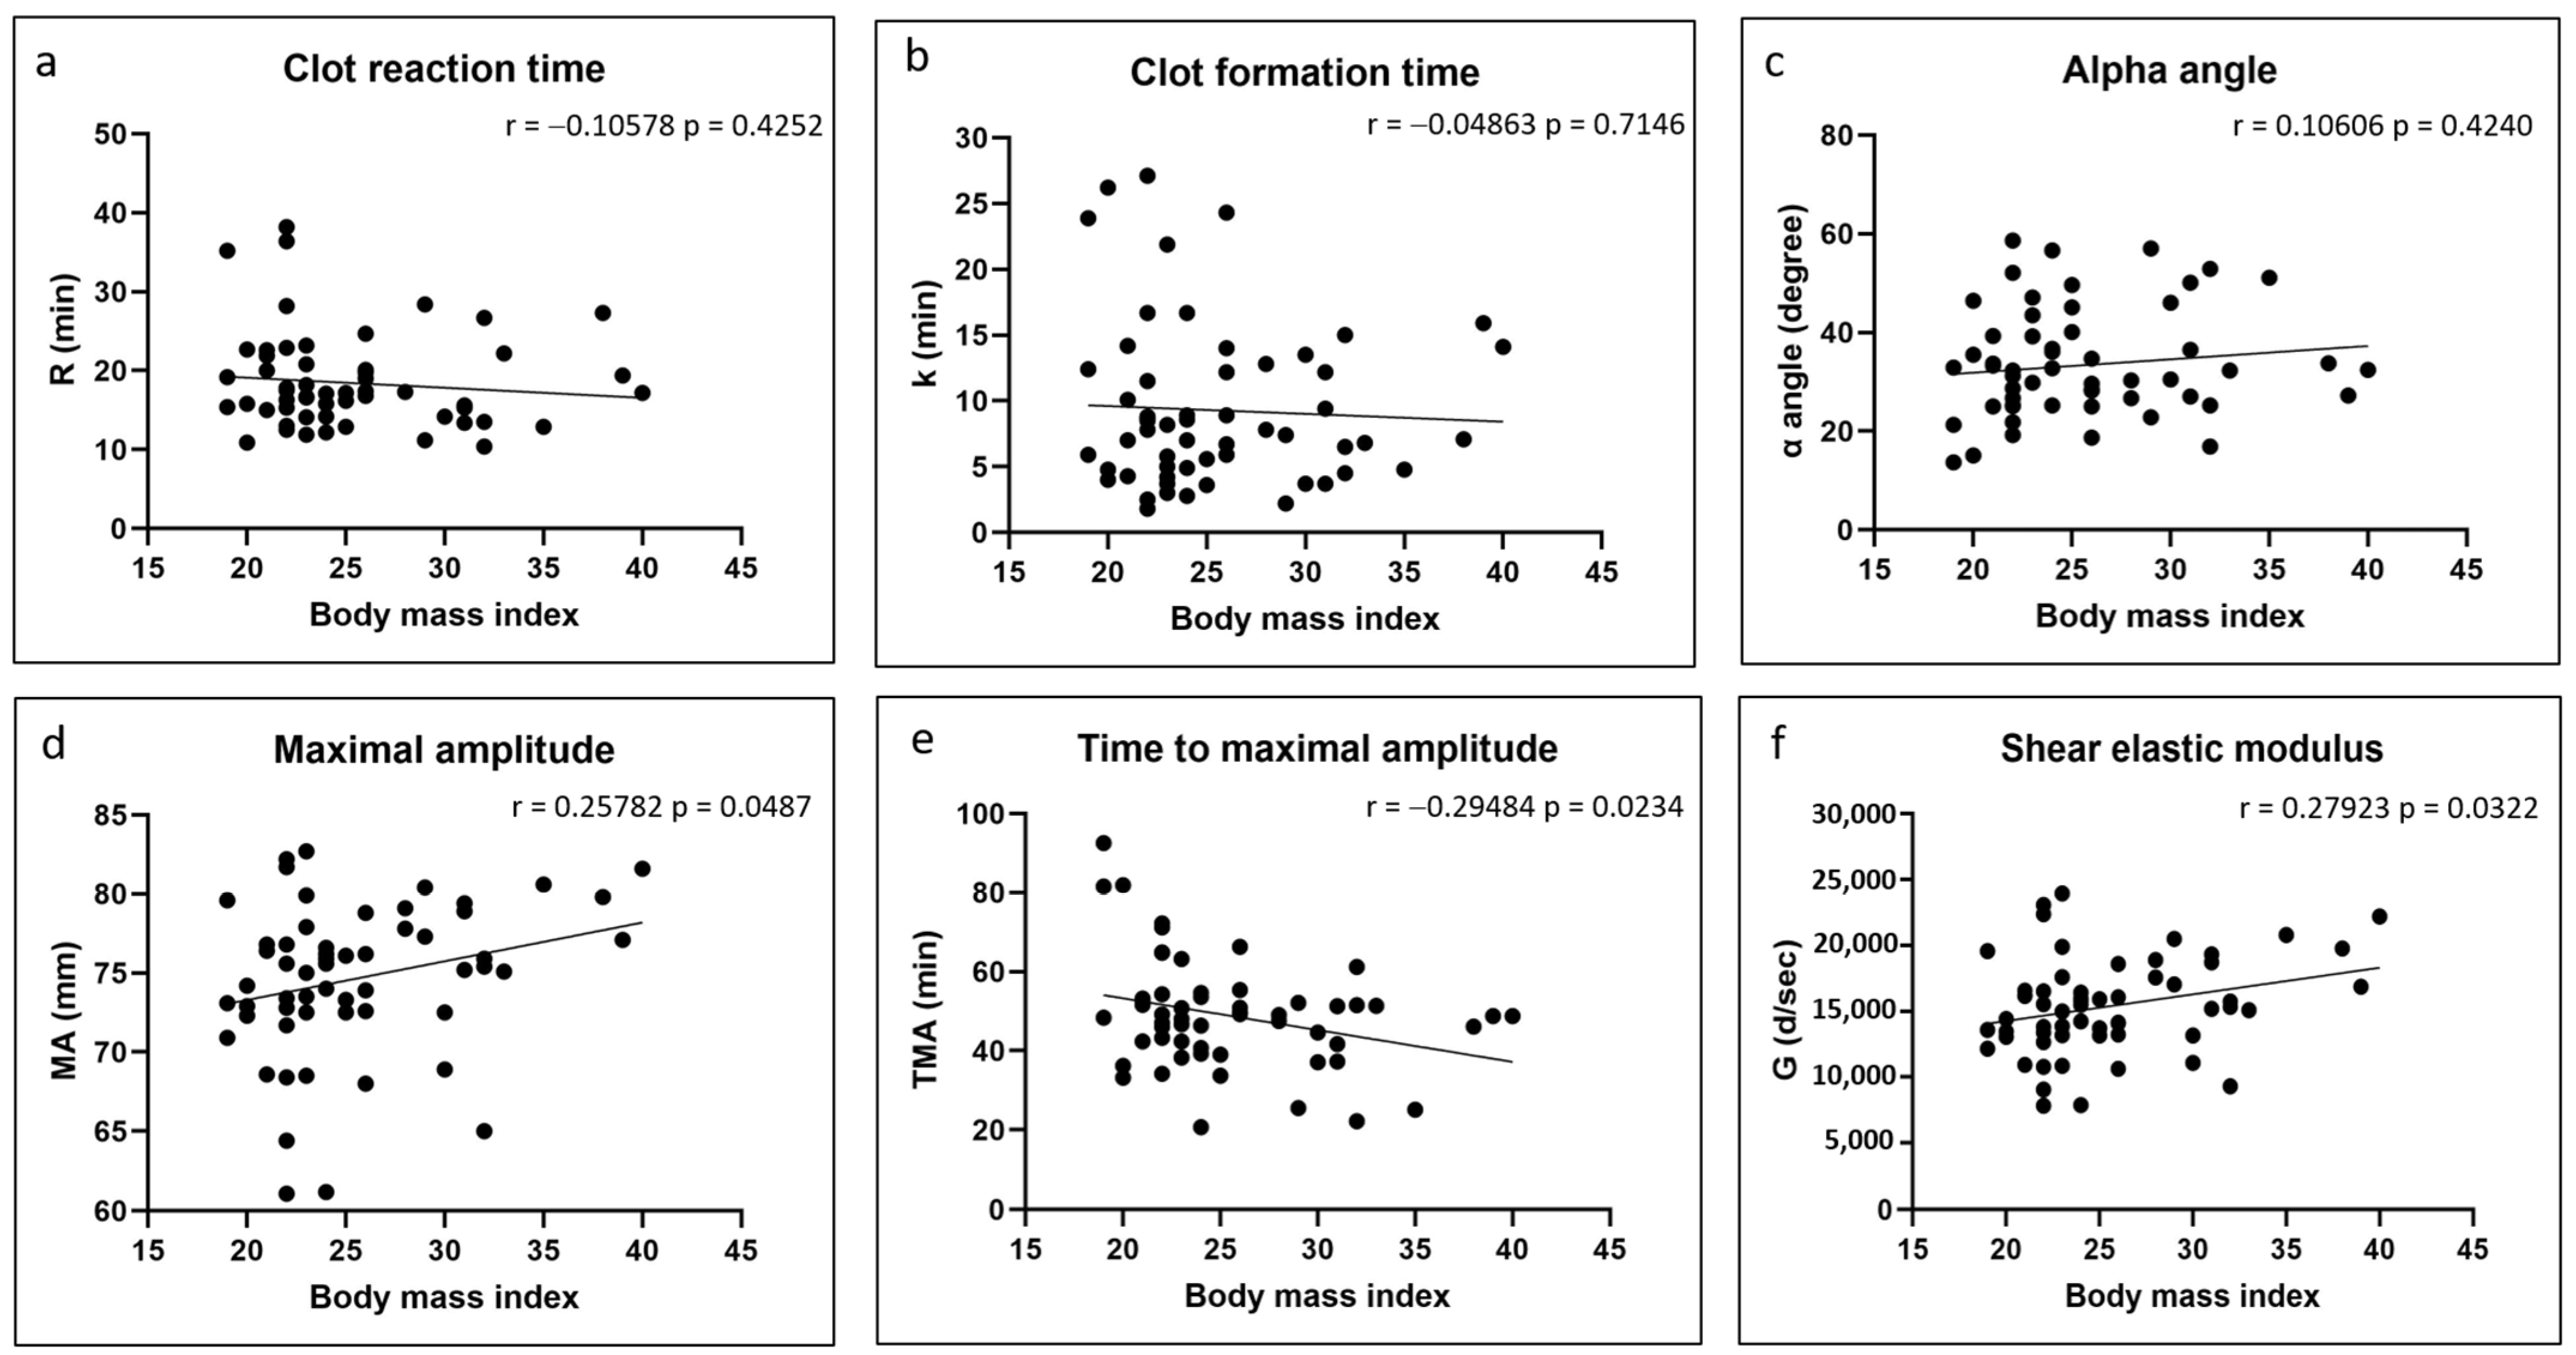
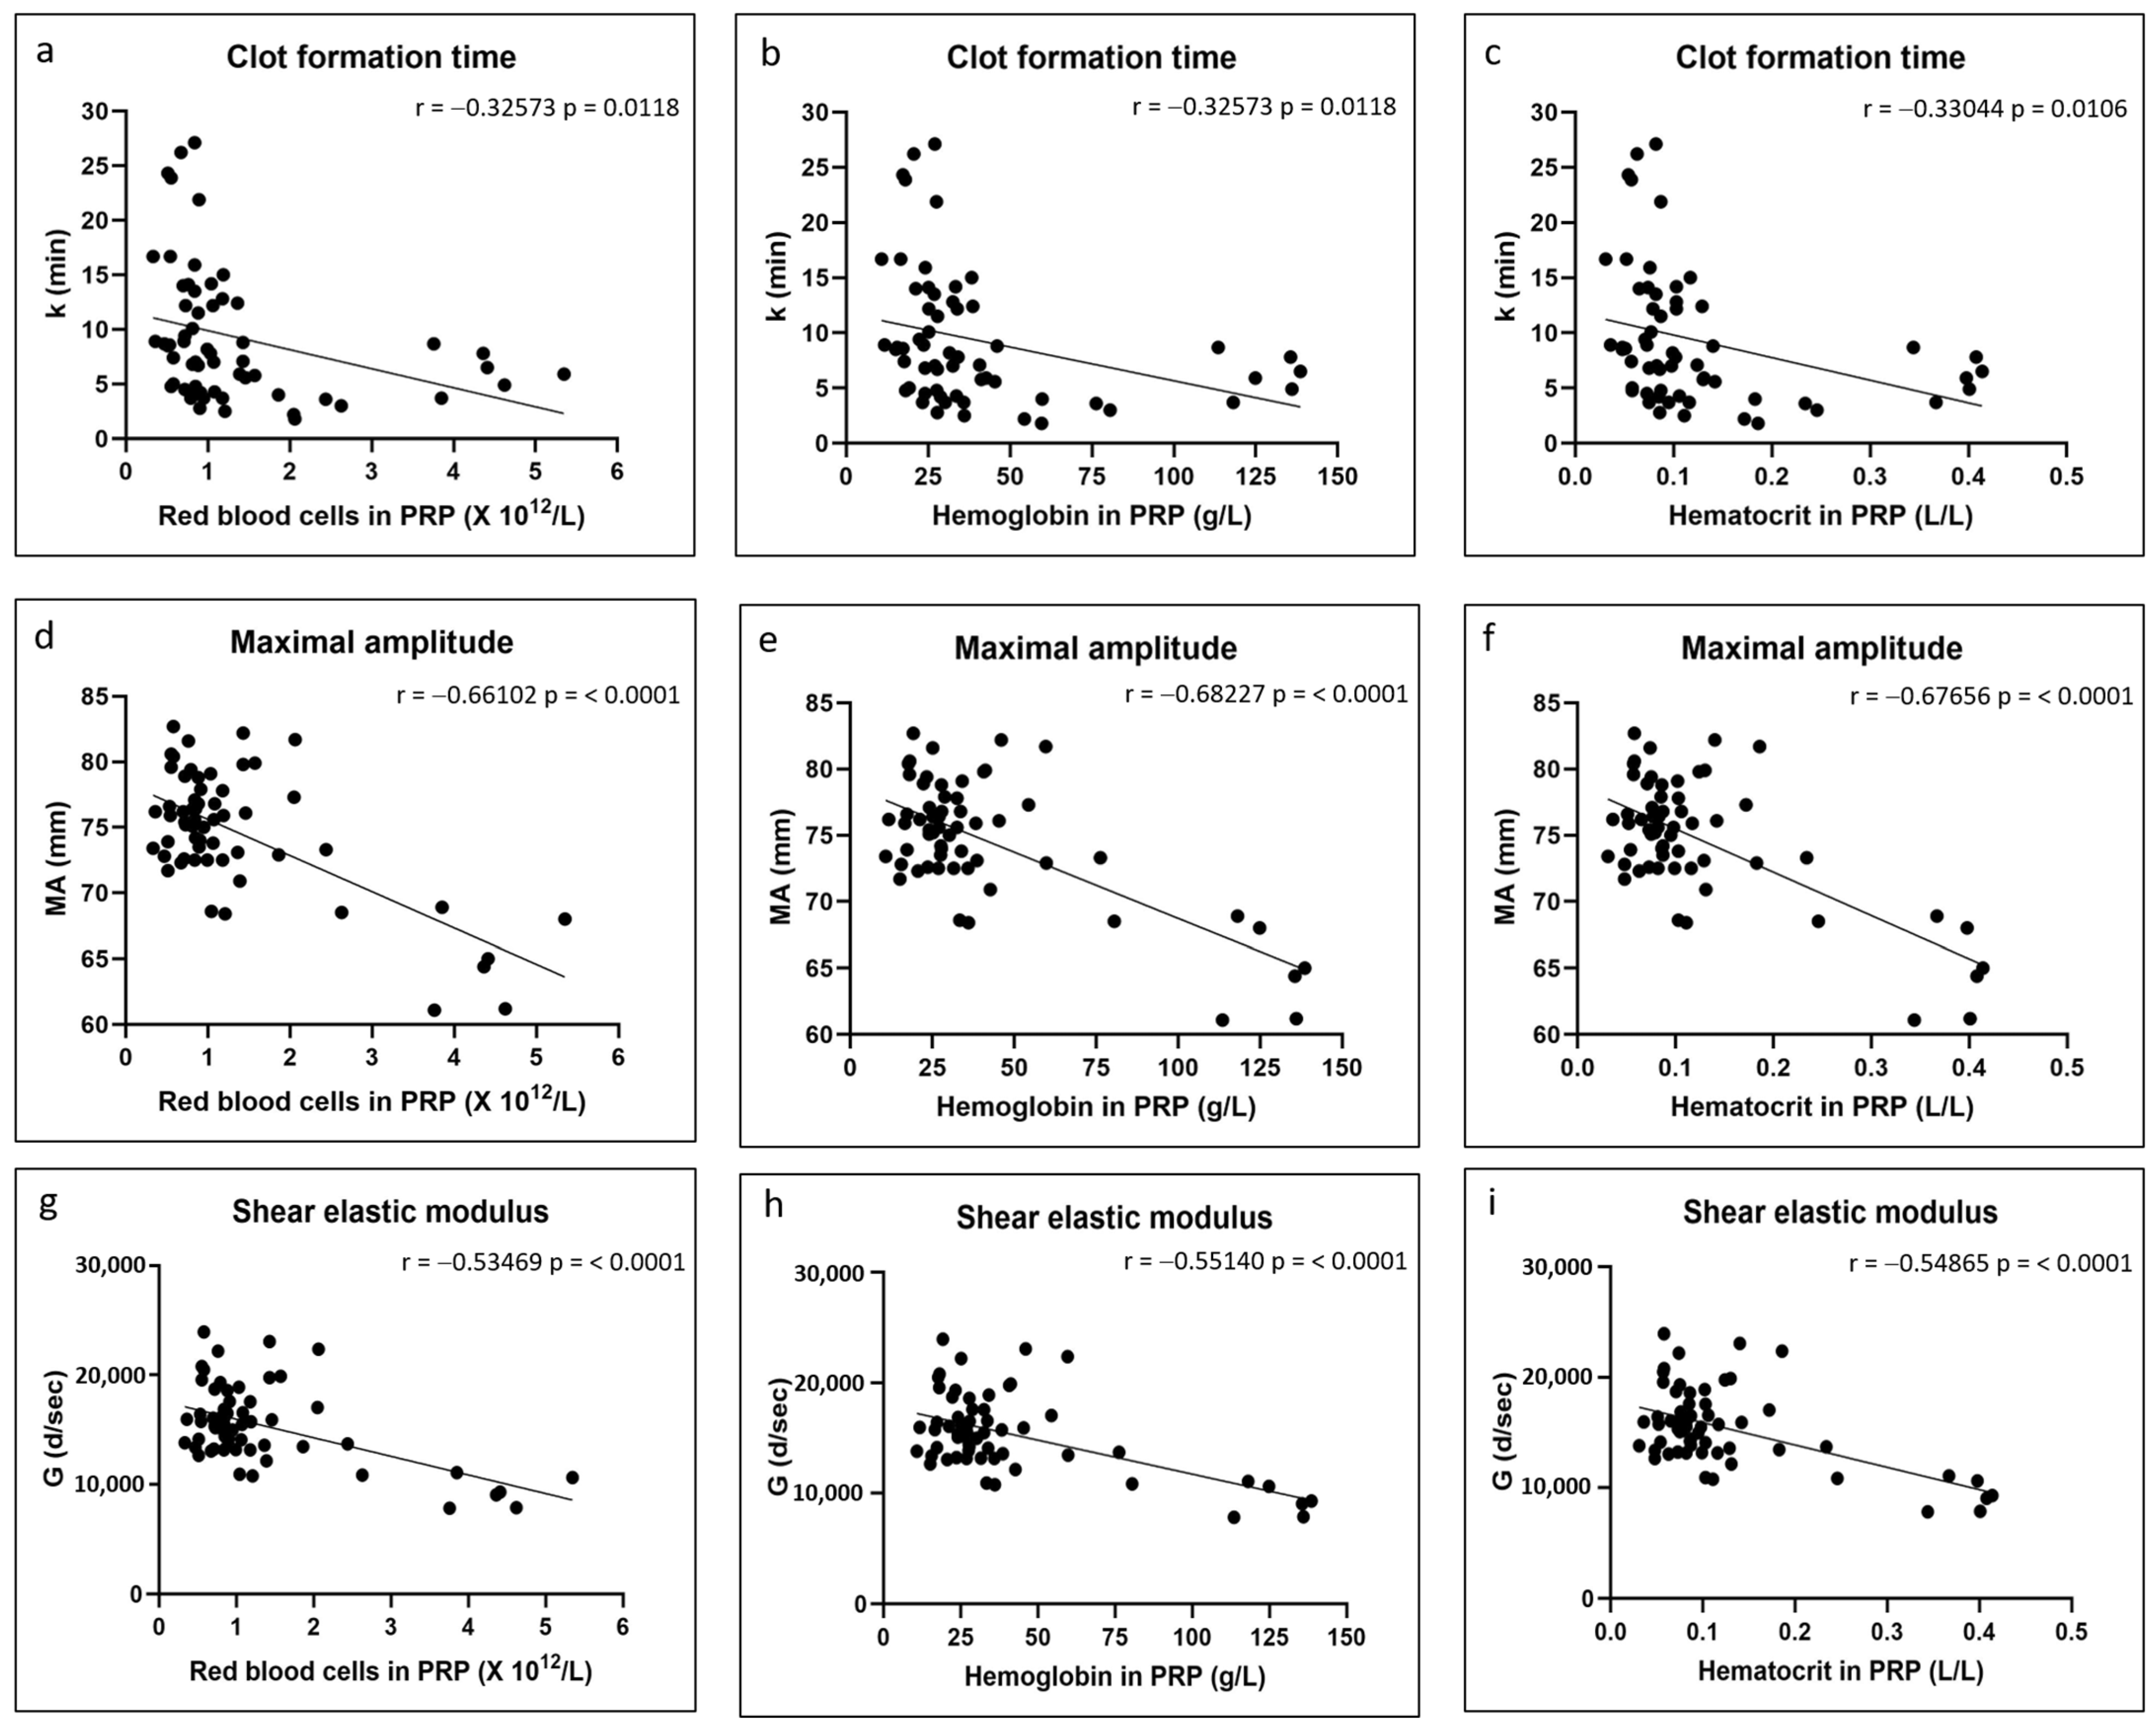
3.4. Correlations
4. Discussion
Supplementary Materials
Author Contributions
Funding
Institutional Review Board Statement
Data Availability Statement
Acknowledgments
Conflicts of Interest
References
- Chevrier, A.; Darras, V.; Picard, G.; Nelea, M.; Veilleux, D.; Lavertu, M.; Hoemann, C.D.; Buschmann, M.D. Injectable chitosan-platelet-rich plasma (PRP) implants to promote tissue regeneration: In vitro properties, in vivo residence, degradation, cell recruitment and vascularization. J. Tissue Eng. Regen. Med. 2018, 12, 217–228. [Google Scholar] [CrossRef] [PubMed]
- Deprés-Tremblay, G.; Chevrier, A.; Tran-Khanh, N.; Nelea, M.; Buschmann, M.D. Chitosan inhibits platelet-mediated clot retraction, increases platelet-derived growth factor release, and increases residence time and bioactivity of platelet-rich plasma in vivo. Biomed. Mater. 2017, 13, 015005. [Google Scholar] [CrossRef] [PubMed]
- Chevrier, A.; Hurtig, M.B.; Lavertu, M. Chitosan–platelet-rich plasma implants improve rotator cuff repair in a large animal model: Pivotal study. Pharmaceutics 2021, 13, 1955. [Google Scholar] [CrossRef] [PubMed]
- Ghazi, Z.L.; Chevrier, A.; Hurtig, M.B.; Farr, J.; Rodeo, S.; Hoemann, C.D.; Buschmann, M.D. Freeze-dried chitosan-PRP injectable surgical implants for meniscus repair: Pilot feasibility studies in ovine models. Reg. Med. Ther. 2017, 1, 16–29. [Google Scholar]
- Deprés-Tremblay, G.; Chevrier, A.; Snow, M.; Rodeo, S.; Buschmann, M.D. Freeze-dried chitosan-platelet-rich plasma implants improve supraspinatus tendon attachment in a transosseous rotator cuff repair model in the rabbit. J. Biomed. Appl. 2019, 33, 792–807. [Google Scholar] [CrossRef]
- Dwivedi, G.; Chevrier, A.; Hoemann, C.D.; Buschmann, M.D. Injectable freeze-dried chitosan-platelet-rich-plasma implants improve marrow-stimulated cartilage repair in a chronic-defect rabbit model. J. Tissue Eng. Regen. Med. 2019, 13, 599–611. [Google Scholar] [CrossRef]
- Chevrier, A.; Hurtig, M.B.; Lavertu, M. Chitosan-platelet-rich plasma implants improve rotator cuff repair in a large animal model: Pilot study. J. Biomed. Appl. 2022, 37, 183–194. [Google Scholar] [CrossRef]
- Sidonio, R.F., Jr.; Hoffman, M.; Kenet, G.; Dargaud, Y. Thrombin generation and implications for hemophilia therapies: A narrative review. Res. Pract. Thromb. Haemost. 2023, 7, 100018. [Google Scholar] [CrossRef]
- Bontekoe, I.J.; van der Meer, P.F. Thromboelastography as a tool to evaluate blood of healthy volunteers and blood component quality: A review. Vox Sang. 2019, 114, 643–657. [Google Scholar] [CrossRef]
- Bose, E.; Hravnak, M. Thromboelastography: A Practice Summary for Nurse Practitioners Treating Hemorrhage. J. Nurse Pract. 2015, 11, 702–709. [Google Scholar] [CrossRef]
- Ho, P.; Ng, C.; Rigano, J.; Tacey, M.; Smith, C.; Donnan, G.; Nandurkar, H. Significant age, race and gender differences in global coagulation assays parameters in the normal population. Thromb. Res. 2017, 154, 80–83. [Google Scholar] [CrossRef] [PubMed]
- Roeloffzen, W.W.; Kluin-Nelemans, H.C.; Mulder, A.B.; Veeger, N.J.; Bosman, L.; de Wolf, J.T. In normal controls, both age and gender affect coagulability as measured by thrombelastography. Anesth. Analg. 2010, 110, 987–994. [Google Scholar] [CrossRef] [PubMed]
- Lang, T.; Bauters, A.; Braun, S.L.; Pötzsch, B.; von Pape, K.W.; Kolde, H.J.; Lakner, M. Multi-centre investigation on reference ranges for ROTEM thromboelastometry. Blood Coagul. Fibrinolysis 2005, 16, 301–310. [Google Scholar] [CrossRef]
- Feuring, M.; Wehling, M.; Ruf, A.; Burkhardt, H.; Schultz, A. Coagulation status in patients with coronary artery disease taking 100 mg aspirin and healthy volunteers using PFA-100® and ROTEM®. Int. J. Clin. Pharmacol. Ther. 2011, 49, 328–335. [Google Scholar] [CrossRef]
- Wei, C.; Zhao, J.Y.; Wang, S.Y.; Sun, H.N.; Guan, N.Z. Establishment of normal reference range for thromboelastography based on 17,708 cases in Beijing, China. Ann. Transl. Med. 2022, 10, 550. [Google Scholar] [CrossRef]
- Scarpelini, S.; Rhind, S.G.; Nascimento, B.; Tien, H.; Shek, P.N.; Peng, H.T.; Huang, H.; Pinto, R.; Speers, V.; Reis, M.; et al. Normal range values for thromboelastography in healthy adult volunteers. Braz. J. Med. Biol. Res. 2009, 42, 1210–1217. [Google Scholar] [CrossRef]
- Gorton, H.J.; Warren, E.R.; Simpson, N.A.; Lyons, G.R.; Columb, M.O. Thromboelastography identifies sex-related differences in coagulation. Anesth. Analg. 2000, 91, 1279–1281. [Google Scholar] [CrossRef]
- Rodgers, S.C.; Carter, K.T.; Patki, D.; O’Brien, R.C.; Kutcher, M.E. Thromboelastography-Based Evaluation of Gender-Associated Hypercoagulability. Am. Surg. 2022, 88, 2619–2625. [Google Scholar] [CrossRef]
- Hobson, A.R.; Qureshi, Z.; Banks, P.; Curzen, N. Gender and responses to aspirin and clopidogrel: Insights using short thrombelastography. Cardiovasc. Ther. 2009, 27, 246–252. [Google Scholar] [CrossRef]
- Ni, L.; Xue, P. Establishment of Normal Range for Thromboelastography in Healthy Middle-Aged and Elderly People of Weihai in China. J. Healthc. Eng. 2021, 2021, 7119779. [Google Scholar] [CrossRef]
- Lim, H.Y.; Lui, B.; Tacey, M.; Selan, C.; Donnan, G.; Burrell, L.M.; Nandurkar, H.; Ho, P. Global coagulation assays in healthy controls: Are there compensatory mechanisms within the coagulation system? J. Thromb. Thrombolysis 2021, 52, 610–619. [Google Scholar] [CrossRef] [PubMed]
- Lev, E.I.; Bliden, K.P.; Jeong, Y.H.; Pandya, S.; Kang, K.; Franzese, C.; Tantry, U.S.; Gurbel, P.A. Influence of race and sex on thrombogenicity in a large cohort of coronary artery disease patients. J. Am. Heart Assoc. 2014, 3, e001167. [Google Scholar] [CrossRef] [PubMed]
- Campello, E.; Spiezia, L.; Zabeo, E.; Maggiolo, S.; Vettor, R.; Simioni, P. Hypercoagulability detected by whole blood thromboelastometry (ROTEM®) and impedance aggregometry (MULTIPLATE®) in obese patients. Thromb. Res. 2015, 135, 548–553. [Google Scholar] [CrossRef] [PubMed]
- Kornblith, L.Z.; Howard, B.; Kunitake, R.; Redick, B.; Nelson, M.; Cohen, M.J.; Callcut, R. Obesity and clotting: Body mass index independently contributes to hypercoagulability after injury. J. Trauma. Acute Care Surg. 2015, 78, 30–36. [Google Scholar] [CrossRef]
- Zahn, C.M.; Gonzalez, D.I., Jr.; Suto, C.; Kennedy, S.; Hines, J.F. Low-dose oral contraceptive effects on thromboelastogram criteria and relationship to hypercoagulability. Am. J. Obstet. Gynecol. 2003, 189, 43–47. [Google Scholar] [CrossRef]
- Swanepoel, A.C.; Bester, J.; de Lange-Loots, Z. Mechanical and Physical Behavior of Fibrin Clot Formation and Lysis in Combined Oral Contraceptive Users. Microsc. Microanal. 2020, 26, 1007–1013. [Google Scholar] [CrossRef]
- Swanepoel, A.C.; Emmerson, O.; Pretorius, E. Effect of Progesterone and Synthetic Progestins on Whole Blood Clot Formation and Erythrocyte Structure. Microsc. Microanal. 2017, 23, 607–617. [Google Scholar] [CrossRef]
- Swanepoel, A.C.; Visagie, A.; Pretorius, E. Synthetic Hormones and Clot Formation. Microsc. Microanal. 2016, 22, 878–886. [Google Scholar] [CrossRef]
- Hobson, A.R.; Dawkins, K.D.; Curzen, N.P. Antiplatelet effects of licking an aspirin tablet can be detected by thrombelastography. Acute Card. Care 2008, 10, 62–63. [Google Scholar] [CrossRef]
- Barua, R.S.; Sy, F.; Srikanth, S.; Huang, G.; Javed, U.; Buhari, C.; Margosan, D.; Ambrose, J.A. Effects of Cigarette Smoke Exposure on Clot Dynamics and Fibrin Structure. Arterioscler. Thromb. Vasc. Biol. 2010, 30, 75–79. [Google Scholar] [CrossRef]
- Spoerke, N.; Underwood, S.; Differding, J.; Van, P.; Sambasivan, C.; Shapiro, D.; Schreiber, M. Effects of ethanol intoxication and gender on blood coagulation. J. Trauma 2010, 68, 1106–1111. [Google Scholar] [CrossRef] [PubMed]
- Kunutsor, S.K.; Seidu, S.; Khunti, K. Depression, antidepressant use, and risk of venous thromboembolism: Systematic review and meta-analysis of published observational evidence. Ann. Med. 2018, 50, 529–537. [Google Scholar] [CrossRef] [PubMed]
- Halperin, D.; Reber, G. Influence of antidepressants on hemostasis. Dialogues Clin. Neurosci. 2007, 9, 47–59. [Google Scholar] [CrossRef] [PubMed]
- Bowbrick, V.A.; Mikhailidis, D.P.; Stansby, G. Influence of platelet count and activity on thromboelastography parameters. Platelets 2003, 14, 219–224. [Google Scholar] [CrossRef]
- Roeloffzen, W.W.; Kluin-Nelemans, H.C.; Mulder, A.B.; de Wolf, J.T. Thrombocytopenia affects plasmatic coagulation as measured by thrombelastography. Blood Coagul. Fibrinolysis 2010, 21, 389–397. [Google Scholar] [CrossRef]
- Roeloffzen, W.W.H.; Kluin-Nelemans, J.C.; de Wolf, J. The Effect of Platelet-, and Leukocyte Count on the Thrombelastograph® (TEG) Parameters. Blood 2004, 104, 3971. [Google Scholar] [CrossRef]
- Ahammad, J.; Kurien, A.; Shastry, S.; Shah, H.H.; Nayak, D.; Kamath, A.; Badagabettu, S. Age- and gender-related reference ranges for thromboelastography from a healthy Indian population. Int. J. Lab. Hematol. 2020, 42, 180–189. [Google Scholar] [CrossRef]
- Zeng, X.; Fang, L.; Peng, Y.; Zhang, Y.; Li, X.; Wang, Z.; Zhang, B.; Cao, Q.; Hu, X. A multicenter reference interval study of thromboelastography in the Chinese adult population. Thromb. Res. 2020, 195, 180–186. [Google Scholar] [CrossRef]
- Durila, M.; Lukáš, P.; Bronský, J.; Cvachovec, K. Time impact on non-activated and kaolin-activated blood samples in thromboelastography. BMC Anesthesiol. 2015, 15, 50. [Google Scholar] [CrossRef]
- Noorman, F.; Hess, J.R. The contribution of the individual blood elements to the variability of thromboelastographic measures. Transfusion 2018, 58, 2430–2436. [Google Scholar] [CrossRef]
- Lee, M.S.; Lee, Y.J.; Jeong, D.; Ryu, K.H. The effects of red blood cells on coagulation: A thromboelastographic study. Anesth. Pain. Med. 2009, 4, 133–137. [Google Scholar]
- Roeloffzen, W.W.; Kluin-Nelemans, H.C.; Bosman, L.; de Wolf, J.T. Effects of red blood cells on hemostasis. Transfusion 2010, 50, 1536–1544. [Google Scholar] [CrossRef] [PubMed]
- Iselin, B.M.; Willimann, P.F.X.; Seifert, B.; Casutt, M.; Bombeli, T.; Zalunardo, M.P.; Pasch, T.; Spahn, D.R. Isolated reduction of haematocrit does not compromise in vitro blood coagulation. Br. J. Anaesth. 2001, 87, 246–249. [Google Scholar] [CrossRef]
- Weisel, J.W.; Litvinov, R.I. Red blood cells: The forgotten player in hemostasis and thrombosis. J. Thromb. Haemost. 2019, 17, 271–282. [Google Scholar] [CrossRef]
- Litvinov, R.I.; Weisel, J.W. Blood clot contraction: Mechanisms, pathophysiology, and disease. Res. Pract. Thromb. Haemost. 2023, 7, 100023. [Google Scholar] [CrossRef]
- Whelihan, M.F.; Mann, K.G. The role of the red cell membrane in thrombin generation. Thromb. Res. 2013, 131, 377–382. [Google Scholar] [CrossRef]
- Whelihan, M.F.; Zachary, V.; Orfeo, T.; Mann, K.G. Prothrombin activation in blood coagulation: The erythrocyte contribution to thrombin generation. Blood 2012, 120, 3837–3845. [Google Scholar] [CrossRef]
- Waldén, K.; Shams Hakimi, C.; Jeppsson, A.; Karlsson, M. Effects of fibrinogen supplementation on clot formation in blood samples from cardiac surgery patients before and after tranexamic acid administration. Transfus. Med. 2019, 29, 319–324. [Google Scholar] [CrossRef]
- Rahe-Meyer, N.; Levy, J.H.; Ueda, Y.; Schmidt, D.S.; Gill, R. Viscoelastic testing to assess the effects of rapid fibrinogen concentrate administration after cardiopulmonary bypass: Insights from the REPLACE study. Blood Coagul. Fibrinolysis 2021, 32, 359–365. [Google Scholar] [CrossRef]
- Stolt, H.; Shams Hakimi, C.; Singh, S.; Jeppsson, A. A comparison of the in vitro effects of three fibrinogen concentrates on clot strength in blood samples from cardiac surgery patients. Acta Anaesthesiol. Scand. 2021, 65, 1439–1446. [Google Scholar] [CrossRef]
- Esmon, C.T. The interactions between inflammation and coagulation. Br. J. Haematol. 2005, 131, 417–430. [Google Scholar] [CrossRef] [PubMed]


| Donor | Age (years) AVE ± SD (Min–Max) | BMI AVE ± SD (Min–Max) | Low-Dose Aspirin | Oral Contraceptives | Smoking | Alcohol That Day | Diabetes | Antidepressants |
|---|---|---|---|---|---|---|---|---|
| All (n = 60) | 31 ± 12 (18–63) | 25 ± 5 (19–40) | n = 0 | n = 10 | n = 5 | n = 0 | n = 0 | n = 2 |
| Males (n = 27) | 31 ± 12 (20–61) | 24 ± 4 (21–39) | n = 0 | N/A | n = 2 | n = 0 | n = 0 | n = 1 |
| Females (n = 33) | 32 ± 13 (18–63) | 26 ± 6 (19–40) | n = 0 | n = 10 | n = 3 | n = 0 | n = 0 | n = 1 |
| Donors | Platelets (×109/L) AVE ± SD | WBC (×109/L) AVE ± SD | RBC (×1012/L) AVE ± SD | HB (g/L) AVE ± SD | HT (L/L) AVE ± SD |
|---|---|---|---|---|---|
| All (n = 60) | 253 ± 74 | 6.4 ± 1.8 | 4.8 ± 0.4 | 146.2 ± 12.9 | 0.43 ± 0.03 |
| Males (n = 27) | 219 ± 45 | 6.1 ± 1.8 | 5.1 ± 0.3 | 157.4 ± 6.3 | 0.45 ± 0.02 |
| Females (n = 33) | 281 ± 82 | 6.6 ± 1.8 | 4.5 ± 0.3 | 137.1 ± 9.0 | 0.40 ± 0.02 |
| Donors | Platelets (×109/L) AVE ± SD | WBC (×109/L) AVE ± SD | RBC (×1012/L) AVE ± SD | HB (g/L) AVE ± SD | HT (L/L) AVE ± SD |
|---|---|---|---|---|---|
| All (n = 60) | 1451 ± 553 | 23.4 ± 9.5 | 1.4 ± 1.1 | 40.8 ± 32.4 | 0.13 ± 0.10 |
| Males (n = 27) | 1339 ± 435 | 22.5 ± 8.3 | 1.2 ± 1.0 | 38.0 ± 29.8 | 0.12 ± 0.09 |
| Females (n = 33) | 1542 ± 625 | 24.2 ± 10.4 | 1.4 ± 1.2 | 43.1 ± 34.7 | 0.13 ± 0.11 |
| Donors | R (min) AVE ± SD (Min–Max) | k (min) AVE ± SD (Min–Max) | α Angle (°) AVE ± SD (Min–Max) | MA (mm) AVE ± SD (Min–Max) | TMA (min) AVE ± SD (Min–Max) | G (dyn/s) AVE ± SD (Min–Max) |
|---|---|---|---|---|---|---|
| All (n = 60) | 18.4 ± 6.1 (10.4–38.2) | 9.3 ± 6.1 (1.8–27.1) | 33.3 ± 12.9 (13.7–58.6) | 74.6 ± 4.8 (61.1–82.7) | 48.9 ± 13.7 (20.7–92.5) | 15,377 ± 3640 (6849–23,993) |
| Males (n = 27) | 18.9 ± 6.5 (12.2–38.2) | 10.4 ± 6.2 (2.5–27.1) | 31.6 ± 9.7 (18.6–56.6) | 73.9 ± 5.2 (61.1–82.7) | 50.9 ± 10.4 (20.7–72.2) | 14,862 ± 3757 (7849–23,933) |
| Females (n = 33) | 18.0 ± 5.8 (10.4–35.2) | 8.4 ± 6.0 (1.8–26.2) | 34.7 ± 14.9 (13.7–58.6) | 75.2 ± 4.4 (64.4–81.7) | 47.2 ± 15.8 (22.2–92.5) | 15,784 ± 3549 (9051–22,374) |
Disclaimer/Publisher’s Note: The statements, opinions and data contained in all publications are solely those of the individual author(s) and contributor(s) and not of MDPI and/or the editor(s). MDPI and/or the editor(s) disclaim responsibility for any injury to people or property resulting from any ideas, methods, instructions or products referred to in the content. |
© 2025 by the authors. Licensee MDPI, Basel, Switzerland. This article is an open access article distributed under the terms and conditions of the Creative Commons Attribution (CC BY) license (https://creativecommons.org/licenses/by/4.0/).
Share and Cite
Chevrier, A.; Lavertu, M. Impact of BMI and PRP Platelet and Red Blood Cell Content on the Coagulation Kinetics of Ortho-R/PRP Mixtures. Polymers 2025, 17, 1515. https://doi.org/10.3390/polym17111515
Chevrier A, Lavertu M. Impact of BMI and PRP Platelet and Red Blood Cell Content on the Coagulation Kinetics of Ortho-R/PRP Mixtures. Polymers. 2025; 17(11):1515. https://doi.org/10.3390/polym17111515
Chicago/Turabian StyleChevrier, Anik, and Marc Lavertu. 2025. "Impact of BMI and PRP Platelet and Red Blood Cell Content on the Coagulation Kinetics of Ortho-R/PRP Mixtures" Polymers 17, no. 11: 1515. https://doi.org/10.3390/polym17111515
APA StyleChevrier, A., & Lavertu, M. (2025). Impact of BMI and PRP Platelet and Red Blood Cell Content on the Coagulation Kinetics of Ortho-R/PRP Mixtures. Polymers, 17(11), 1515. https://doi.org/10.3390/polym17111515