
Effect of Prepreg Composition on the Structure and Shear Strength of PEI/CF Laminates Fabricated by Ultrasonic Additive Manufacturing

 , ,
, ,  ,
, 
Abstract
1. Introduction
2. Materials and Methods
2.1. Materials
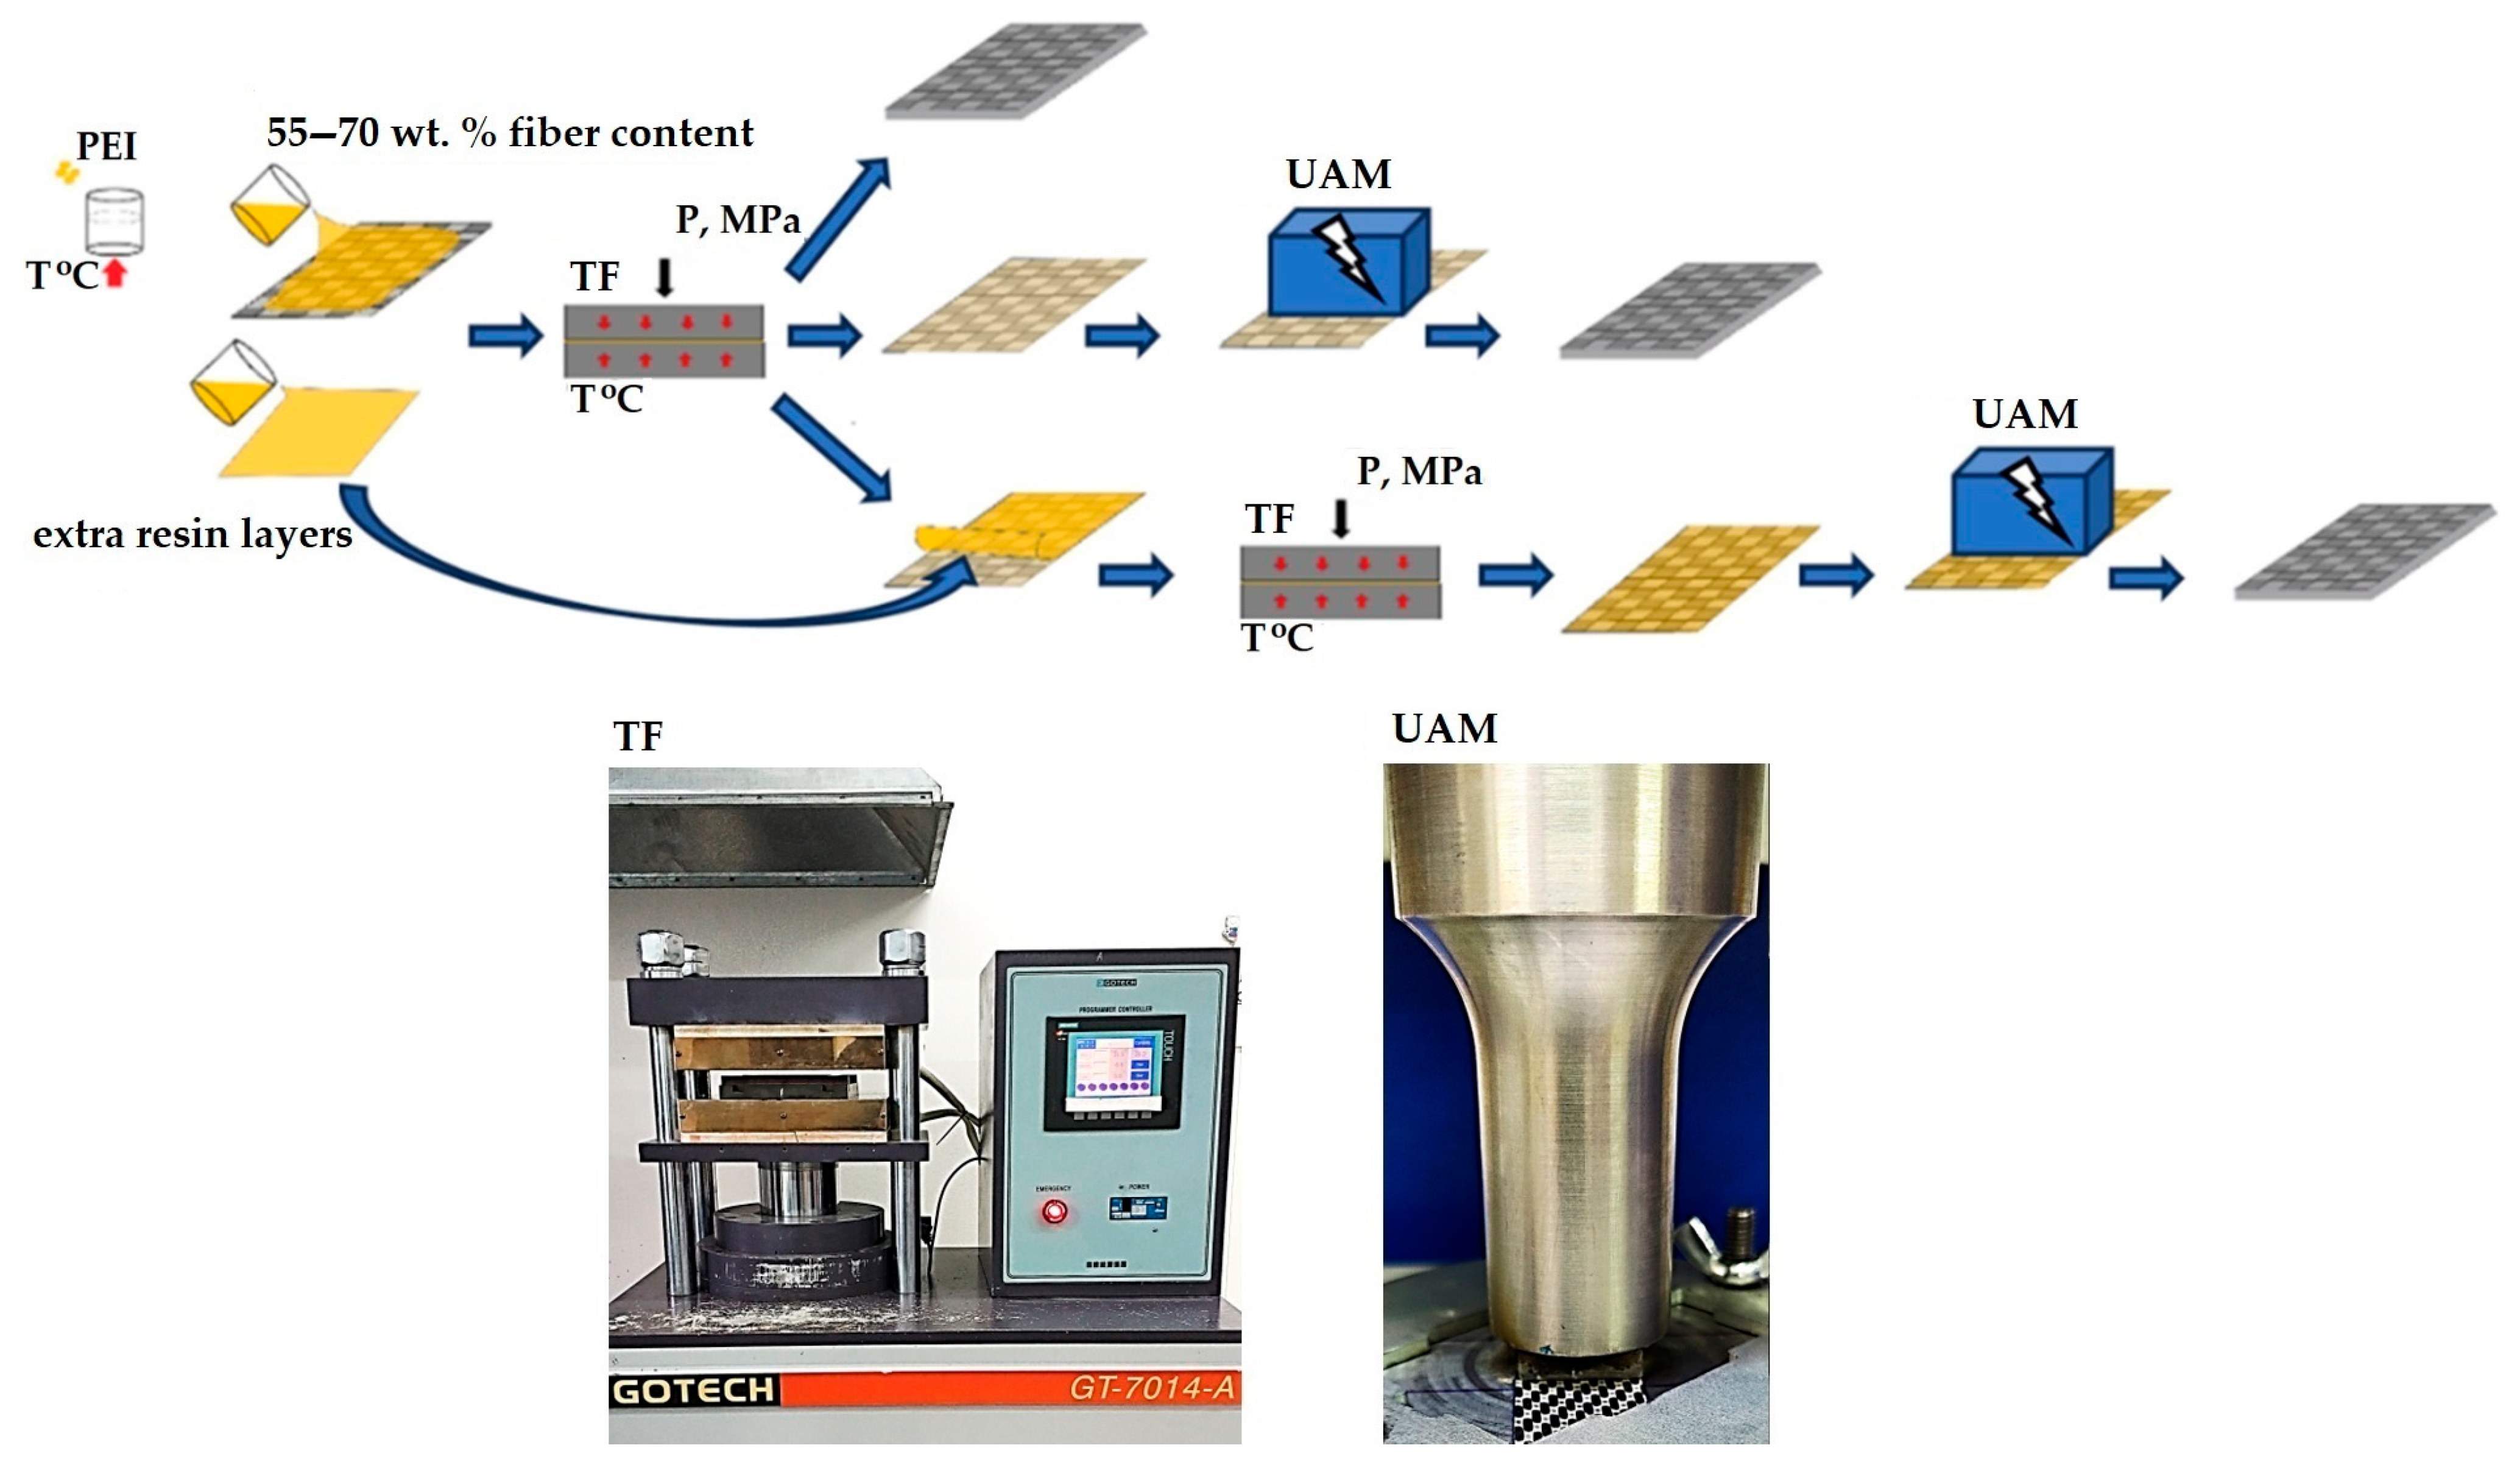
2.2. Prepreg Fabrication
2.3. Laminate Thermoforming
2.4. UAM Procedures
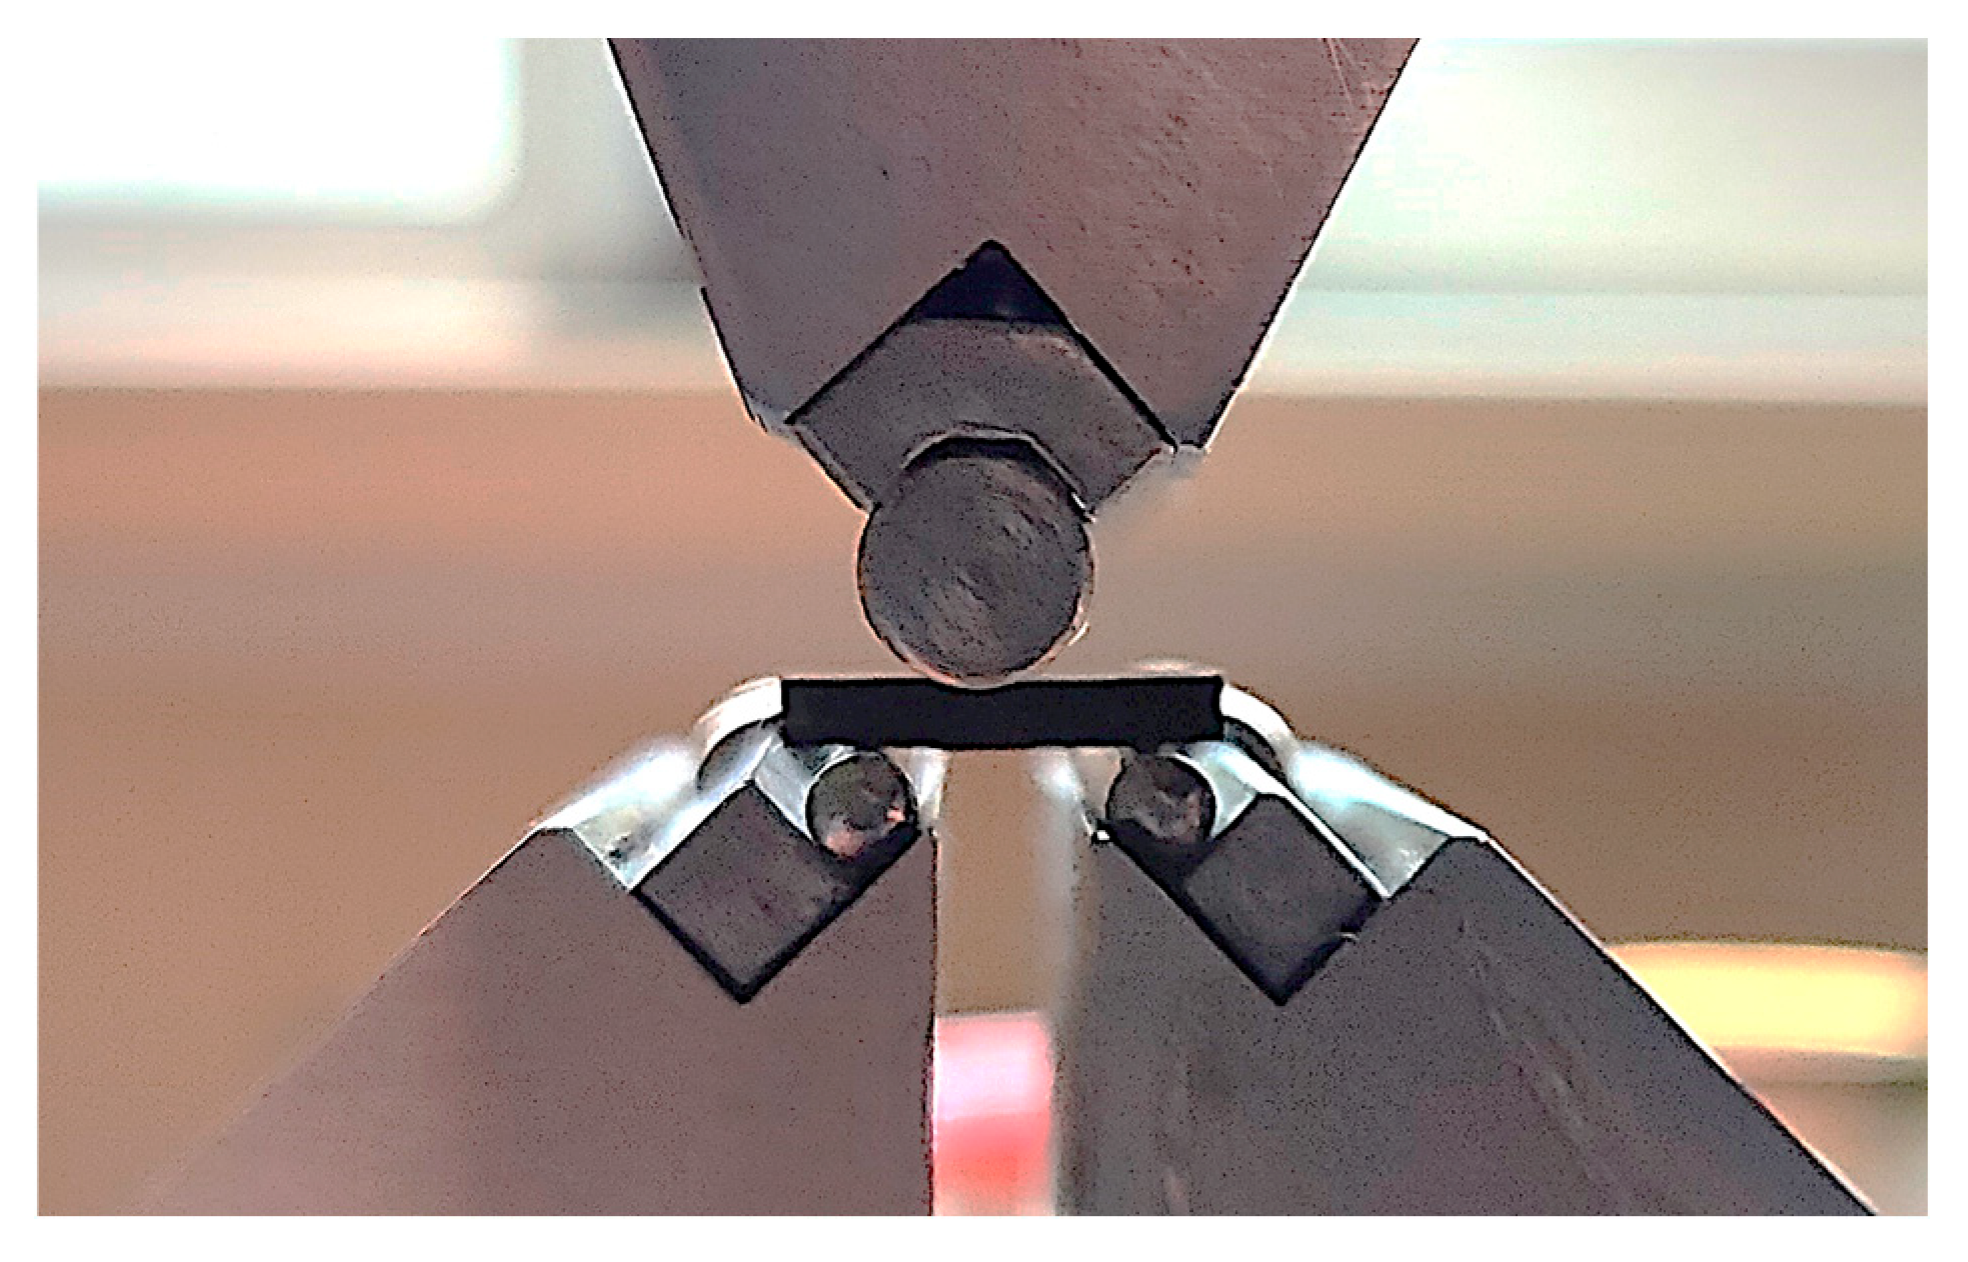
2.5. Mechanical Tests
2.6. Structure Characterization
3. Results and Discussion
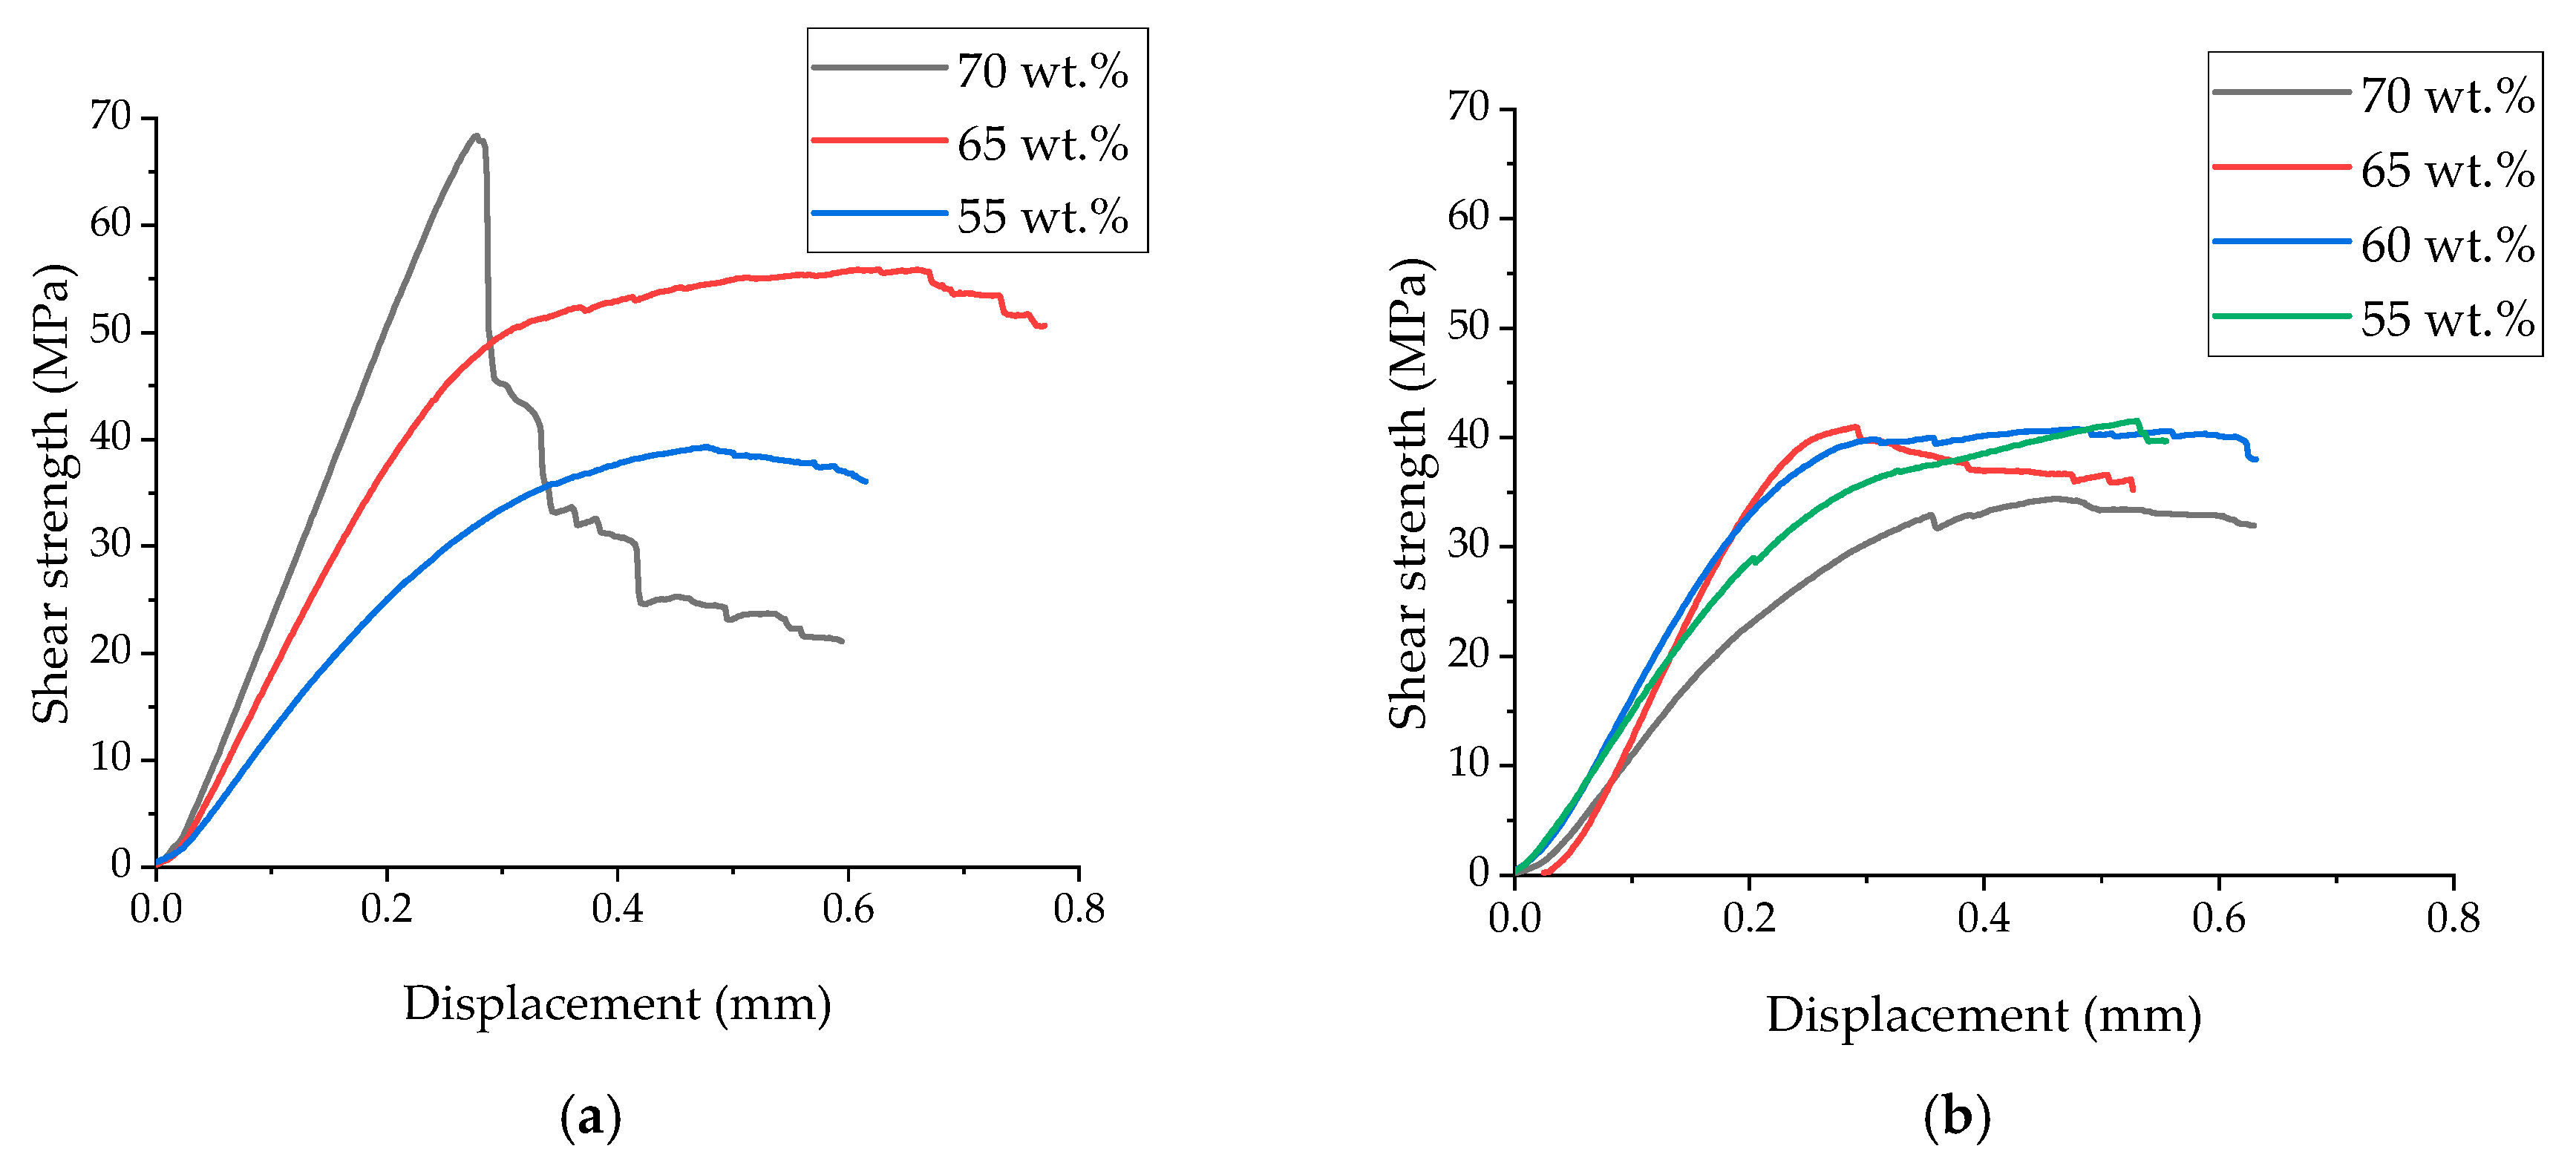
3.1. Varying Binder Contents in the Prepregs
3.2. Varying Extra Resin Layer Thicknesses
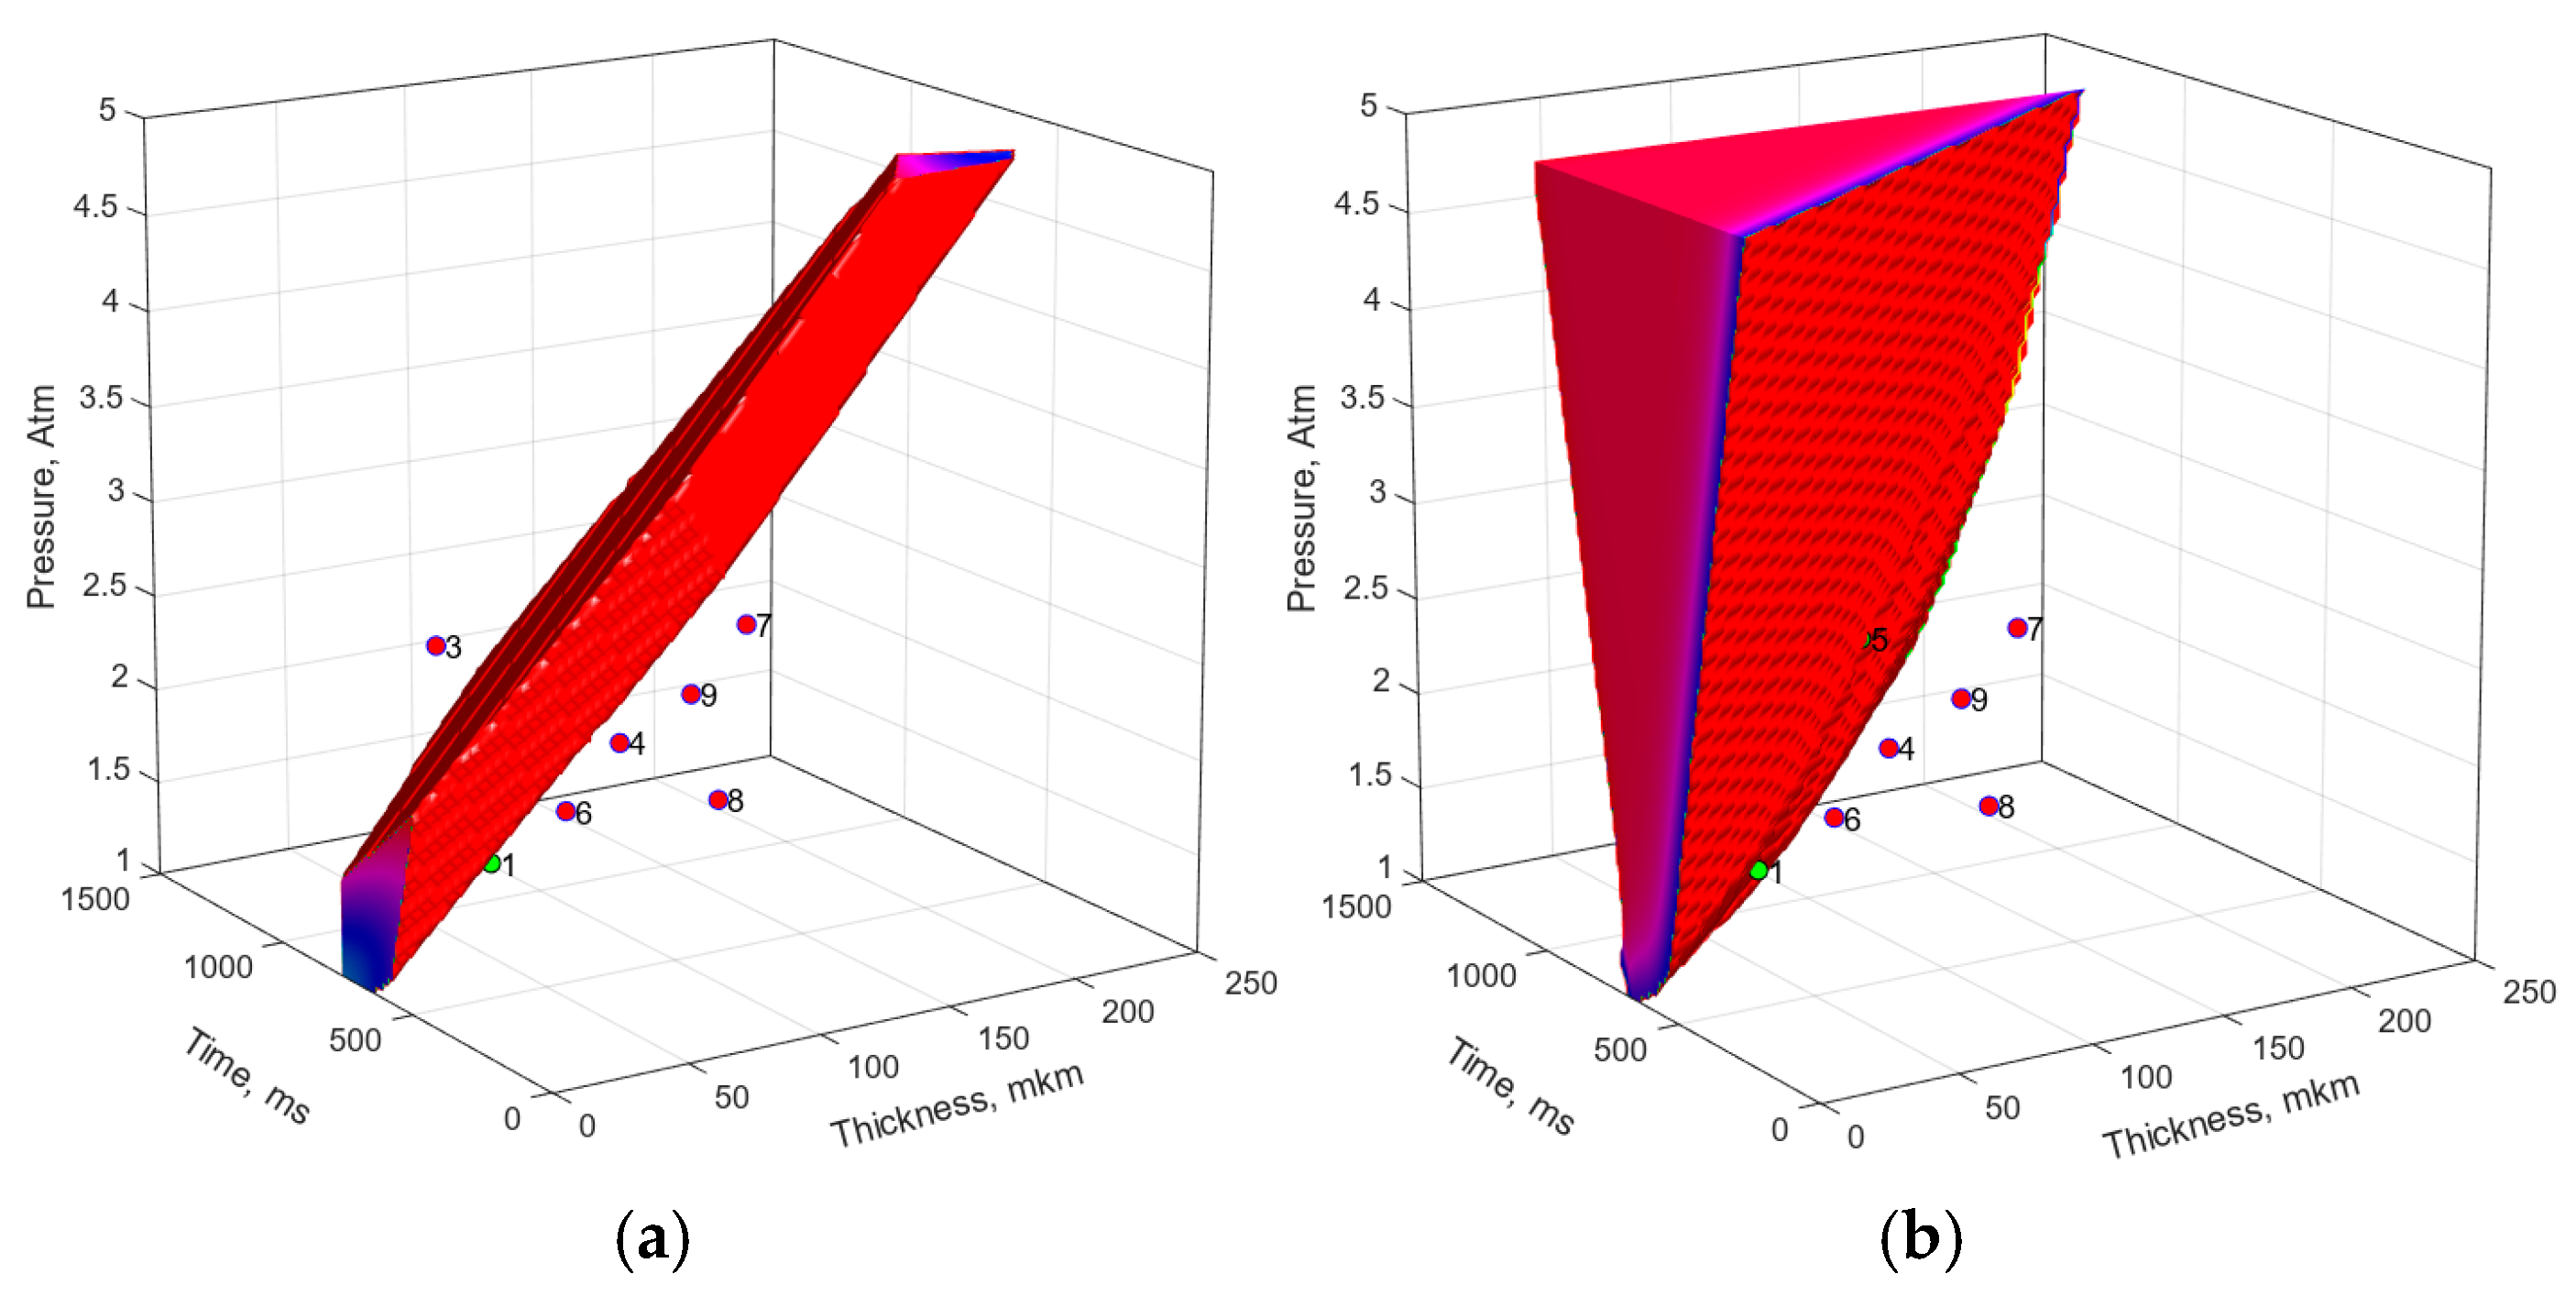
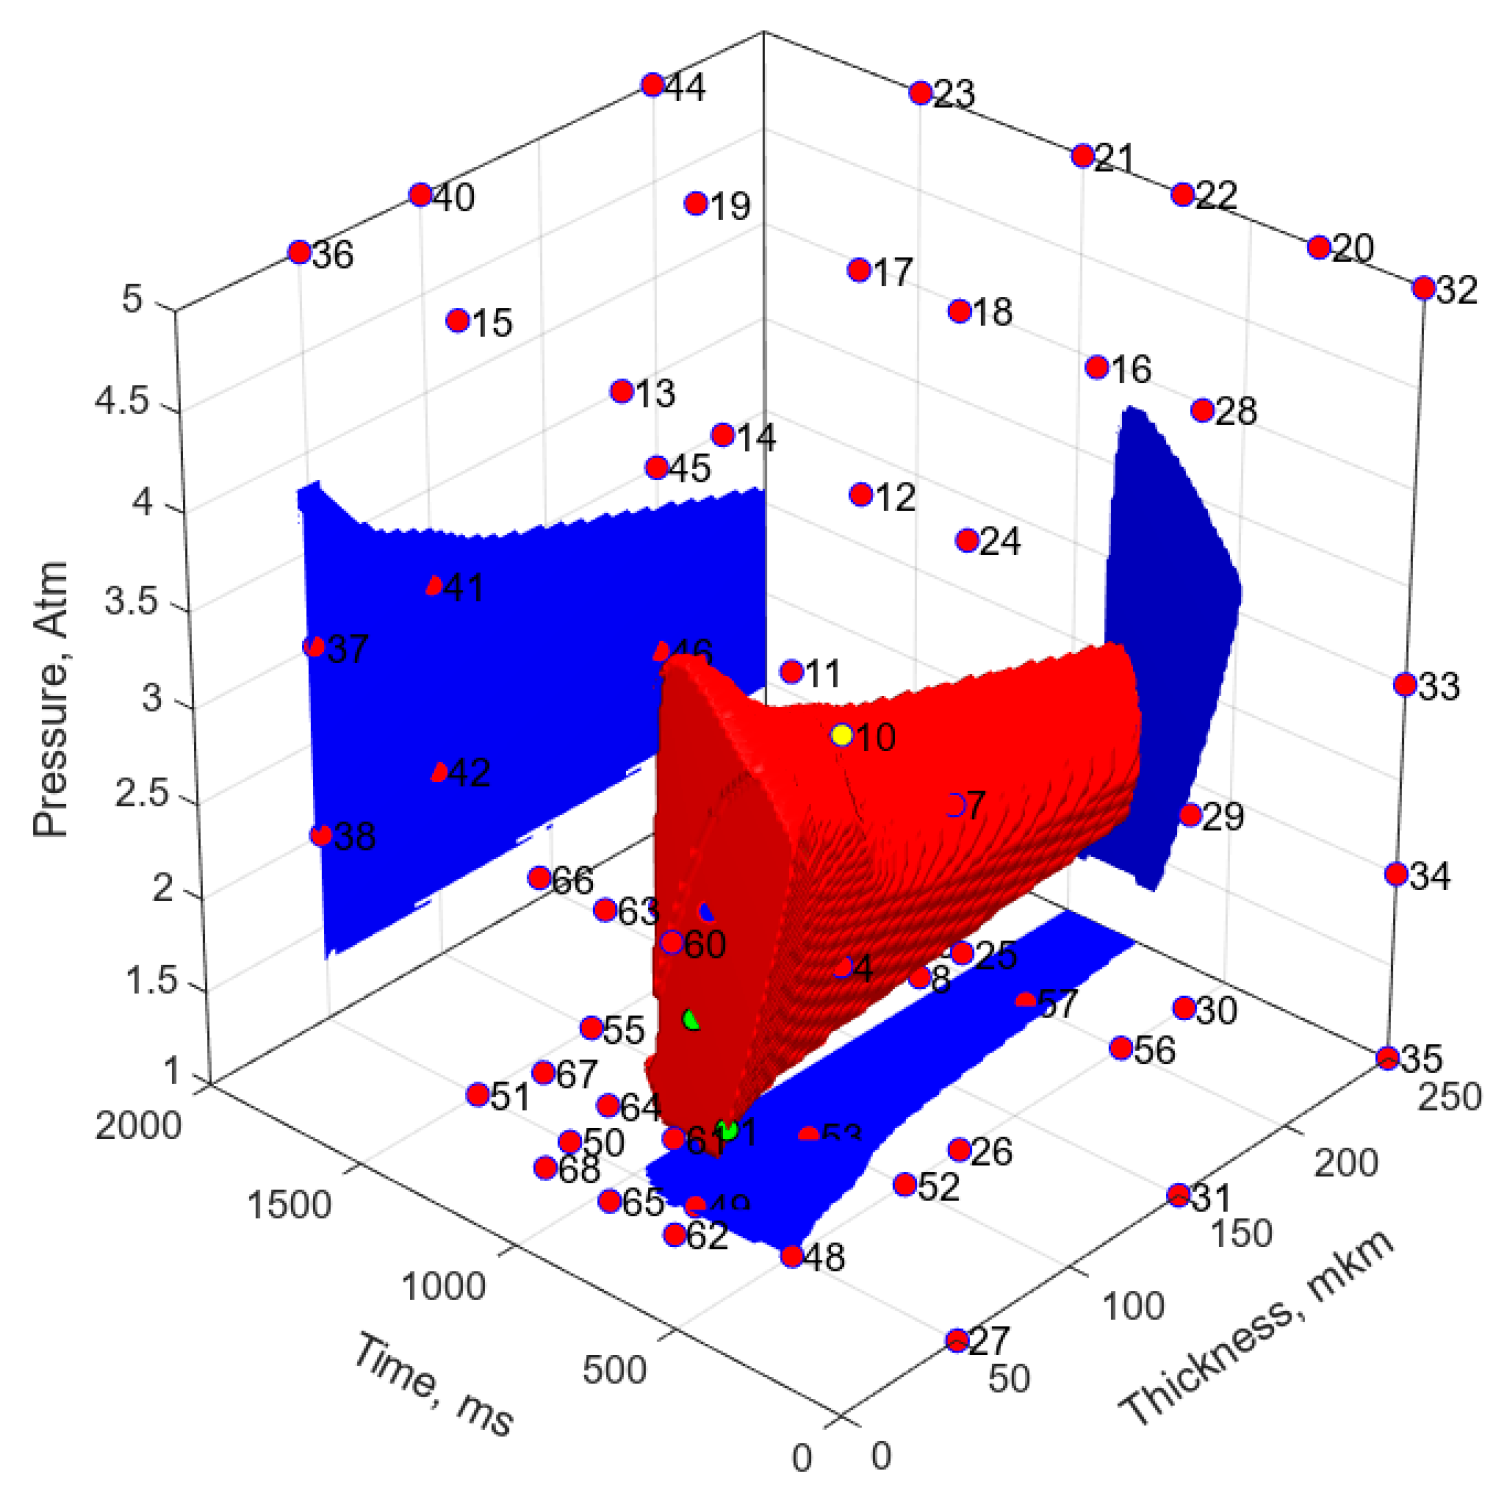
3.3. Artificial Neural Network (ANN) Modeling
- The UAM process could not develop at short durations, as well as at insufficiently low or excessively high clamping pressures. In such cases, both shapes and dimensions of laminates would be unchanged, while their shear strengths would be minimal;
- At too-long UAM durations, laminates would be partially or completely damaged.
4. Discussion
5. Conclusions
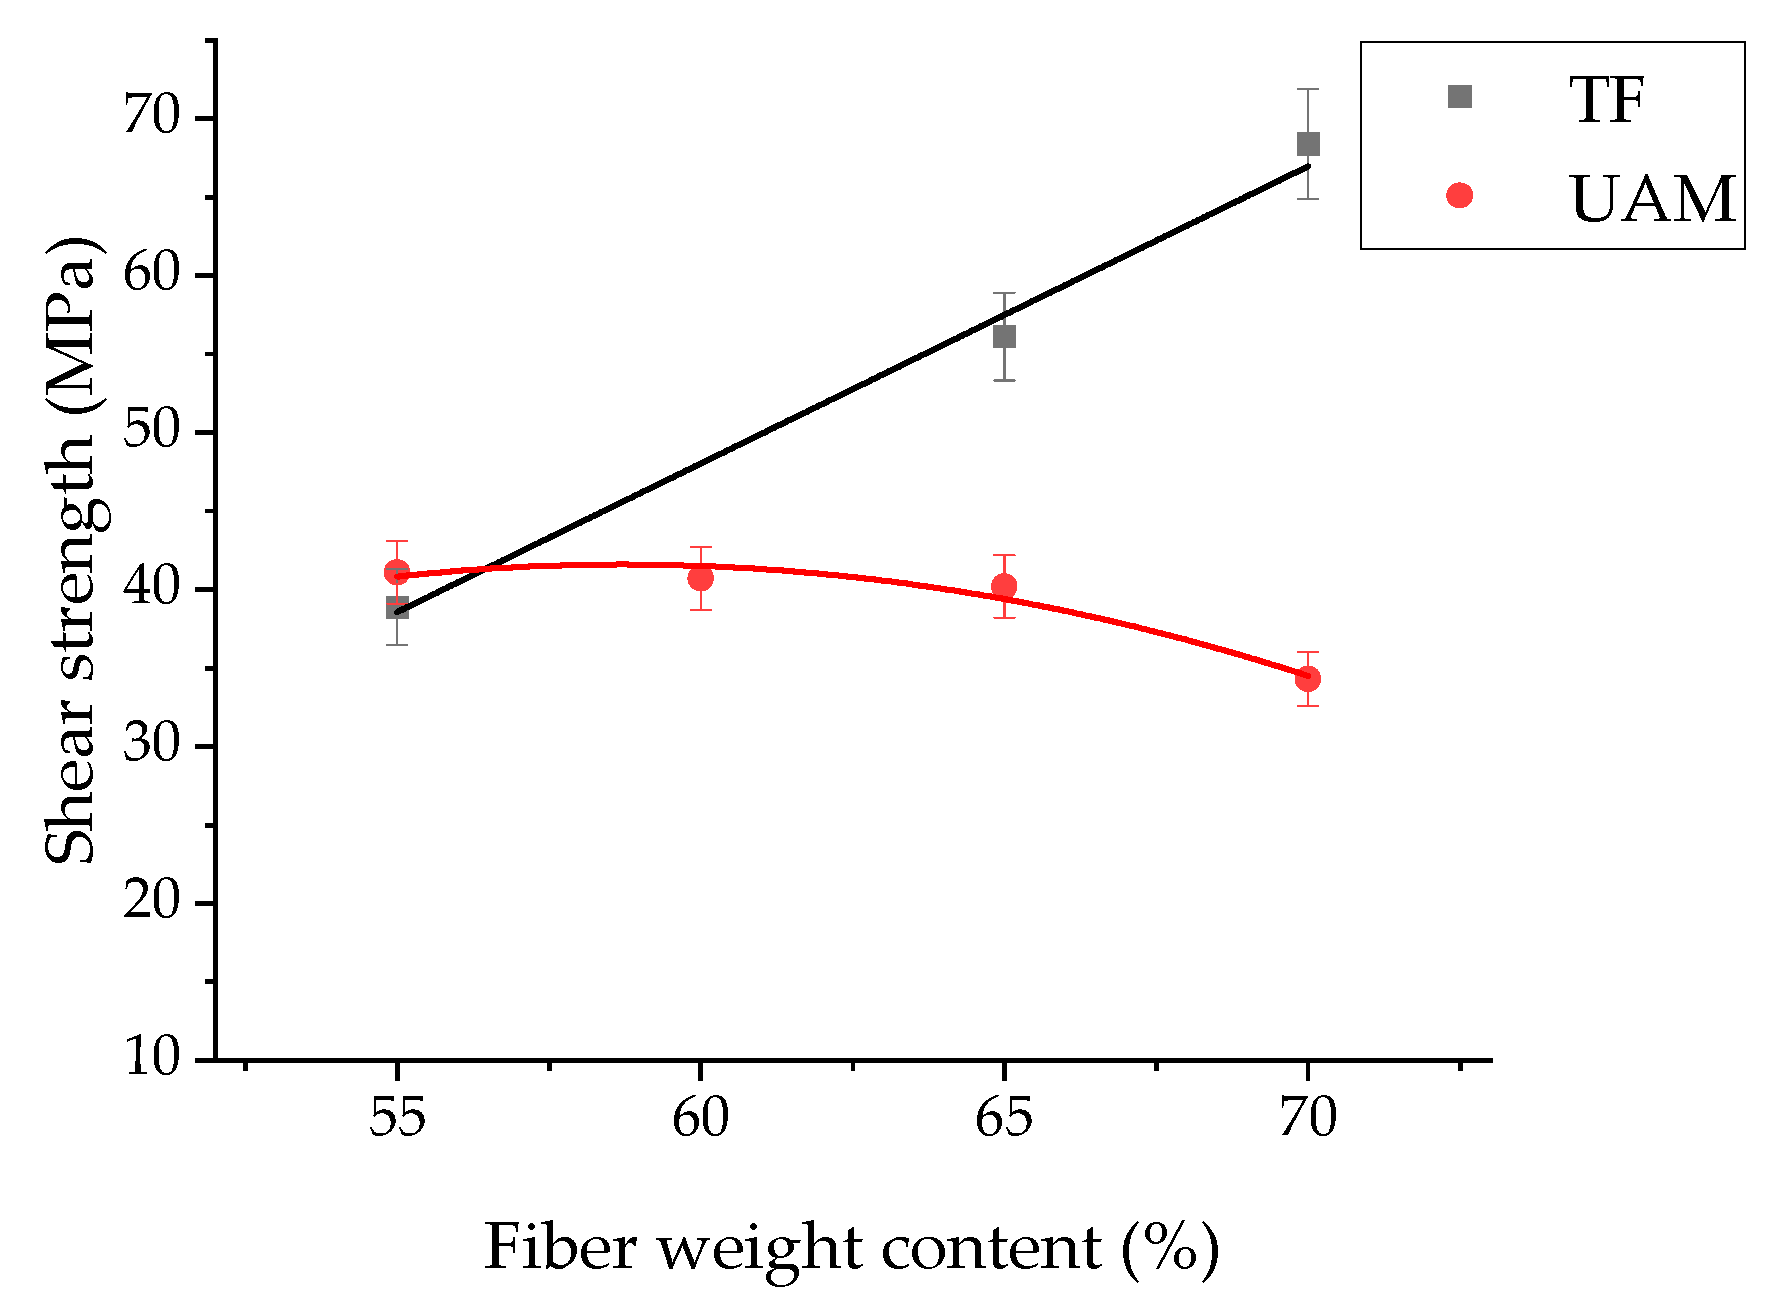
- The UAM laminates with CF contents above 55 wt.% possessed shear strengths lower by 40% in comparison with those of the TF ones, due to the insufficient amount of the binder in the prepregs to form reliable interlaminar joints;
- For enhancing the shear strength of UAM laminates up to the levels of the TF ones, extra resin layers with thicknesses of 50, 100, and 150 μm were deposited. By ranking the UAM parameters using the Taguchi L9 method, it was possible to increase the shear strengths by 30% relative to those of the trial laminates. Further improvements were achieved by artificial neural network modeling;
- According to the results obtained by the artificial neural network modeling, the use of the 50 µm thick extra resin layer allowed us to increase the shear strengths up to 50% relative to those of the trial laminates at a CF content of 70 wt.%. This improvement was achieved via minimizing the number of defects at the interlaminar interfaces;
- The dependences of both mechanical and structural characteristics of the laminates on the UAM parameters were essentially nonlinear. For their analysis and the optimization of the UAM parameters, direct propagation neural networks with the minimal architecture were used. Under the ultra-small sample conditions, the use of a priori knowledge enabled us to predict the results rather accurately.
Author Contributions
Funding
Institutional Review Board Statement
Data Availability Statement
Conflicts of Interest
References
- Xu, X.; Peng, G.; Zhang, B.; Shi, F.; Gao, L.; Gao, J. Material performance, manufacturing methods, and engineering applications in aviation of carbon fiber reinforced polymers: A comprehensive review. Thin-Walled Struct. 2025, 209, 112899. [Google Scholar] [CrossRef]
- Zhang, J.; Lin, G.; Vaidya, U.; Wang, H. Past, present and future prospective of global carbon fibre composite developments and applications. Compos. Part B Eng. 2022, 250, 110463. [Google Scholar] [CrossRef]
- Vogiantzi, C.; Tserpes, K. A Comparative Environmental and Economic Analysis of Carbon Fiber-Reinforced Polymer Recycling Processes Using Life Cycle Assessment and Life Cycle Costing. J. Compos. Sci. 2025, 9, 39. [Google Scholar] [CrossRef]
- Liu, G.; Xiong, Y.; Zhou, L. Additive manufacturing of continuous fiber reinforced polymer composites: Design opportunities and novel applications. Compos. Commun. 2021, 27, 100907. [Google Scholar] [CrossRef]
- Karaş, B.; Smith, P.J.; Fairclough, J.P.A.; Mumtaz, K. Additive manufacturing of high density carbon fibre reinforced polymer composites. Addit. Manuf. 2022, 58, 103044. [Google Scholar] [CrossRef]
- Butenegro, J.A.; Bahrami, M.; Swolfs, Y.; Ivens, J.; Martínez, M.Á.; Abenojar, J. Novel Sustainable Composites Incorporating a Biobased Thermoplastic Matrix and Recycled Aerospace Prepreg Waste: Development and Characterization. Polymers 2023, 15, 3447. [Google Scholar] [CrossRef]
- Ateeq, M.; Shafique, M.; Azam, A.; Rafiq, M. A review of 3D printing of the recycled carbon fiber reinforced polymer composites: Processing, potential, and perspectives. J. Mater. Res. Technol. 2023, 26, 2291–2309. [Google Scholar] [CrossRef]
- Centea, T.; Grunenfelder, L.K.; Nutt, S.R. A review of out-of-autoclave prepregs–Material properties, process phenomena, and manufacturing considerations. Compos. Part A 2015, 70, 132–154. [Google Scholar] [CrossRef]
- Brasington, A.; Sacco, C.; Halbritter, J.; Wehbe, R.; Harik, R. Automated fiber placement: A review of history, current technologies, and future paths forward. Compos. Part C Open Access 2021, 6, 100182. [Google Scholar] [CrossRef]
- Timoshkov, P.N.; Goncharov, V.A.; Usacheva, M.N.; Khrulkov, A.V. Influence of technological parameters on characteristics of polymer composite materials in automated layup of prepregs (review). Publ. Proc. VIAM 2021, 6, 100. [Google Scholar] [CrossRef]
- Deng, B.; Shi, Y.; Yu, T.; Zhao, P. Influence Mechanism and Optimization Analysis of Technological Parameters for the Composite Prepreg Tape Winding Process. Polymers 2020, 12, 1843. [Google Scholar] [CrossRef] [PubMed]
- Timoshkov, P.N.; Goncharov, V.A.; Usacheva, M.N.; Khrulkov, A.V. The development of automated laying: From the beginning to our days (review) Part 1. Automated Tape Laying (ATL). Publ. Proc. VIAM 2021, 2, 63. [Google Scholar] [CrossRef]
- Wang, Y.; Rao, Z.; Liao, S.; Wang, F. Ultrasonic welding of fiber reinforced thermoplastic composites: Current understanding and challenges. Compos. Part A 2021, 149, 106578. [Google Scholar] [CrossRef]
- Unnikrishnan, T.G.; Kavan, P. A review study in ultrasonic-welding of similar and dissimilar thermoplastic polymers and its composites. Mater. Today Proc. 2022, 56, 3294–3300. [Google Scholar] [CrossRef]
- Jongbloed, B.; Teuwen, J.; Villegas, I.F. On the use of a rounded sonotrode for the welding of thermoplastic composites. J. Adv. Join. Process. 2023, 7, 100144. [Google Scholar] [CrossRef]
- Jongbloed, B.; Vinod, R.; Teuwen, J.; Benedictus, R.; Villegas, I.F. Improving the quality of continuous ultrasonically welded thermoplastic composite joints by adding a consolidator to the welding setup. Compos. Part A 2022, 155, 106808. [Google Scholar] [CrossRef]
- Brito, C.B.G.; Teuwen, J.; Dransfeld, C.; Villegas, I.F. The effects of misaligned adherends on static ultrasonic welding of thermoplastic composites. Compos. Part A 2022, 155, 106810. [Google Scholar] [CrossRef]
- Yang, Y.; Li, Y.; Liu, Z.; Li, Y.; Ao, S.; Luo, Z. Ultrasonic welding of short carbon fiber reinforced PEEK with spherical surface anvils. Compos. Part B 2022, 231, 109599. [Google Scholar] [CrossRef]
- Khatri, B.; Roth, M.F.; Balle, F. Ultrasonic Welding of Additively Manufactured PEEK and Carbon Fiber-Reinforced PEEK with Integrated Energy Directors. J. Manuf. Mater. Process 2023, 7, 2. [Google Scholar] [CrossRef]
- Tsiangou, E.; Teixeira de Freitas, S.; Villegas, I.F.; Benedictus, R. Ultrasonic welding of epoxy- to polyetheretherketone- based composites: Investigation on the material of the energy director and the thickness of the coupling layer. J. Compos. Mater. 2020, 54, 3081–3098. [Google Scholar] [CrossRef]
- Gohel, G.; Soh, C.Z.; Leong, K.F.; Gerard, P.; Bhudolia, S.K. Effect of PMMA Coupling Layer in Enhancing the Ultrasonic Weld Strength of Novel Room Temperature Curable Acrylic Thermoplastic to Epoxy Based Composites. Polymers 2022, 14, 1862. [Google Scholar] [CrossRef] [PubMed]
- Wang, X.; Quan, D.; Yue, D.; Liu, J.; Pan, J.; Zhao, G. Realizing ultrahigh strength and excellent stability of ultrasonically welded joints upon co-consolidating an extra resin layer (eRL) on the thermoplastic composites. Compos. Part A 2024, 187, 108475. [Google Scholar] [CrossRef]
- Tsiangou, E.; de Freitas, S.T.; Benedictus, R.; Villegas, I.F. On the sensitivity of the ultrasonic welding process of epoxy-to polyetheretherketone (PEEK)-based composites to the welding force and amplitude of vibrations. Compos. Part C Open Access 2021, 5, 100141. [Google Scholar] [CrossRef]
- Tsiangou, E.; Kupski, J.; de Freitas, S.T.; Benedictus, R.; Villegas, I.F. On the sensitivity of ultrasonic welding of epoxy- to polyetheretherketone (PEEK)-based composites to the heating time during the welding process. Compos. Part A 2021, 144, 106334. [Google Scholar] [CrossRef]
- Panin, S.V.; Stepanov, D.Y.; Byakov, A.V. Optimizing Ultrasonic Welding Parameters for Multilayer Lap Joints of PEEK and Carbon Fibers by Neural Network Simulation. Materials 2022, 15, 6939. [Google Scholar] [CrossRef]
- Gong, J.; Saeed, N.; Huang, X.; Tian, W.; Li, L.; Song, J. Influences of Fiber Volume Content on the Mechanical Properties of 2D Plain Carbon-Fiber Woven Composite Materials. Polymers 2024, 16, 108. [Google Scholar] [CrossRef]
- Alexenko, V.O.; Panin, S.V.; Stepanov, D.Y.; Byakov, A.V.; Bogdanov, A.A.; Buslovich, D.G.; Panin, K.S.; Tian, D. Ultrasonic Welding of PEEK Plates with CF Fabric Reinforcement—The Optimization of the Process by Neural Network Simulation. Materials 2023, 16, 2115. [Google Scholar] [CrossRef]
- Stepanov, D.Y.; Tian, D.; Alexenko, V.O.; Panin, S.V.; Buslovich, D.G. Application of Neural Network Models with Ultra-Small Samples to Optimize the Ultrasonic Consolidation Parameters for ‘PEI Adherend/Prepreg (CF-PEI Fabric)/PEI Adherend’ Lap Joints. Polymers 2024, 16, 451. [Google Scholar] [CrossRef]
- Wang, W.; Zhang, J.; Gao, D.; Yu, K.; Liu, G.; Wang, M.; Yao, J. The Effect of Resin Matrix on the Properties of CF/PEI and CF/PAEK Thermoplastic Composites. Int. J. Polym. Sci. 2023, 1, 1–13. [Google Scholar] [CrossRef]
- Dai, S.C.; Ye, L. Characteristics of CF/PEI tape winding process with on-line consolidation. Compos. Part A 2002, 33, 1227–1238. [Google Scholar] [CrossRef]
- Rajasekaran, A.; Shadmehri, F. Steering of carbon fiber/PEEK tapes using Hot Gas Torch-assisted automated fiber placement. J. Thermoplast. Compos. Mater. 2022, 36, 1651–1679. [Google Scholar] [CrossRef] [PubMed]
- Stokes-Griffin, C.M.; Compston, P. Investigation of sub-melt temperature bonding of carbon-fibre/PEEK in an automated laser tape placement process. Compos. Part A 2016, 84, 17–25. [Google Scholar] [CrossRef]
- Tobin, E.; Ma, H.; O’Higgins, R.M.; Weaver, P.M. Effect of automated tape placement pass frequency on matrix-dominated mechanical properties and microstructure of wound CF/PEEK. Compos. Part A 2025, 194, 108901. [Google Scholar] [CrossRef]
- Dong, N.; Luan, C.; Yao, X.; Ding, Z.; Ji, Y.; Niu, C.; Zheng, Y.; Xu, Y.; Fu, J. Influence of process parameters on the interlaminar shear strength of CF/PEEK composites in-situ consolidated by laser-assisted automated fiber placement. Compos. Sci. Technol. 2024, 258, 110902. [Google Scholar] [CrossRef]
- Villegas, I.F. Ultrasonic welding of thermoplastic composites. Front. Mater. 2019, 6, 291. [Google Scholar] [CrossRef]
- Jongbloed, B.; Teuwen, J.; Palardy, G.; Villegas, I.F.; Benedictus, R. Continuous ultrasonic welding of thermoplastic composites: Enhancing the weld uniformity by changing the energy director. J. Compos. Mater. 2019, 54, 2023–2035. [Google Scholar] [CrossRef]
- Koutras, N.; Amirdine, J.; Boyard, N.; Villegas, I.F. Benedictus Characterization of crystallinity at the welding interface of ultrasonically welded carbon fibre PPS joints. Compos. Part A 2019, 125, 105574. [Google Scholar] [CrossRef]
- Palardy, G.; Villegas, I.F. On the effect of flat energy director thickness on heat generation during ultrasonic welding of thermoplastic composites. Compos. Interfaces 2017, 24, 203–214. [Google Scholar] [CrossRef]
- Tian, D.; Alexenko, V.O.; Panin, S.V.; Bogdanov, A.A.; Buslovich, D.G. Effect of the Energy Director Material on the Structure and Properties of UltrasonicWelded Lap Joints of PEI Plates with CF Fabric/PEI Prepreg. J. Compos. Sci. 2024, 8, 150. [Google Scholar] [CrossRef]
- Panin, S.V.; Bochkareva, S.A.; Panov, I.L.; Alexenko, V.O.; Byakov, A.V.; Lyukshin, B.A. Experimental and Numerical Studies on the Tensile Strength of Lap Joints of PEEK Plates and CF Fabric Prepregs Formed by Ultrasonic Welding. In Progress in Continuum Mechanics; Altenbach, H., Irschik, H., Porubov, A.V., Eds.; Advanced Structured Materials; Springer: Cham, Switzerland, 2023; Volume 196, pp. 321–354. [Google Scholar] [CrossRef]
- Bhudolia, S.K.; Gohel, G.; Leong, K.F.; Islam, A. Advances in Ultrasonic Welding of Thermoplastic Composites: A Review. Materials 2020, 13, 1284. [Google Scholar] [CrossRef]
- Wanga, J.; Luc, C.; Xiaoa, C.; Chenga, J.; Rena, R.; Xiong, X. Heat distribution simulation and effects of ultrasonic welding amplitude on CF/PEI composite joint properties. Mater. Lett. 2023, 340, 134148. [Google Scholar] [CrossRef]


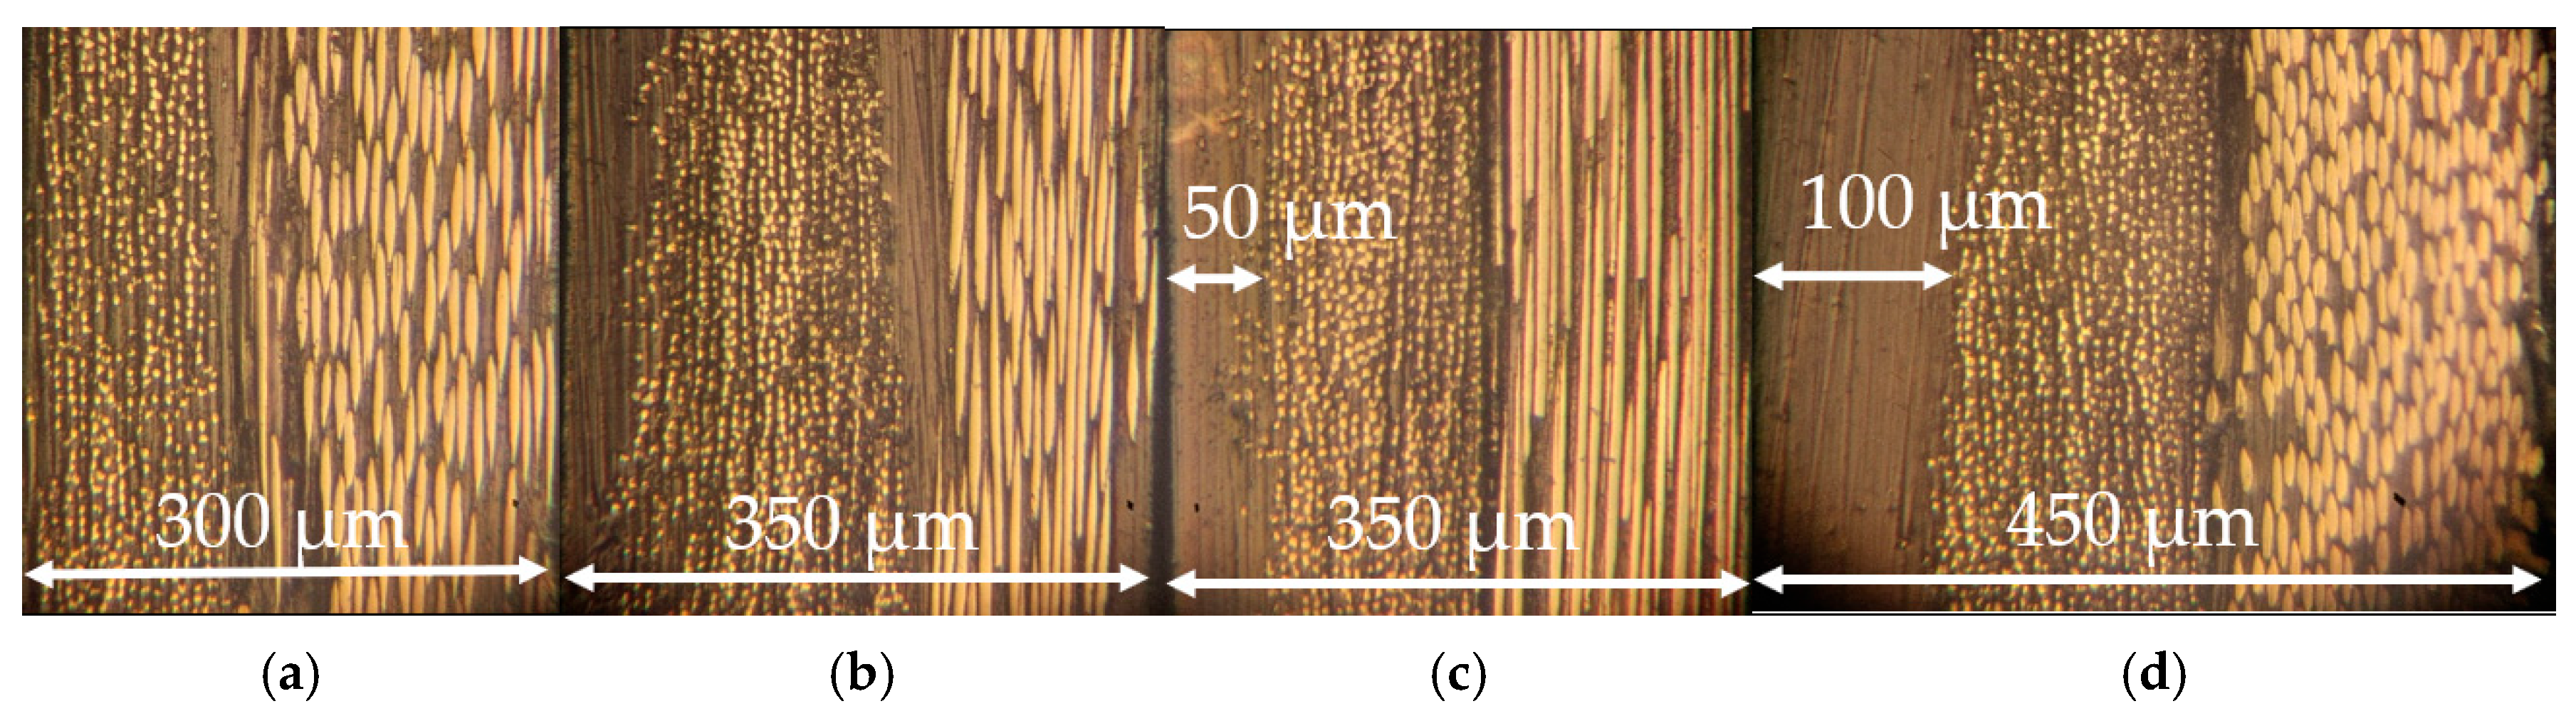
| Fiber Weight Fraction, % | Fiber Volume Fraction, % | Prepreg Thickness, µm |
|---|---|---|
| 70 ± 2 | 63 ± 2 | 300 ± 25 |
| 65 ± 2 | 58 ± 2 | 350 ± 25 |
| 60 ± 2 | 53 ± 2 | 400 ± 25 |
| 55 ± 2 | 48 ± 2 | 450 ± 25 |
| Experiment Number | Levels and Values of (Technological) Factors | ||
|---|---|---|---|
| Extra Resin Layer Thickness d, μm | USW Duration t, ms | Clamping Pressure P, atm | |
| 1 | 50 | 700 | 1.5 |
| 2 | 50 | 800 | 2.0 |
| 3 | 50 | 900 | 2.5 |
| 4 | 100 | 700 | 2.0 |
| 5 | 100 | 800 | 2.5 |
| 6 | 100 | 900 | 1.5 |
| 7 | 150 | 700 | 2.5 |
| 8 | 150 | 800 | 1.5 |
| 9 | 150 | 900 | 2.0 |
| No. | Shear Strength, MPa | Thickness Change Δd, µm |
|---|---|---|
| 1 | 40.6 ± 0.7 | 125 ± 15 |
| 2 | 37.0 ± 0.6 | 140 ± 15 |
| 3 | 33.8 ± 0.4 | 430 ± 30 |
| 4 | 43.5 ± 1.2 | 155 ± 30 |
| 5 | 41.3 ± 0.6 | 440 ± 20 |
| 6 | 38.1 ± 1.4 | 145 ± 15 |
| 7 | 45.2 ± 1.9 | 480 ± 10 |
| 8 | 39.1 ± 0.8 | 280 ± 30 |
| 9 | 43.2 ± 0.7 | 415 ± 15 |
| Level | Shear Strength, MPa | Thickness Change Δd, µm | ||||
|---|---|---|---|---|---|---|
| d | t | p | d | t | p | |
| 1 | 31.38 | 36.69 | 31.88 | 45.91 | 46.55 | 44.76 |
| 2 | 32.24 | 31.84 | 32.28 | 46.67 | 48.24 | 46.39 |
| 3 | 32.55 | 31.64 | 32.00 | 51.64 | 49.42 | 53.05 |
| 4 | 1.17 | 1.05 | 0.41 | 5.74 | 2.87 | 8.29 |
| 5 | 1 | 2 | 3 | 2 | 3 | 1 |
| Acceptable Limits | Optimal Range | |||
|---|---|---|---|---|
| Min | Max | Min | Max | |
| Parameters | ||||
| Extra resin layer thickness d, μm | 0 | 250 | ||
| UAM duration t, ms | 0 | 1500 | ||
| Clamping pressure P, atm | 1 | 5 | ||
| Characteristics | ||||
| Shear strength, MPa | 0 | 60 | 35 | 60 |
| Relative thickness change Rt | 0 | 2 | 0.82 | 1.05 |
| Porosity | 0 | 4 | 2 | 3.1 |
| Elastic modulus, GPa | 0 | 30 | 15 | 30 |
| Experiment Number | Extra Resin Layer Thickness d, μm | UAM Duration t, ms | Clamping Pressure P, atm |
|---|---|---|---|
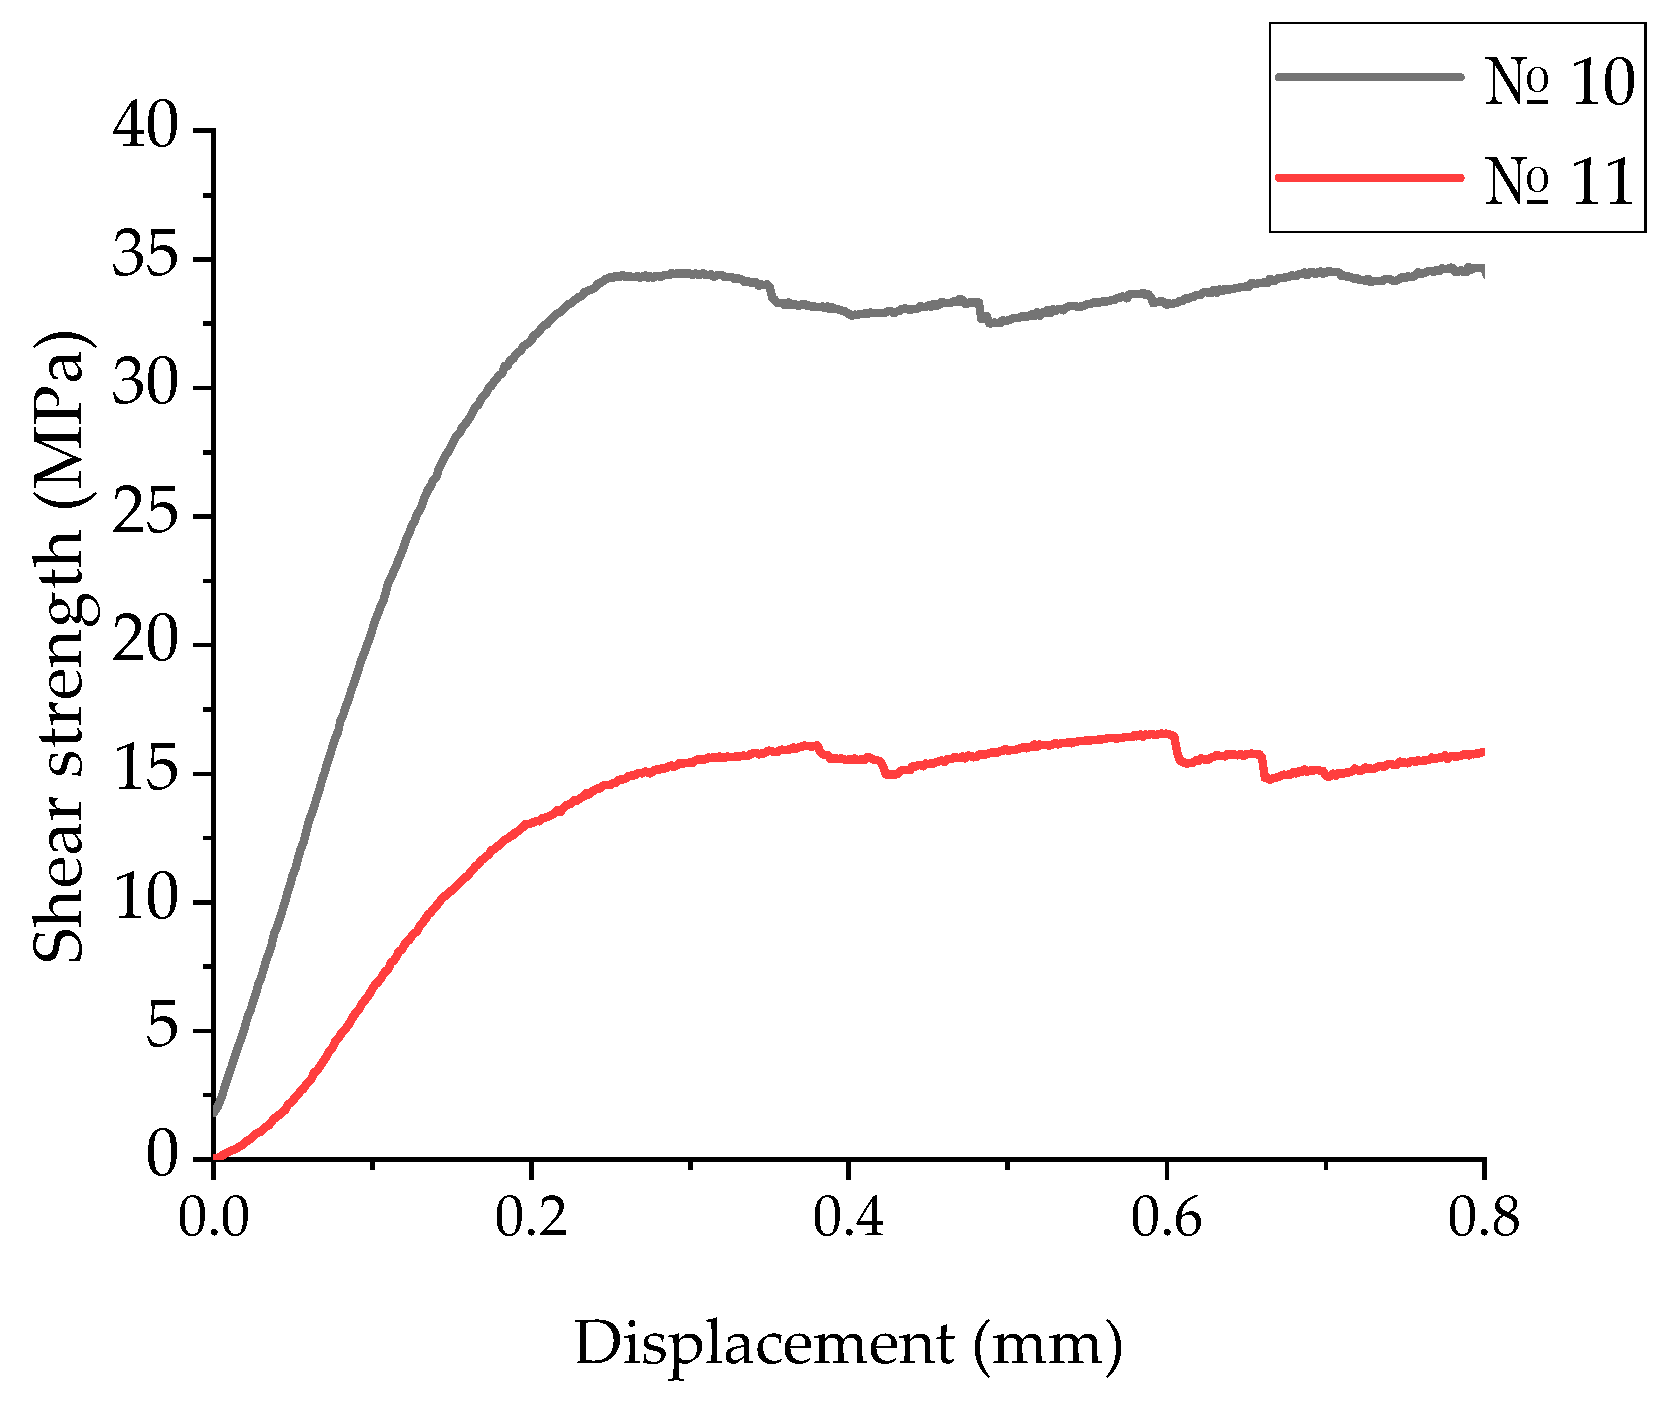
| 10 | 100 | 700 | 3.2 |
| 11 | 50 | 500 | 4.0 |
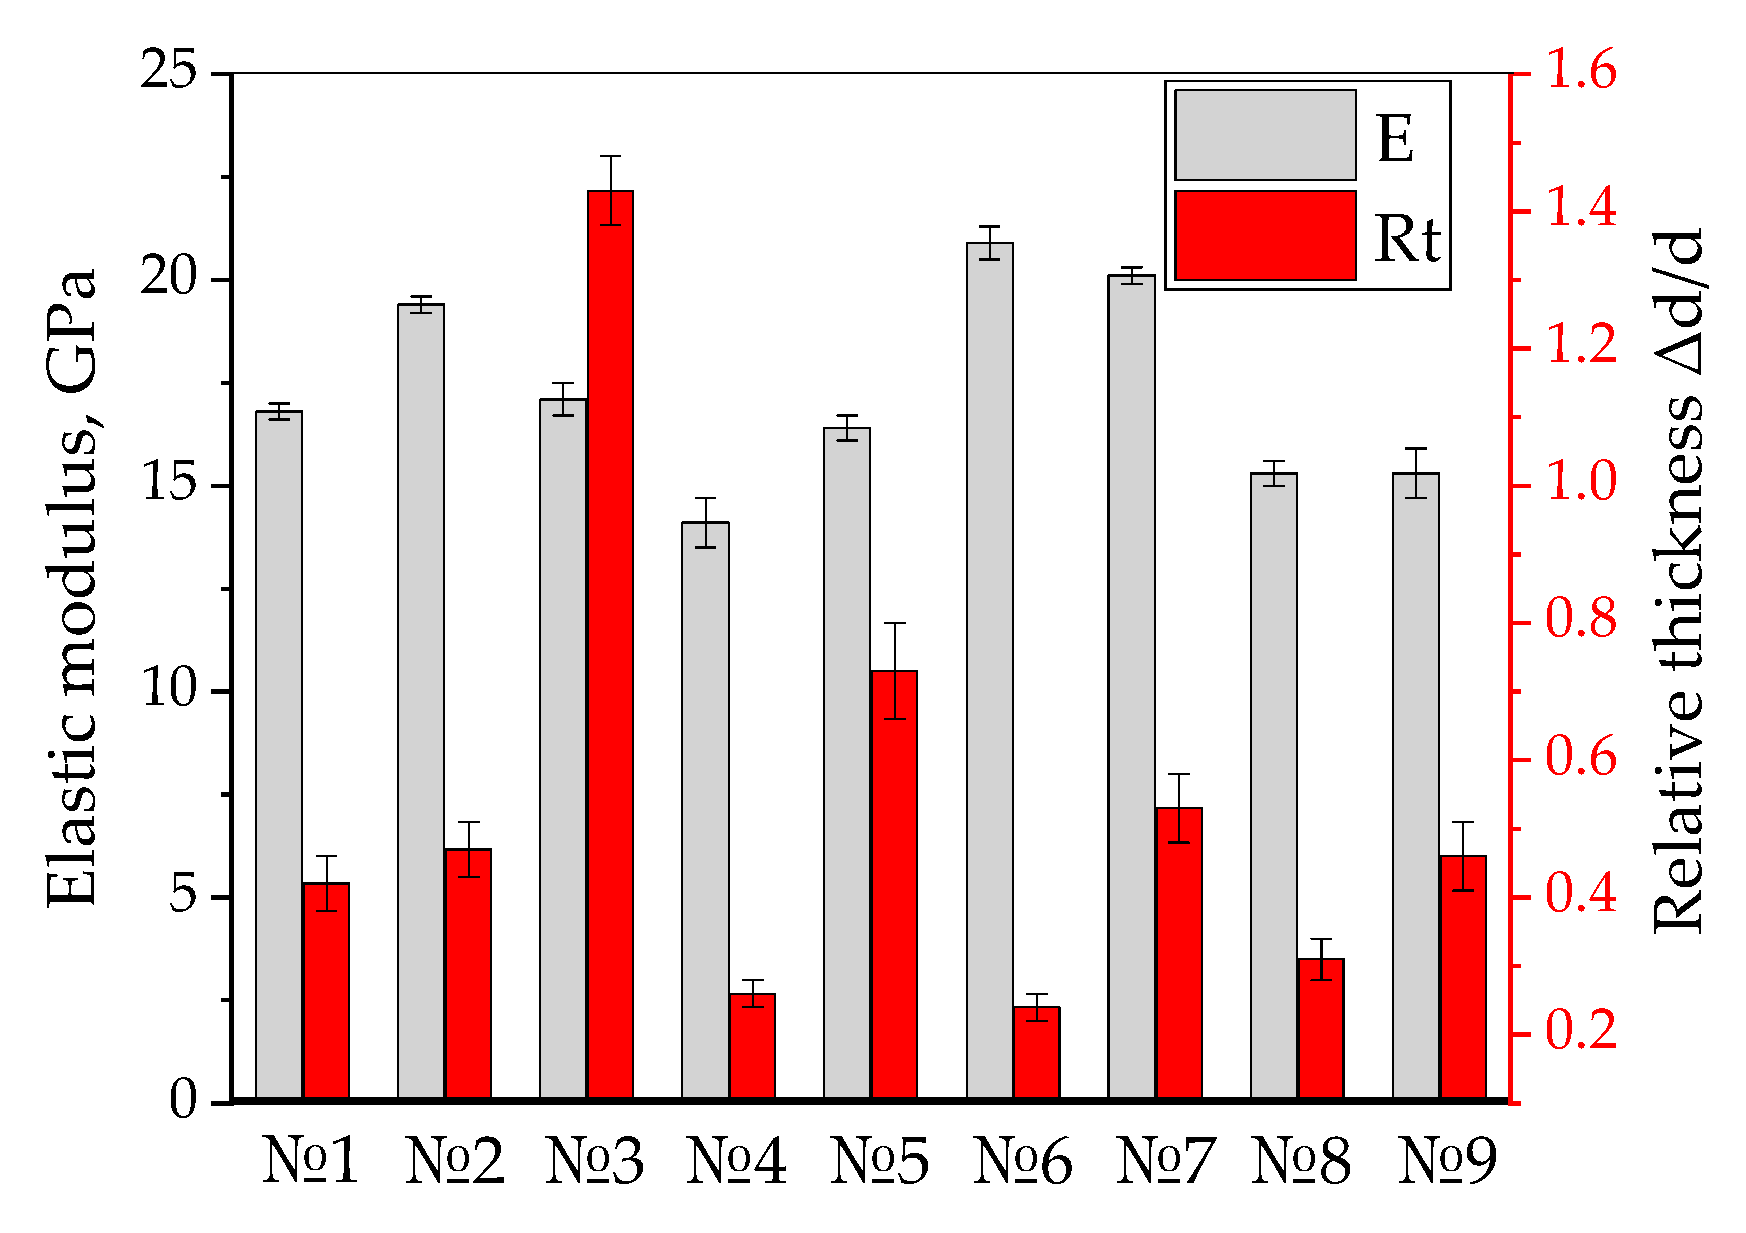
| Experiment Number | Shear Strength, MPa | Thickness Change Δd, µm | Elastic Modulus, GPa | Relative Thickness Change, Rt |
|---|---|---|---|---|
| 10 | 34.9 ± 3.1 | 330 ± 20 | 20.5 ± 0.8 | 0.55 |
| 11 | 14.5 ± 4.2 | 120 ± 20 | 6.1 ± 2.7 | 0.40 |
| Experiment Number | Extra Resin Layer Thickness d, μm | UAM Duration t, ms | Clamping Pressure P, atm |
|---|---|---|---|
| 12 | 50 | 750 | 2.6 |
| 13 | 100 | 1050 | 2.6 |
| Experiment Number | Shear Strength, MPa | Thickness Change Δd, µm | Elastic Modulus, GPa | Relative Thickness Rt |
|---|---|---|---|---|
| 12 | 53.4 ± 4.7 | 200 ± 30 | 20.0 ± 0.7 | 0.91 |
| 13 | 20.5 ± 0.5 | 360 ± 30 | 15.1 ± 1.1 | 0.60 |
| Experiment Number | Model | Shear Strength, MPa | Relative Thickness Change | Porosity | Elastic Modulus, GPa | MND | Classification Reliability |
|---|---|---|---|---|---|---|---|
| 10 | LRM | 42.7882 | 0.993 | 2.1727 | 16.8655 | 0.090 | 0.562 |
| 11 | 44.5494 | 1.1534 | 2.5687 | 16.2040 | 0.343 | ||
| 12 | 38.6165 | 1.0324 | 2.3783 | 17.1999 | 0.139 | ||
| 13 | 34.4574 | 1.0018 | 1.6864 | 18.1827 | 0.244 | ||
| 10 | FFNN 1 | 41.2134 | 0.8876 | 2.8687 | 13.6558 | 0.140 | 0.562 |
| 11 | 40.2628 | 0.922 | 2.9703 | 15.2465 | 0.313 | ||
| 12 | 38.5479 | 0.9827 | 2.9983 | 20.7444 | 0.077 | ||
| 13 | 35.2201 | 1.0336 | 2.0002 | 17.4245 | 0.225 | ||
| 12 | FFNN 2 | 39.919 | 0.978 | 2.715 | 21.240 | 0.093 | 0.875 |
| 13 | 9.820 | 0.803 | 0.023 | 0.000 | 0.428 |
| Manufacturing Method | Materials | Shear Strength, MPa | Relative Thickness |
|---|---|---|---|
| Thermoforming | CF/PEI unidirectional prepreg tape; matrix content is 37 wt.% | 86.7 | [29] |
| Hot air automated fiber placement | CF/PEI unidirectional prepreg tape; matrix content is 42 wt.% | 28.0 | [30] |
| Hot gas torch automated fiber placement | CF/PEEK unidirectional prepreg tape, fiber volume fraction of 60%, and thickness of 0.163 mm | 23.0 | [31] |
| Laser automated fiber placement | CF/PEEK unidirectional prepreg tape, fiber volume fraction of 60%, and thickness of 0.150 mm | 33.0 | [32] |
| Laser automated fiber placement | CF/PEEK unidirectional prepreg tape; thickness of 0.140 mm | 58.6 | [33] |
| Laser automated fiber placement | CF/PEEK unidirectional prepreg tape; resin weight fraction is 34% | 70.3 | [34] |
| Composite Type | Fracture Energy, MJ/m3 |
|---|---|
| TF—70 wt.% | 18.8 ± 0.7 |
| TF—65 wt.% | 33.2 ± 1.2 |
| TF—55 wt.% | 17.1 ± 1.0 |
| UAM—70 wt.% | 15.7 ± 0.7 |
| UAM—65 wt.% | 15.1 ± 0.5 |
| UAM—60 wt.% | 20.0 ± 0.5 |
| UAM—65 wt.% | 16.0 ± 0.6 |
Disclaimer/Publisher’s Note: The statements, opinions and data contained in all publications are solely those of the individual author(s) and contributor(s) and not of MDPI and/or the editor(s). MDPI and/or the editor(s) disclaim responsibility for any injury to people or property resulting from any ideas, methods, instructions or products referred to in the content. |
© 2025 by the authors. Licensee MDPI, Basel, Switzerland. This article is an open access article distributed under the terms and conditions of the Creative Commons Attribution (CC BY) license (https://creativecommons.org/licenses/by/4.0/).
Share and Cite
Tian, D.; Alexenko, V.O.; Stepanov, D.Y.; Buslovich, D.G.; Zelenkov, A.A.; Panin, S.V. Effect of Prepreg Composition on the Structure and Shear Strength of PEI/CF Laminates Fabricated by Ultrasonic Additive Manufacturing. Polymers 2025, 17, 1468. https://doi.org/10.3390/polym17111468
Tian D, Alexenko VO, Stepanov DY, Buslovich DG, Zelenkov AA, Panin SV. Effect of Prepreg Composition on the Structure and Shear Strength of PEI/CF Laminates Fabricated by Ultrasonic Additive Manufacturing. Polymers. 2025; 17(11):1468. https://doi.org/10.3390/polym17111468
Chicago/Turabian StyleTian, Defang, Vladislav O. Alexenko, Dmitry Yu. Stepanov, Dmitry G. Buslovich, Alexey A. Zelenkov, and Sergey V. Panin. 2025. "Effect of Prepreg Composition on the Structure and Shear Strength of PEI/CF Laminates Fabricated by Ultrasonic Additive Manufacturing" Polymers 17, no. 11: 1468. https://doi.org/10.3390/polym17111468
APA StyleTian, D., Alexenko, V. O., Stepanov, D. Y., Buslovich, D. G., Zelenkov, A. A., & Panin, S. V. (2025). Effect of Prepreg Composition on the Structure and Shear Strength of PEI/CF Laminates Fabricated by Ultrasonic Additive Manufacturing. Polymers, 17(11), 1468. https://doi.org/10.3390/polym17111468