3.1. Fabrication of Porous Architectures
First, we should analyze the challenges associated with printing vertical porous structures using FFF technology. FFF technology involves the deposition of molten polymer layer by layer, as controlled by a computer program, to form the final structure. This technique typically requires support structures when printing overhangs [
29]. However, vertical porous structures inevitably contain numerous overhangs. Printing these unsupported overhangs can lead to material deformation, while using supports would make it impossible to achieve the desired porous structures. Additionally, the precision of FFF is relatively low, as its motors cannot accurately control the extrusion output rate of the polymer. To address these issues, we propose two solutions. First, we could try to precisely adjust the relevant printing parameters, such as printing speed, printing temperature, and extrusion multiplier. Second, we can modify the pore shapes in the design to minimize overhangs.
In this work, as shown in
Figure 1a–e and
Figure S1a–e, we primarily designed two different pore shape models. One model has square pores, which are simpler to model, but as indicated by the red box in
Figure S2a, it includes some overhang structures. The other model has diamond-shaped pores, as shown in
Figure S2b. Although more challenging to model, its 45° inclined structure is not considered an overhang in FFF technology.
The porous architecture of oil–water separation materials plays a pivotal role, as an optimal pore design should selectively hinder water infiltration while allowing oil to pass through. As discussed in our previous work on invasion pressure theory [
30], larger pores generate weaker negative capillary forces, whereas smaller pores exhibit stronger capillary resistance. Consequently, different pore structures correspond to varying capacities for withstanding water pressure. Meanwhile, the pore size also influences the flow rate during oil–water separation, which will be further discussed in
Section 3.3: Oil–water separation experiment. In FFF technology, the minimum pore size is typically set to twice the nozzle diameter. In this study, a 0.4 mm diameter nozzle was used. Although a 0.2 mm nozzle provides higher precision, it is less commonly employed. Therefore, unless otherwise specified, l in
Figure 1 and
Figure S1 is set to 0.8 mm. To enhance flux while maintaining hydrophobicity, the number of pores should be maximized. Accordingly, w is set to 0.4 mm, corresponding to the 0.4 mm nozzle diameter.
In the first set of experiments, samples of square pore structures under various parameters, as detailed in
Table S1, were printed. Among these parameters, the rationale for the setting of t (the thickness of the wall) will be discussed in the diamond pore structure section. Printing speed, printing temperature, and extrusion multiplier are all set to the default recommended settings of the printer. To enhance model accuracy and facilitate observation, the layer height was set to a minimum of 0.05 mm, despite the longer printing time required. As shown in
Figure S1f,
S1 failed to form the intended pore structure, with horizontal layers completely covering the pores. This issue is attributed to the limited precision of FFF technology, where excessive filament extrusion occurs during printing. To improve print quality, adjustments to printing speed, temperature, and extrusion multiplier can be made. Reducing the printing speed enhances print quality [
31]. However, when printing microstructures, a speed below 30 mm/s leads to significant deterioration due to the insufficient precision of FFF motors, which struggle to extrude small amounts of polymer accurately at lower speeds. The layer covering of pores may also result from polymer stringing, which can be mitigated by lowering the printing temperature. The minimum printing temperature for PLA is 205 °C, as demonstrated in
S3 of Figure S1h, where reducing the temperature alleviates pore coverage. Adjusting the extrusion multiplier further controls polymer extrusion. When set to 0.9—the lowest practical limit—pore coverage is reduced, as shown in
S2 of Figure S1g, though significant polymer stringing remains. A combination of lowering both the temperature and extrusion multiplier (
S4 in Figure S1i) optimizes both pore coverage and stringing, yet notable defects and overhang issues persist. At this stage, all adjustable parameters have been explored, leading to the conclusion that the square pore structure is unsuitable for vertical porous designs.
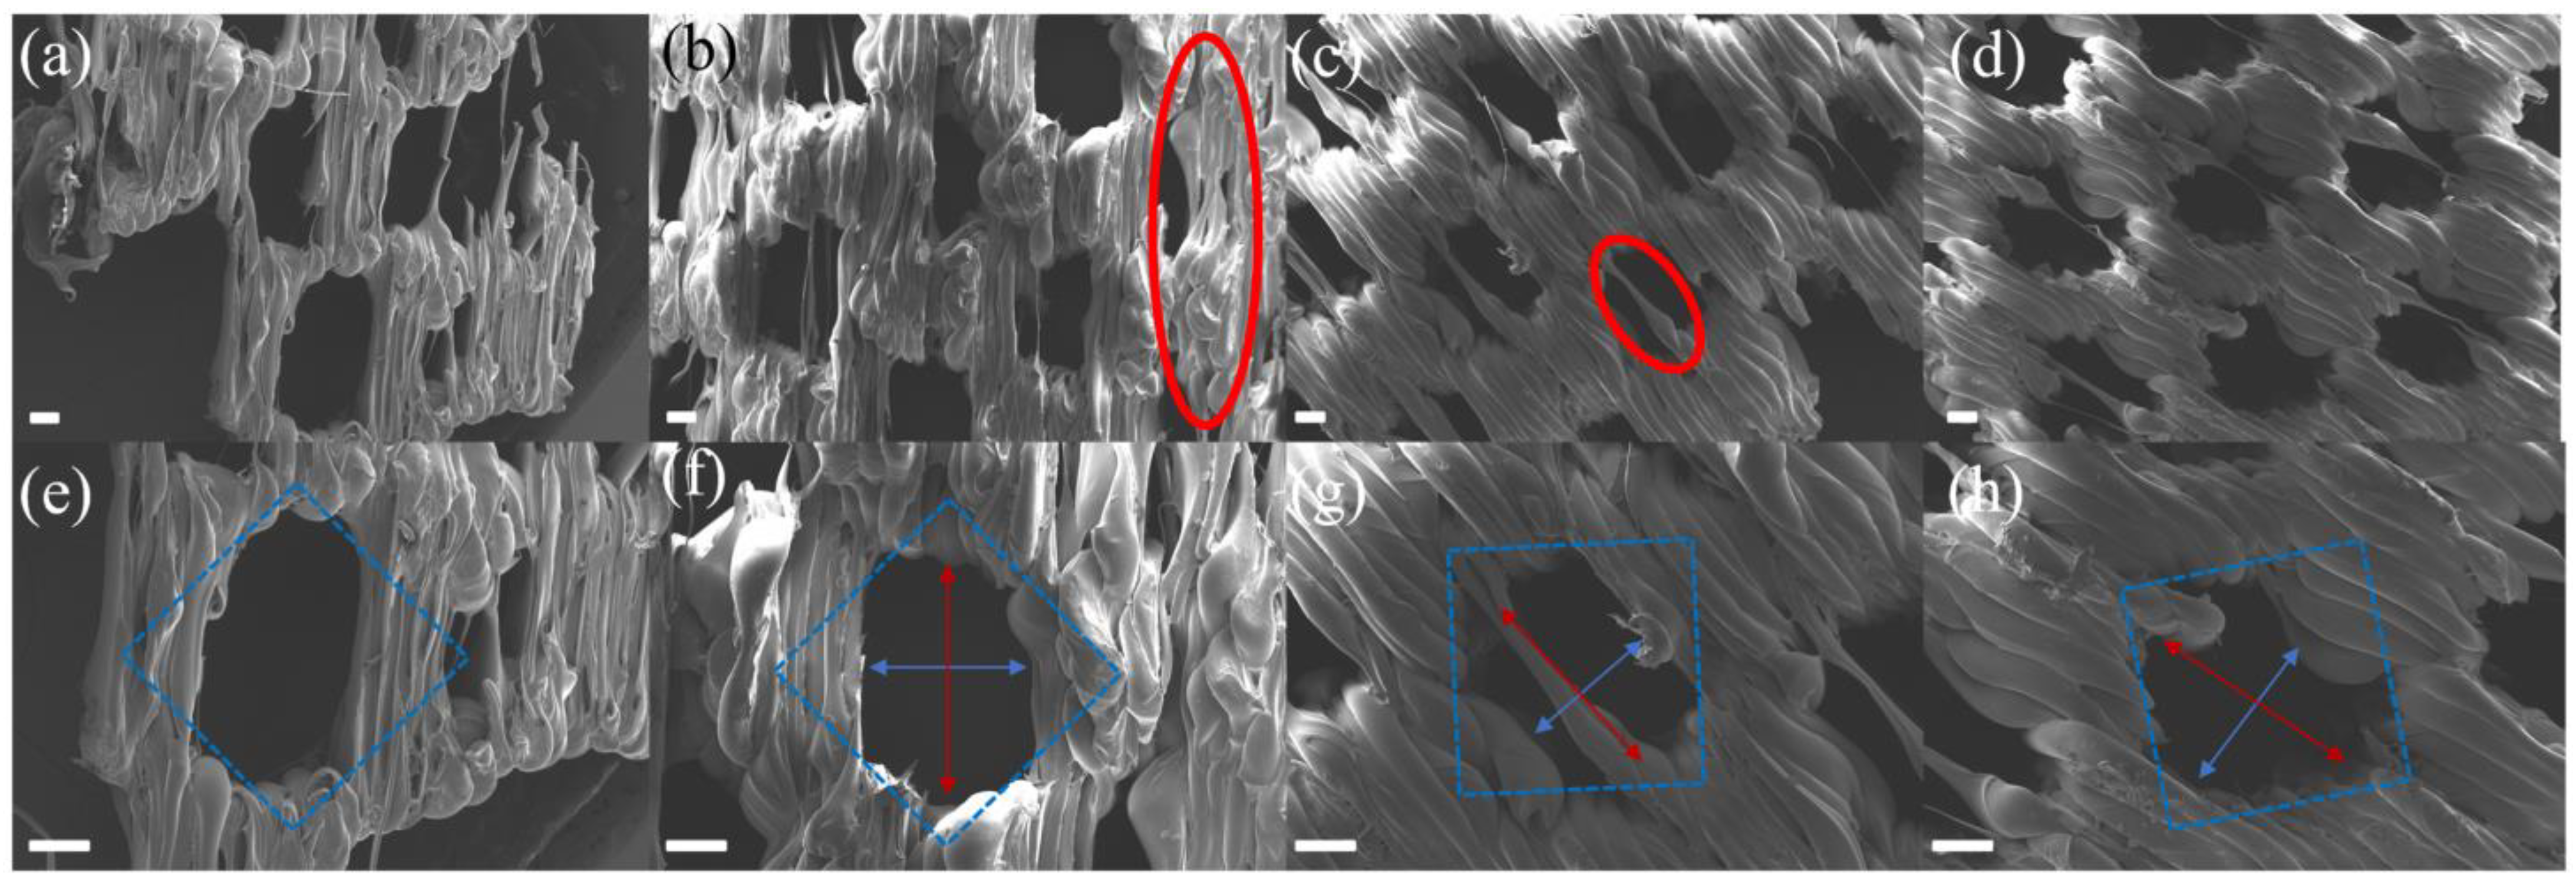
Table 1 presents the parameters used for printing the diamond pore structures. D1, D2, D3, and D4 were printed under the same conditions but with different model thicknesses (t in
Figure 1). As shown in
Figure 2a,e, D1, with a thickness of 0.8 mm, was not successfully printed, and many pore structures were missing. This failure is due to the principles of FFF technology; when the thickness of the previous layer is too low, its mechanical properties are insufficient to support the deposition of the next layer, leading to print failure. As illustrated in
Figure 2b,f, when the thickness was 1.6 mm, the print quality of D2 was low, with numerous defects still present. With thicknesses of 2 mm and 2.4 mm, shown in
Figure 2c,d,g,h, the material was successfully printed, but defects were still observed in the pore structures. Therefore, in subsequent experiments, models with a thickness of 2 mm will be used to balance printing success and time efficiency.
In the subsequent experiments, based on the printing parameters of D3, the printing temperature was reduced to 205 °C to fabricate D3LT. As shown in
Figure 3a,d, D3LT was successfully printed without a significant decline in quality compared to D3. To enhance energy efficiency, further optimizations will be based on D3LT. To improve printing efficiency, D3LTF was printed at a higher speed than D3LT. However, as clearly illustrated in
Figure 3b,e, this led to a substantial deterioration in print quality, confirming that a speed of 30 mm/s is optimal. Additionally, the extrusion multiplier was adjusted to fabricate D3LTE, which significantly improved print quality, as evidenced in
Figure 3c,f.
As shown in
Figure 3g, the measured pore widths of D2, D3, D4, D3LT, and D3LTE are 773.2 µm, 790.6 µm, 798.9 µm, 810.2 µm, and 961.2 µm, respectively, while the corresponding pore heights are 543.2 µm, 516.9 µm, 596.9 µm, 577.4 µm, and 677.3 µm. SEM images in
Figure 2 and
Figure 3 indicate that the actual pore sizes are smaller than the designed values due to the limited precision of FFF technology and polymer deformation. However, reducing the extrusion multiplier effectively increases pore sizes, bringing them closer to the intended dimensions. Compared to square pores, diamond-shaped pores exhibit superior print quality.
As illustrated in
Figure S2, L1 and L2 represent segments printed in a single print job. Diamond pores demonstrate a 41.4% larger volume per print job compared to square pores. Due to the resolution limitations of FFF technology, printing square pore structures requires the nozzle to extrude smaller amounts of polymer per segment, which can lead to reduced print quality. The diamond structure mitigates this issue, improving overall print fidelity. Additionally, the absence of overhangs in diamond pore structures further enhances print quality.
Subsequently, we conducted preliminary printing experiments with smaller pore sizes, based on the parameters of D3LTE, while only varying the pore size. Samples with pore sizes of 0.4 mm and 0.2 mm were successfully printed. As shown in
Figure 4, the porous structures exhibited high print quality. The samples with a designed pore size of 400 µm exhibited uniformly printed pores with an average diameter of 186.7 µm. However, when the pore size was reduced to 0.2 mm, the pore sizes became inconsistent, and many pores were not fully through-holes. Although a vertical porous structure with a pore size of 186.73 µm was successfully fabricated through the precise control of printing parameters, its inability to significantly reduce printing time by adjusting the layer height presents potential challenges in practical oil–water separation applications. Due to limitations such as reduced flow rate and increased fabrication complexity observed in smaller pore sizes, subsequent studies will primarily focus on samples with a pore size of 800 µm, which offer a more favorable balance between performance and manufacturability.
Reducing the fabrication time of vertical porous structures is a critical step toward achieving large-scale industrial production, significantly enhancing manufacturing efficiency. Among printing parameters, increasing the printing speed is a direct approach to reducing fabrication time. However, as shown in
Figure 3b,e, when the speed exceeds 30 mm/s, substantial structural defects emerge due to the precision limitations of FFF technology. An alternative method currently being considered for time reduction is decreasing the layer height. As presented in
Table 1, samples such as D3LTE-10 were designed based on the printing parameters of D3LTE, with D3LTE-30 featuring a layer height of 0.3 mm—the maximum limit supported by the employed printer. As illustrated in
Figure 5k, adjusting the layer height effectively reduces printing time. The printing time for D3LTE with a layer height of 0.05 mm is 1262 min, whereas for D3LTE-30 with a 0.3 mm layer height, it is reduced to 207 min—representing an 83.60% reduction in printing time. This significant time reduction is attributed to the layer-by-layer deposition mechanism of FFF technology, where a larger layer height results in fewer total layers, thereby shortening the overall printing duration. However, increasing the layer height also compromises print resolution. The SEM images in
Figure 5a–j depict samples printed with different layer heights, demonstrating that all exhibit well-formed and structurally intact pores due to optimized printing parameters. Nonetheless, as shown in
Figure 3g, D3LTE-10 has a pore height of 627.4 µm, whereas D3LTE-30 exhibits a significantly smaller pore height of 287.7 µm. The increased layer height introduces larger dimensional deviations, leading to a notable reduction in the actual pore size compared to the designed model. Moreover, as observed in
Figure 5g–j, an increased occurrence of filament stringing and other printing defects can be identified. These imperfections are also attributed to the precision limitations of FFF technology during the printing process.
In addition to performance optimization, the cost-effectiveness of this fabrication method is also noteworthy. The FFF printer used in this study is commercially available at a market price ranging from approximately $165 to $275 USD, and the PLA filament costs around $38 USD per kilogram, resulting in a material cost of approximately $0.68 USD per sample. These figures highlight the economic viability of the method, making it highly attractive for large-scale production and field applications in environmental remediation and industrial wastewater treatment.
3.2. Hydrophobicity
In our previous work, the spray-coating method has been demonstrated as an efficient and cost-effective approach for superhydrophobic modification [
32], as illustrated in
Figure 6a. Ethanol, an environmentally friendly and low-cost solvent, was selected as the dispersion medium. The addition of isopropanol enhances the dispersion of silica nanoparticles in ethanol, improving coating uniformity. PDMS acts as a binder, anchoring the silica nanoparticles to the sample surface. Silica nanoparticles contribute to reducing the surface energy of the material while simultaneously increasing nanoscale roughness. According to the Cassie and Wenzel models [
33], this dual effect significantly enhances the hydrophobicity of the modified surface. However, the long-term stability of the silica nanoparticles on the surface, particularly their potential detachment during practical applications, remains a concern. Further investigations are required to assess the extent of nanoparticle loss and its potential environmental impact.
As shown in
Figure 6a, after hydrophobic modification, the contact angle of D3LTE increased from 79.2° to 156.9°, reaching the threshold for superhydrophobicity. The digital photograph in
Figure 6c illustrates that water droplets retain a spherical shape on the modified D3LTE surface, indicating a strong water-repellent effect. For oils such as cyclohexane, as depicted in
Figure 6d, the liquid is completely absorbed due to capillary forces, resulting in a contact angle of 0°. Furthermore,
Figure 6e presents a comparison of D3LTE before and after modification when submerged in water. The unmodified sample exhibits water infiltration into its internal pores, whereas the modified D3LTE remains dry. This is attributed to the negative capillary effect generated by its superhydrophobic surface, which effectively resists water penetration under hydrostatic pressure.
Except for D3LTF, where the pore structure was heavily obstructed, and D1, which failed to print successfully, the contact angles of all other samples were measured. As shown in
Figure 6b, no significant differences were observed among the contact angles of different samples. The highest contact angle, 158.2°, was recorded for D3LTE-20, while the lowest, 152.3°, was observed for D3LTE-15. Although samples fabricated with different printing parameters exhibit variations in pore size and microscale surface roughness, no clear correlation was found between these parameters and the resulting contact angle. This is because the sample surface consists primarily of PLA, with only minor differences in microscale roughness. The improvement in hydrophobicity is predominantly attributed to the low surface energy provided by the modification process and the introduction of nanoscale roughness [
34]. Consequently, all modified samples achieved superhydrophobicity, and the variation in contact angles did not follow a distinct pattern.
Figure 7a illustrates the ability of the sample surface to withstand continuous water pressure. Over a 24 h period, no water leakage was observed, demonstrating the material’s excellent resistance to liquid infiltration. During the experiment, a notable phenomenon was observed: the water inside the sample evaporated rapidly and had to be continuously replenished to maintain the liquid level. This can be attributed to the high surface roughness and porosity of the modified structure based on Cassie–Baxter theory [
33,
35], which enhances the evaporation rate by increasing the water–air interface area and reducing the contact between water and the underlying solid, thus minimizing heat dissipation. As shown in
Figure 7b, the sample surface was repeatedly subjected to peeling tests. After ten cycles, the modified D3LTE retained its hydrophobicity, with a contact angle of 153.1°, demonstrating strong adhesion stability. This stability is attributed to the excellent mechanical properties of PDMS, which serves as an effective binder between silica nanoparticles and the porous skeleton, preventing detachment under mechanical stress [
36].
To confirm the presence of silica nanoparticles on the sample surface, SEM images of unmodified and modified D3LTE are shown in
Figure 7e and
Figure 7f, respectively. The deposition of nanoparticles on the surface increases the actual surface area, thereby enhancing the surface roughness (defined in the Wenzel model [
33] as the ratio of actual to apparent surface area). This increased roughness contributes to the improved hydrophobicity observed after modification. Further elemental analysis was conducted using EDS, as shown in
Figure 7g. Three characteristic elements—C, O, and Si—were detected on the modified surface. Si is uniformly distributed, confirming the successful incorporation of silica nanoparticles. Additionally,
Figure 7c,d display SEM images of samples with a pore size of 0.4 mm, revealing similar roughness variations and further supporting the uniformity and effectiveness of the surface modification process.
3.3. Oil–Water Separation Experiment
To achieve continuous oil–water separation, an experimental setup was designed under laboratory conditions, as illustrated in
Figure 8a. Modifications were made to the sample model to address the issue of secondary contamination. Since oil inherently passes through porous structures via capillary action, leading to potential leakage, the lower half of the sample was designed as a solid, non-porous region, providing an integrated oil storage capability. As shown in
Figure 8b, the sample was placed in a beaker and secured underwater using double-sided tape. A controlled volume of water and cyclohexane was then introduced into the system. Due to the negative capillary effect induced by the superhydrophobic surface, water was effectively repelled, whereas cyclohexane permeated the porous structure under the combined effects of liquid pressure and capillary forces and was subsequently collected using an electric pump. After separation, as depicted in
Figure 8c, the water surface remained clear and free of oil contamination, demonstrating effective oil removal.
Figure 8d presents the flow rate of different samples during oil–water separation. The flow behavior of cyclohexane through the porous structure can be analyzed using Darcy’s law [
37], which describes the relationship between flow velocity and permeability in a porous medium:
where
v is the fluid velocity,
k is the permeability of the porous medium,
μ is the dynamic viscosity of cyclohexane, ∆
P is the pressure difference across the porous structure, and
L is the thickness of the porous layer. Since permeability
k is proportional to the square of the pore radius (k∝ r
2), Darcy’s law predicts that larger pores should lead to significantly higher flow rates. This theoretical trend aligns generally with our experimental results, where an increasing trend in flow rate is observed with the enlargement of pore size (height). D3LTE, with a pore height of 677.3 µm, exhibits the highest flow rate (117.3 mL/min), while D3LTE-30, with a smaller pore height of 287.7 µm, demonstrates the lowest flow rate (80.7 mL/min). These results confirm that pore size plays a dominant role in controlling flow rate, as larger pores reduce flow resistance and enhance permeability. However, the observed flow rate differences between samples are somewhat smaller than those predicted by Darcy’s law. According to theoretical calculations, the flow rate should be scaled with r
2, suggesting that the sample with a larger pore size should exhibit a significantly higher flow rate than what is experimentally recorded. This deviation may be attributed to additional factors beyond permeability. One key factor to consider in low-pressure filtration environments is the capillary effect [
29], which becomes more significant in smaller pores. The Laplace equation shows that smaller pores generate higher capillary pressure, which increases the resistance to fluid entry and may suppress flow despite higher theoretical permeability. In this experiment, the small-pore sample (D3LTE-30) exhibits greater capillary resistance, counteracting the permeability-driven flow enhancement predicted by Darcy’s law. This effectively narrows the flow rate difference between samples with large and small pores, explaining why the experimental results deviate from purely permeability-based predictions. Therefore, the observed non-linearity in the flow response should not be interpreted as a violation of Darcy’s law but rather as a reflection of complex interfacial phenomena, particularly in porous membranes with superhydrophobic modifications.
Figure 8e presents the separation efficiency of different samples, with D3LTE-30 exhibiting the highest efficiency at 88.6%. As observed in
Figure 8c, residual cyclohexane remains on the sample surface and water surface after separation, which accounts for the inability to achieve 100% separation efficiency. Additionally, a 24 h continuous oil–water separation test was conducted using D3LTE. After 24 h, the separation efficiency remained at 87.2%, demonstrating the sample’s potential for long-term oil–water separation applications.
The above analysis provides valuable insights into the practical application of the samples. However, these results are based on preliminary exploratory experiments conducted under controlled laboratory conditions. In real-world applications, the fluid environment is significantly more complex and dynamic. Therefore, further studies are required to validate these findings and optimize the samples for practical implementation.
Due to the superhydrophobic porous structure of the sample, alternative oil–water separation methods can be employed. As illustrated in
Figure 9a, cyclohexane and water are introduced into the internal space of the sample, where cyclohexane selectively permeates through the porous structure, enabling separation. Additionally, the sample can be combined with a sponge to achieve an adsorption-based oil–water separation process (
Figure 9b). When a sponge is placed inside the sample, the cyclohexane that passes through the porous surface is immediately absorbed by the sponge, enabling the removal of cyclohexane from the water.


 ,
, 


