
Development of Optimal Conditions for Synthesis of Molecularly Imprinted Polymers for Effective Terbium Sorption


Abstract
1. Introduction
2. Materials and Methods
2.1. Materials
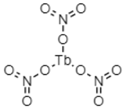
2.1.1. Templates

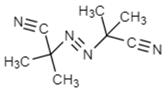
2.1.2. Initiator
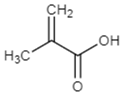
2.1.3. Monomers

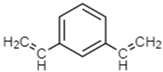
2.1.4. Cross-Linker
2.1.5. Porogen
2.1.6. Stabilizer
2.1.7. Additional Materials
2.2. Synthesis of MIP and NIP
2.3. Physicochemical Methods of Analysis
3. Results and Discussion
3.1. Synthesis of the MIPs on Lead Nitrate
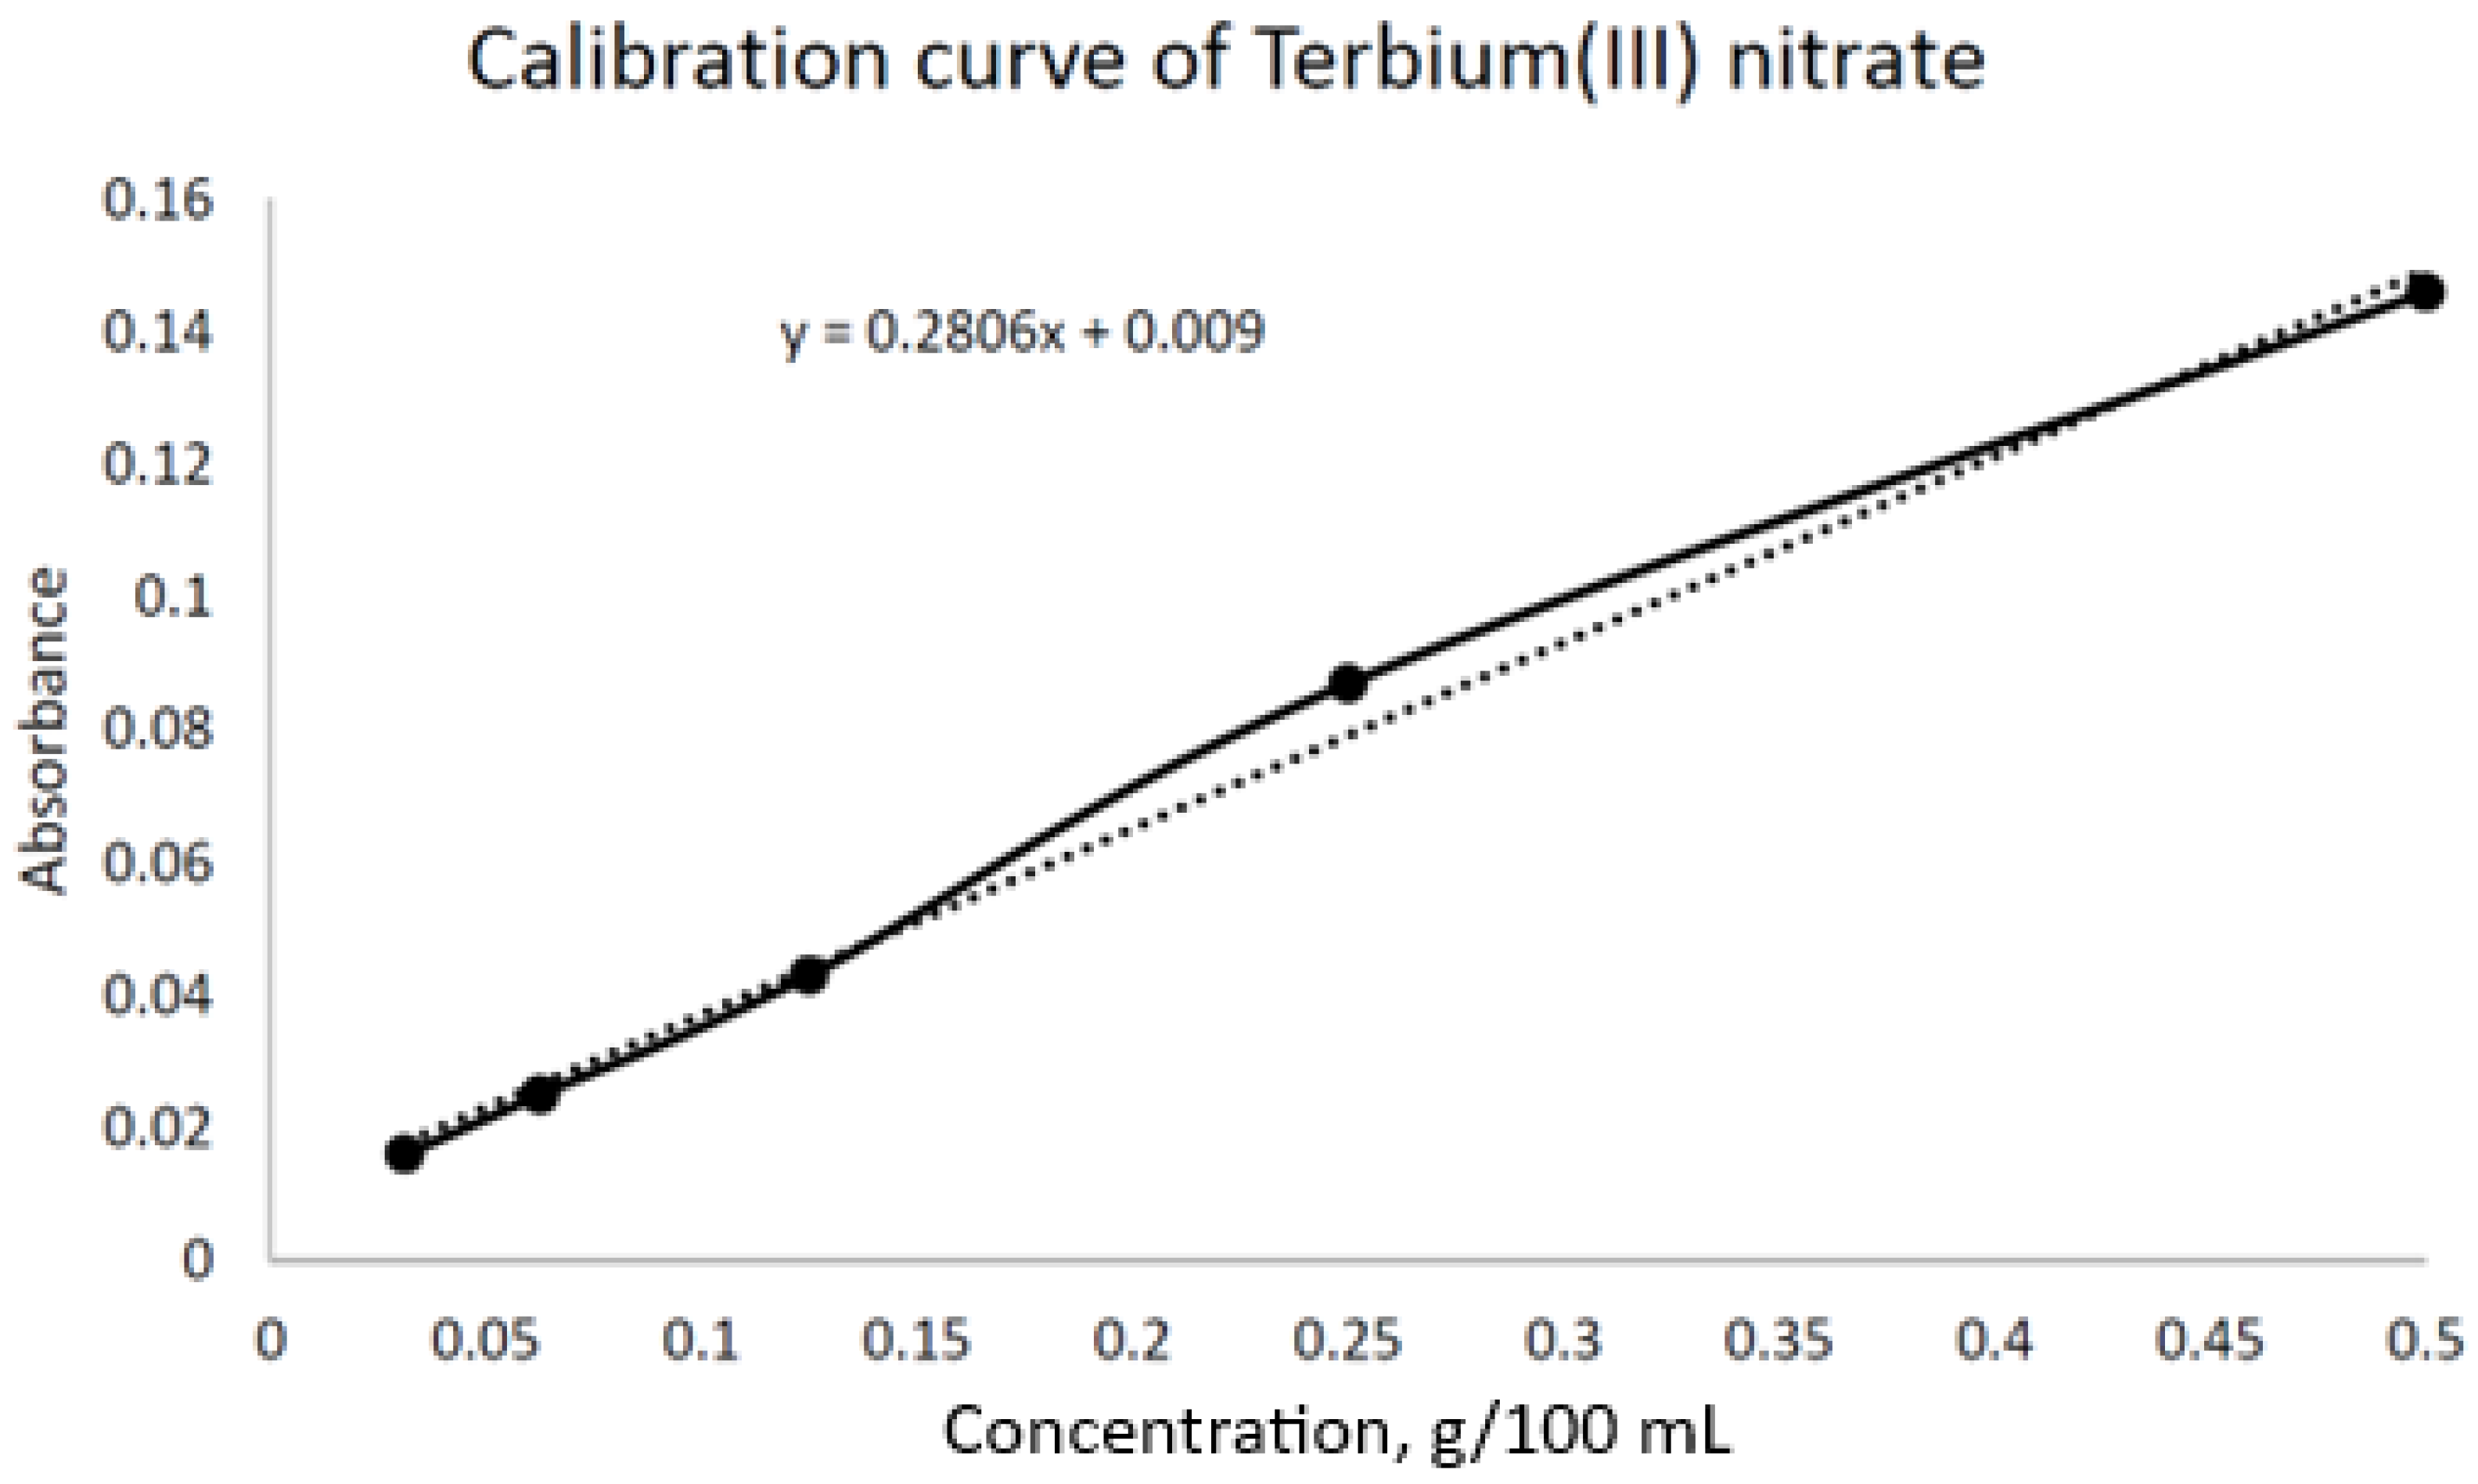
3.2. Synthesis of MIP on Terbium Nitrate
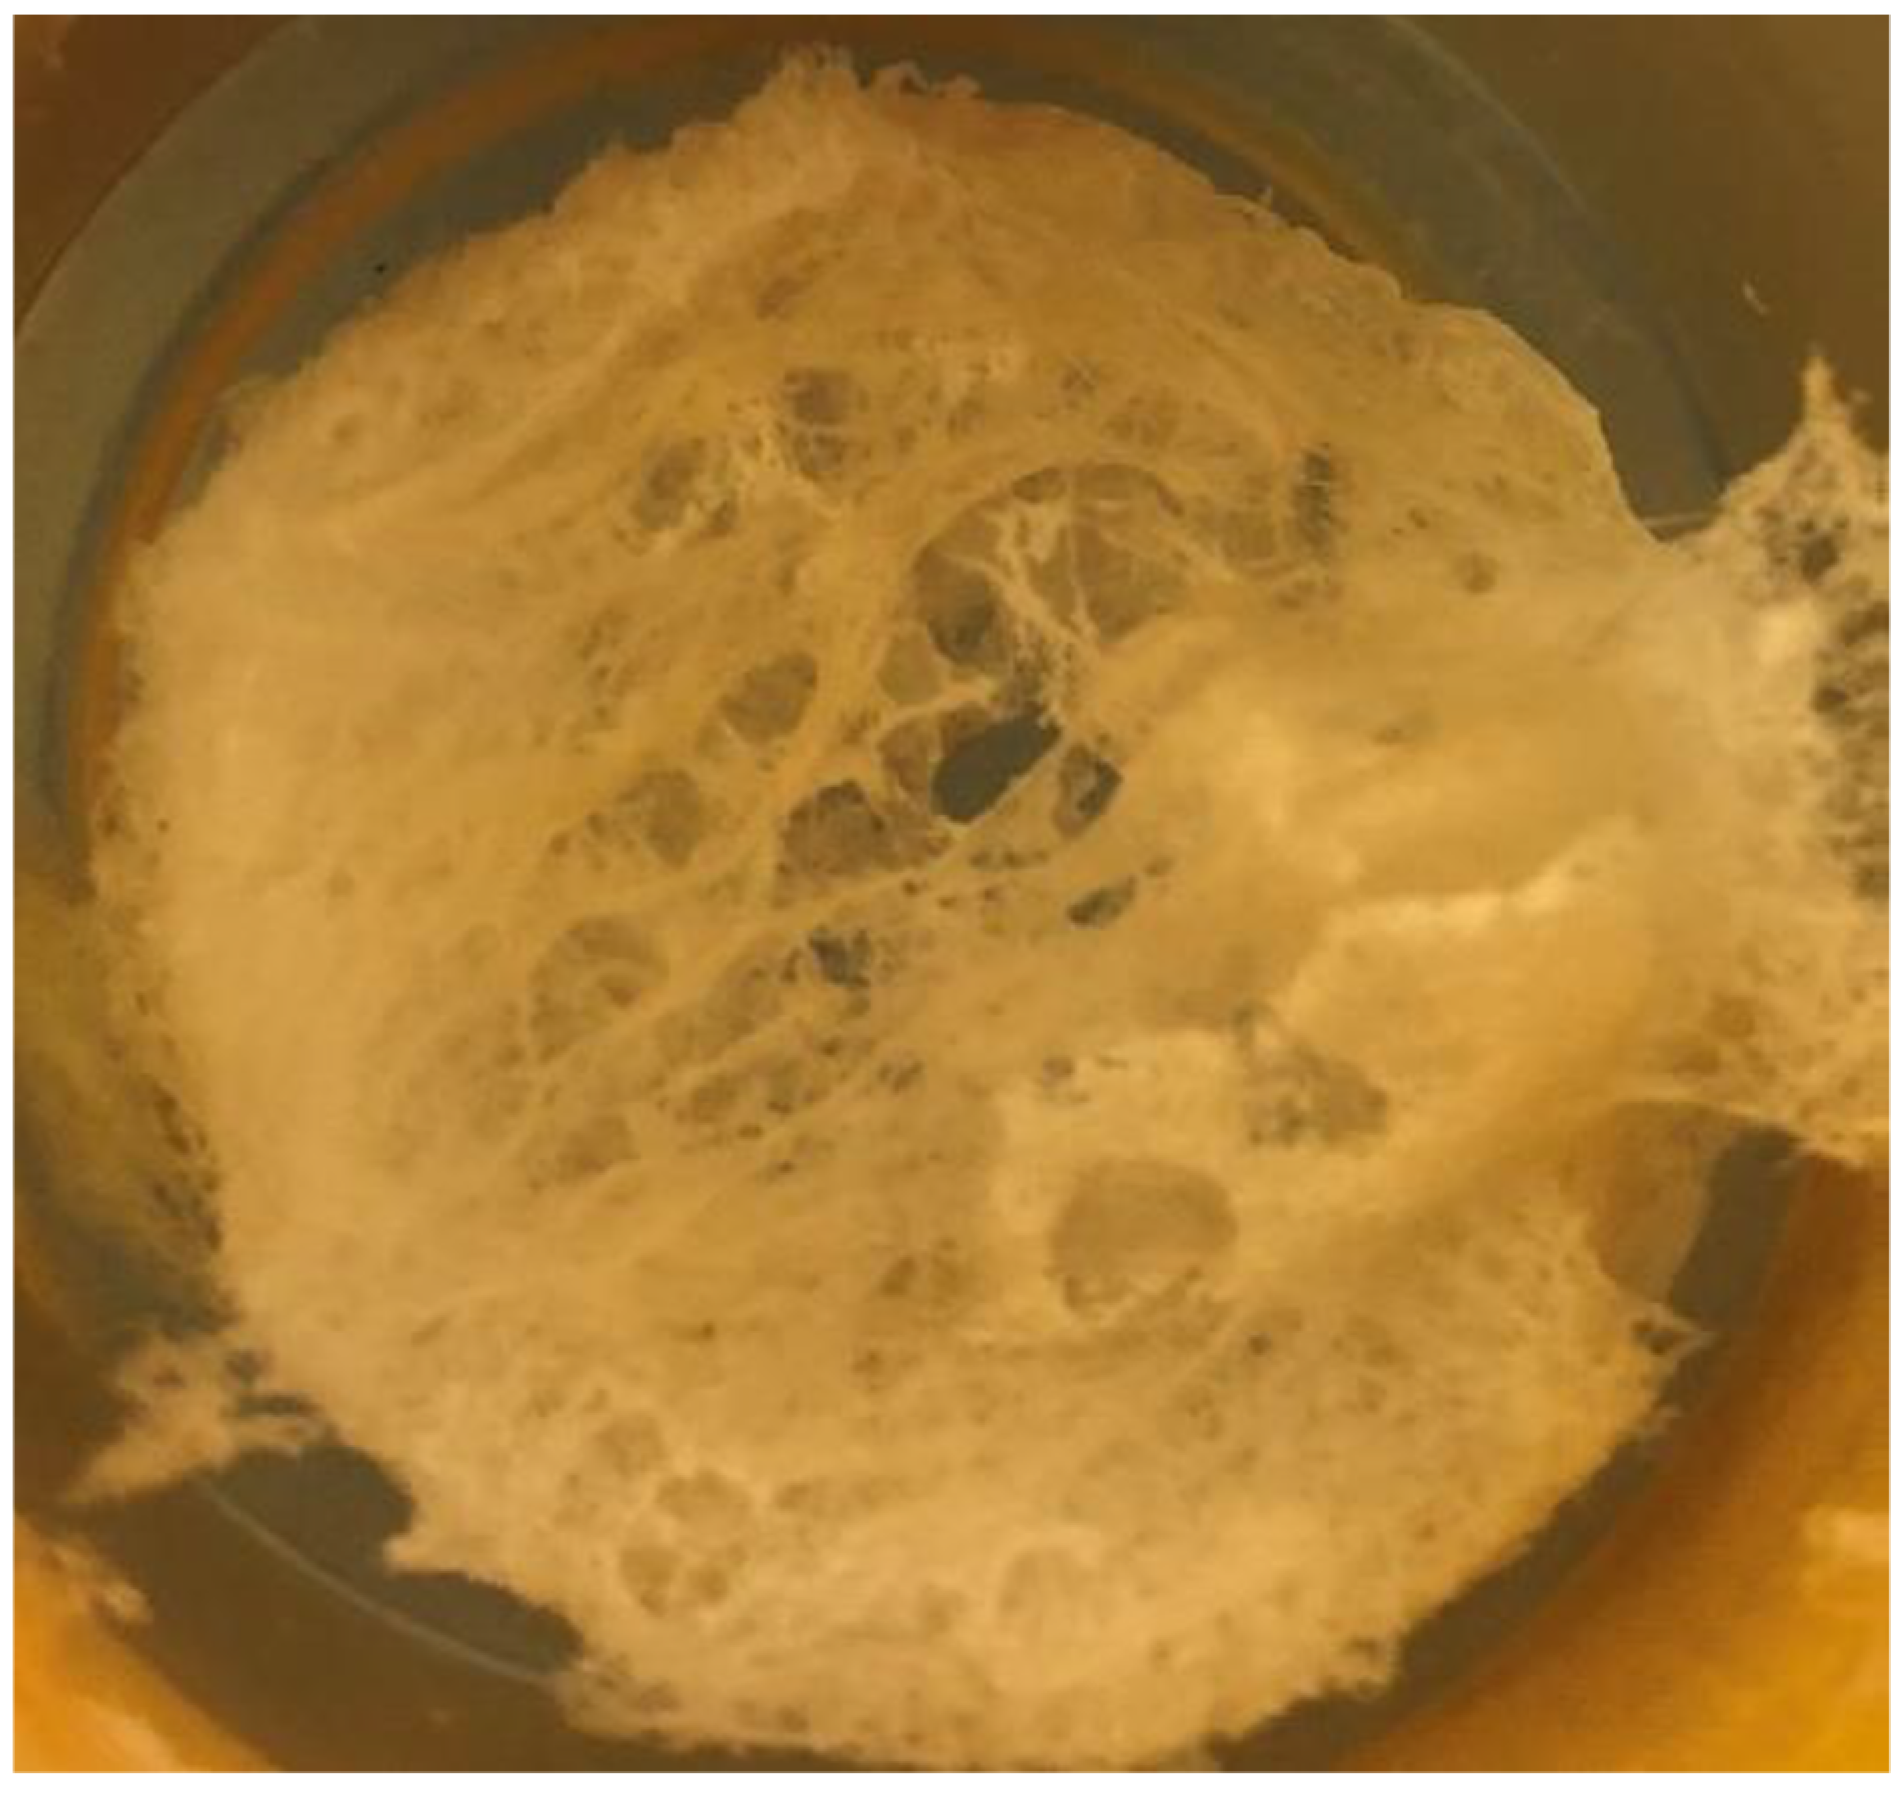
3.2.1. Yield of the Products
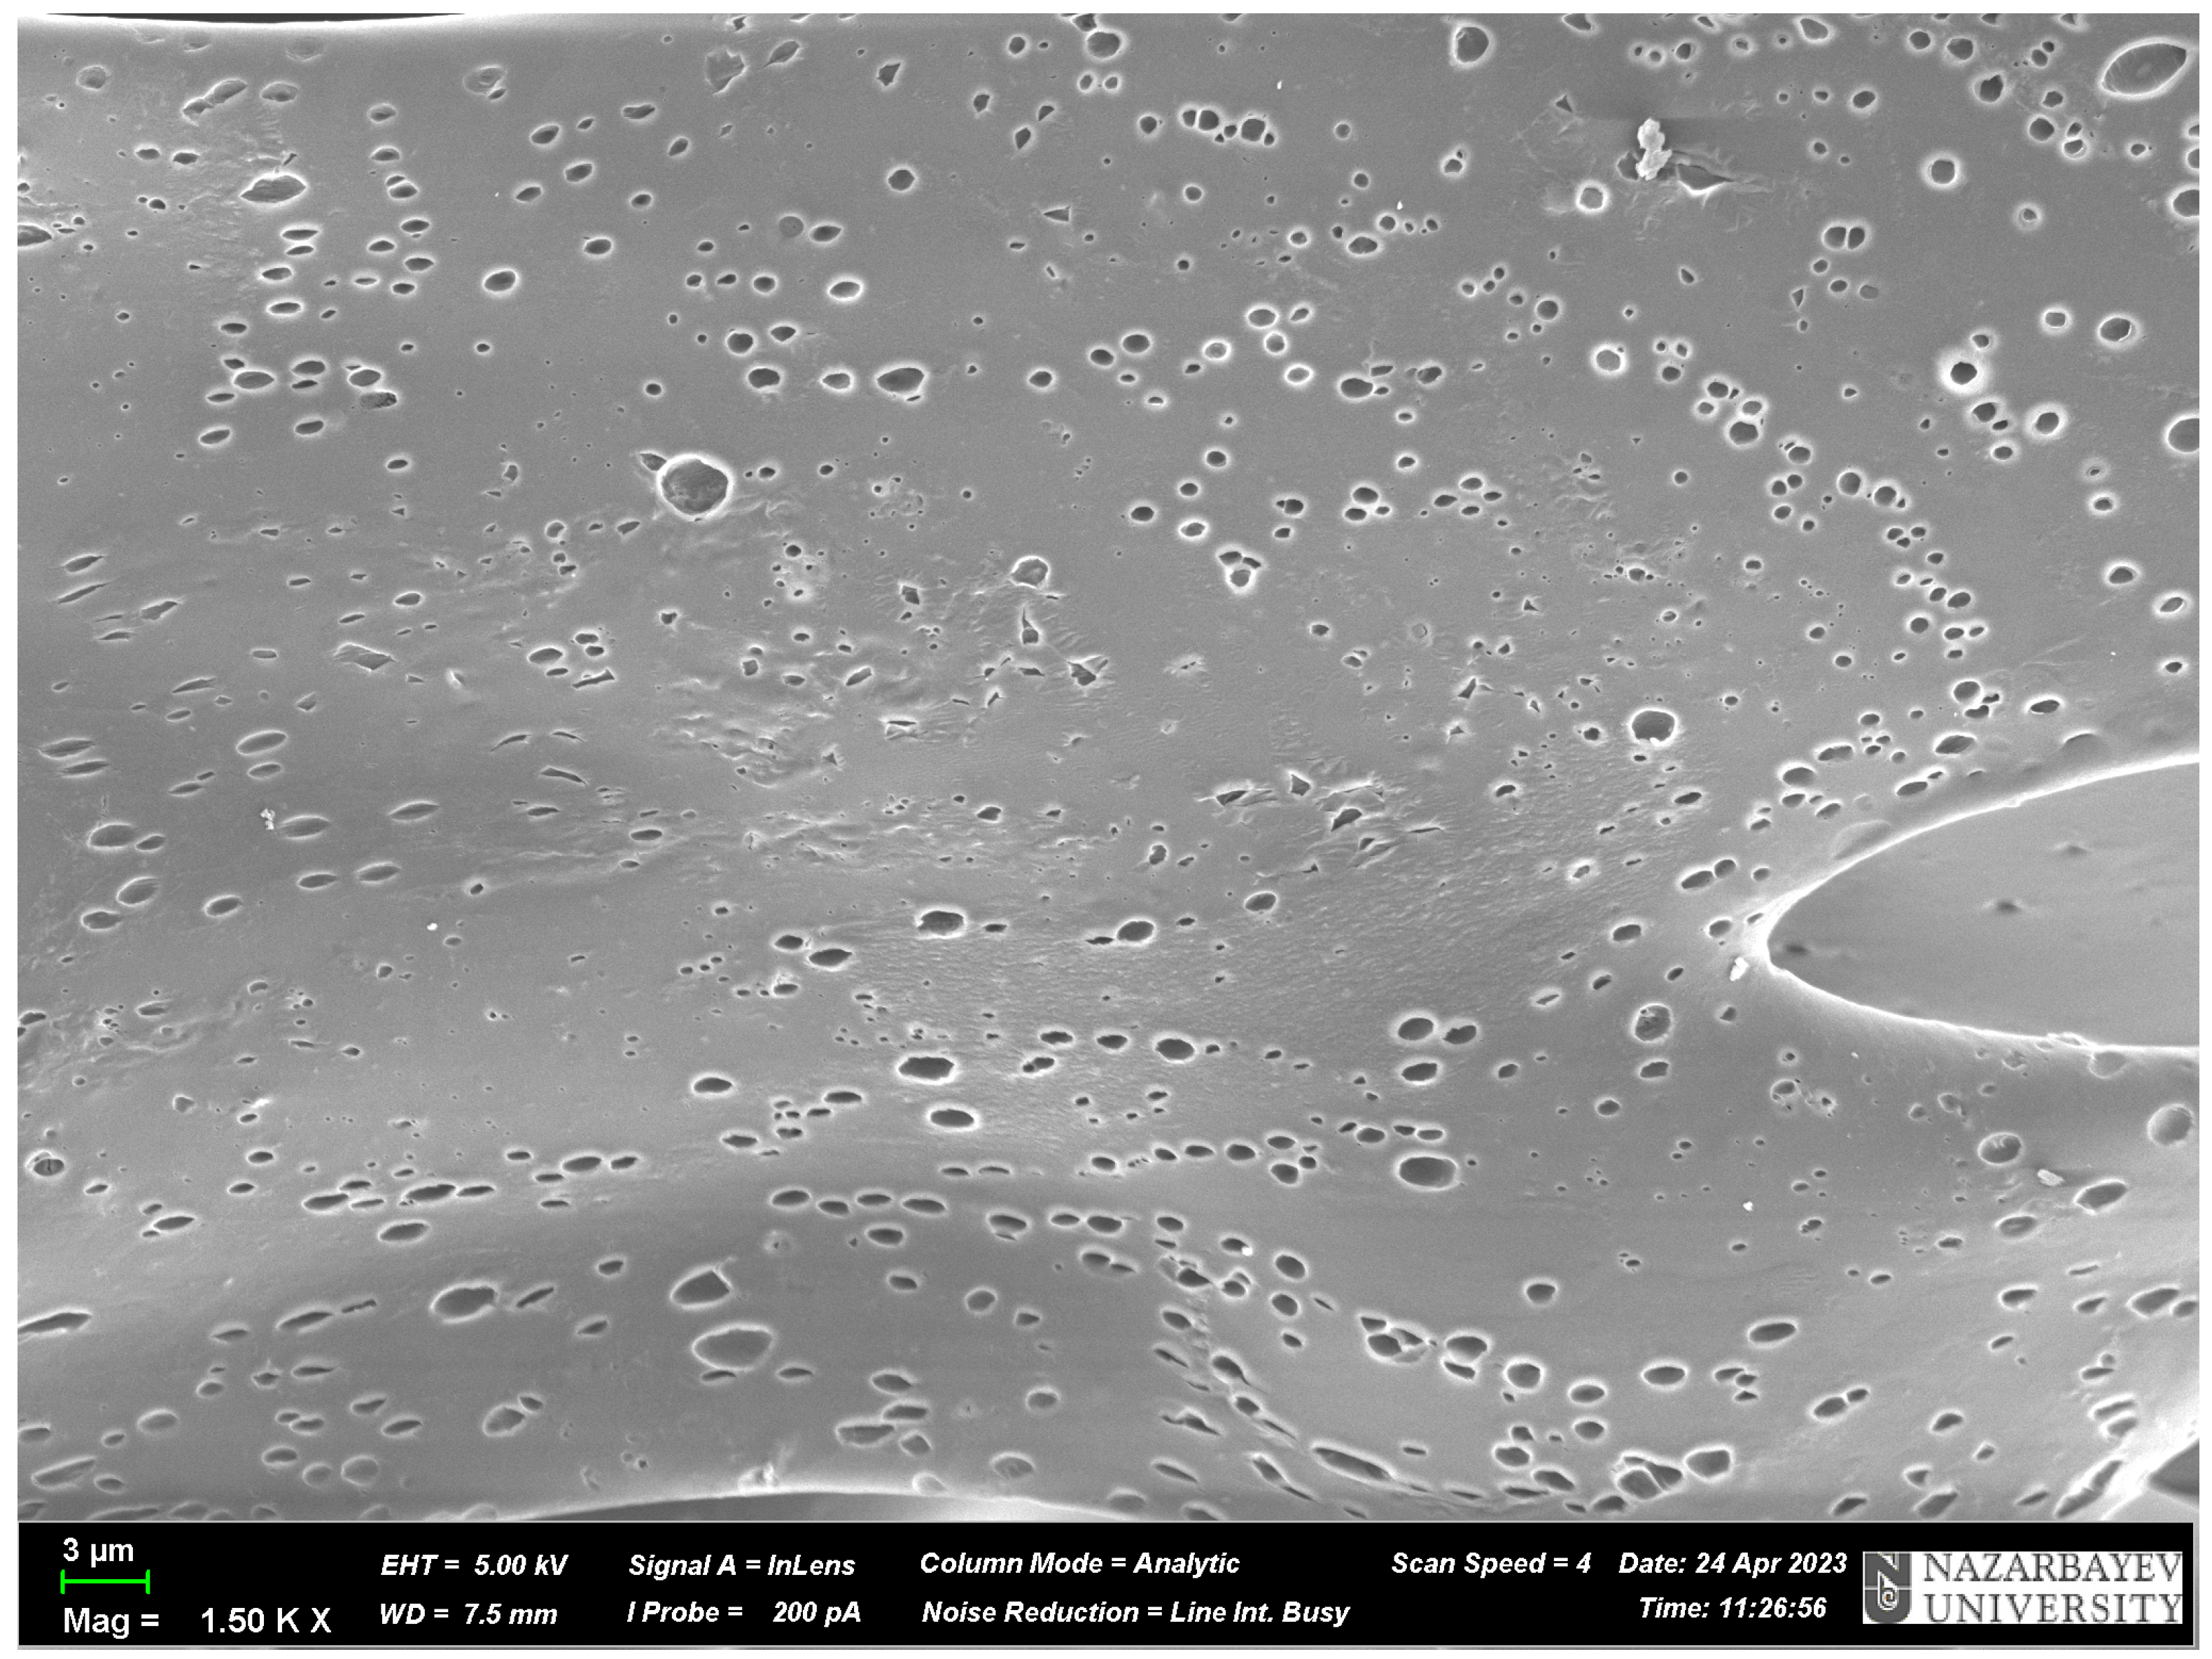
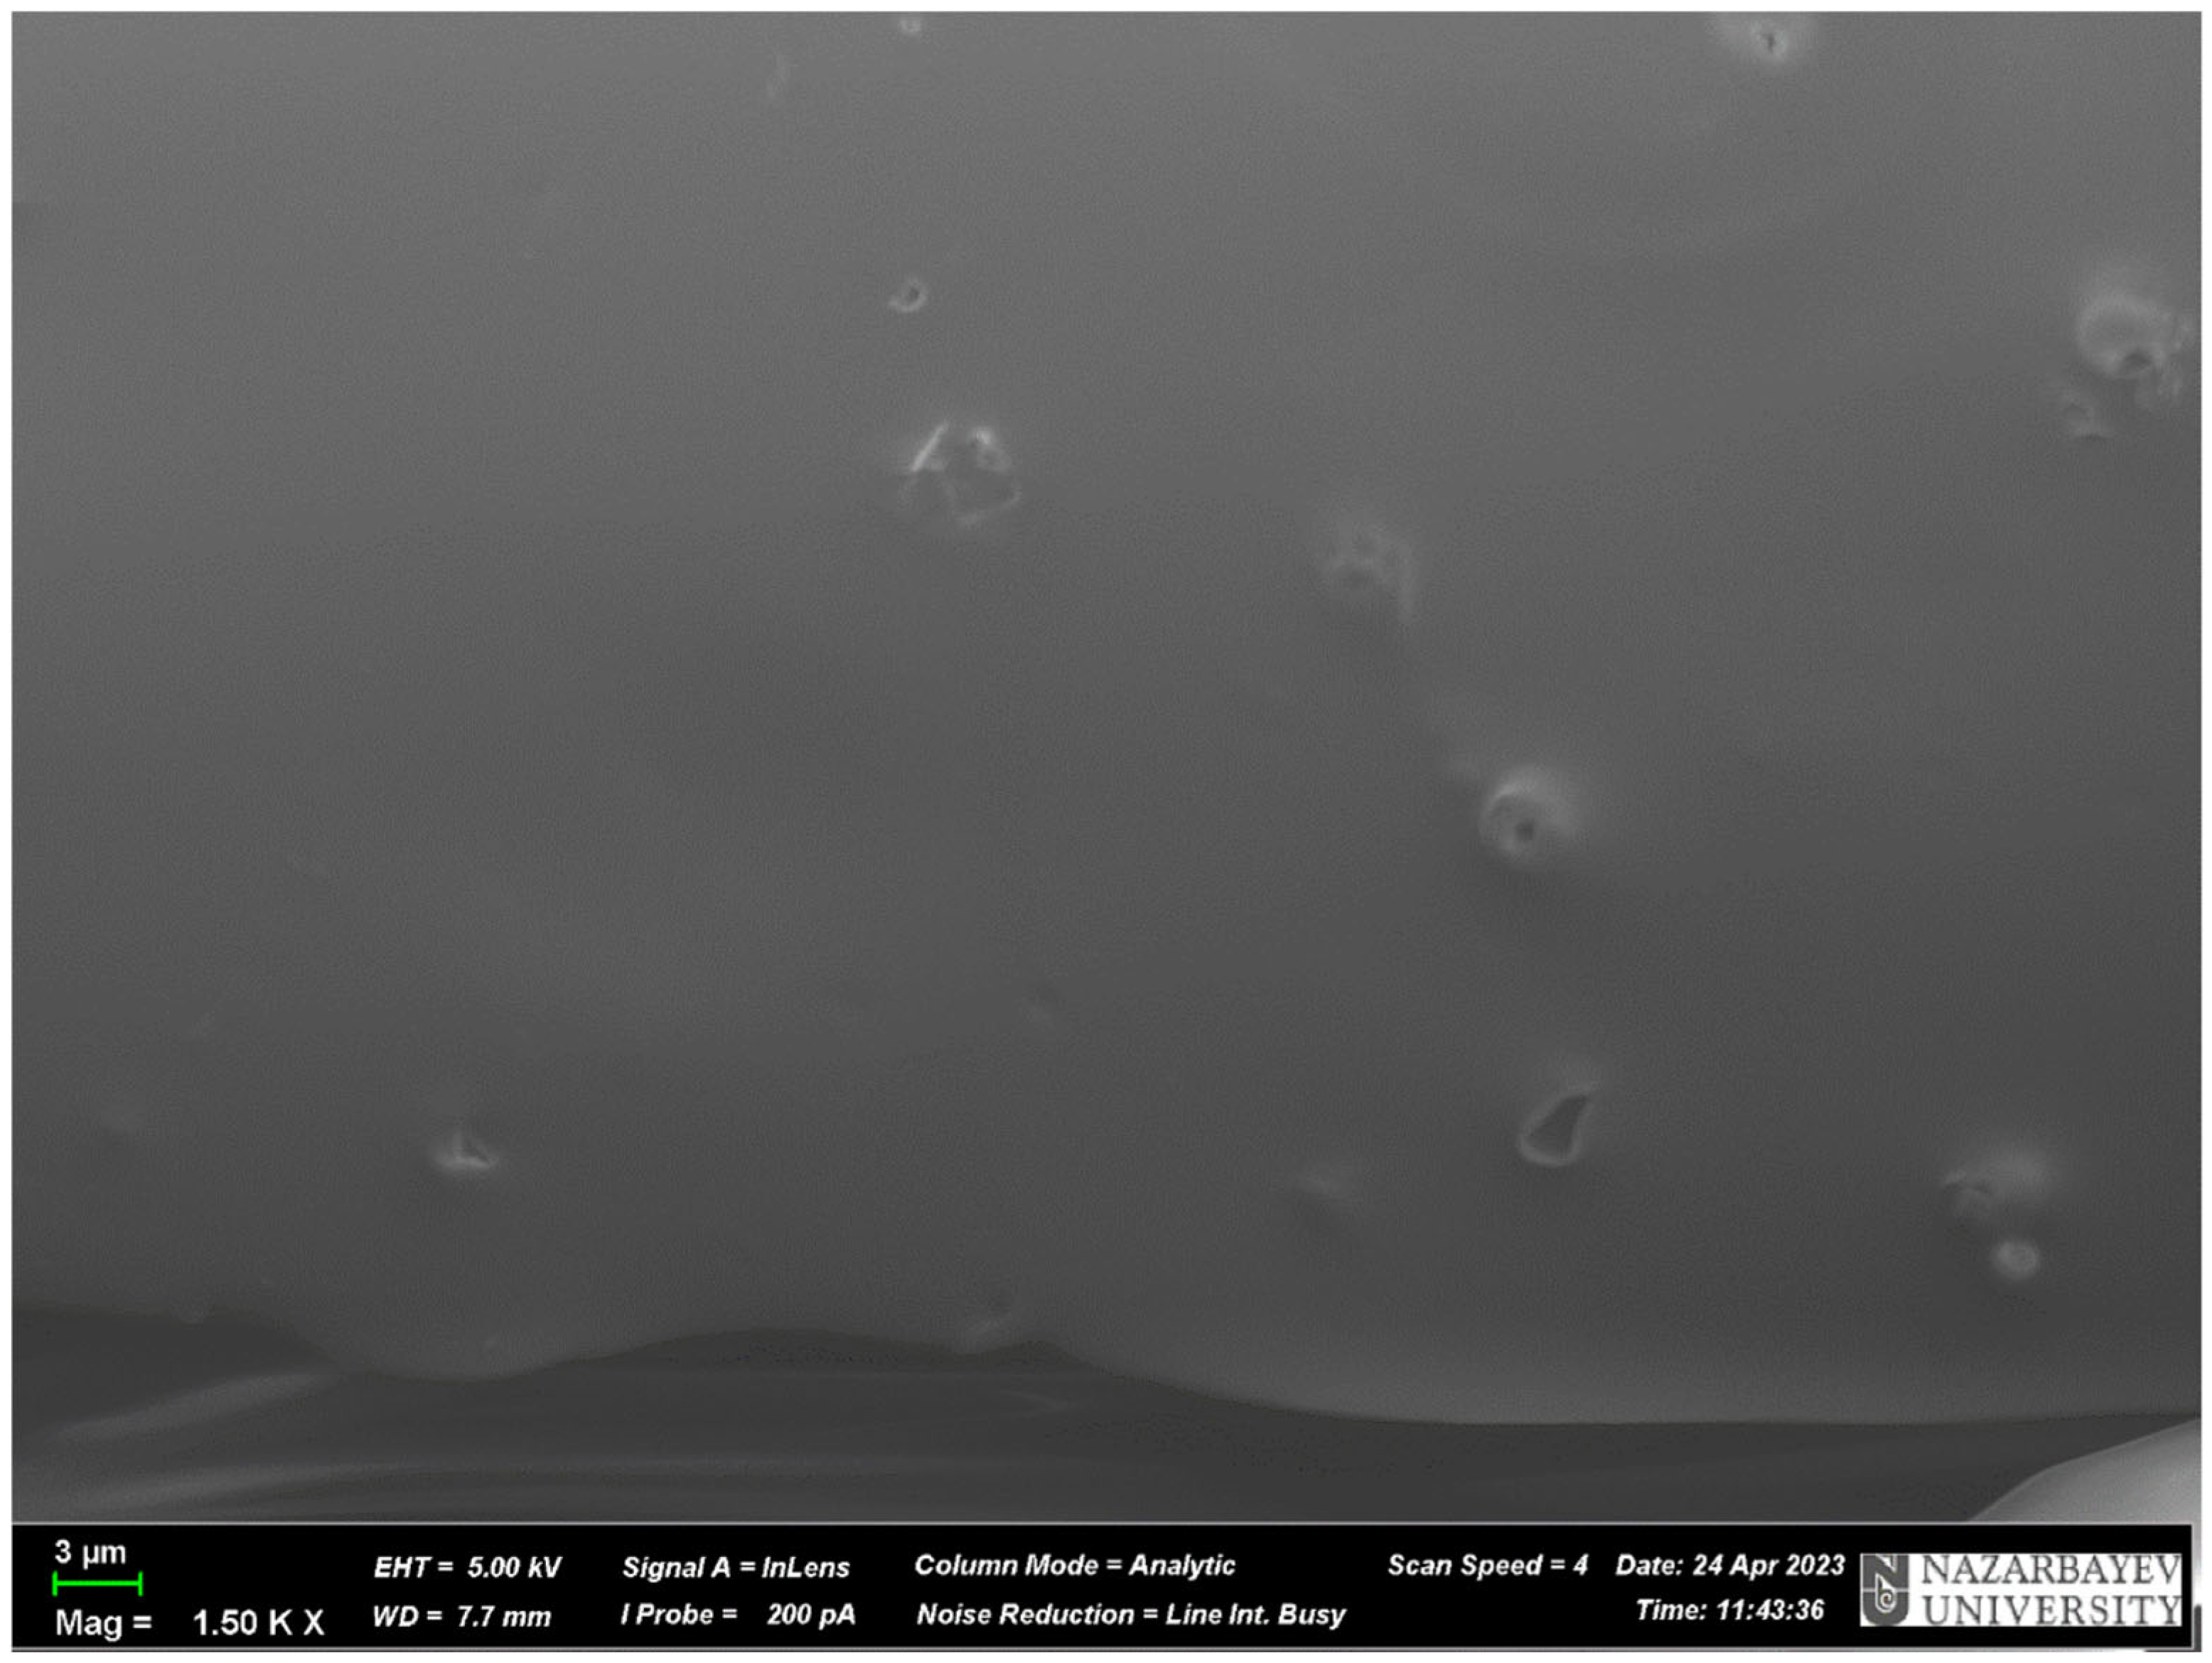
3.2.2. Scanning Electron Microscopy
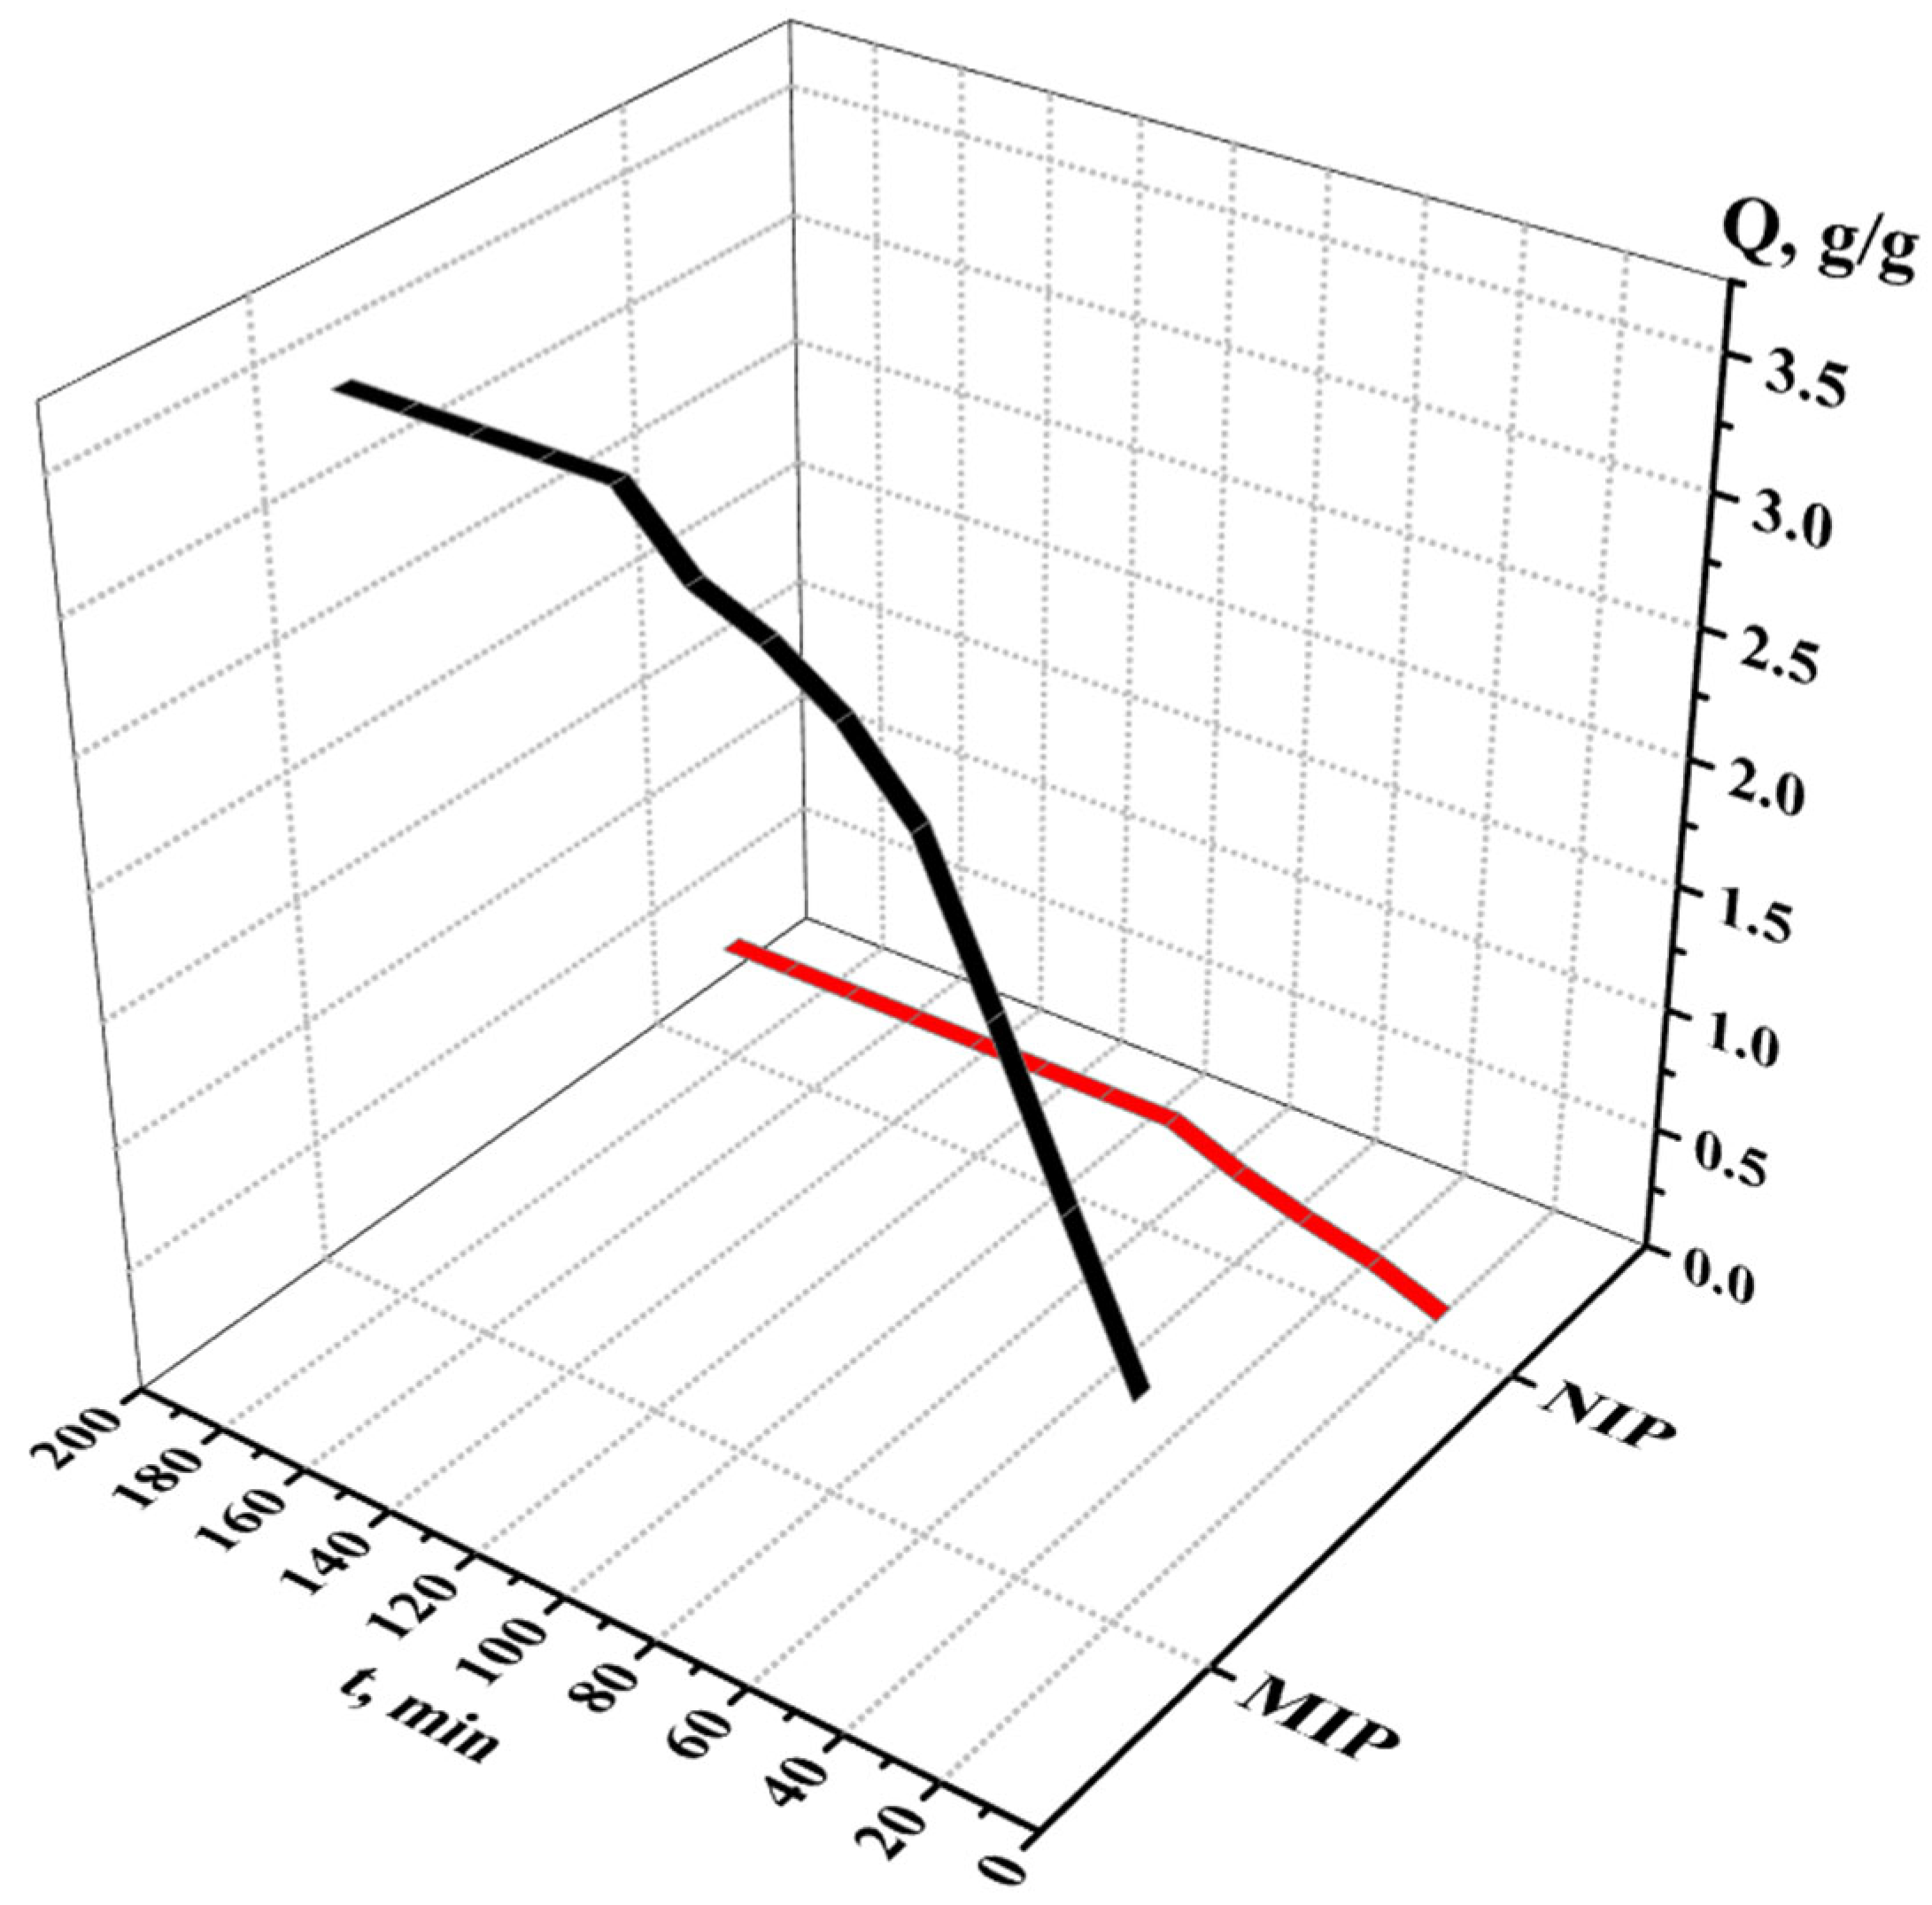
3.2.3. Sorption and Desorption Properties of the MIPs and NIPs
- IF = 1: No imprinting effect (MIP performs similarly to NIP).
- IF > 1: Successful imprinting (MIP has higher affinity for the template).
- IF < 1: Poor imprinting or non-specific binding issues.
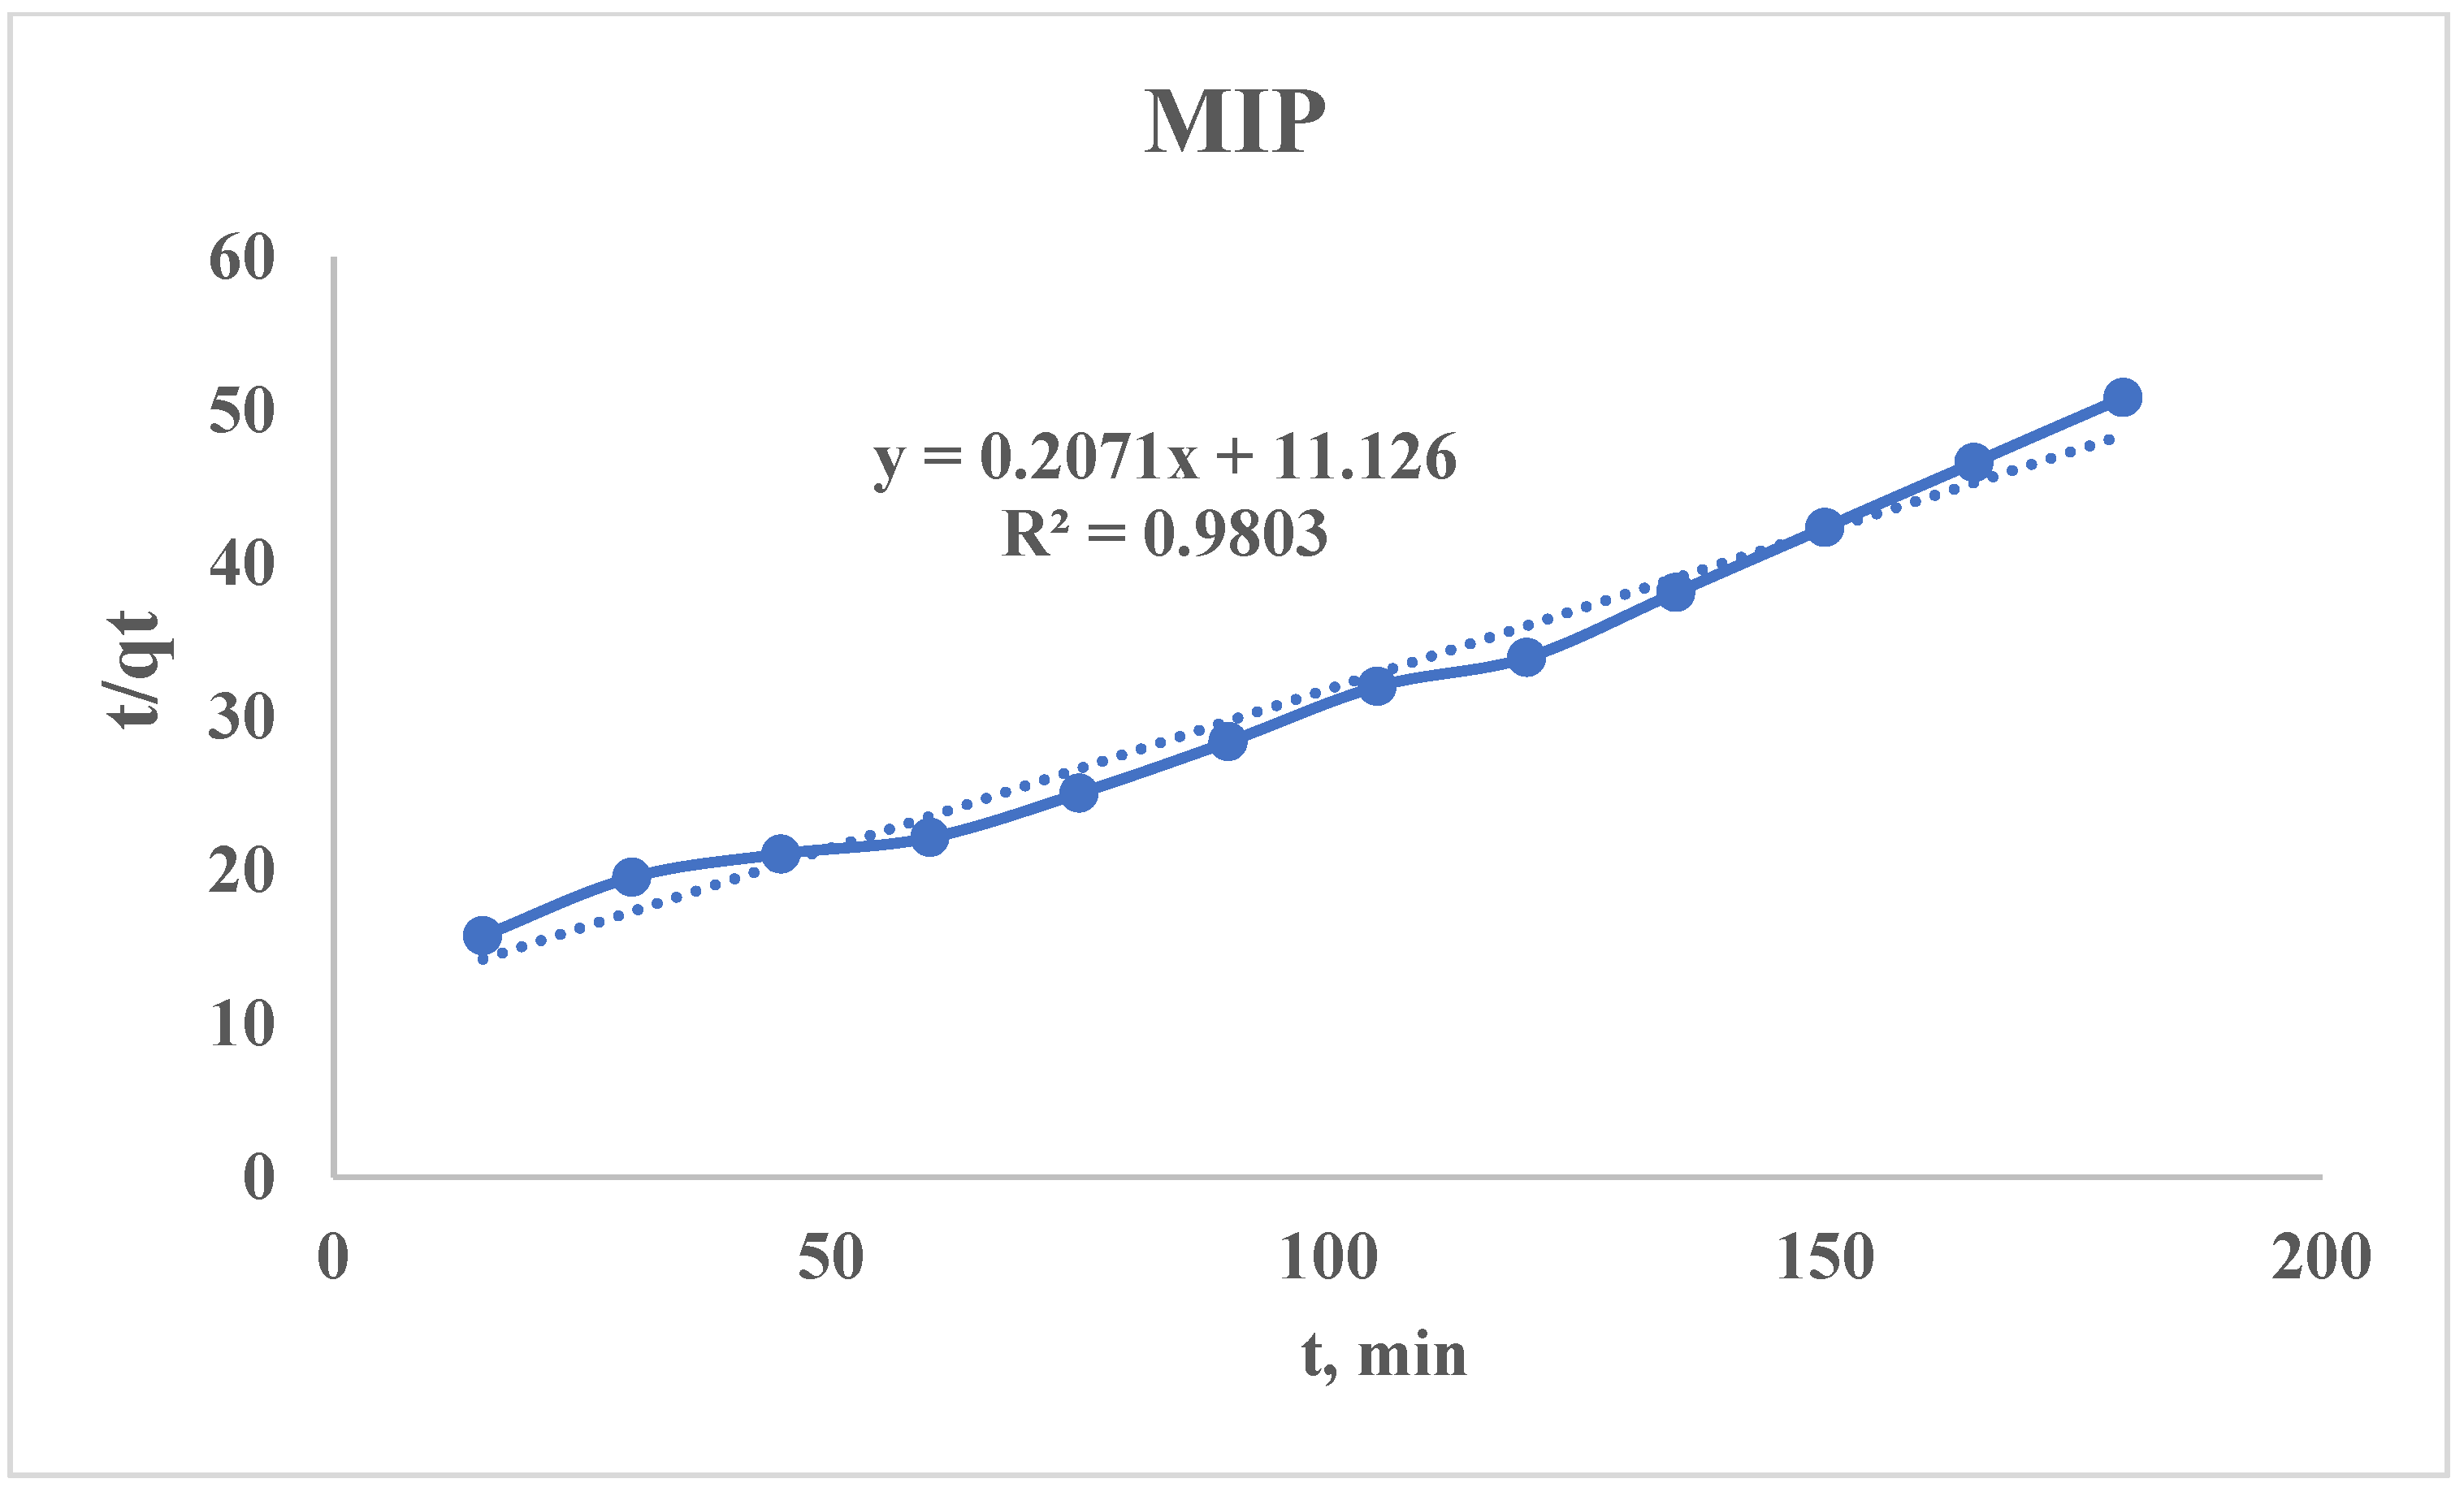
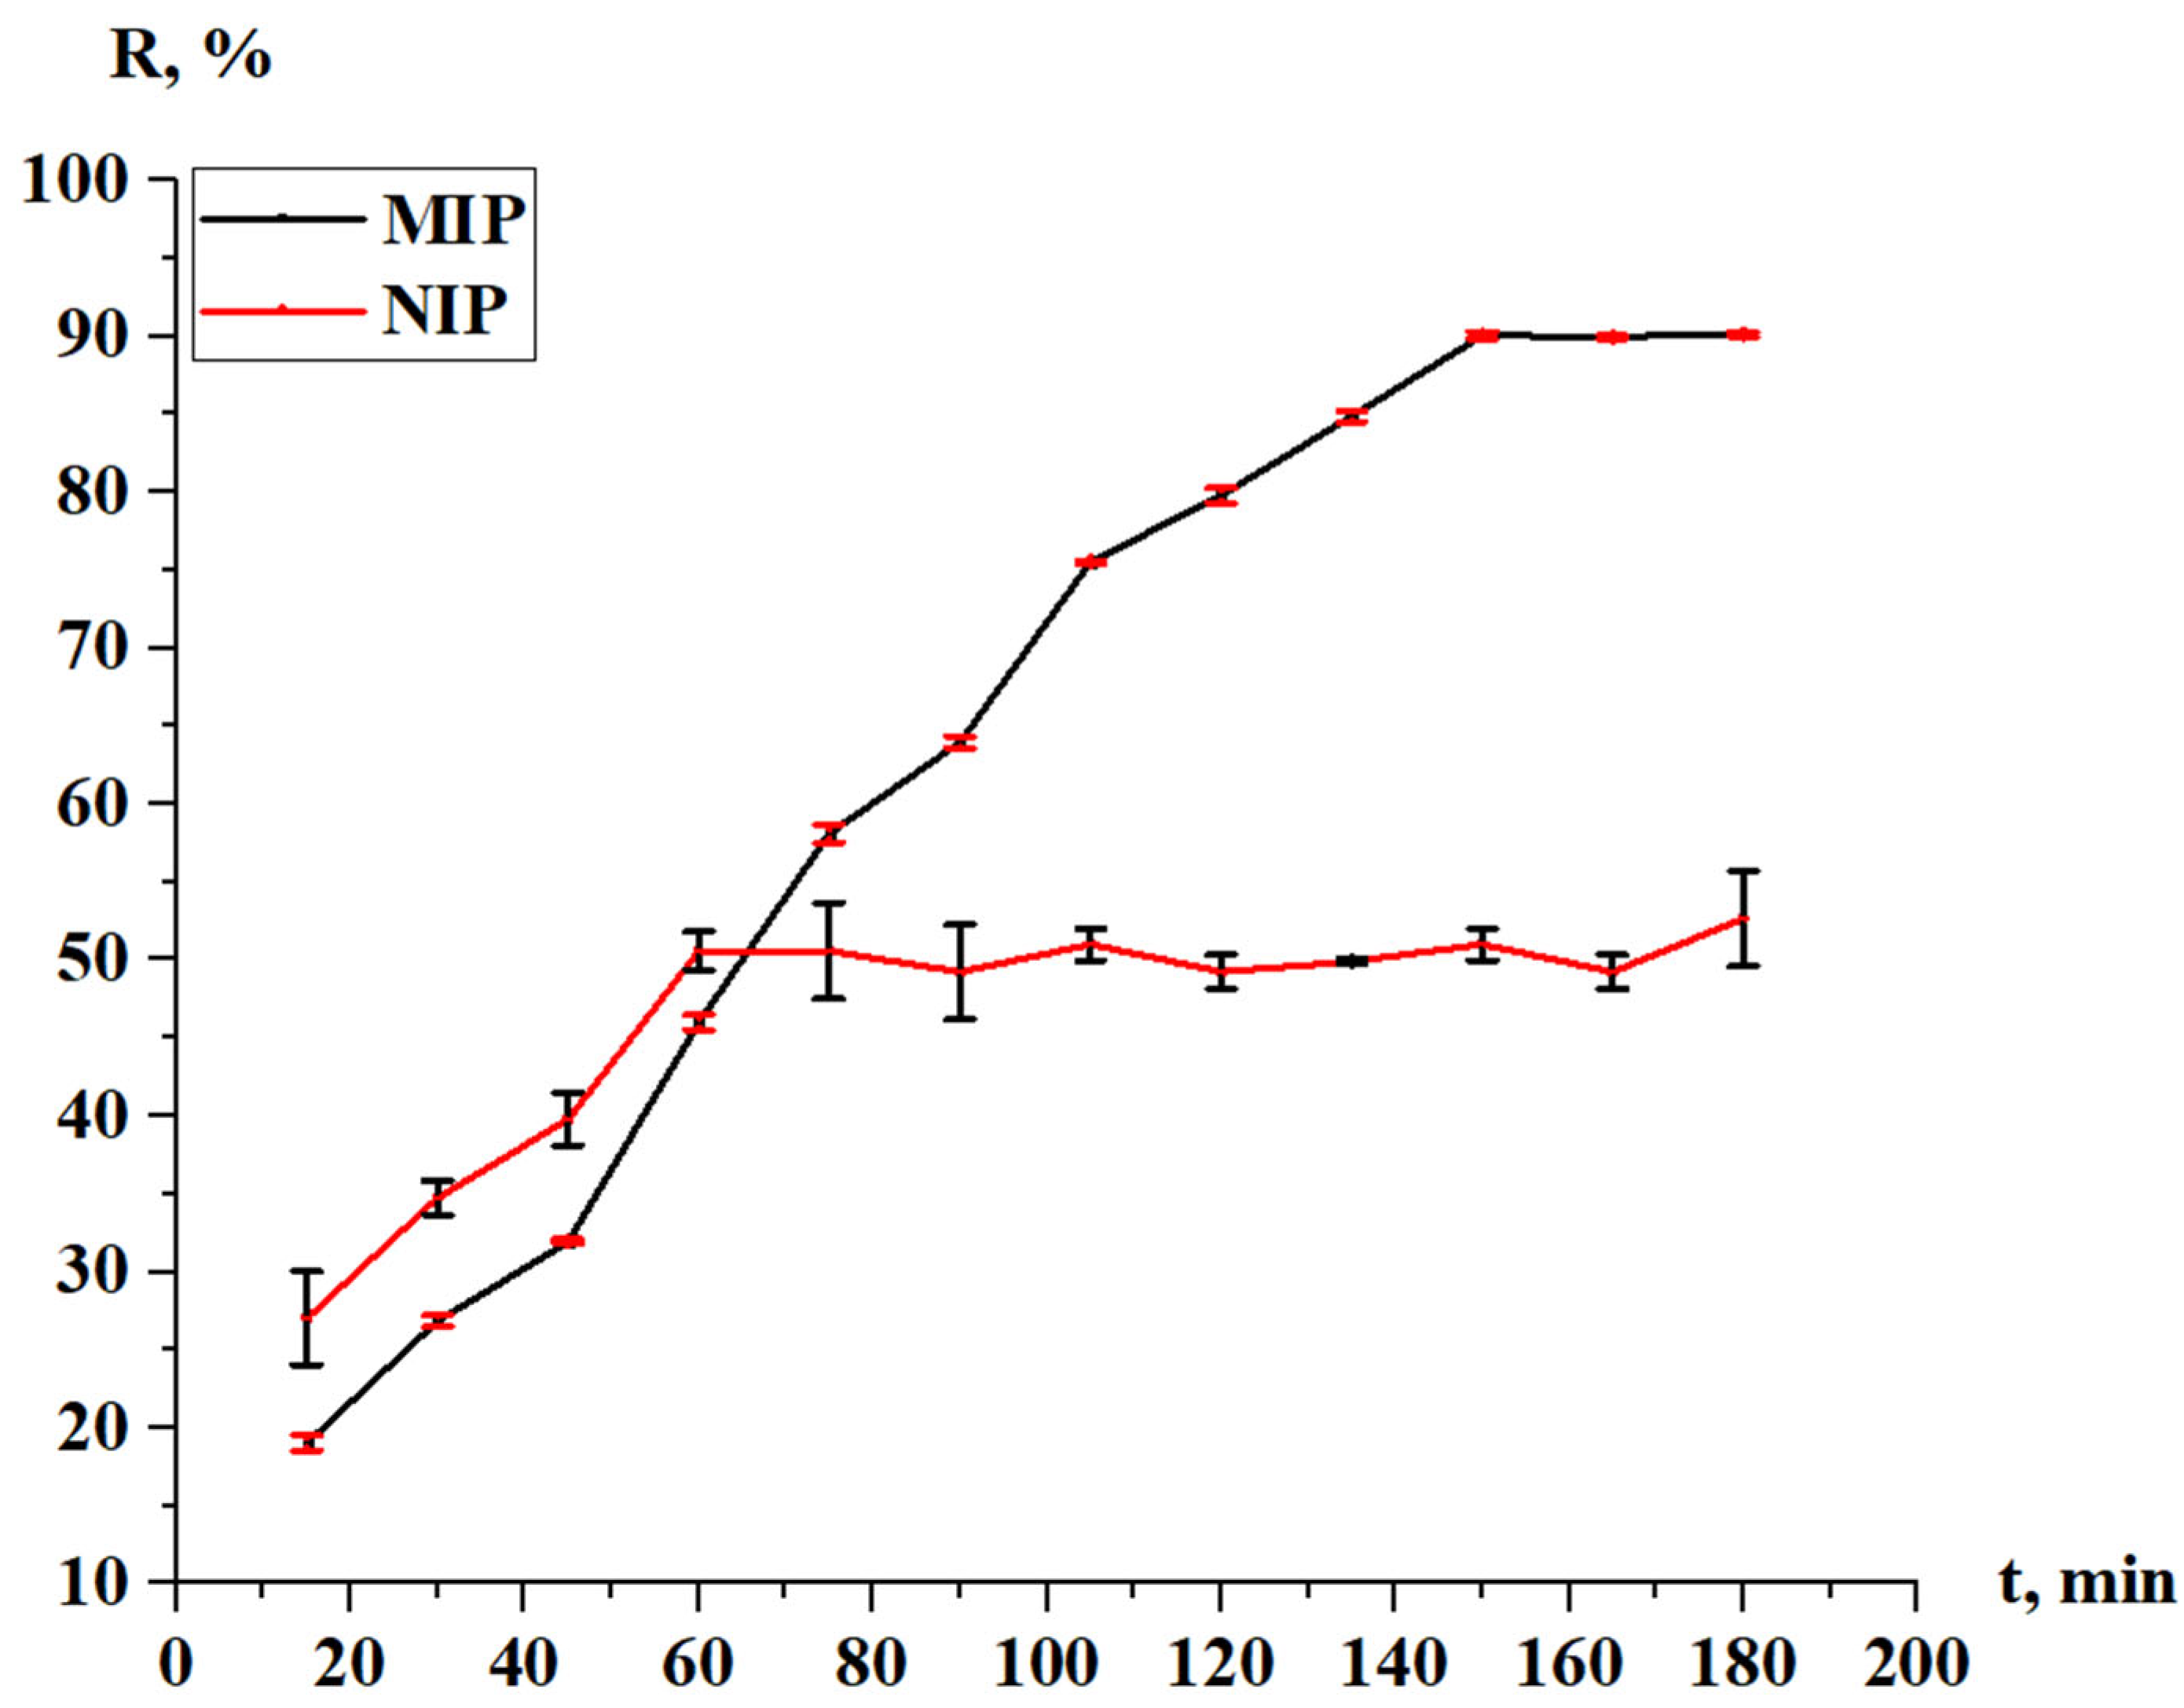
3.2.4. Pseudo-Second-Order Kinetic Model
- (1)
- Joint comparison of h and qe for the studied sorbents;
- (2)
- High k2 ≠ “better”—it is only better if the qe is also high.
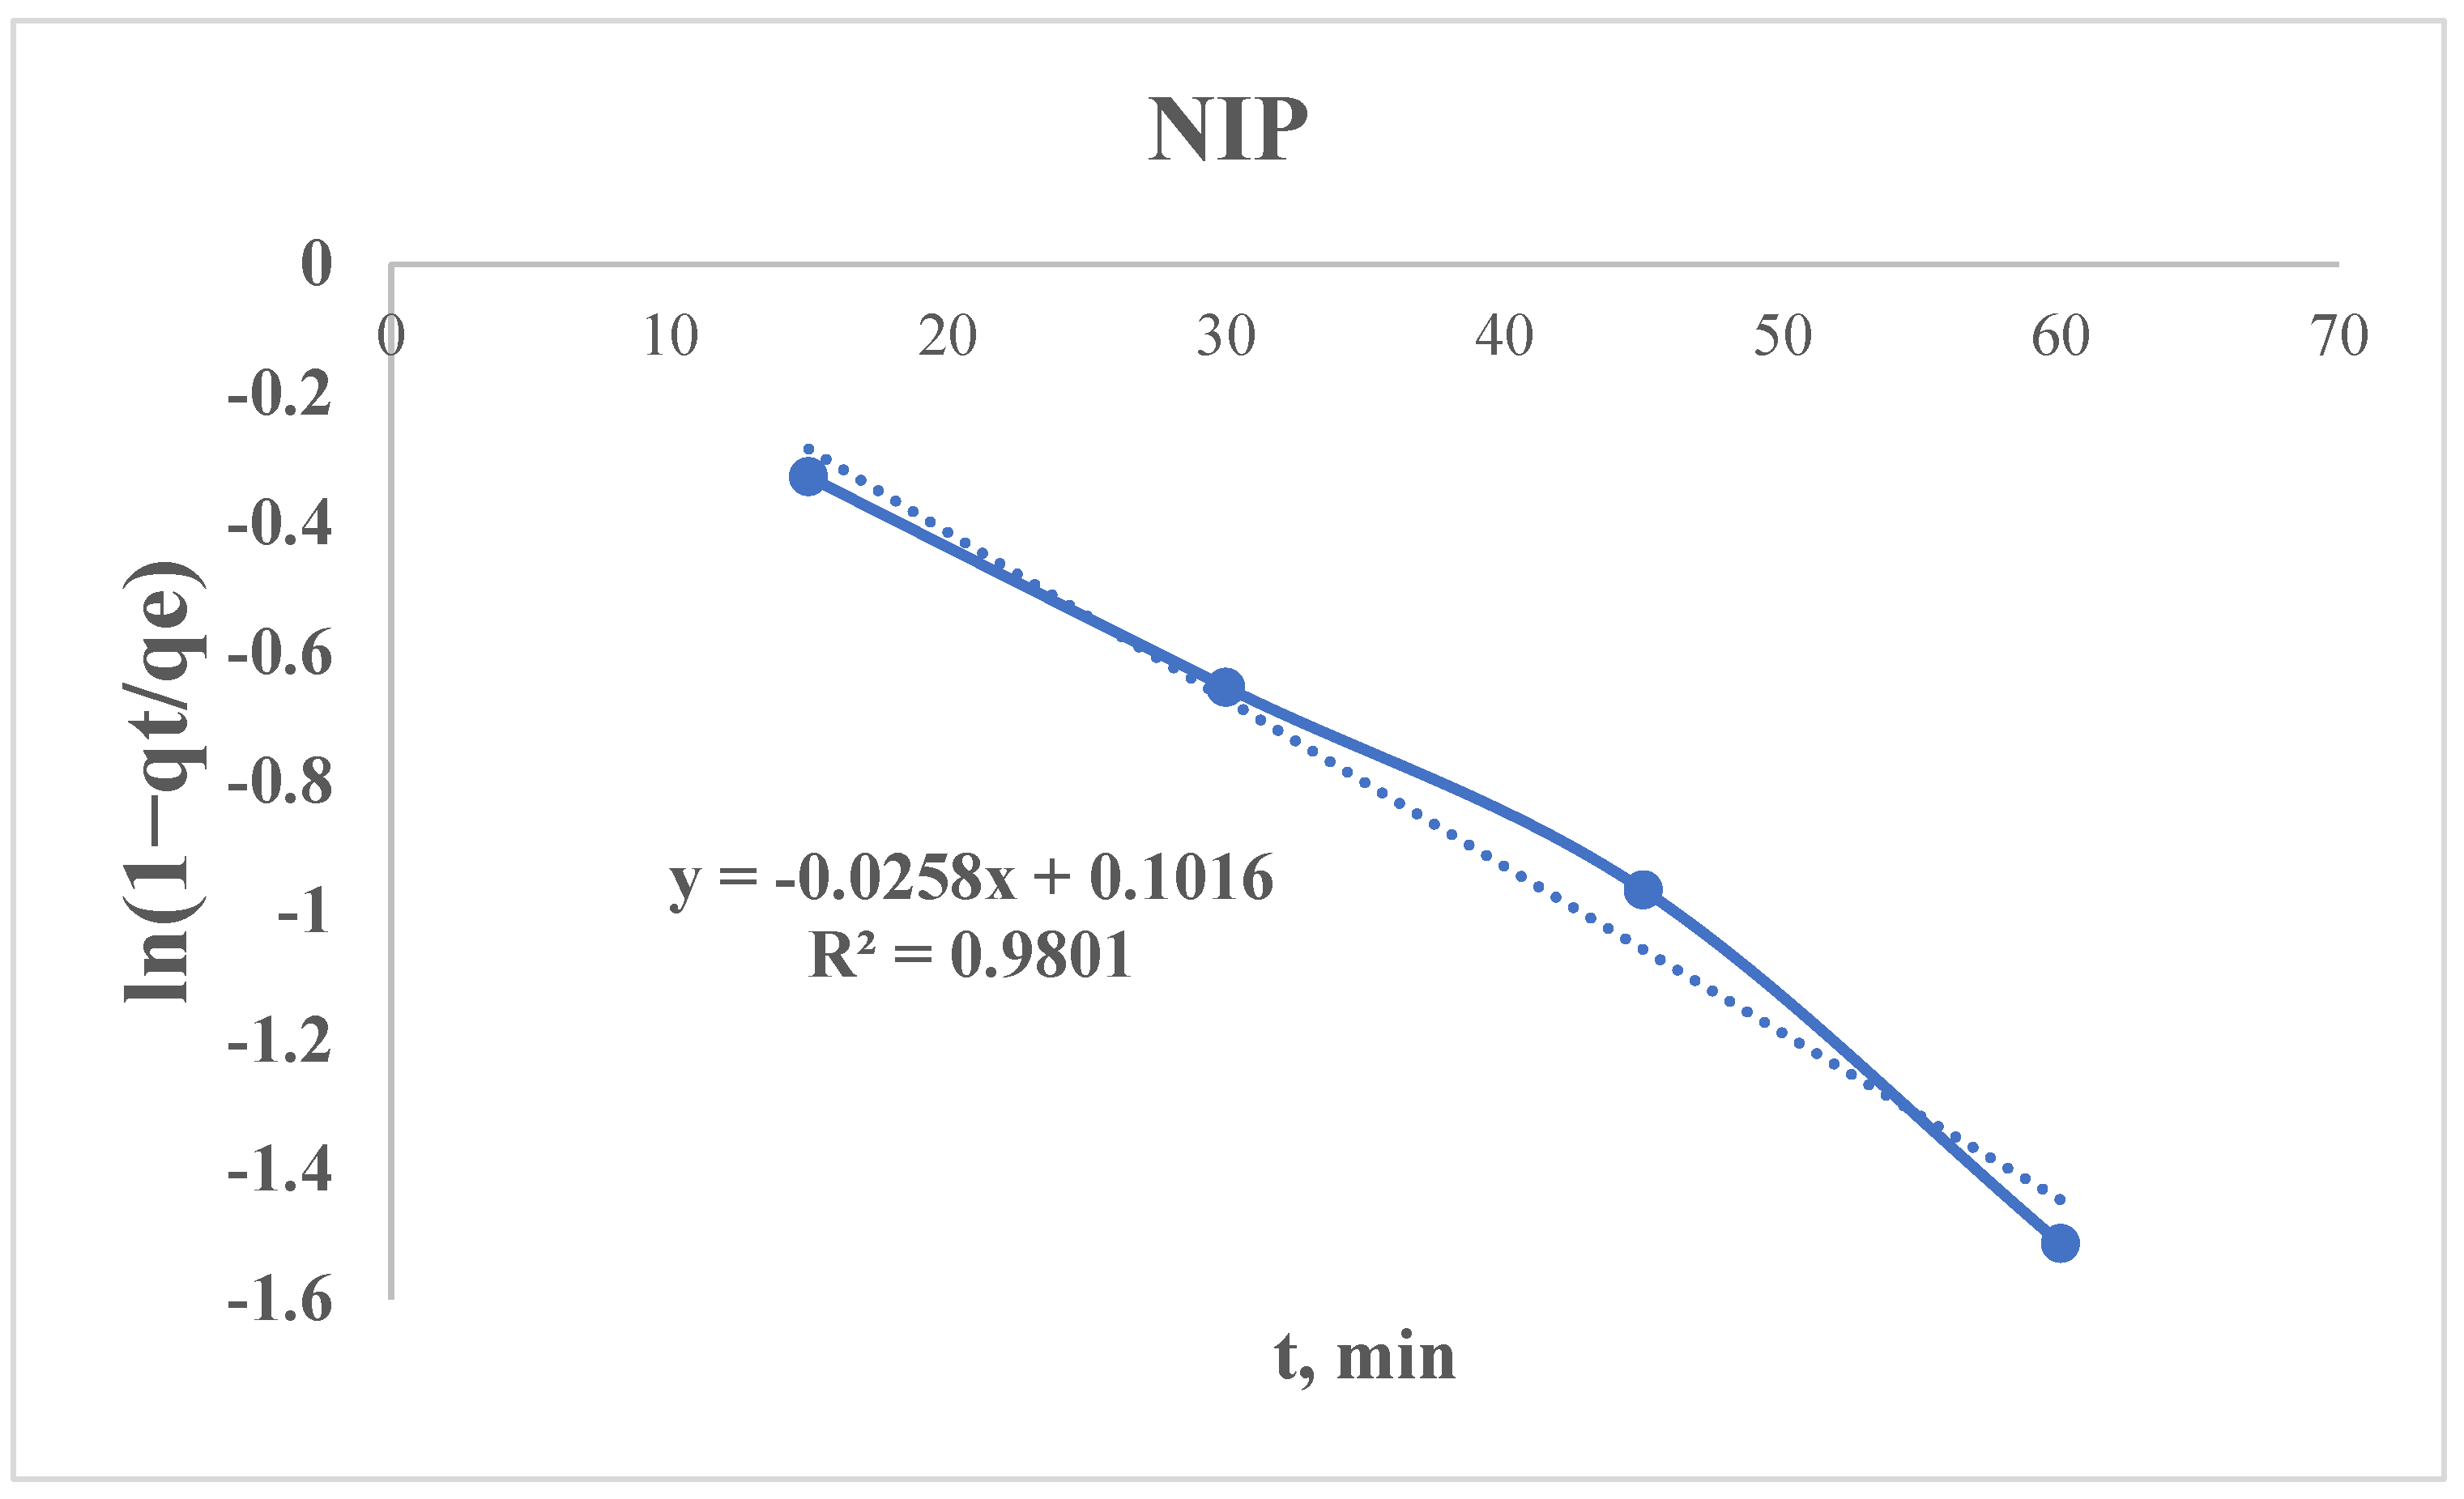
3.2.5. Radushkevich Kinetic Model
- Similar pore structures: If both sorbents have comparable porosity, their diffusion rates (Kr) may differ only slightly.
- Dominance of qe: The MIP may have more adsorption sites (higher qe), even if the kinetics are similar.
4. Conclusions
- (1)
- The synthesis conditions for obtaining molecularly imprinted structures with lead and terbium salts as the templates are developed. The molar ratio of template/monomer/monomer/cross-linker = 1:5:5:8 is the most accurate for the successful synthesis of MIP along with NIP.
- (2)
- MIPs contain large number of pores in comparison with NIPs, what is evidenced by the SEM analysis.
- (3)
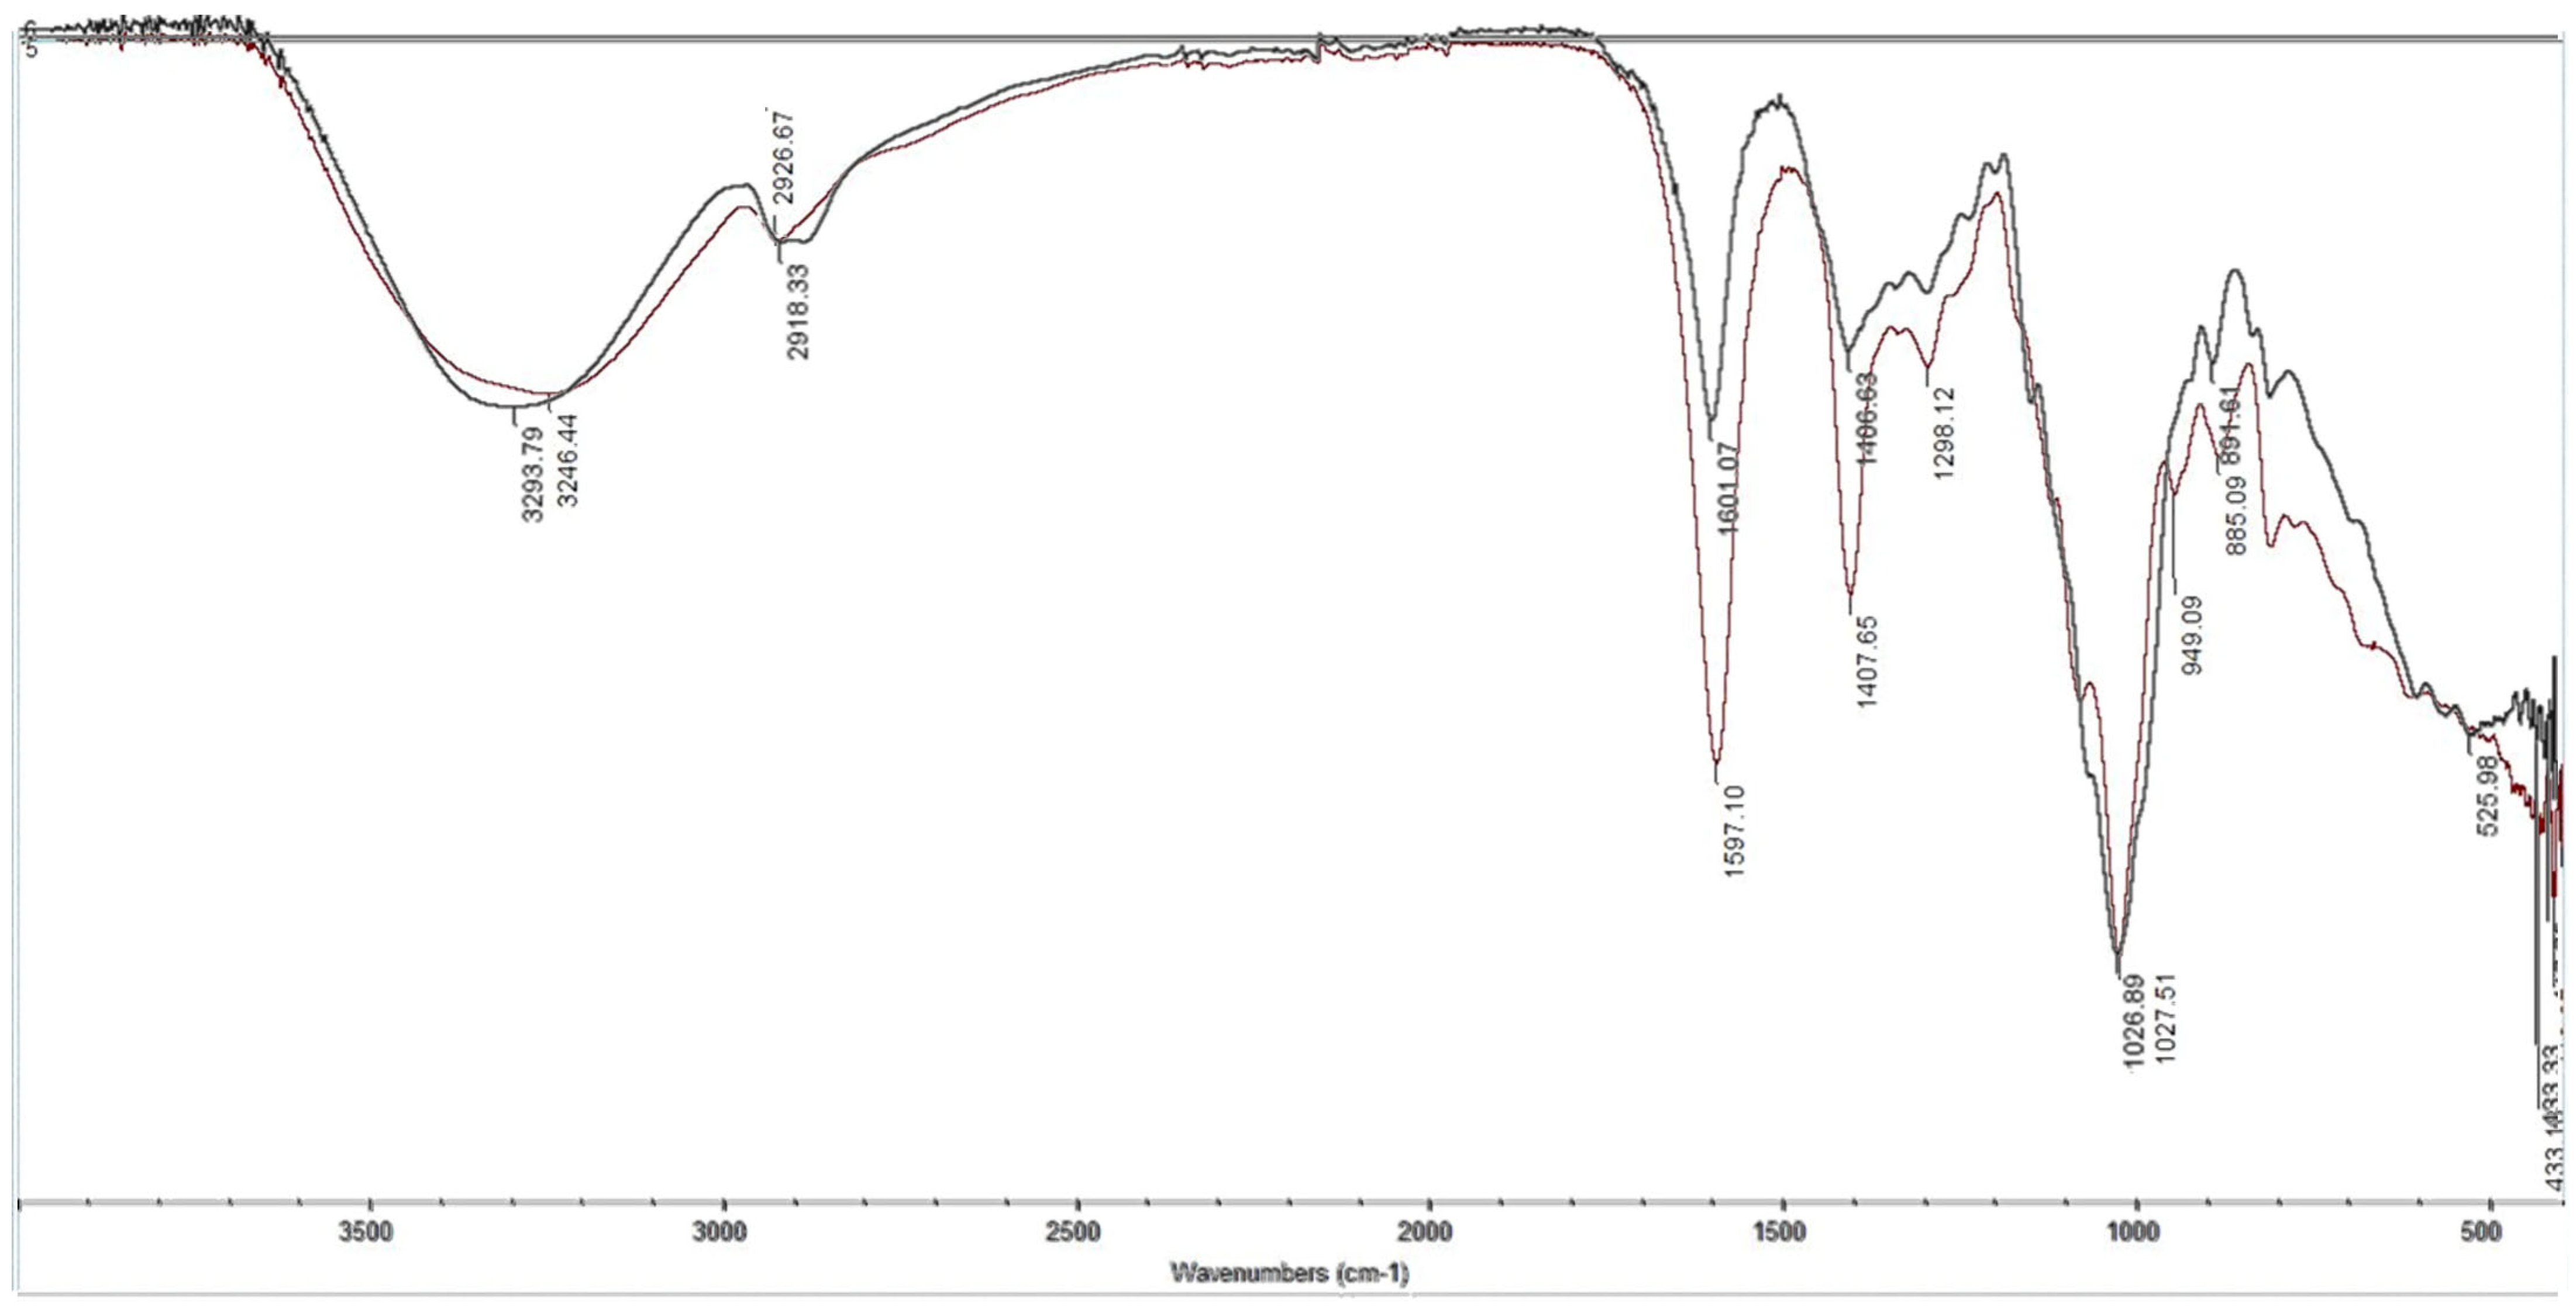
- A mechanism for obtaining MIP with a terbium template is suggested. The reaction is supposed to promote the hydrogen bonding of the salt part of rare earth metals with the carboxylic groups of methacrylic acid and the nitrogen groups of 2-vinylpyridine through the further polymerization of the monomers with the help of the cross-linker and initiator.
- (4)
- The sorption effectiveness (in view of the studied sorption properties) of the developed MIP is more than seven times higher in comparison with the NIP. According to the PSO kinetic model, the NIP might bind adsorbates weakly but rapidly, while in the case with the MIP, slower but more extensive adsorption is observed.
- (5)
- The desorption process of terbium from MIP and NIP allows extraction of 89.73% and 52.25% of the metal, respectively.
Author Contributions
Funding
Institutional Review Board Statement
Data Availability Statement
Acknowledgments
Conflicts of Interest
Abbreviations
| MIP | Molecularly imprinted polymer |
| NIP | Non-imprinted polymer |
| SEM | Scanning electron microscopy |
| FTIR | Fourier transform infrared spectroscopy |
| IF | Imprinting factor |
| MAA | Methacrylic acid |
| 2-VP | 2-vinylpyridine |
| DVB | Divinylbenzene |
| EGDMA | Ethylene glycol dimethacrylate |
| HEC | Hydroxyethyl cellulose |
| AIBN | Azobisisobutyronitrile |
References
- Samonin, V.V.; Spiridonova, E.A.; Khokhlachev, S.P.; Podvyaznikov, M.L. Promising Directions for Production and Application of Inorganic Sorbent Materials. Russ. J. Inorg. Chem. 2024, 69, 392–397. [Google Scholar] [CrossRef]
- Fuchs, A.; Smith, S.V.; Hollis, J.; Thorogood, G.; Griffth, C. Separation of 143Pr and 143Ce using hexagonal tungsten bronze inorganic sorbents. J. Label. Comp. Radiopharm. 2005, 48, S113. [Google Scholar]
- Hao, L.; Fang, X.; Chen, Y.F.; Ren, X.J. Properties of Europium (III) chelating polymer film. Adv. Mater. Res. 2013, 750–752, 836–839. [Google Scholar] [CrossRef]
- Sargsyan, S.H.; Margaryan, K.S. Polymer chelates of Fe, Co, and Ni based on 5-ethynyl-2H-tetrazole. Russ. J. Gen. Chem. 2014, 84, 1385–1388. [Google Scholar] [CrossRef]
- Melnikov, Y.A.; Ergozhin, E.E.; Chalov, T.K.; Nikitina, A.I. Sorption of chromium (VI) ions by anionites based on epoxidized derivatives of aniline and benzylamine. Life Sci. J. 2014, 11, 252–254. [Google Scholar]
- Melnikov, Y.A.; Ergozhin, E.E.; Chalov, T.K.; Nikitina, A.I. The anion exchange resin based on diglycidyl benzylamine and polyethylenimine to extract perrenate ions. Int. J. Chem. Sci. 2015, 13, 990–996. [Google Scholar]
- Ergozhin, E.E.; Chalov, T.K.; Kovrigina, T.V.; Melnikov, E.A.; Nikitina, A.I. Performance of anion exchangers based on aniline, epichlorohydrin, and polyamines in sorption of molybdenum(VI) ions. Russ. J. Appl. Chem. 2017, 90, 769–774. [Google Scholar] [CrossRef]
- Ergozhin, E.E.; Chalov, T.K.; Kovrigina, T.V.; Mel’nikov, E.A. Study of Sorption Properties for Lead(II) Ions Exhibited by Anion Exchangers Synthesized on the Basis of Aromatic Hydrocarbons, Epichlorohydrin, and Polyethyleneimine. Russ. J. Appl. Chem. 2018, 91, 1471–1477. [Google Scholar] [CrossRef]
- Ergozhin, E.E.; Chalov, T.K.; Kovrigina, T.V.; Melnikov, Y.A.; Begenova, B.E. Baromembrane technologies for purification of industrial wastes, using pulse water treatment. Bull. Karaganda Univ. Chem. Ser. 2020, 98, 83–91. [Google Scholar] [CrossRef]
- Ergozhin, E.E.; Chalov, T.K.; Kovrigina, T.V.; Melnikov, Y.A. Physicochemical and sorption properties of anionites based on aromatic amines, epichlorohydrin and polyethylenimine with regard to strontium (II) ions. J. Environ. Treat. Tech. 2020, 8, 1568–1573. [Google Scholar] [CrossRef]
- Melnikov, Y.; Kondaurov, R.; Agibayeva, L. Effect of Lanthanum Sorption on the Behavior of Rarely Crosslinked Acidic and Basic Polymer Hydrogels during Remote Interaction. Polymers 2023, 15, 1420. [Google Scholar] [CrossRef]
- Skripkina, T.; Belokozenko, M.; Shatskaya, S.; Tikhova, V.; Lomovskiy, I. Concentrating rare earth elements in brown coal humic acids by mechanochemical treatment. RSC Adv. 2021, 11, 36016–36022. [Google Scholar] [CrossRef] [PubMed]
- Hubicki, Z.; Wawrzkiewicz, M.; Wolowicz, A. Application of Ion Exchange Methods in Recovery of Pd(II) Ions—A Review. Chem. Anal. 2008, 53, 759–784. [Google Scholar]
- Apostol, L.C.; Gavrilescu, M. Application of natural materials as sorbents for persistent organic pollutants. Environ. Eng. Manag. J. 2009, 8, 243–252. [Google Scholar] [CrossRef]
- Wawrzkiewicz, M. Use of various sorbents in removal of dyes from aqueous solutions and industrial wastewaters. Przem. Chem. 2012, 91, 45–52. [Google Scholar]
- Rosenberg, E.; Pinson, G.; Tsosie, R.; Tutu, H.; Cukrowska, E. Uranium Remediation by Ion Exchange and Sorption Methods: A Critical Review Various types of solid phase sorbents are studied and evaluated. Johns. Matthey Technol. Rev. 2016, 60, 59–77. [Google Scholar] [CrossRef]
- Balram; Kaith, B.S. Removal of hazardous metal ions from polluted water using biomaterial-based ion-exchangers: A review. Mater. Today-Proc. 2022, 53, 174–178. [Google Scholar] [CrossRef]
- Vijayan, P.P.; Chithra, P.G.; Krishna, S.V.A.; Ansar, E.B.; Parameswaranpillai, J. Development and Current Trends on Ion Exchange Materials. Sep. Purif. Rev. 2024, 53, 40–60. [Google Scholar] [CrossRef]
- Alimuddin, S.A.; Khan, S.A. Developments in synthesis, characterization and applications of tin(IV) based composite ion ex-changers: A review. J. Coord. Chem. 2024, 77, 2279–2294. [Google Scholar] [CrossRef]
- Keçili, R.; Hussain, C.G.; Ghorbani-Bidkorpeh, F.; Hussain, C.M. Environmentally-friendly ion imprinted polymers (IIPs) towards metal pollutants in environmental samples: Recent advances and future prospects. TrAC Trends Anal. Chem. 2025, 184, 118132. [Google Scholar] [CrossRef]
- Zhou, X.; Wang, B.; Wang, R. Insights into ion-imprinted materials for the recovery of metal ions: Preparation, evaluation and application. Sep. Purif. Technol. 2022, 298, 121469. [Google Scholar] [CrossRef]
- Fu, J.Q.; Wang, X.Y.; Li, J.H.; Chen, L.X. Ion Imprinting Technology for Heavy Metal Ions. Prog. Chem. 2016, 28, 83–90. [Google Scholar] [CrossRef]
- Lazar, M.M.; Ghiorghita, C.-A.; Dragan, E.S.; Humelnicu, D.; Dinu, M.V. Ion-Imprinted Polymeric Materials for Selective Adsorption of Heavy Metal Ions from Aqueous Solution. Molecules 2023, 28, 2798. [Google Scholar] [CrossRef] [PubMed]
- Huang, Y.; Wang, R. Review on Fundamentals, Preparations and Applications of Imprinted Polymers. Curr. Org. Chem. 2018, 22, 1600–1618. [Google Scholar] [CrossRef]
- Cormack, P.A.G.; Elorza, A.Z. Molecularly imprinted polymers: Synthesis and characterization. J. Chromatogr. B 2004, 804, 173–182. [Google Scholar] [CrossRef]
- Yan, H.Y.; Row, K.H. Characteristic and Synthetic Approach of Molecularly Imprinted Polymer. Int. J. Mol. Sci. 2006, 7, 155–178. [Google Scholar] [CrossRef]
- Chen, H.X.; Guo, J.H.; Wang, Y.; Dong, W.L.; Zhao, Y.J.; Sun, L.Y. Bio-Inspired Imprinting Materials for Biomedical Applications. Adv. Sci. 2022, 9, e2202038. [Google Scholar] [CrossRef]
- Neves, M.I.; Wechsler, M.E.; Gomes, M.E.; Reis, R.L.; Granja, P.L.; Peppas, N.A. Molecularly Imprinted Intelligent Scaffolds for Tissue Engineering Applications. Tissue Eng. Part B-Rev. 2017, 23, 27–43. [Google Scholar] [CrossRef]
- Zaidi, S.A. Molecular imprinted polymers as drug delivery vehicles. Drug Deliv. 2014, 23, 2262–2271. [Google Scholar] [CrossRef]
- Noor, M.; Iqbal, K.M.; Kanwal, T.; Rehman, K.; Ali, M.; Shah, M.R. Synthesis and characterization of modified silica nano-particles based molecularly imprinted polymers as a sensor for selective detection of pendimethalin from drinking water. J. Mol. Struct. 2023, 1287, 135635. [Google Scholar] [CrossRef]
- Li, W.; Li, S.J. Molecular Imprinting: A Versatile Tool for Separation, Sensors and Catalysis. In Oligomers Polymer Composites Molecular Imprinting. Advances in Polymer Science; Springer: Berlin/Heidelberg, Germany, 2007; p. 206. [Google Scholar] [CrossRef]
- Alexander, C.; Davidson, L.; Hayes, W. Imprinted polymers: Artificial molecular recognition materials with applications in synthesis and catalysis. Tetrahedron 2003, 59, 2025–2057. [Google Scholar] [CrossRef]
- Zhang, L.X.; Yu, H.; Chen, H.F.; Huang, Y.H.; Bakunina, I.; de Sousa, D.P.; Sun, M.N.; Zhang, J.Y. Application of molecular imprinting polymers in separation of active compounds from plants. Fitoterapia 2022, 164, 105383. [Google Scholar] [CrossRef] [PubMed]
- Zhang, N.; Xu, Y.R.; Li, Z.L.; Yan, C.R.; Mei, K.; Ding, M.L.; Ding, S.C.; Guan, P.; Qian, L.W.; Du, C.B.; et al. Molecularly Imprinted Materials for Selective Biological Recognition. Macromol. Rapid Commun. 2019, 40, e1900096. [Google Scholar] [CrossRef]
- He, Y.F.; Pang, Y.Q.; Ge, C.; Xu, Y. Molecular Imprinted Technology-based on Sensing Detection of Bacteria. Prog. Biochem. Biophys. 2023, 50, 1319–1329. [Google Scholar] [CrossRef]
- Davidson, L.; Hayes, W. Molecular Imprinting of Biologically Active Steroidal Systems. Curr. Org. Chem. 2002, 6, 265–281. [Google Scholar] [CrossRef]
- Pidenko, P.S.; Presnyakov, K.Y.; Burmistrova, N.A. Proteins: Templates and Matrices in Molecular Imprinting. J. Anal. Chem. 2023, 78, 953–964. [Google Scholar] [CrossRef]
- Lv, T.J.; Chen, T.T.; Zhu, Z.Y.; Haotian, R.; Luo, A.Q.; Liang, A.X. Application of Oriented Molecular Imprinting Biosensors in Biomarker Detection. J. Anal. Test. 2024, 8, 553–568. [Google Scholar] [CrossRef]
- Ertürk, G.; Mattiasson, B. Molecular Imprinting Techniques Used for the Preparation of Biosensors. Sensors 2017, 17, 288. [Google Scholar] [CrossRef]
- Saylan, Y.; Yilmaz, F.; Ozgur, E.; Derazshamshir, A.; Yavuz, H.; Denizli, A. Molecular Imprinting of Macromolecules for Sensor Applications. Sensors 2017, 17, 898. [Google Scholar] [CrossRef]
- Bhogal, S.; Kaur, K.; Malik, A.K.; Sonne, C.; Lee, S.S.; Kim, K.H. Core-shell structured molecularly imprinted materials for sensing applications. TrAC Trends Anal. Chem. 2020, 133, 16043. [Google Scholar] [CrossRef]
- Pohanka, M. Sensors Based on Molecularly Imprinted Polymers. Int. J. Electrochem. Sci. 2017, 12, 8082–8094. [Google Scholar] [CrossRef]
- Cao, Y.; Feng, T.; Xu, J.; Xue, C. Recent advances of molecularly imprinted polymer-based sensors in the detection of food safety hazard factors. Biosens. Bioelectron. 2023, 420, 111447. [Google Scholar] [CrossRef] [PubMed]
- Zhang, Y.; Zhang, J.; Liu, Q. Gas Sensors Based on Molecular Imprinting Technology. Sensors 2017, 17, 1567. [Google Scholar] [CrossRef] [PubMed]
- Wang, S.T.; Xu, S.F.; Zhou, Q.Q.; Liu, Z.M.; Xu, Z.G. State-of-the-art molecular imprinted colorimetric sensors and their on-site inspecting applications. J. Sep. Sci. 2023, 46, e2201059. [Google Scholar] [CrossRef]
- Yola, M.L.; Atar, N. A Review: Molecularly Imprinted Electrochemical Sensors for Determination of Biomolecules/Drug. Curr. Anal. Chem. 2017, 13, 13–17. [Google Scholar] [CrossRef]
- Elhachem, M.; Cayot, P.; Abboud, M.; Louka, N.; Maroun, R.G.; Bou-Maroun, E. The Importance of Developing Electrochemical Sensors Based on Molecularly Imprinted Polymers for a Rapid Detection of Antioxidants. Antioxidants 2021, 10, 382. [Google Scholar] [CrossRef]
- Maria, C.G.A.; Varghese, A.; Nidhin, M. Recent Advances in Nanomaterials Based Molecularly Imprinted Electrochemical Sensors. Crit. Rev. Anal. Chem. 2021, 53, 88–97. [Google Scholar] [CrossRef]
- Yang, Y.K.; Wang, X.M.; Fang, G.Z.; Yun, Y.G.; Guo, T.; Wang, S. Electrochemiluminescence Analysis Based on Molecular Imprinting Technique. Prog. Chem. 2016, 28, 1351–1362. [Google Scholar] [CrossRef]
- Adisyahputra, U.; Irkham, S.; Pratomo, U.; Rochani, S.; Hartati, Y.W. Advancement in Ion-Imprinted Polymers for Separation and Analysis of Rare Earth Elements. Sep. Purif. Rev. 2024, 1–20. [Google Scholar] [CrossRef]
- Yusoff, M.M.; Mostapa, N.R.N.; Sarkar, M.S.; Biswas, T.K.; Rahman, M.L.; Arshad, S.E.; Sarjadi, M.S.; Kulkarni, A.D. Synthesis of ion imprinted polymers for selective recognition and separation of rare earth metals. J. Rare Earths 2017, 35, 177–186. [Google Scholar] [CrossRef]
- Zulfikar, M.A.; Zarlina, R.; Rusnadi; Handayani, N.; Alni, A.; Wahyuningrum, D. Separation of Yttrium from Aqueous Solution Using Ionic Imprinted Polymers. Russ. J. Non-ferrous Met. 2017, 58, 614–624. [Google Scholar] [CrossRef]
- Araki, K.; Yoshida, M.; Uezu, K.; Goto, M.; Furusaki, S. Lanthanide-Imprinted Resins Prepared by Surface Template Polymerization. J. Chem. Eng. Jpn. 2000, 33, 665–668. [Google Scholar] [CrossRef]
- Gao, X.C.; Gao, B.J.; Niu, Q.Y.; Zhao, J. Studies on Recognition and Separation of Neighbor Rare Earth Ions on Scale of Picometer Using Novel Surface Ion-Imprinted Material. Acta Chim. Sin. 2010, 68, 1109–1118. [Google Scholar]
- Kondaurov, R.; Melnikov, Y.; Agibayeva, L. Application of Molecular Imprinting for Creation of Highly Selective Sorbents for Extraction and Separation of Rare-Earth Elements. Polymers 2023, 15, 846. [Google Scholar] [CrossRef] [PubMed]
- Bunina, Z.; Bryleva, K.; Belikov, K. Synthesis and Adsorption Properties of Gadolinium-Imprinted Divinylbenzene-Based Copolymers. ACS Omega 2021, 6, 3336–3344. [Google Scholar] [CrossRef]
- Zhang, H.; Gao, Y. Polymeric Materials for Rare Earth Elements Recovery. Gels 2023, 9, 775. [Google Scholar] [CrossRef]
- Artiushenko, O.; da Silva, R.F.; Zaitsev, V. Recent advances in functional materials for rare earth recovery: A review. Sustain. Mater. Technol. 2023, 37, e00681. [Google Scholar] [CrossRef]
- Sharifian, S.; Wang, N.H.L. Resin-based approaches for selective extraction and purification of rare earth elements: A comprehensive review. J. Environ. Chem. Eng. 2024, 12, 112402. [Google Scholar] [CrossRef]
- Ehrlich, G.V.; Lisichkin, G.V. Sorption in the chemistry of rare earth elements. Russ. J. Gen. Chem. 2017, 87, 1220–1245. [Google Scholar] [CrossRef]
- Li, X.Z.; Sun, Y.P. Progress in solid-liquid extraction resin for separation of rare earth elements. J. Rare Earths 2005, 23, 581–592. [Google Scholar]
- Li, J.P.; Yang, B.; Pan, H.C.; Xu, G.B. Molecularly imprinted sensor based on Russian Matryoshka structured molecules for enhanced specific identification and double amplification in ultra-trace Tb3+ determination. Biosens. Bioelectron. 2018, 109, 224–229. [Google Scholar] [CrossRef] [PubMed]
- Ensafi, A.A.; Kazemifard, N.; Dehkordi, Z.S. Chapter 3 Parameters that affect molecular imprinting polymers. In Molecularly Imprinted Polymer Composites; Woodhead Publishing: Sawston, UK, 2021; pp. 21–48. [Google Scholar] [CrossRef]
- Boukadida, M.; Anene, A.; Jaoued-Grayaa, N.; Chevalier, Y.; Hbaieb, S. Choice of the functional monomer of molecularly imprinted polymers: Does it rely on strong acid-base or hydrogen bonding interactions? Colloid Interface Sci. Commun. 2022, 50, 100669. [Google Scholar] [CrossRef]
- Hasanah, A.N.; Safitri, N.; Zulfa, A.; Neli, N.; Rahayu, D. Factors Affecting Preparation of Molecularly Imprinted Polymer and Methods on Finding Template-Monomer Interaction as the Key of Selective Properties of the Materials. Molecules 2021, 26, 5612. [Google Scholar] [CrossRef] [PubMed]
- Lisichkin, G.V.; Krutyakov, Y.A. Molecularly imprinted materials: Synthesis, properties, applications. Russ. Chem. Rev. 2006, 75, 998–1017. [Google Scholar] [CrossRef]
- Jiang, Y.; Kim, D. Effect of solvent/monomer feed ratio on the structure and adsorption properties of Cu2+-imprinted mi-croporous polymer particles. Chem. Eng. J. 2011, 166, 435–444. [Google Scholar] [CrossRef]
- Zahedi, P.; Ziaee, M.; Abdouss, M.; Farazin, A.; Mizaikoff, B. Biomacromolecule template-based molecularly imprinted polymers with an emphasis on their synthesis strategies: A review. Polym. Adv. Technol. 2016, 27, 1124–1142. [Google Scholar] [CrossRef]
- Ramström, O.; Andersson, L.I.; Mosbach, K. Recognition sites incorporating both pyridinyl and carboxy functionalities pre-pared by molecular imprinting. J. Org. Chem. 1993, 58, 7562–7564. [Google Scholar] [CrossRef]
- Tarasevich, B.N. IR Spectra of the Main Classes of Organic Compounds; Lomonosov Moscow State University: Moscow, Russia, 2012; p. 55. [Google Scholar]
- Nantasenamat, C.; Isarankura-Na-Ayudhya, C.; Naenna, T.; Prachayasittikul, V. Quantitative structure-imprinting factor relationship of molecularly imprinted polymers. Biosens. Bioelectron. 2007, 22, 3309–3317. [Google Scholar] [CrossRef]


| Ratio of Template/MAA/2-VP/DVB | Amount of Monomers, mL | Mass, mg | |
|---|---|---|---|
| MAA | 2-VP | AIBN | |
| 1:2:2:8 | 0.848 | 1.085 | 19.1 |
| 1:4:4:8 | 1.696 | 2.17 | 38.2 |
| 1:5:5:8 | 2.12 | 2.712 | 47.7 |
| Ratio of Template/MAA/2-VP/DVB | Description |
|---|---|
| 1:2:2:8 | Oily, non-porous |
| 1:4:4:8 | Dense, insufficiently porous |
| 1:5:5:8 | Spongy, porous |
| MIP of Lead Nitrate | |
|---|---|
| Color | White |
| Odor | Odorless |
| Consistency | Solid, cotton-like |
| Density | Low |
| Functional Group | Wavenumber, cm−1 (Theoretical Data) [70] | Wavenumber, cm−1 |
|---|---|---|
| -OH | 3550–3400 | 3433.32 |
| -CH2- | 2940–2915 | 2926.46 |
| -COO- | 1650–1550 | 1626.25 |
| -CH2-CO- | 1440–1400 | 1474.38 |
| Pyridine ring | 1100–1000 | 1063.98 |
| Sample | Mass of MAA, g | Mass of 2-VP, g | Total Mass, g |
|---|---|---|---|
| MIP of Tb | 0.237 | 0.289 | 0.526 |
| NIP of Tb | 0.237 | 0.289 | 0.526 |
| Functional Group | Wavenumber, cm−1 (Theoretical Data) [70] | Wavenumber, cm−1 (MIP) | Wavenumber, cm−1 (NIP) |
|---|---|---|---|
| -OH | 3400–3200 | 3246.44 | 3293.79 |
| -CH2- | 2940–2915 | 2926.67 | 2918.33 |
| -COO- | 1650–1550 | 1597.10 | 1601.07 |
| -CH2-CO- | 1440–1400 | 1407.65 | 1406.63 |
| Pyridine ring | 1100–1000 | 1027.51 | 1026.89 |
| 1,3-substitution | 900–860 | 885.09 | 891.61 |
| Sorption Parameter | MIP | NIP |
|---|---|---|
| Sorption degree, % | 70.80 ± 0.48 | 9.95 ± 0.07 |
| Sorption capacity, g/g | 3.54 + 0.02 | 0.50 ± 0.01 |
| Desorption degree, % | MIP | NIP |
| 89.73 ± 0.16 | 52.25 ± 3.06 |
Disclaimer/Publisher’s Note: The statements, opinions and data contained in all publications are solely those of the individual author(s) and contributor(s) and not of MDPI and/or the editor(s). MDPI and/or the editor(s) disclaim responsibility for any injury to people or property resulting from any ideas, methods, instructions or products referred to in the content. |
© 2025 by the authors. Licensee MDPI, Basel, Switzerland. This article is an open access article distributed under the terms and conditions of the Creative Commons Attribution (CC BY) license (https://creativecommons.org/licenses/by/4.0/).
Share and Cite
Agibayeva, L.; Melnikov, Y.; Berdaly, A.; Kondaurov, R. Development of Optimal Conditions for Synthesis of Molecularly Imprinted Polymers for Effective Terbium Sorption. Polymers 2025, 17, 1398. https://doi.org/10.3390/polym17101398
Agibayeva L, Melnikov Y, Berdaly A, Kondaurov R. Development of Optimal Conditions for Synthesis of Molecularly Imprinted Polymers for Effective Terbium Sorption. Polymers. 2025; 17(10):1398. https://doi.org/10.3390/polym17101398
Chicago/Turabian StyleAgibayeva, Laura, Yevgeniy Melnikov, Ayakoz Berdaly, and Ruslan Kondaurov. 2025. "Development of Optimal Conditions for Synthesis of Molecularly Imprinted Polymers for Effective Terbium Sorption" Polymers 17, no. 10: 1398. https://doi.org/10.3390/polym17101398
APA StyleAgibayeva, L., Melnikov, Y., Berdaly, A., & Kondaurov, R. (2025). Development of Optimal Conditions for Synthesis of Molecularly Imprinted Polymers for Effective Terbium Sorption. Polymers, 17(10), 1398. https://doi.org/10.3390/polym17101398