Abstract
The lifespan of an electrical transformer, primarily determined by the condition of its solid insulation, is well known under various operating conditions when mineral oil is the coolant in these machines. However, there is a trend toward replacing this oil with biodegradable fluids, especially esters; therefore, an understanding of the ageing of solid insulation with these fluids is essential. Currently available data do not allow for the selection of the best ester among those available on the market, as each study applies different conditions, making it impossible to compare results. Thus, this paper analyses the degradation of Kraft and Thermally Upgraded Kraft papers with the following five most promising commercial esters: sunflower, rapeseed, soybean, palm, and synthetic. The materials underwent accelerated thermal ageing at 130, 150, and 170 °C, and the integrity of the papers was evaluated through their polymerisation degree and the obtaining of the degradation kinetic models. The wide range of materials studied in this work, which were subjected to the same treatments, allows for a comparison of the esters, revealing significant differences in the impact of the alternative fluids. Sunflower, rapeseed, and soybean esters provided the best paper protection, i.e., the degree of polymerisation of Kraft paper in the tests at 150 °C decreased by 71% with these fluids, compared to the 83% reduction with mineral oil, 79% reduction with palm ester, and 75% reduction with synthetic ester. Furthermore, different kinetic models were obtained to predict the degradation; it was concluded that the Emsley model provides the best fit. Additionally, it was found that the behaviour of a dielectric fluid with one type of paper cannot be extrapolated, which is only noticeable in broad-scope studies.
1. Introduction
Despite the efficiency of oil-based cooling systems in power transformers, losses in the wires lead to increased temperatures, causing long-term damage [1]. Recurrent high temperatures particularly affect the solid insulation of the wires, primarily composed of cellulose polymers, whose chain integrity defines the equipment’s lifespan [2]. The polymers break by the following three main mechanisms, depending on the environmental conditions: hydrolysis, oxidation or pyrolysis [3].
In recent years, the substitution of the predominant mineral oils in transformers [4,5] with eco-friendly alternatives [6] as cooling fluids has been promoted. This applies to both new equipment and the retrofilling of existing transformers, refs. [7,8], to extend their lifespan and minimize environmental impacts. Currently, natural and synthetic esters are the most widespread options due to their biodegradability and performance capabilities [9,10]. However, it is not as simple as just replacing the oils, since the degradation of cellulose depends not only on its composition and treatment, but also on the dielectric fluid with which it is combined, refs. [11,12,13]. For this, reliable degradation data of the polymer with the alternative materials are fundamental.
Given the essential role of transformers in the electrical system and their cost [14], predicting the remaining life of their components is critical to avoid severe disruptions in electrical supply [15,16,17]. Various methodologies and techniques have been developed to predict transformer component life accurately based on operational data [18,19,20]. Nevertheless, when introducing new materials, there is a lack of available data from operational equipment, and laboratory tests are necessary to determine the feasibility of using these alternatives. These tests often involve measuring the time evolution of the polymerisation degree (DP) of cellulose or the mechanical properties of transformer paper samples under thermal stress [21,22,23]. Esters differ chemically from mineral oils and from each other, depending on the fatty acids and alcohols from which they are derived [9,24]. Consequently, experimental results may reflect this variability, allowing for the identification of the best alternative.
While numerous aging studies on esters have shown positive effects, their diverse methodologies hinder finding the best alternative fluid. More than 90% of these studies analyse only one or two esters, refs. [9,13,22,25,26], and there are variations in methodologies and in the conditions applied. For example, the test temperature can range from as low as 70 °C, ref. [27], to as high as 250 °C [28], affecting the degradation rate and the mechanisms involved [3]. Similar variations occur with the atmosphere in which the ageing process takes place [29], and the materials considered in the test, ref. [26]. Even quite similar experiments by different research groups yield non-comparable results, ref. [30]. These differences affect the development of useful polymer degradation prediction models for these fluids, with activation energy values as diverse as 86.94 kJ/mol in one study, ref. [31], and 120.64 kJ/mol in another, ref. [32].
Given these challenges and the available knowledge, it is necessary to analyse the behaviour of a wider variety of fluids and types of paper under thermal stress, consistently applying the same methodology to ensure comparable data. This work not only presents the evolution of the DP and how it depends on several factors, but also a study of kinetic models for predicting thermal degradation. It has been carried out at three ageing temperatures, analysing two types of transformer paper combined with the top five commercial dielectric esters, for a total of 36 combinations. The focus of the study is on dispelling any remaining doubts about the application of esters in transformers.
2. Materials and Methods
This section describes the materials studied in this work and the procedure followed to treat and analyse the samples.
2.1. Materials
The insulation systems for this work are composed of insulating paper and dielectric fluid. Two commercial dielectric papers were analysed; a medium-density Kraft paper and a thermally upgraded Kraft paper (TUK), whose properties are presented in Table 1. Both papers were supplied by the same manufacturer and have the same density and thickness (0.2 mm). The polymeric structure of the two papers was essentially the same, since both were obtained through the same manufacturing process. However, additives were added to the TUK paper pulp for the partial neutralization of water-forming agents (melamine, dicyandiamide, and/or polyacrylamide) or for the inhibition of water formation using stabilizing agents (cyanethylation), refs. [11,15]. This provides the TUK paper with greater resistance to ageing by reducing the reaction with water through hydrolysis.

Table 1.
Properties of the analysed papers.
The following six dielectric liquids were selected as fluids: a non-inhibited mineral oil; three natural esters obtained from sunflower, rapeseed, and soybean; a palm-based modified natural ester; and a synthetic ester. All fluids are commercially available and the main properties, provided by the manufacturers, are given in Table 2. These fluids were selected based on our previous reviewing work, in which it was found that approximately 75% of the available studies analysed these fluids, while the remaining 25% used other fluids or did not specify the types of fluid used. Furthermore, these are recognised as the main commercial esters in some specific reviews, due to their longevity on the market and their popularity, ref. [33].

Table 2.
Properties of the studied commercial fluids.
2.2. Accelerated Thermal Ageing
The experimental procedure followed consisted of the following 4 stages: material preparation, drying, impregnation, and thermal ageing. This methodology is used in most ageing studies, such as in [22,25,34]. First, the papers were cut and rolled to fit the dimensions of the 125 mL glass vials. Before being subjected to the ageing temperature, both the fluids and solids were dried, with the aim of replicating the manufacturing process of a transformer and to comply with the threshold values set in the standards. The paper drying was carried out in a forced-air circulation oven for 3 h at 105 °C. The fluids were dried at 60 °C for 24 h in a vacuum oven, applying cycles of 4 h at low pressure (50 mbar) and one hour at medium pressure in an N2 atmosphere (500 mbar). The average moisture content of both the fluids and papers after the drying processes is shown in Table 3. The moisture values reached comply with the corresponding regulations, both for the fluids, IEC 60296 [35], IEC 62770 [36], IEC 63012 [37] and IEC 61099 [24], and for the papers, IEEE C57.100 guide [38].

Table 3.
Average moisture content of the insulating materials at the beginning of the thermal ageing.
Then, the vials were filled with the corresponding fluid, and copper was introduced, resulting in an oil:paper:copper mass ratio of 16.3:1:1.3 in each vial, following the method defined by [38]. Subsequently, to prevent gas leakage during ageing, the vials were sealed with aluminium caps and butyl-PTFE septa. After that, they were placed in an oven at 60 °C for two hours to ensure the impregnation. Samples identified as 0 h were removed from the oven after completing the impregnation process.
Finally, the oven temperature was raised to reach the ageing temperature. In this study, three different tests were conducted as follows: 130, 150, and 170 °C. The ageing periods in which the samples were analysed were determined based on the solid material used and the applied temperature.
2.3. Characterisation
There are different tests to assess the state of cellulose, with one of the most common being the measurement of the DP. This property represents the number of monomers of β-glucose anhydride (C6H10O5) in a cellulose chain. With degradation, the bonds break, reducing the number of monomers.
The measurement of the DP was carried out following the IEC 60450 standard [39], by measuring the viscosity of a paper solution () in Bis(ethylenediamine) copper(II) hydroxide (Cu(H2NCH2CH2NH2)2(OH)2). From this value, , the intrinsic viscosity () was calculated using Martin’s empirical Formula (1):
Here, is the Martin constant ( = 0.14) and is the concentration of the solution, calculated using the Equation (2):
where is the mass of dry paper added to the solution, is the volume of added water, and is the volume of Cu(H2NCH2CH2NH2)2(OH)2.
Finally, the intrinsic viscosity is directly related to the degree of polymerisation by Equation (3):
where and are the Mark Houwink constants; = 0.0075 and = 1, ref. [39].
3. Results and Discussion
This section presents the results obtained from the study and provides an assessment based on their analysis.
3.1. DP Evolution during the Ageing
The evolution of the DP of the Kraft and TUK papers with the different fluids at the three temperatures is collected in Figure 1.
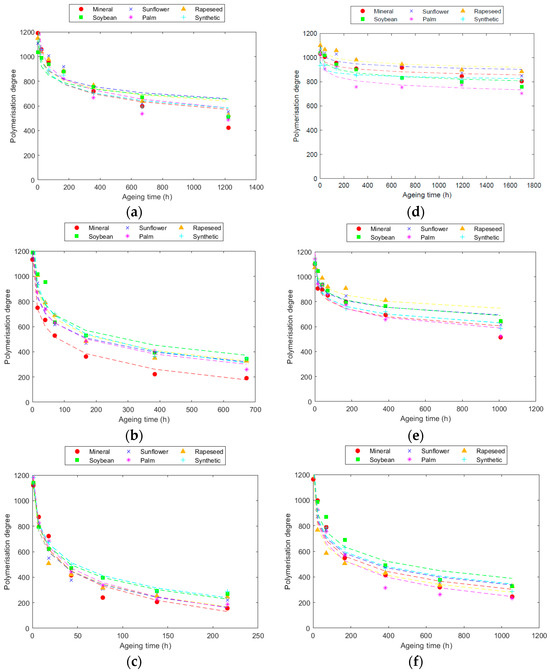
Figure 1.
Evolution of the Kraft paper DP at: (a) 130 °C; (b) 150 °C; and (c) 170 °C. Evolution of TUK paper DP at: (d) 130 °C; (e) 150 °C; and (f) 170 °C.
The results indicated a rapid decrease in DP at the initial stages of ageing, with a subsequent slowing down of the degradation rate following a logarithmic trend, as was also observed in other works [26]. The degradation process was faster when higher thermal stress conditions were applied to the papers, as was also shown in [23]. Specifically, for the same ageing duration, degradation was multiplied by a factor of 3 for every 20 °C rise in temperature.
In the case of Kraft paper, significant degradation occurred, especially when aged with mineral oil. This degradation was pronounced, reaching end-of-life conditions (DP < 200, ref. [40]) during the tests conducted at 150 °C and 170 °C. Contrasting results were observed in tests with esters, revealing some variations among them. Unmodified natural esters (sunflower, rapeseed, and soybean) demonstrated superior protection of Kraft paper, maintaining a higher DP compared to other fluids at the end of ageing, as was also observed in [8,12,26]. Ageing patterns were remarkably similar for these three fluids at all tested temperatures. Conversely, tests with palm ester showed a substantial drop in the DP compared to other natural esters, with degradation levels approaching those of mineral oil. Synthetic ester, despite providing better protection than mineral oil [13,30,41], performed less effectively than natural esters.
For the TUK paper, the behaviour differed slightly. Unmodified natural esters again proved to be more protective, with the DP decreasing uniformly across all three fluids. Synthetic ester, while resulting in lower PD compared to unmodified natural esters, outperformed palm and mineral fluids, though with a smaller margin than that observed in the Kraft paper. Notably, differences between the two paper types were evident, particularly in the case of palm ester, where TUK paper experienced greater ageing than with mineral oil.
When comparing the degradation of the two papers, TUK paper consistently exhibited a slower degradation rate than Kraft paper across all the analysed cases, as was observed in similar studies [22]. This difference was particularly pronounced during ageing at 130 °C, where degradation was very low. These results clearly demonstrate the protective effect of the additives in TUK paper against degradation, with degradation being approximately 2.5 times lower than that with Kraft paper, due to the reduced hydrolysis.
The results underscore the significant impact of thermal stress on degradation, with slower degradation rates observed at lower temperatures. Additionally, the study revealed that the differences in degradation between various fluids decreased with rising temperatures for both paper types. Specifically, at 170 °C, the advantage of natural esters over mineral oil was diminished compared to the differences observed at 150 °C and 130 °C.
3.2. Kinetic Models
Different models allow for the calculation of paper degradation rates as a function of changes in the DP. These models can be used to estimate the time required to reach a certain DP at the analysed temperatures. They are usually based on expressing the number of scissions per monomer, , as a function of time, (4):
Here, is the DP value at certain time and is the DP value at the initial time.
Each model relates, through different equations, the empirical S values with the temperature-dependent reaction constant, . From this, the activation energy () and the pre-exponential factor (), specific for each combination of materials, can be calculated through the Arrhenius Equation (5):
where is the universal gas constant with a value of 8.314 J/mol·K and is the temperature (K).
The following subsections present different available kinetic models obtained with the results from Section 3.2 in order to determine the best fit to the experimental data
3.2.1. Ekenstam
The simplest model is the zero-order model which, adapted to Equation (6) for high DP values, relates the DP to ageing time through a straight line passing through the origin. This model is based on the work of Ekenstam [42,43], and the Arrhenius equations.
Here, is the ageing time (h).
The modelling of the DP results following the Ekenstam equation is represented in Figure 2 for 150 °C, whereas the parameters obtained for each temperature are collected in Table 4 and Table 5, for Kraft and TUK paper, respectively. The steeper the slope of the line, the higher the value of k, and the faster the degradation of the paper. Once more, as it was explained in Section 3.1, the higher thermal resistance of the TUK paper can be observed in the figure, since the slope of the TUK paper evolution was smaller than that of the Kraft paper for all the fluids. Therefore, when comparing the results obtained at different temperatures, it can be seen that k was higher as the temperature increased [41]. When comparing the behaviour of the papers, it was confirmed that the TUK paper aged at a much slower rate than the Kraft paper, with the degradation rate of TUK paper at 170 °C being even lower than that of the Kraft paper at 150 °C.
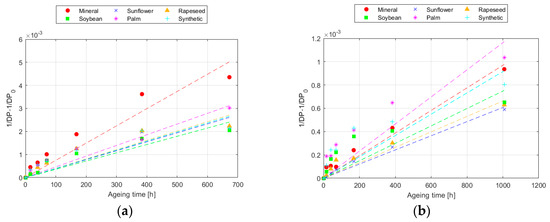
Figure 2.
Evolution of the Ekenstam equation at 150 °C for: (a) Kraft paper; and (b) TUK paper.

Table 4.
Degradation rate and energy activation of Kraft paper according to the Ekenstam model.

Table 5.
Degradation rate and energy activation of TUK paper according to the Ekenstam model.
Moreover, from the value of the reaction constant and the Arrhenius equation, the activation energies required to initiate the reaction of the papers with each of the fluids were obtained. The higher the activation energy, the more energy is required to initiate a specific process [44]. Therefore, applied to the case of thermal ageing, a higher temperature is needed to start the degradation process. The results show that in the ageing process with Kraft paper, the energy required to initiate activation was lower with mineral oil, followed by palm and synthetic esters. The paper impregnated with the unmodified natural esters had the highest activation energies, as was indicated in the DP analysis.
In the case of TUK paper, similar results to those of the Kraft paper were found for the unmodified natural and synthetic esters. However, palm ester required the lowest activation energy. This seems to indicate that if a fluid performs well with a particular type of paper, it does not necessarily mean that it is a good option for another type of paper.
3.2.2. Emsley
The Ekenstam model was modified by Emsley et al. [45] by the Equation (7):
Here, and are temperature-dependent parameters. These parameters, related through Equation (8), allow for the calculation of and how it changes over time:
The DP results modelled according to Equation (7) are presented in Figure 3 for 150 °C data and the numerical values for all the cases are collected in Table 6 and Table 7.
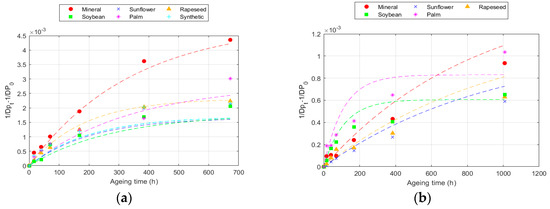
Figure 3.
Evolution of the Emsley equation at 150 °C for: (a) Kraft paper; and (b) TUK paper.

Table 6.
Parameters of Kraft paper according to the Emsley model.

Table 7.
Parameters of TUK paper according to the Emsley model.
As can be observed, the paper degradation is not linear at certain DP values, deviating from the linearity of the zero-model, which implies that the reaction velocity is not constant. This seems to be related to the fact that cellulose materials are not homogeneous, as they are primarily composed of the following three compounds: cellulose, hemicellulose, and lignin. The non-homogeneity causes some compounds to be more reactive than others [34,46].
This model achieved better fits (R2) for all temperatures compared to the Ekenstam model, since it adapts to the variation in degradation rate. The values obtained varied, depending on the fluid and paper used. The value of k10 increased with the ageing rate. Thus, k10 was higher as the temperature increased and was also higher in the Kraft paper than in the TUK one [12,32]. Moreover, k10 was higher in the Kraft paper when aged with mineral oil and in the TUK paper when aged with the palm ester. However, in this case, it was necessary to analyse the degradation rate at each point. An example of this calculation is represented in Figure 4, which shows the degradation data for the two types of cellulose materials at 150 °C. The ageing rate changed over time, being higher in the early stages and slowing down later. This rate changed depending on the paper and fluid used; for the same exposure time at the same temperature, it was lower in the TUK paper. While the degradation rate decreased as the exposure time increased, the change was not the same in all the fluids. Some of them, such as the palm ester, showed a more constant ageing rate, while others, such as the sunflower ester, had a greater change [31,47].
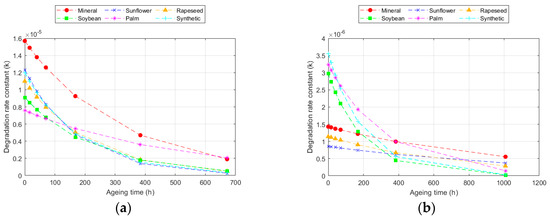
Figure 4.
Evolution of the degradation rate at 150 °C according to the Emsley model for: (a) Kraft paper; and (b) TUK paper.
3.2.3. Zervos
In addition to the previous models, some authors have subsequently proposed equations to characterise specific types of paper. In 2005, Zervos and Moropoulou [48] defined a specific kinetic model, (9), for cotton cellulose when aged in closed systems:
Here, is a temperature-dependent constant.
The fit of the DP variation according to this model is shown in Figure 5 for the 150 °C results, whereas the parameters for all the cases are collected in Table 8 and Table 9.
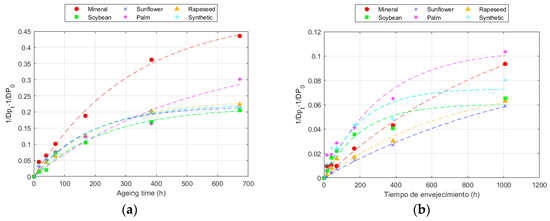
Figure 5.
Evolution of the Zervos equation at 150 °C for: (a) Kraft paper; and (b) TUK paper.

Table 8.
Parameters of Kraft paper according to Zervos model.

Table 9.
Parameters of TUK paper according to Zervos model.
This model, despite being specifically developed for cotton material, allowed for a good fit of the degradation of the two papers studied in this work and the fit was similar to that of the Emsley model.
3.2.4. Calvini
In 2006, Calvini and Gorassini [49] proposed a new interpretation of kinetic models. Until then, all models were based on expressing the number of scissions per monomer as a function of time (4). Instead, this model proposes the relationship with scissions per chain, , (10):
Based on this parameter, they suggested the expression (11):
This model considers the levelling-off degree of polymerisation (LODP), corresponding to a third state of degradation, where degradation occurs very slowly, ref. [3]. This state is only found in drastic degradations below a certain DP value, where the mechanical strength of cellulose is completely lost. Before reaching this state, cellulose polymers pass through two different states. In the first state, the weakest points are attacked, leading to a sharp decrease in DP. In the second state, where the amorphous fraction is lost, the decrease is slower [41]. Therefore, to apply this model, it is necessary to set an end-of-life criterion, which is usually a DP of 200 [40], but this depends on the paper and fluid analysed [12].
The variations in the DP analysed through this model are presented in Figure 6 for the 150 °C tests, whereas the numerical results for all the temperatures are shown in Table 10 and Table 11.
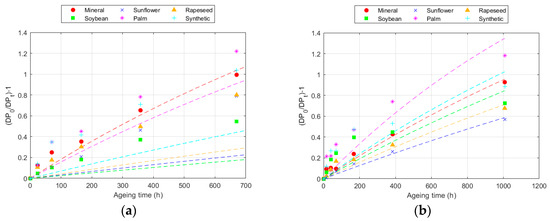
Figure 6.
Evolution of the Calvini equation at 150 °C for: (a) Kraft paper; and (b) TUK paper.

Table 10.
Parameters of Kraft paper according to the Calvini model.

Table 11.
Parameters of TUK paper according to the Calvini model.
The LODP was limited to a DP of 400 due to convergence limits. As shown in the results, ageing at 130 °C did not allow for significant degradation values to be reached in any of the papers studied. The lack of data for values close to the DP limit hindered the development of the model with a good fit, as can be seen in the results. For the lower temperature, the fit was very low for unmodified natural esters, and was acceptable for other temperatures, though lower than in other models. In the case of the TUK paper, the fit was better for all fluids compared to the Kraft paper, as can also be inferred from the figure, except for the synthetic ester, a fluid for which this model should not be applied.
Despite the lower fit compared to other models, the constant k allows for an assessment of the degradation rate with each fluid, leading to conclusions similar to those obtained with other models. The lower values of the reaction rates of the TUK paper in comparison with the Kraft ones agrees with the higher thermal resistance of this paper, as explained in previous sections. However, this model is highly dependent on the LODP, as well as on the available data. In any case, other models provided better fits when data for a very low DP were not available.
3.3. Estimation of Remaining Life
The described models allow for the evaluation of degradation based on the reaction rate represented by the constant and the activation energy required for the degradation reaction to occur. Although this allows for the comparison of different dielectric fluids and cellulose materials, it does not provide a direct estimate of the expected transformer life. For this purpose, the Institute of Electrical and Electronics Engineers (IEEE) proposes an expression, as shown in Equation (12), for calculating the remaining life based on temperature [17]:
where and are constants depending on the degradation rate, is the temperature (K), and is the time required to reach the set DP end-of-life value (LODP).
The results of the experiment were used to obtain the parameters of the IEEE model. In order to directly use experimental data, the constants were defined for a DP of 550, as this was the lowest DP achieved during the ageing at 130 °C.
Additionally, it was decided that the first-order model should be used, due to its good fit, to estimate the time required to reach a lower DP (350) at each temperature. Previously, the accuracy of the time calculated with this model was validated, as shown in Table 12 and Table 13. The results were notably similar for the highest temperature, where there were sufficient end-of-life data for the paper. At the temperature of 130 °C, the model did not adapt as precisely to reality. At this temperature, the LODP was significantly high, around 500 for Kraft paper and 700 for TUK paper, as was found in other studies [12,22].

Table 12.
Time (h) to DP 550 in the Kraft paper according to the experimental data and Emsley model.

Table 13.
Time (h) to DP 550 in the TUK paper according to the experimental data and Emsley model.
From these values, the parameters of the IEEE model were obtained for each fluid and paper. The curves derived from the IEEE model are presented in Figure 7, whereas the parameters obtained using experimental data and those derived from the Emsley model are collected in Table 14 and Table 15.
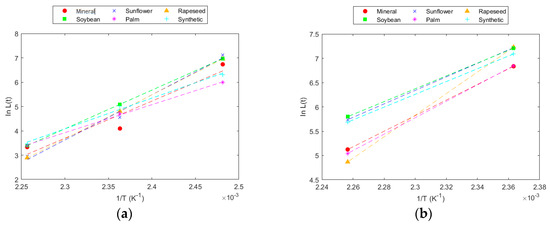
Figure 7.
IEEE model for DP = 550 in: (a) Kraft paper; and (b) TUK paper.

Table 14.
Parameters of Kraft paper according to the IEEE model.

Table 15.
Parameters of TUK paper according to the IEEE model.
This model allows for the direct calculation of the time required to reach the fixed DP at any temperature. The model fit was very high, and the parameters obtained for the experimental data were very similar to those obtained with data calculated from the Emsley model.
According to the experimental data obtained in this work, under the analysed conditions, a DP of 200 at 130 °C would be reached at very distant time points. The data trend showed an asymptote that causes this time to tend towards infinity. This behaviour was reflected in the kinetic models, indicating that it is not possible to reach such a low DP at that temperature. Similarly, in the case of the TUK paper, with the data available in this work, it would not be possible to reach a DP of 550, as seen in the DP results, where the degradation slope was very small, and this value would be reached at very distant times. These results deviate from reality because, in an operating transformer, there are more factors contributing to degradation, such as electrical and mechanical stress and the presence of other materials, in addition to certain faults that may occur in the equipment and can affect solid insulation. In the test carried out, in a controlled atmosphere and with the system subjected only to thermal stress, degradation stabilized in a way that the time required to reach lower levels of ageing was very large.
Based on these parameters, it would be possible to estimate the life expectancy, or the time required to reach a certain DP at different temperatures in each insulation system. The results obtained, collected in Table 16, are an approximation for conditions similar to those replicated in this experiment. Consistent with previous findings, the TUK paper exhibits greater resistance to aging, attributed to the lower hydrolysis occurring within it, thereby reducing the aging rate, and prolonging the time it takes to reach a certain DP compared to the Kraft paper.

Table 16.
Time (days) to DP 550 at different temperatures.
4. Conclusions
The thermal degradation of cellulose polymers in Kraft and TUK papers was analysed when combined with five different alternative fluids and a mineral oil through the measurement of the evolution of their polymerisation degree.
From these results, it was found that cellulose ageing differed from one fluid to another. For both types of paper, sunflower, rapeseed, and soybean esters demonstrated superior performance, with no notable differences among them concerning the papers’ DP. Synthetic ester, on the other hand, offered intermediate levels of protection, which were always better than those of the mineral oil. However, the performance of palm ester varied depending on the cellulosic material. This fluid protected the Kraft paper better than the mineral oil, but performed the worst with the TUK paper.
Moreover, the effect of the additives in the TUK paper on its thermal degradation was noticeable, since its DP reduction was up to 2.5 times lower than that of the Kraft paper, under all conditions.
Regarding the kinetic models, five different alternatives were obtained with the DP data. The resulting parameters met the trends observed in the gross analysis of the degradation. Moreover, the results showed that the Emsley model was a better fit for the materials studied in this work, probably due to the flexibility of the equations and the consideration of the non-linearity of the ageing rate.
Based on this, it is not only possible to confirm the trends observed in other previous works, but also state that unmodified natural esters are always the best option in terms of paper protection, without significant differences being observed among them. Furthermore, due to the wide variety of materials analysed, following a unique methodology, the obtained models allow for comparisons with many different combinations. This makes them a suitable tool for verifying, in each operating condition, the advantages of choosing TUK paper and enabling the selection of the best option among the different esters available on the market.
Author Contributions
Conceptualization, C.M. and A.O.; methodology, C.M., C.O. and D.G.; validation, C.M. and C.J.R.; formal analysis, C.M., C.J.R., A.O. and D.G.; investigation, C.M. and C.O.; resources, C.M. and A.O.; writing—original draft preparation, C.M. and C.O.; writing—review and editing, C.M., C.O., C.J.R., A.O. and D.G. All authors have read and agreed to the published version of the manuscript.
Funding
This research was funded by the European Union’s Horizon 2020 Research and Innovation Program, through the Marie Sklodowska-Curie Actions, under Grant 823969, and by the Ministry of Economy, through the National Research Project: Gestión del Ciclo de Vida de Transformadores Aislados con Fluidos Biodegradables, under Grant PID 2019-107126RBC22. The work of Cristina Méndez was supported by the Spanish Ministry of Science, Innovation and Universities, through the Ph.D. Scholarship by Formación de Profesorado Universitario (FPU), under Grant FPU19/01849.
Institutional Review Board Statement
Not applicable.
Data Availability Statement
Data are contained within the article.
Conflicts of Interest
The authors declare no conflicts of interest.
References
- Arabul, A.Y.; Kumru, C.F.; Arabul, F.K. Determination of Transformer Board Creep Parameters under High-Mechanical and Thermal Stresses. IET Sci. Meas. Technol. 2020, 15, 94–100. [Google Scholar] [CrossRef]
- Krause, C. Power Transformer Insulation—History, Technology and Design. IEEE Trans. Dielectr. Electr. Insul. 2012, 19, 1941–1947. [Google Scholar] [CrossRef]
- Zhang, E.; Liu, J.; Zhang, C.; Zheng, P.; Nakanishi, Y.; Wu, T. State-of-Art Review on Chemical Indicators for Monitoring the Aging Status of Oil-Immersed Transformer Paper Insulation. Energies 2023, 16, 1396. [Google Scholar] [CrossRef]
- Fofana, I.; Fofana, F. 50 Years in the Development of Insulating Liquids. IEEE Electr. Insul. Mag. 2013, 29, 13–25. [Google Scholar] [CrossRef]
- Hiriyanna, M.N.; Basavaraju, A.; Kumar, M.A.; Gurunathegowda, G.; Shanmugam, G. Performance Enhancement of Aged Mineral Oil by Blending Synthetic Ester for Transformer Insulation Applications. Eng. Proc. 2024, 59, 136. [Google Scholar] [CrossRef]
- Yang, T.; Zhao, L.; Li, W.; Zomaya, A.Y. Reinforcement Learning in Sustainable Energy and Electric Systems: A Survey. Annu. Rev. Control 2020, 49, 145–163. [Google Scholar] [CrossRef]
- Dixit, A.; Ma, H.; Ekanayake, C.; Daghrah, M.; Saha, T.K. Investigation of Cellulose Insulation Ageing in Transformers Retrofilled with Ester Fluids at Different Service Years. IEEE Trans. Dielectr. Electr. Insul. 2024, 1. [Google Scholar] [CrossRef]
- Montero, A.; García, B.; López, C. Life Expectancy of Transformer Paper Insulation Retrofilled with Natural Ester in the Laboratory. Polymers 2023, 15, 4345. [Google Scholar] [CrossRef]
- Soni, R.; Mehta, B. A Review on Transformer Condition Monitoring with Critical Investigation of Mineral Oil and Alternate Dielectric Fluids. Electr. Power Syst. Res. 2023, 214, 108954. [Google Scholar] [CrossRef]
- Lyutikova, M.N.; Ridel, A.V.; Konovalov, A.A. Dielectric Liquids: Past, Present, Future (Review). Power Technol. Eng. 2024, 57, 615–622. [Google Scholar] [CrossRef]
- Prevost, T.A.; Oommen, T.V. Cellulose Insulation in Oil-Filled Power Transformers: Part I—History and Development. IEEE Electr. Insul. Mag. 2006, 22, 28–35. [Google Scholar] [CrossRef]
- Liao, R.; Liang, S.; Sun, C.; Yang, L.; Sun, H. A Comparative Study of Thermal Aging of Transformer Insulation Paper Impregnated in Natural Ester and in Mineral Oil. Eur. Trans. Electr. Power 2009, 20, 518–533. [Google Scholar] [CrossRef]
- Przybylek, P. Thermal Ageing of Dry Cellulose Paper Impregnated with Different Insulating Liquids—Comparative Studies of Materials Properties. Energies 2024, 17, 784. [Google Scholar] [CrossRef]
- C57.12.00-2015; Standard for General Requirements for Liquid-Immersed Distribution, Power, and Regulating Transformers. IEEE: Piscataway, NJ, USA, 2015.
- Lundgaard, L.E.; Allan, D.; Höhlein, I.A.; Clavreul, R.; Dahlund, M.O.; Gasser, H.P.; Heywood, R.; Krause, C.; Lessard, M.C.; Saha, T.K.; et al. Ageing of Cellulose in Mineral-Oil Insulated Transformers; CIGRE: Paris, France, 2007. [Google Scholar]
- Wang, Z.; Tee, S.; Matharage, S.; Jarman, P. Ageing Assessment of Transformers through Oil Test Database Analyses and Alternative Diagnostic Techniques. In Proceedings of the 2015 CIGRE SC A2 Colloquium, Shanghai, China, 20–25 September 2015. [Google Scholar]
- C57.91-2011; IEEE Guide for Loading Mineral-Oil-Immersed Transformers and Step-Voltage Regulators 2011. IEEE: Piscataway, NJ, USA, 2011.
- Lanfei, H.; Lie, L.; Ma, L.; Zhiwei, L.; Xiao, W. A Deep Learning Approach to the Transformer Life Prediction Considering Diverse Aging Factors. Front. Energy Res. 2022, 10, 930093. [Google Scholar]
- Jin, L.; Kim, D.; Chan, K.Y.; Abu-Siada, A. Deep Machine Learning-Based Asset Management Approach for Oil-Immersed Power Transformers Using Dissolved Gas Analysis. IEEE Access 2024, 12, 27794–27809. [Google Scholar] [CrossRef]
- Raj, N.; Gopinath, D.; Aryanandiny, B.; Pillai, S.S. Fuzzy Logic-Based Spectroscopic Analysis for Condition Assessment of Distribution Transformers. IEEE Trans. Ind. Appl. 2024, 1–10. [Google Scholar] [CrossRef]
- IEC 60216-2:2005; Electrical Insulating Materials—Thermal Endurance Properties—Part 2: Determination of Thermal Endurance Properties of Electrical Insulating Materials—Choice of Test Criteria 2005. International Electrotechnical Commission: Geneva, Switzerland, 2005.
- Ye, W.; Hao, J.; Gao, C.; Zhang, J.; Yang, L.; Liao, R. Natural Ester Replacement Effect on Thermal Degradation of Cellulose Insulation From Macroscopic Behavior to Atomic-Scale Mechanism. IEEE Trans. Dielectr. Electr. Insul. 2023, 30, 1582–1589. [Google Scholar] [CrossRef]
- Madan, R.; Su, P. Thermal Class of Natural Ester/Thermally Upgraded Kraft Paper Insulation System. In Proceedings of the 2023 IEEE Conference on Electrical Insulation and Dielectric Phenomena (CEIDP), East Rutherford, NJ, USA, 15–19 October 2023. [Google Scholar]
- IEC 61099:2010; Insulating Liquids—Specifications for Unused Synthetic Organic Esters for Electrical Purposes. International Electrotechnical Commission: Geneva, Switzerland, 2010.
- Naidu, G.T.; Rao, U.M.; Suresh, S. Influence of Ester Liquids on Dielectric Strength of Cellulose. Energies 2022, 15, 762. [Google Scholar] [CrossRef]
- Mihajlovic, D.; Vasovic, V.; Lukic, J. Development of New Accelerated Aging Test for Comparison of the Quality of Different Insulating Papers Based on Cellulose. Polymers 2023, 15, 2556. [Google Scholar] [CrossRef]
- Martins, M.A.G. Experimental Study of Paper Aging in Vegetable Oil Versus Mineral Oil. Ieee Electr. Insul. Mag. 2005, 26, 7–13. [Google Scholar] [CrossRef]
- Rapp, K.J.; Luksich, J. Accelerated Aging of Aramid Insulation in Various Dielectric Liquids. In Proceedings of the 2014 IEEE 18th International Conference on Dielectric Liquids, ICDL 2014, Bled, Slovenia, 29 June–3 July 2014; IEEE: Piscataway, NJ, USA, 2014; pp. 1–4. [Google Scholar]
- Münster, T.; Werle, P.; Hämel, K.; Preusel, J. Thermally Accelerated Aging of Insulation Paper for Transformers with Different Insulating Liquids. Energies 2021, 14, 3036. [Google Scholar] [CrossRef]
- Matharage, S.Y.; Liu, Q.; Wang, Z.D.; Wilson, G.; Krause, C. Aging Assessment of Synthetic Ester Impregnated Thermally Non-Upgraded Kraft Paper through Chemical Markers in Oil. IEEE Trans. Dielectr. Electr. Insul. 2018, 25, 507–515. [Google Scholar] [CrossRef]
- Yang, L.; Liao, R.; Sun, C.; Yin, J.; Zhu, M. Influence of Vegetable Oil on the Thermal Aging Rate of Kraft Paper and Its Mechanism. In Proceedings of the 2010 International Conference on High Voltage Engineering and Application, New Orleans, LA, USA, 11–14 October 2010; IEEE: Piscataway, NJ, USA, 2010. [Google Scholar]
- Carcedo, J.; Fernandez, I.; Ortiz, A.; Delgado, F.; Renedo, C.J.; Arroyo, A. Quantitative Study on the Aging of Kraft Paper in Vegetable Oils. IEEE Electr. Insul. Mag. 2016, 32, 29–35. [Google Scholar] [CrossRef]
- Shen, Z.; Wang, F.; Wang, Z.; Li, J. A Critical Review of Plant-Based Insulating Fluids for Transformer: 30-Year Development. Renew. Sustain. Energy Rev. 2021, 141, 110783. [Google Scholar] [CrossRef]
- Liang, Z.; Fang, Y.; Cheng, H.; Sun, Y.; Li, B.; Li, K.; Zhao, W.; Sun, Z.; Zhang, Y. Innovative Transformer Life Assessment Considering Moisture and Oil Circulation. Energies 2024, 17, 429. [Google Scholar] [CrossRef]
- IEC 60296:2020; Fluids for Electrotechnical Applications—Mineral Insulating Oils for Electrical Equipment 2020. International Electrotechnical Commission: Geneva, Switzerland, 2020.
- IEC 62770:2013; Fluids for Electrotechnical Applications—Unused Natural Esters for Transformers and Similar Electrical Equipment 2013. International Electrotechnical Commission: Geneva, Switzerland, 2013.
- IEC 63012:2019; Insulating Liquids—Unused Modified or Blended Esters for Electrotechnical Applications 2019. International Electrotechnical Commission: Geneva, Switzerland, 2019.
- C57.100-2011; IEEE Standard C57.100 Test Procedure for Thermal Evaluation of Insulation Systems for Liquid-Immersed Distribution and Power Transformers 2012. IEEE: Piscataway, NJ, USA, 2011.
- IEC 60450:2004; Measurement of the Average Viscometric Degree of Polymerization of New and Aged Cellulosic Electrically Insulating Materials 2004. International Electrotechnical Commission: Geneva, Switzerland, 2004.
- Frimpong, G.K.; Oommen, T.V.; Asano, R. A Survey of Aging Characteristics of Cellulose Insulation in Natural Ester and Mineral Oil. IEEE Electr. Insul. Mag. 2011, 27, 36–48. [Google Scholar] [CrossRef]
- Fern, C.; Ortiz, A.; Carrascal, I.A.; Fern, I.; Renedo, C.J. Kinetic Assessment of Mechanical Properties of a Cellulose Board Aged in Mineral Oil and Synthetic Ester. Polymers 2021, 13, 4150. [Google Scholar] [CrossRef]
- Ekenstam, A. The Behaviour of Cellulose in Mineral Acid Solutions: Kinetic Study of the Decomposition of Cellulose in Acid Solutions. BER 1936, 69, 553. [Google Scholar]
- Emsley, A.M.; Stevens, G.C. Kinetics and Mechanism of the Low Temperature Degradation of Cellulose. Cellulose 1994, 1, 26–56. [Google Scholar] [CrossRef]
- Lelekakis, N.; Martin, D.; Wijaya, J. Ageing Rate of Paper Insulation Used in Power Transformers Part 1: Oil/Paper System with Low Oxygen Concentration. IEEE Trans. Dielectr. Electr. Insul. 2012, 19, 1999–2008. [Google Scholar] [CrossRef]
- Emsley, A.M.; Heywood, R.J.; Ali, M.; Eley, C.M. On the Kinetics of Degradation of Cellulose. Cellulose 1997, 4, 1–5. [Google Scholar] [CrossRef]
- Lukic, J.; Deville, K.; Lessard, M.C.; Dreier, L.; Hohlein, I.A.; Vrsaljko, D.; Peixoto, A.; Melzer, L.; Leward, L.; Ding, H. Changes of New Unused Insulating Kraft Paper Properties during Drying—Impact on Degree of Polymerization. Cigrè Sci. Eng. 2021, 1–6. [Google Scholar]
- Bandara, K.; Ekanayake, C.; Saha, T.K.; Annamalai, P.K. Understanding the Ageing Aspects of Natural Ester Based Insulation Liquid in Power Transformer. IEEE Trans. Dielectr. Electr. Insul. 2016, 23, 246–257. [Google Scholar] [CrossRef]
- Zervos, S.; Moropoulou, A. Cotton Cellulose Ageing in Sealed Vessels. Kinetic Model of Autocatalytic Depolymerization. Cellulose 2005, 12, 485–496. [Google Scholar] [CrossRef]
- Calvini, P.; Gorassini, A. On the Rate of Paper Degradation: Lessons from the Past. Restaurator 2006, 27, 275–290. [Google Scholar] [CrossRef]
Disclaimer/Publisher’s Note: The statements, opinions and data contained in all publications are solely those of the individual author(s) and contributor(s) and not of MDPI and/or the editor(s). MDPI and/or the editor(s) disclaim responsibility for any injury to people or property resulting from any ideas, methods, instructions or products referred to in the content. |
© 2024 by the authors. Licensee MDPI, Basel, Switzerland. This article is an open access article distributed under the terms and conditions of the Creative Commons Attribution (CC BY) license (https://creativecommons.org/licenses/by/4.0/).