3.1. Surface Morphology of PUR Composites
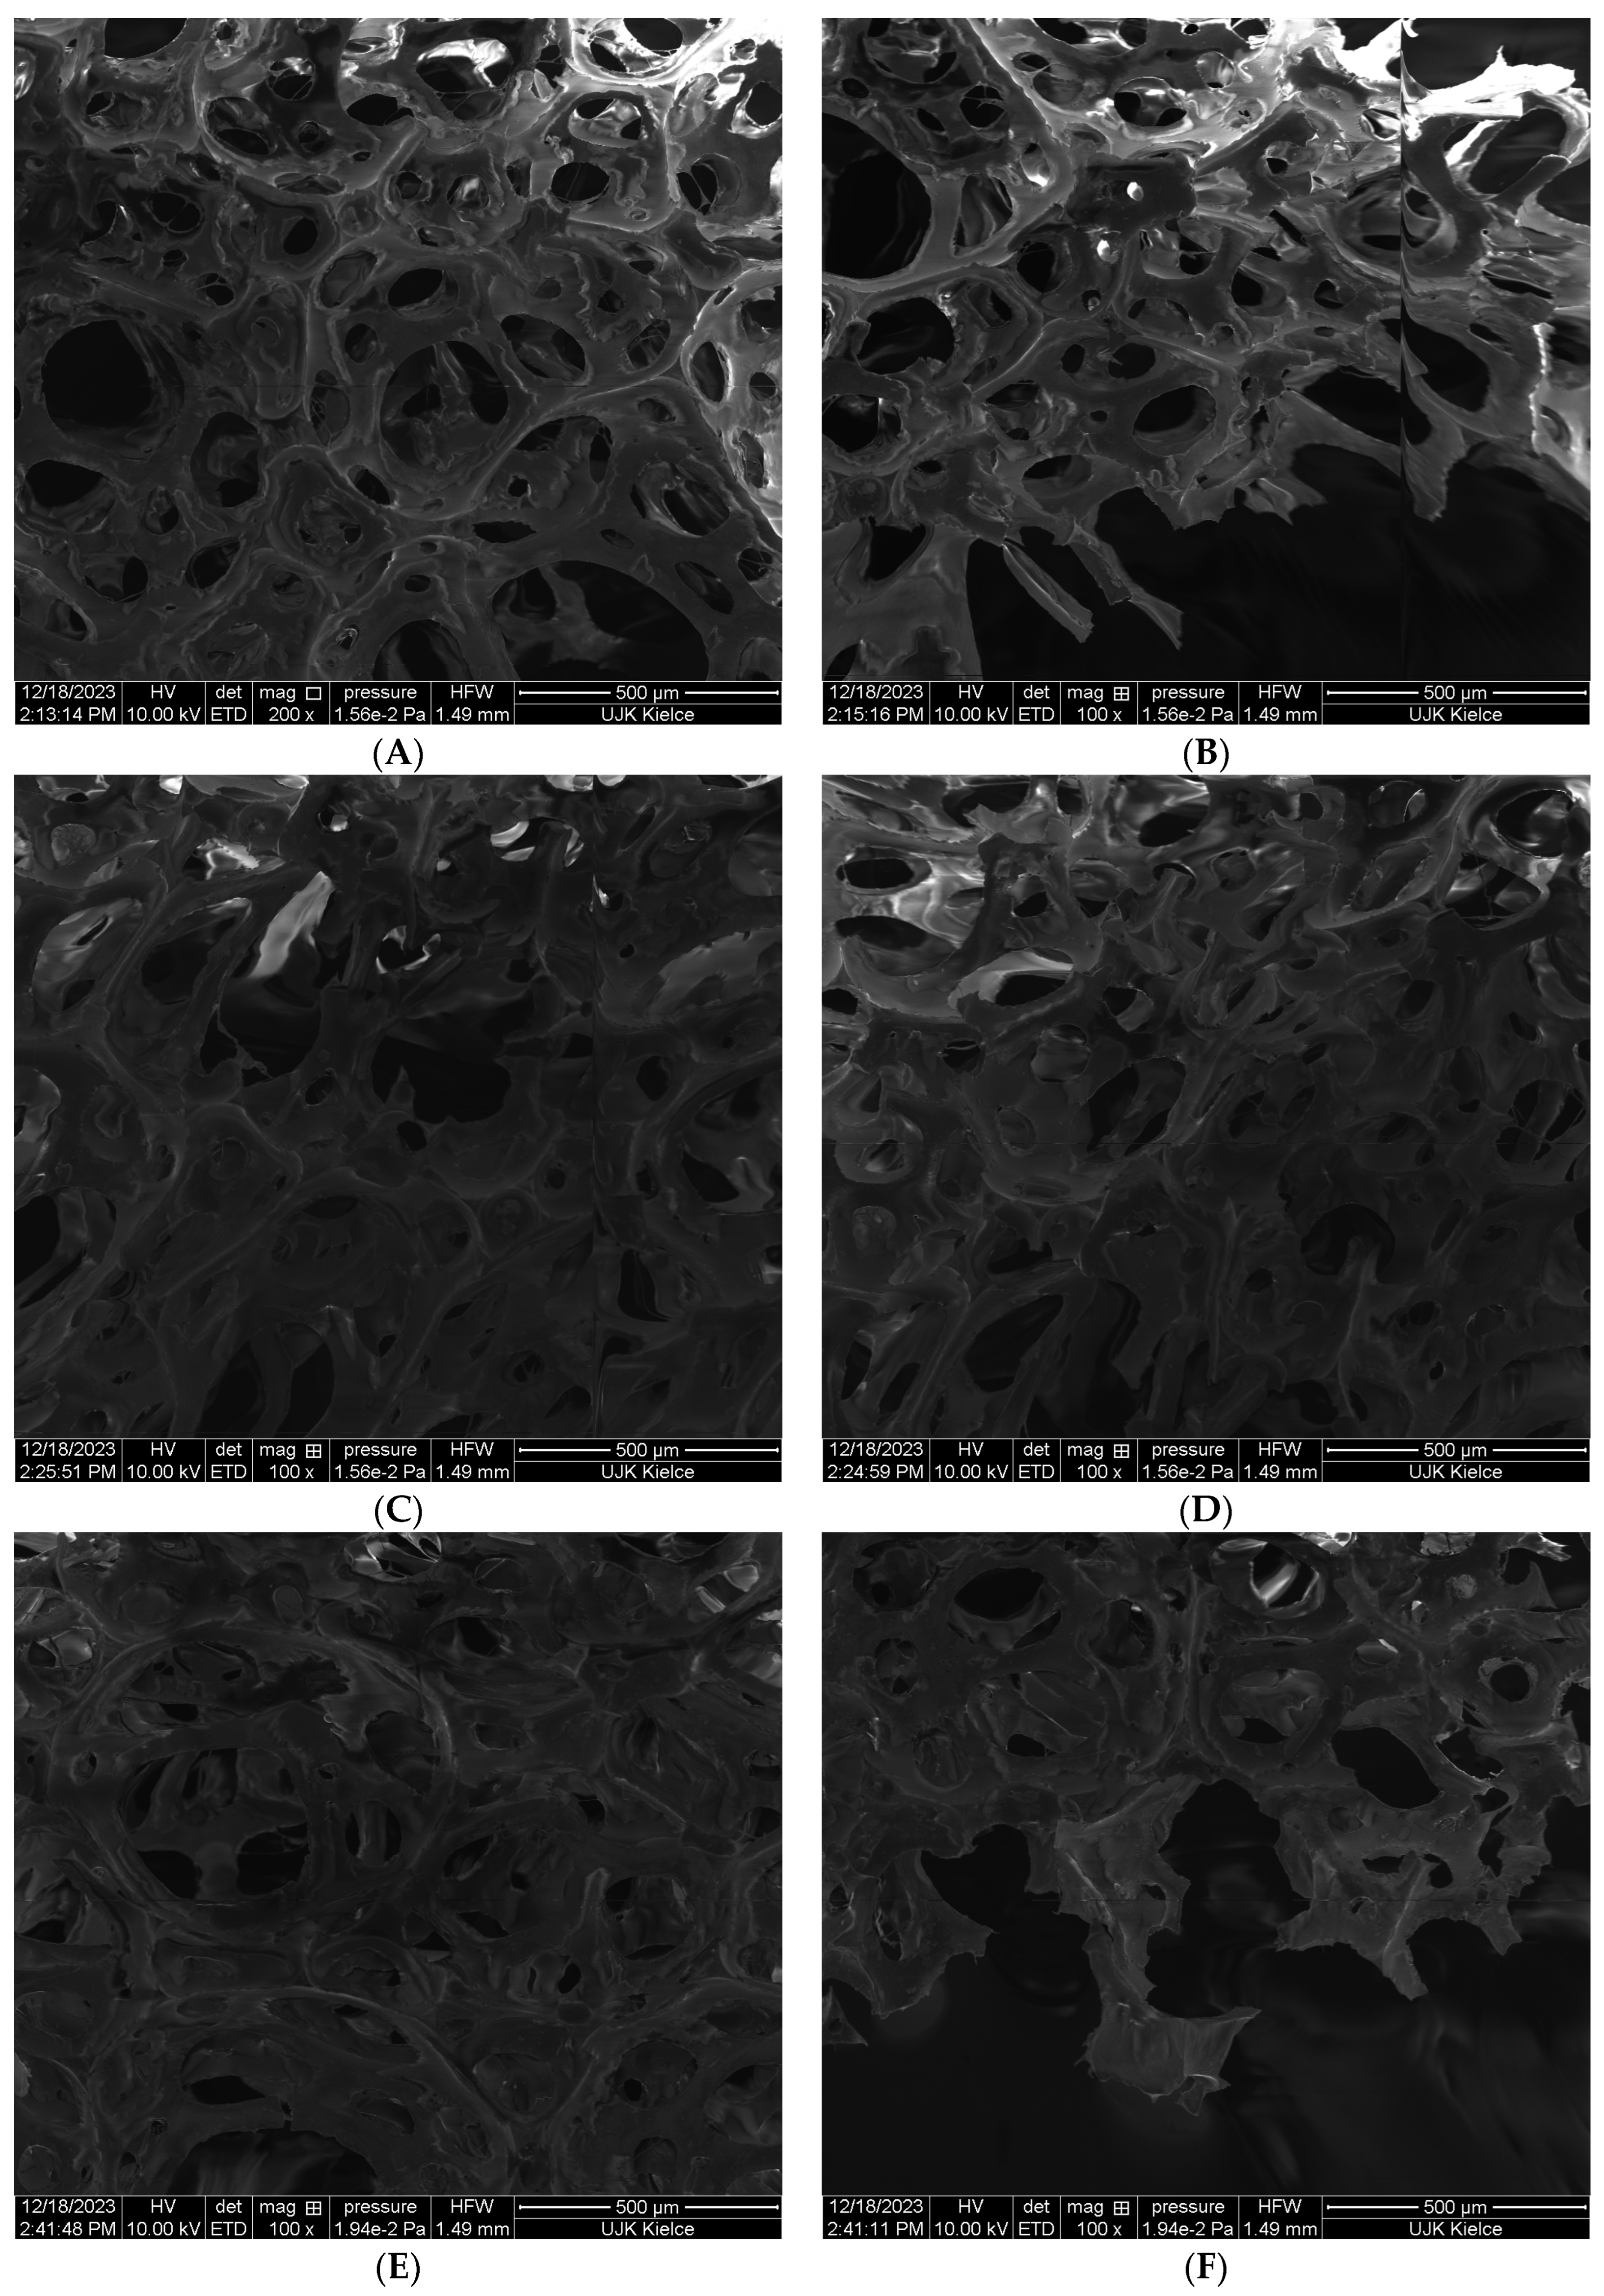
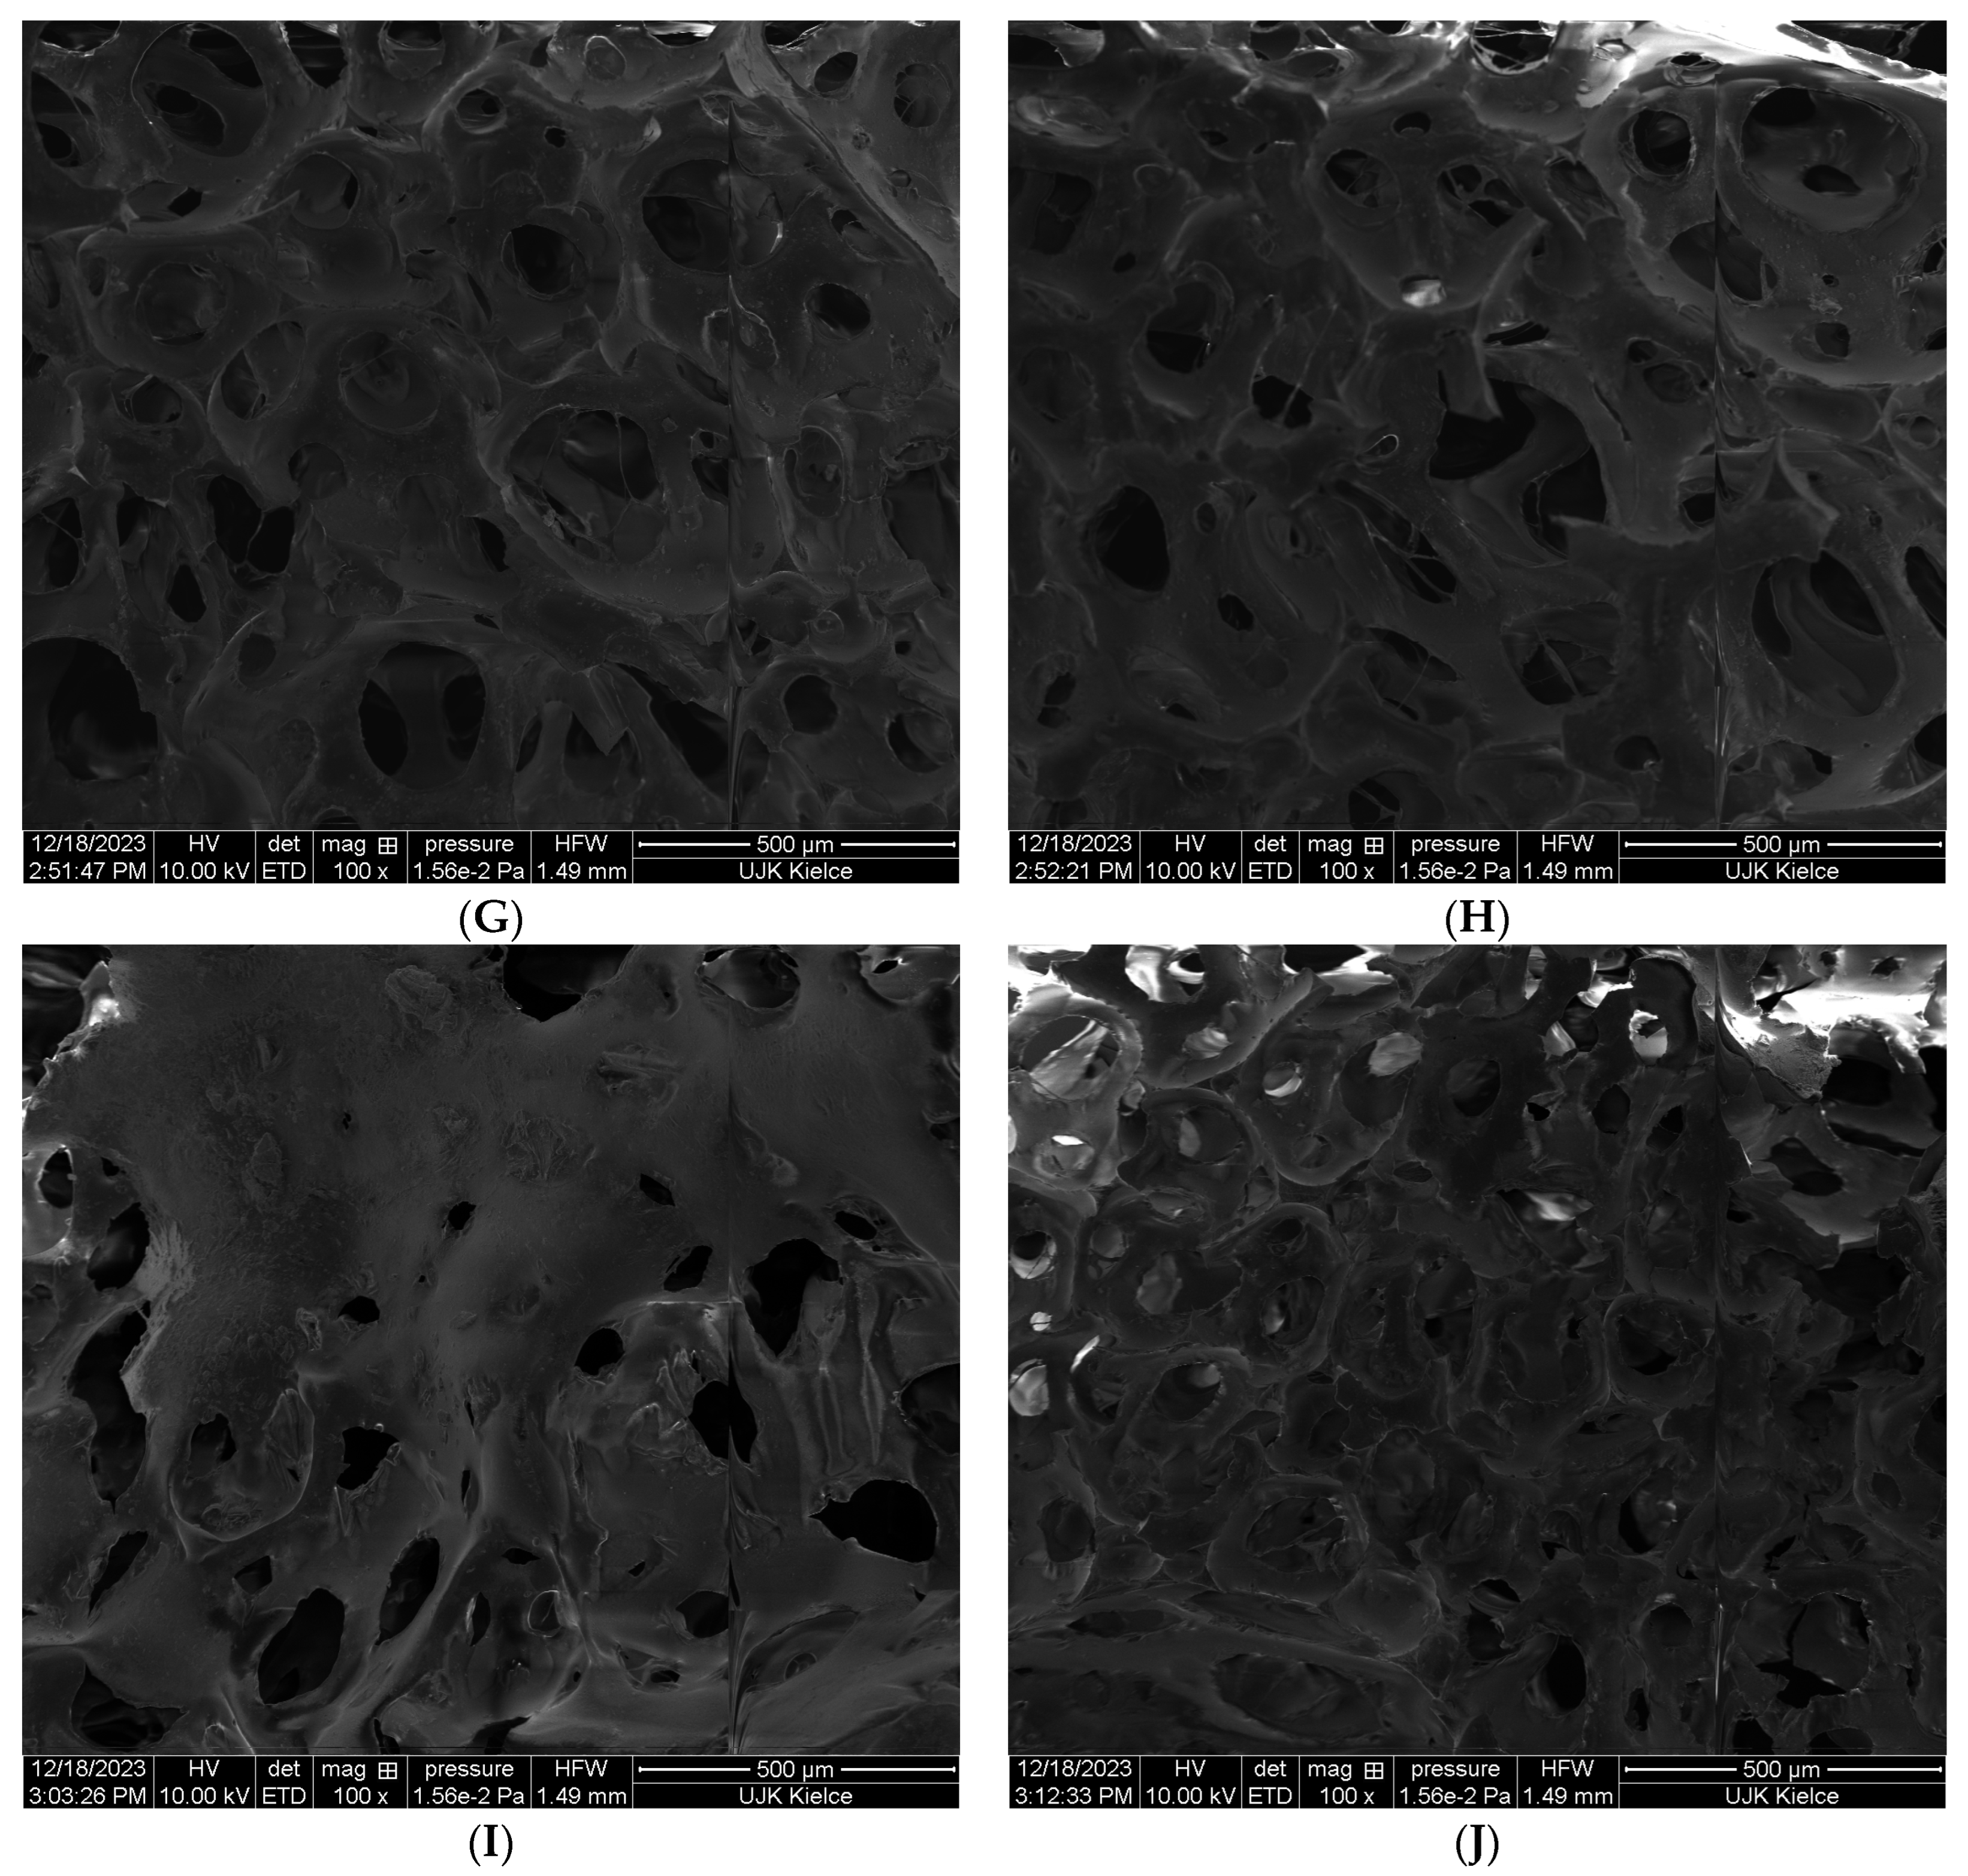
The test results obtained by SEM clearly indicate that the PUR composites are characterized by a porous structure. Free spaces filled with air during the thermal decomposition of PUR not only increase the efficiency of exothermic combustion reactions through the diffusion of oxygen into the reaction environment, but also catalyze degradation reactions and thermal destruction of PUR chains (
Figure 2A,B).
Introducing an organophosphate compound in the form of TPP to the polyurethane foam matrix significantly reduces the size of free spaces in the PUR structure (
Figure 2C,D). The results obtained by the SEM analysis clearly indicate that TPP is homogeneously distributed in the polyurethane matrix, and thus limits the degree of porosity of the tested PUR foam.
A significant reduction in the porosity of the tested PUR foam was achieved for the TPP–POSS system. Regardless of the type of POSS used, both the number and size of free spaces in the PUR structure were significantly reduced in relation to the pure PUR as well as in the PUR–TPP composite [
27,
28].
The analysis of the obtained SEM images clearly indicates that the best effect in terms of reducing the porosity of the PUR foam was achieved for the TPP–OL system. In the case of the PUR−TPP–OL (
Figure 2I,J), the porous structure of PUR practically disappeared.
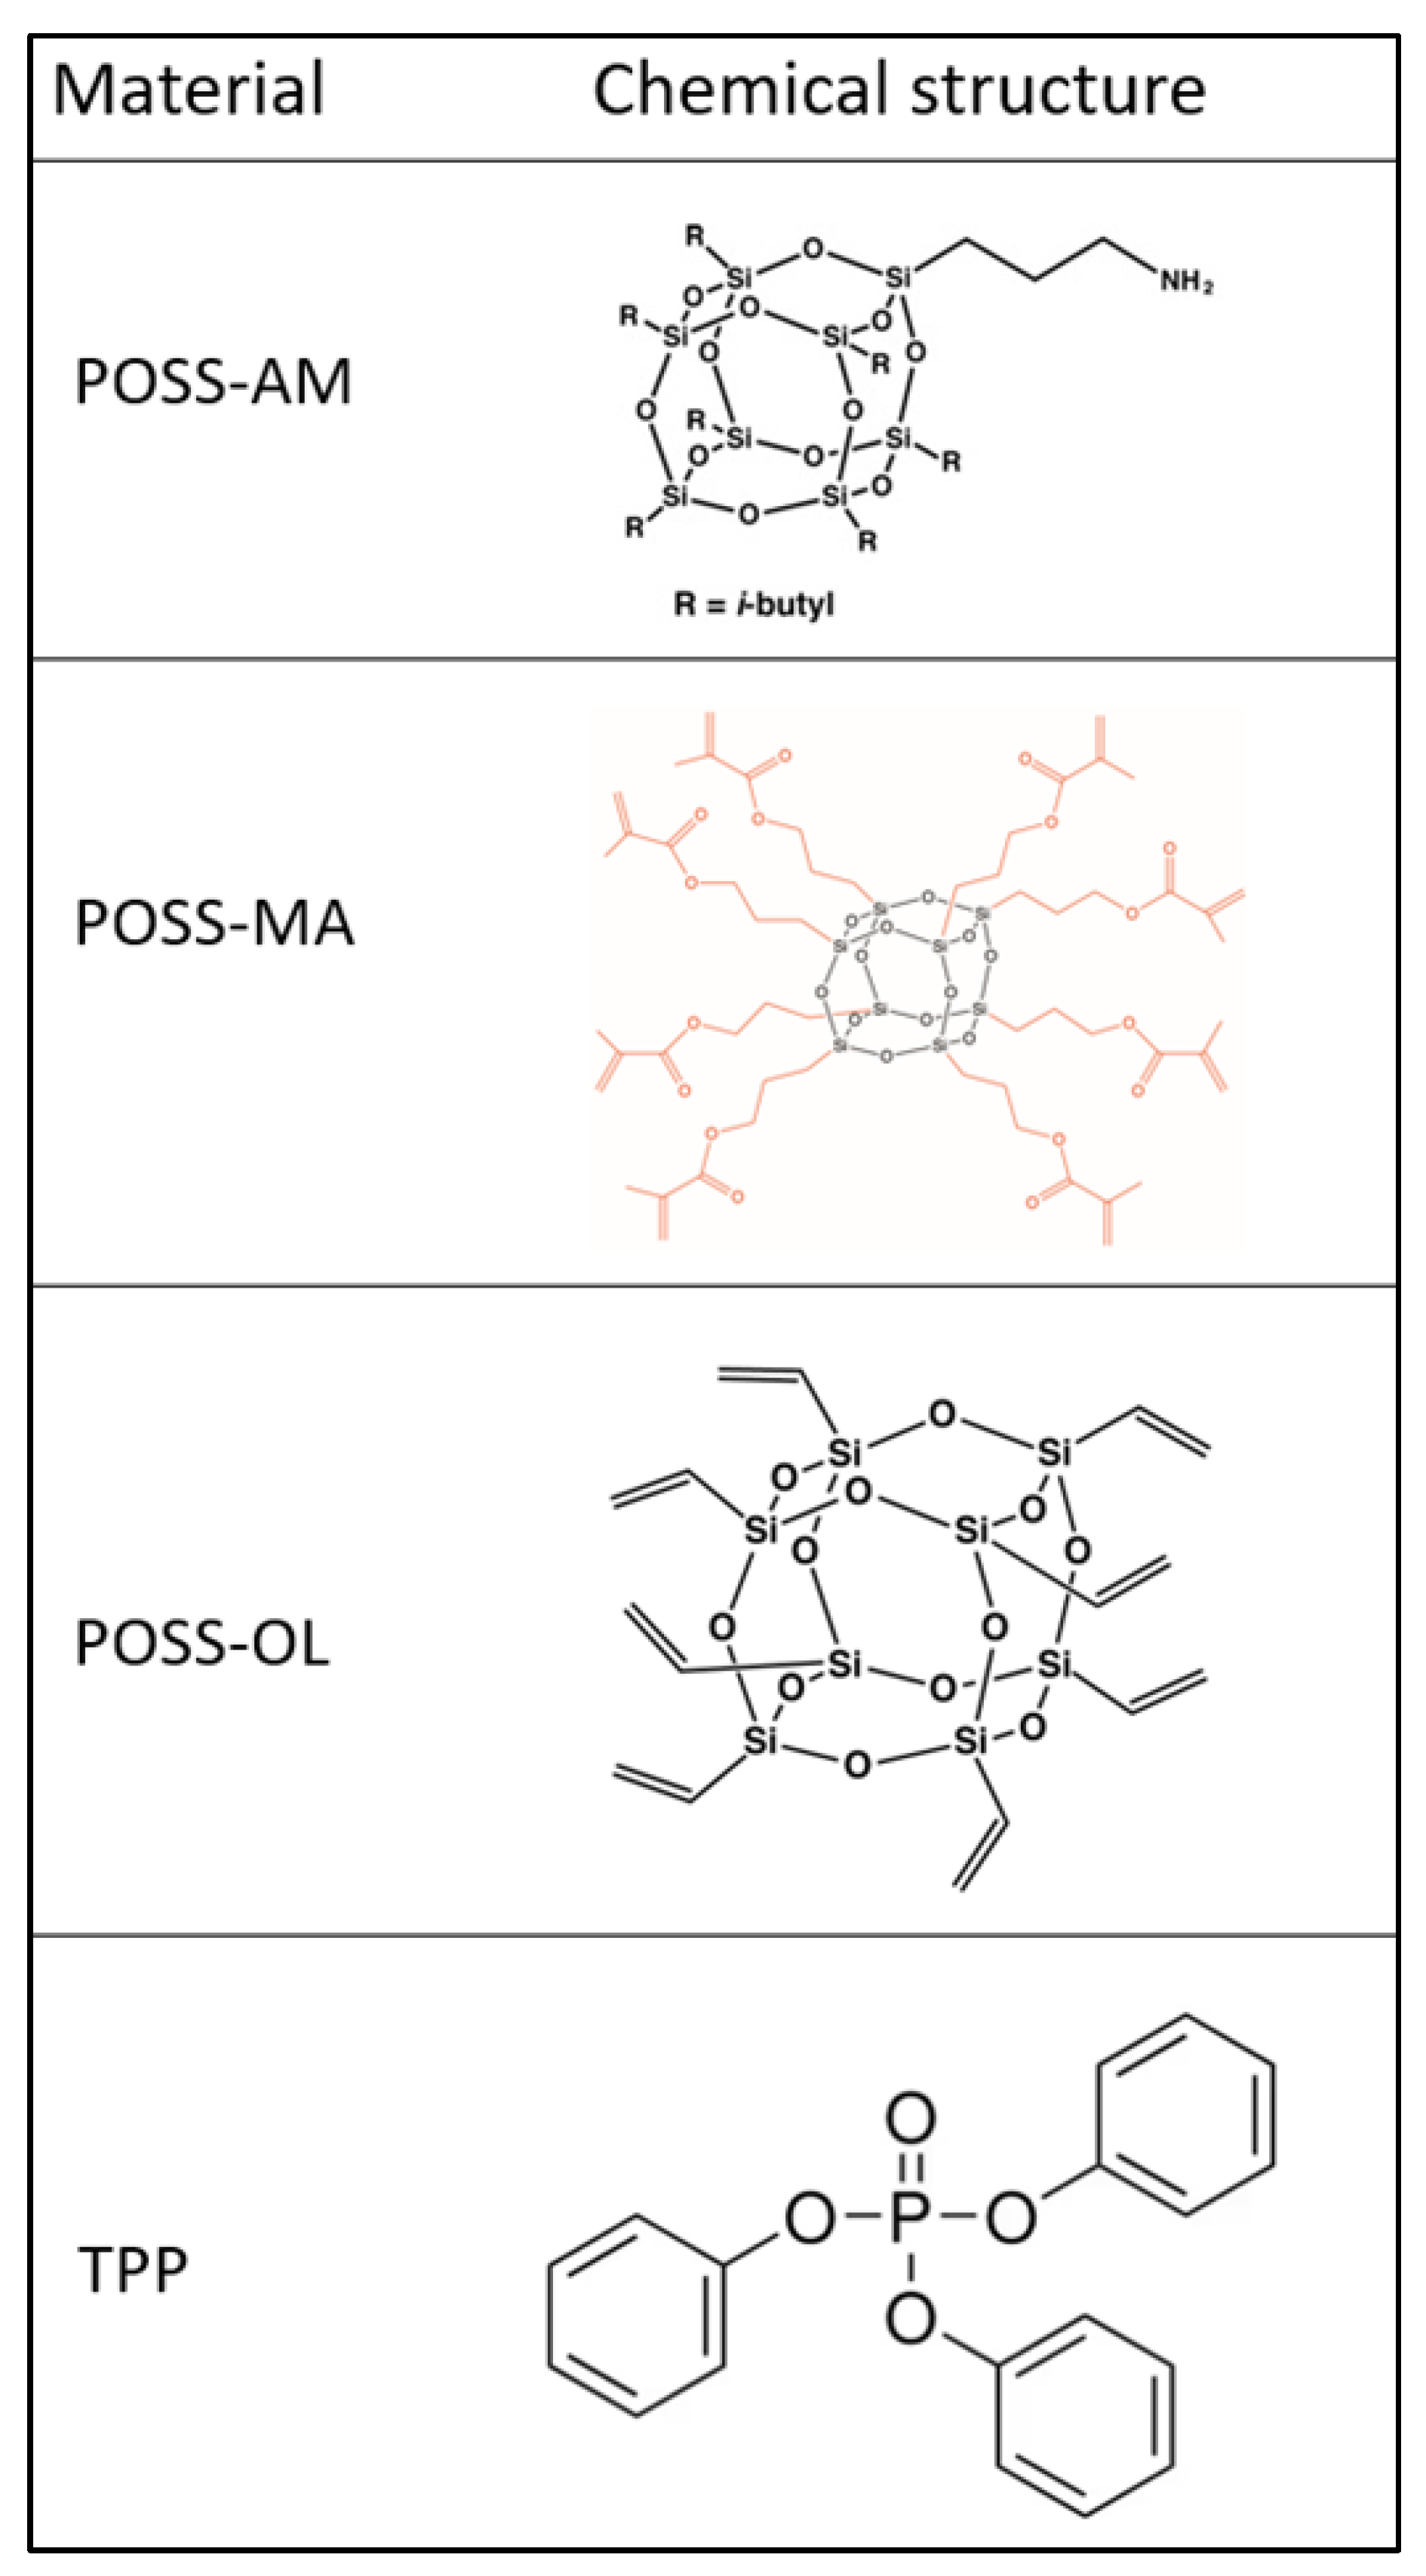
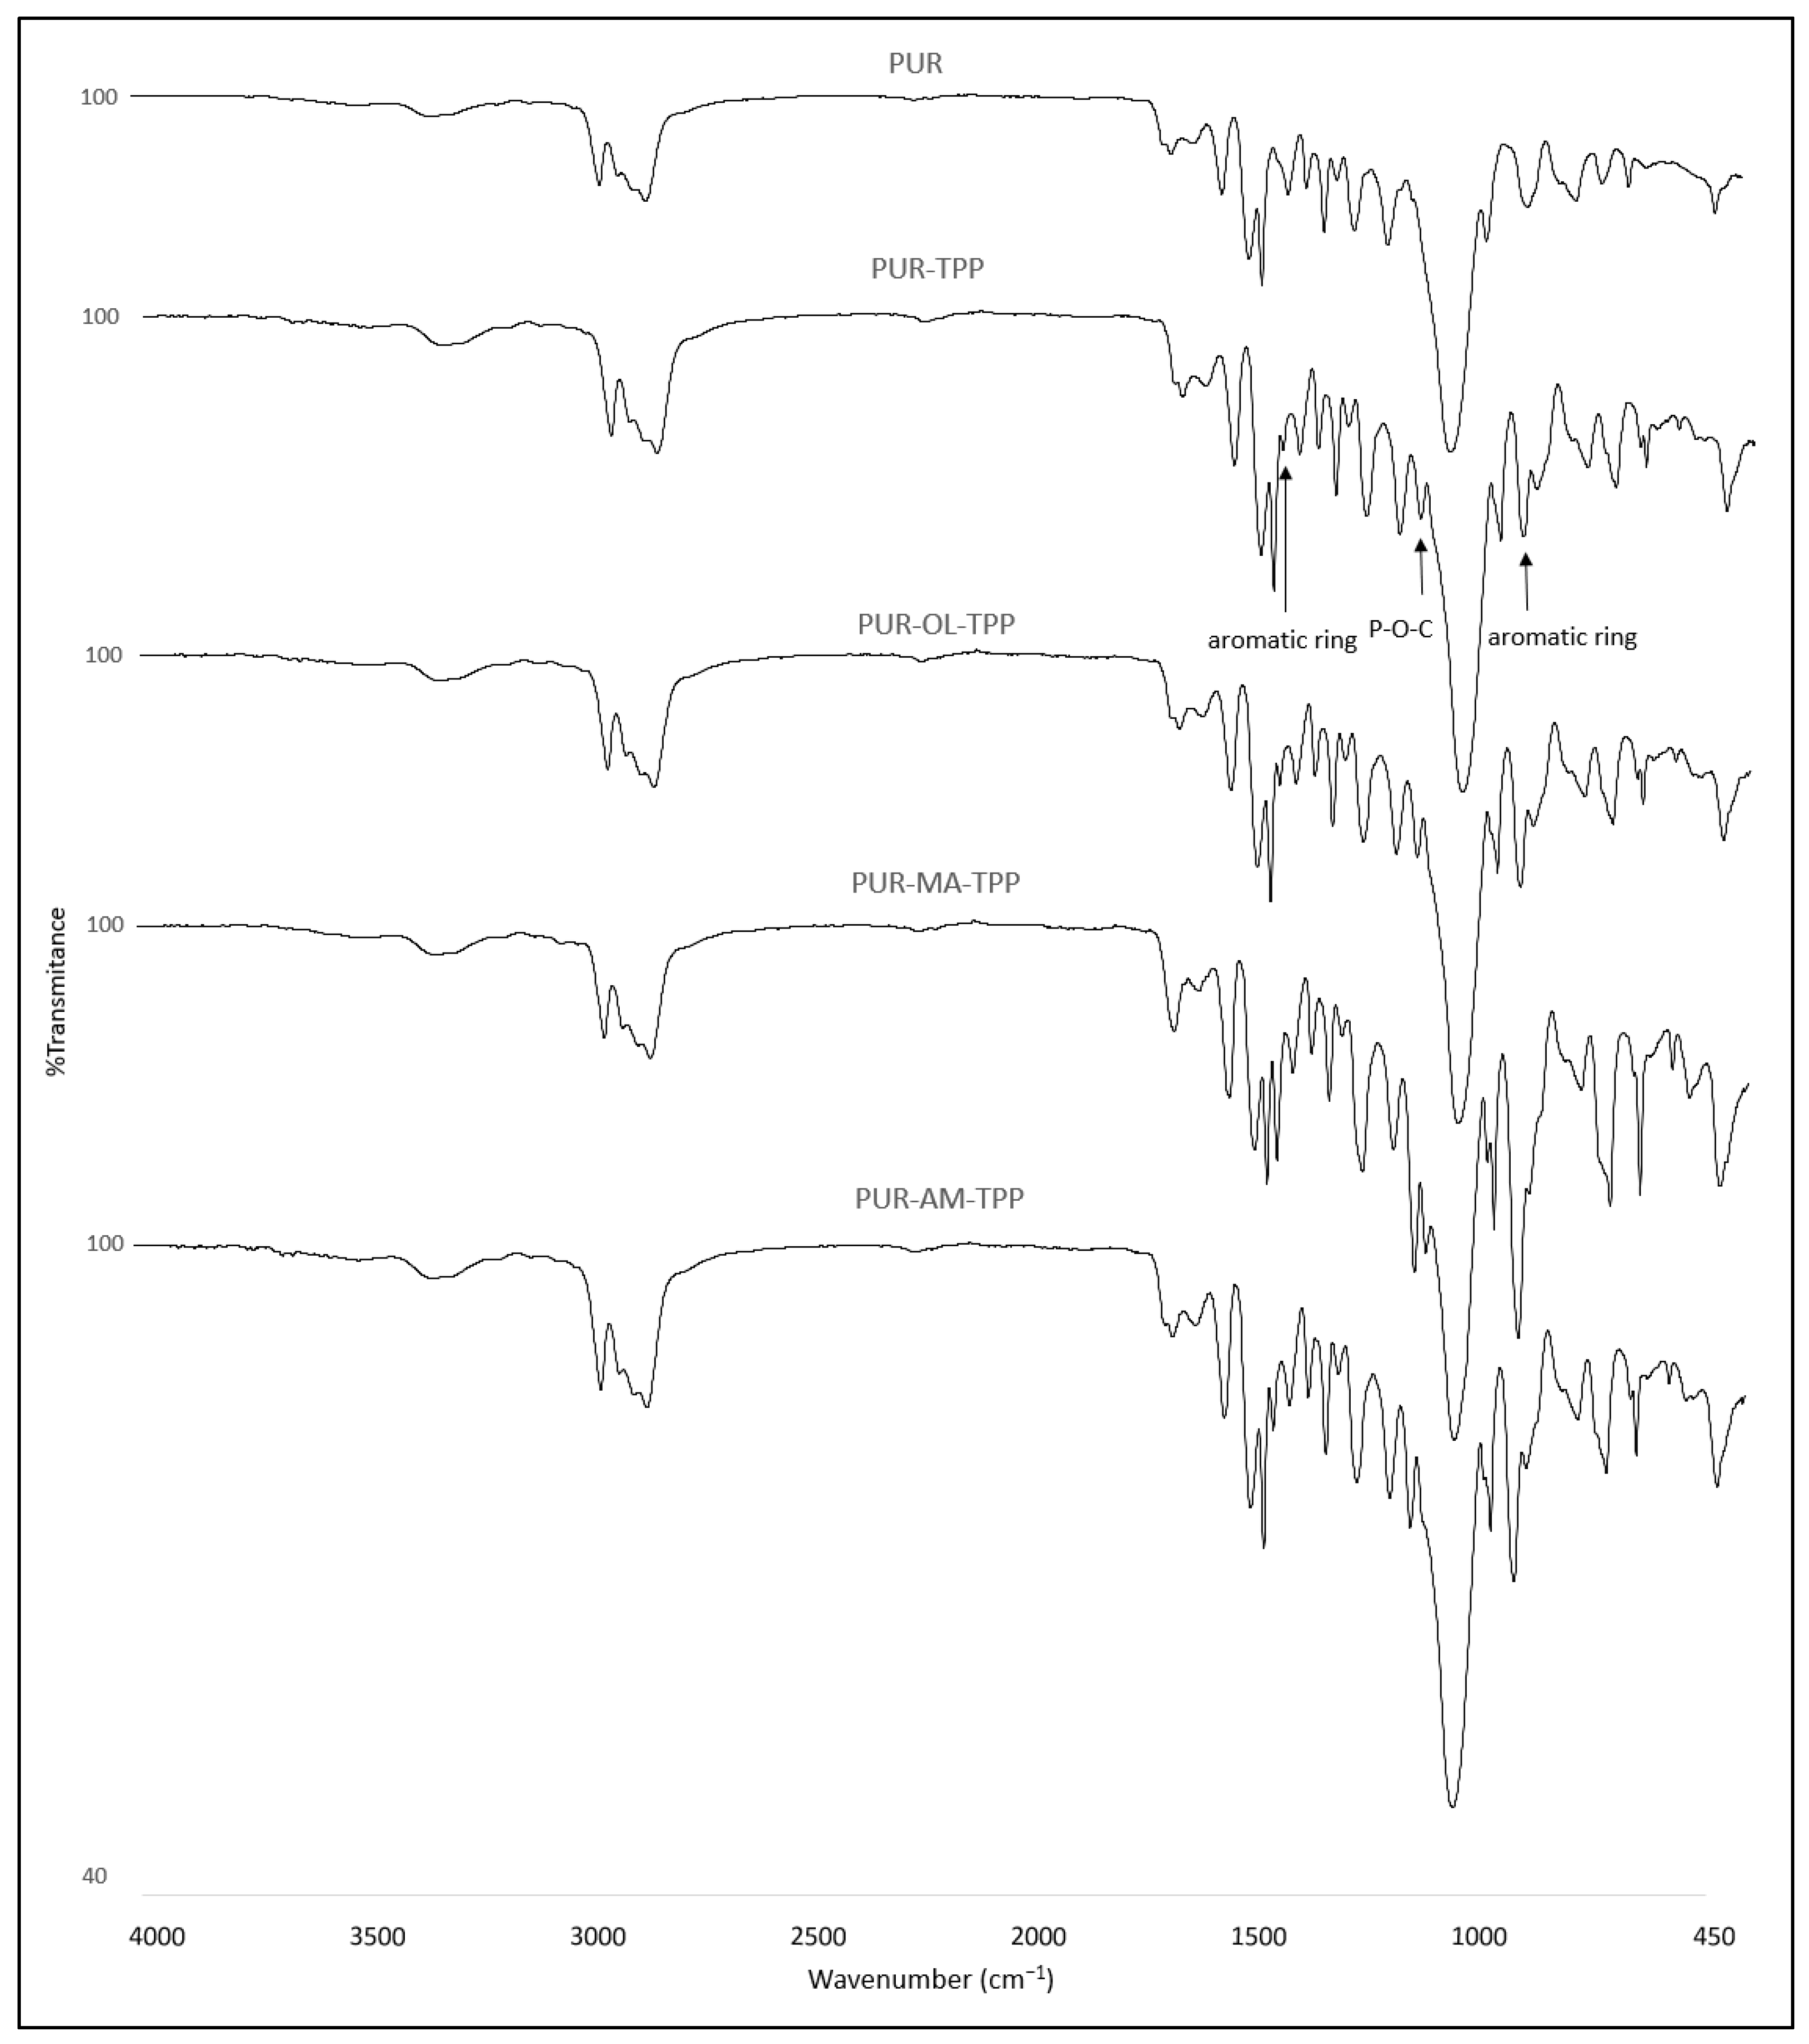
The structural studies of the PUR–POSS composites by the IR spectroscopy revealed the characteristic absorbance bands. The band at 3337 cm
−1 corresponded to the stretching vibrations of N-H (
Figure 3) [
29]. The peak at 2868 and 2868 cm
−1 corresponded to the symmetric and asymmetric stretching vibration of C-H in hydrocarbon chains, respectively. The peak with a maximum of 1710 cm
−1 derived from stretching vibrations was associated with the occurrence of the carbonyl group. In the IR spectra, the following signals were also visible: signals at 1538 and 1509 cm
−1 corresponded to the bending vibrations of the N-H group, whereas the signal at 1094 cm
−1 was associated with the stretching vibrations of C-O-C groups [
30,
31].
New signals at 1489, 1186 and 959 cm
−1 were registered for the PUR composites containing TPP. The peak at 1489 cm
−1 and 959 cm
−1 corresponded to a vibration aromatic ring, whereas the peak at 1186 cm
−1 corresponded to the valence vibration of the P-O-C group (
Figure 4) [
32,
33].
Additional signals were not recorded for the FTIR spectrum of the PUR composites containing TPP with POSS (AM, MA, OL). Also, no loss of signals was observed for the spectrum of the PUR−TPP composites. Therefore, it was found that TPP does not react with polyol and isocyanate during the PUR synthesis process, or even POSS compounds added at this stage.
3.2. Thermal Analysis and Flammability of PUR Composites
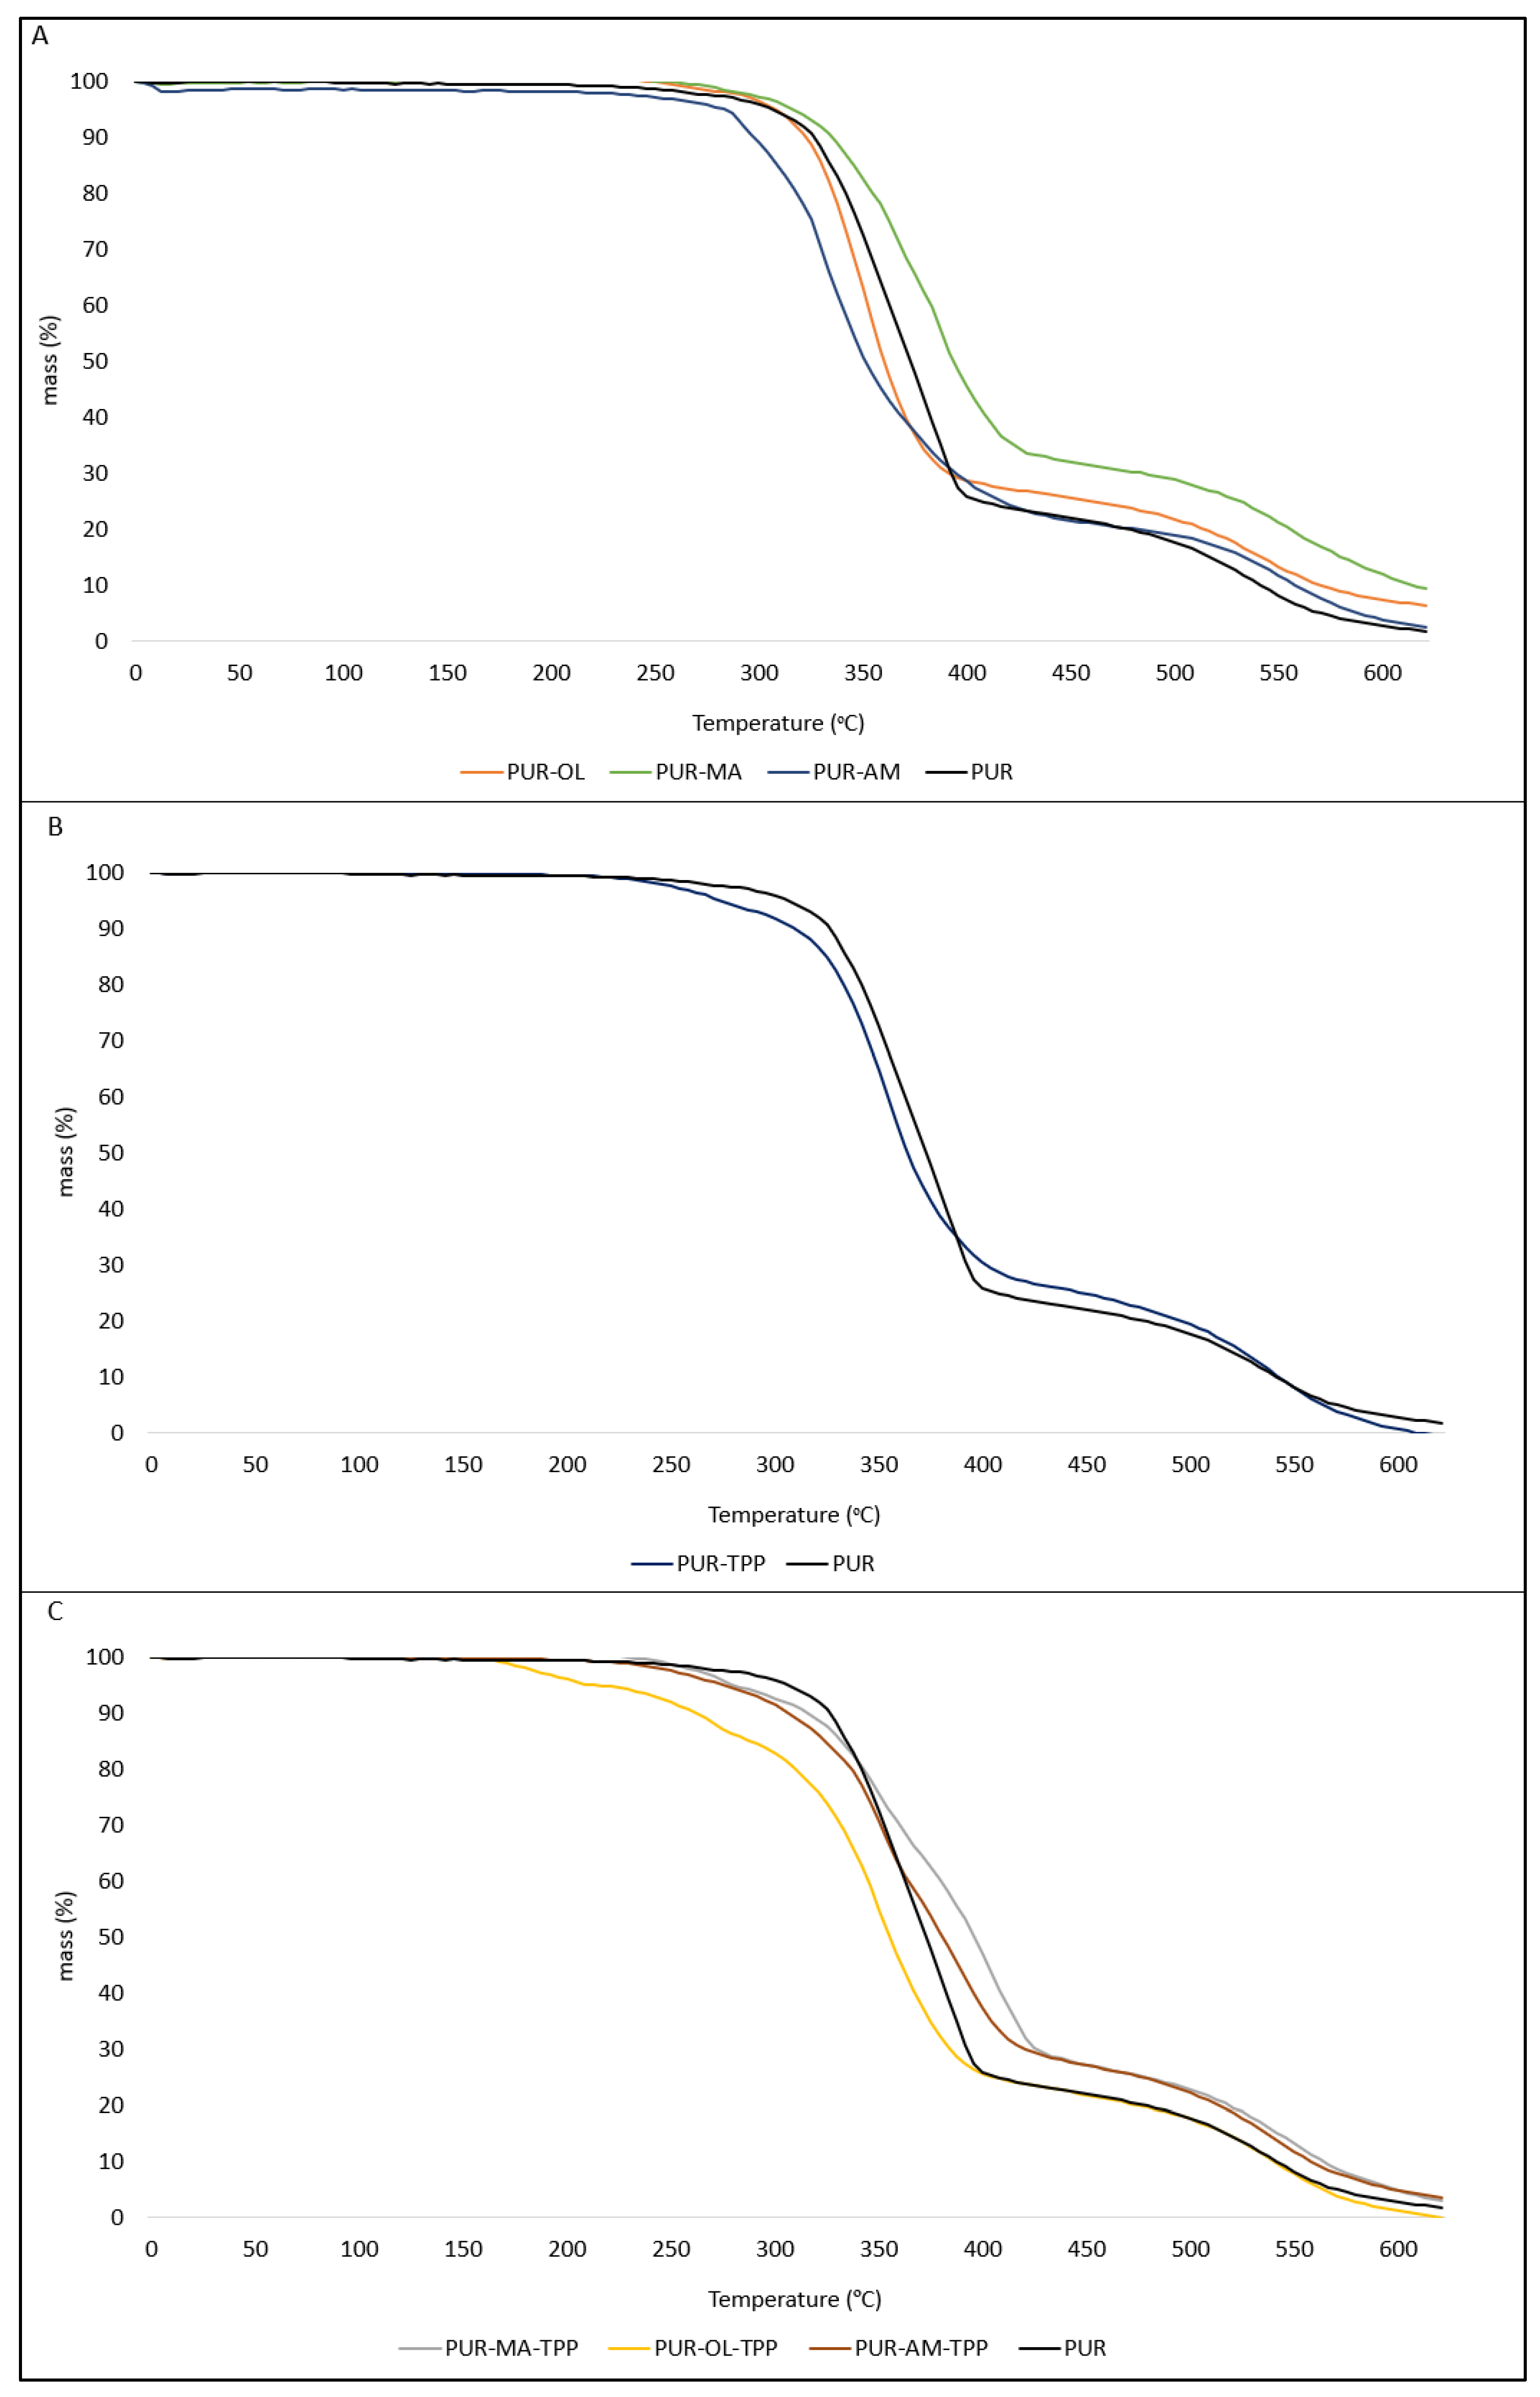
The results of the thermal analysis indicate that POSS compounds have an ambiguous effect on the thermal parameters of PUR composites (
Table 2). The POSS–AM as well as POSS–MA increase the value of the T
5 and T
50 parameters, and significantly reduce the value of the dm/dt parameter, especially in the case of POSS–MA (
Figure 5A). Limiting the rate of thermal decomposition dm/dt is of key importance from the point of view of reducing the fire hazard of the tested materials. The lower the value of the dm/dt parameter, the lower the intensity decomposition of a given composite, and thus the less flammable composite enters the flame zone.
It is worth noting that the value of the dm/dt parameter was reduced by nearly 18% compared to the reference sample in the case of the PUR–MA composite, which suggests that the intensity of the combustion process (flame feeding) and the emission of toxic gaseous destructs are significantly lower in the case of the POSS–MA sample when compared to the PUR reference sample (
Table 2).
All tested POSS compounds (AM, MA, OL) cause an increase in both residues after thermal decomposition, the PTD parameter, as well as residues at a temperature of 600 °C, the P
600 parameter. A clear increase in the value of the P
TD and P
600 parameters indicates that POSS compounds can catalyze the formation of a ceramic boundary layer during the decomposition of the PUR composite. This layer, due to its insulating properties, primarily limits the transfer of heat from the flame to the interior of the sample, as well as the transfer of liquid and gaseous destructs to the flame [
34,
35].
The application of an organophosphate flame-retardant compound into the PUR matrix in the form of TPP also had an ambiguous effect on the thermal stability of the PUR–TPP composite (
Figure 5B). In the presence of TPP, thermal stability parameters such as T
5, T
50 and T
RMAX were not improved, while the dm/dt parameter had a value close to the reference sample (PUR composite).
However, it should be noted that the residue parameter after thermal decomposition (P
TD parameter) was increased, which indicates that TPP generates a carbon residue of a potential insulating nature during thermal decomposition. The aromatic rings enrich the TPP structure with carbon (
Figure 1). Nevertheless, the obtained test results clearly indicate that the carbon residue after thermal decomposition was almost completely burned at ∆T = 435–600 °C. The P600 parameter was only 0.15% in the case of the PUR–TPP composite.
In the case of PUR composites containing the synergistic POSS–TPP system, the amount of residue after thermal decomposition (P
TD parameter) was practically no different in relation to the residue after thermal decomposition of the PUR–TPP composite (
Figure 5C).
Nevertheless, the P
600 parameter value for the composites containing the POSS–TPP system was significantly higher when compared to the PUR–TPP composite. These were 4.54, 4.27, and 4.71 for the PUR–AM–TPP, PUR–MA–TPP, and PUR–OL–TPP composites, respectively (
Table 2).
The increase in the P
600 parameter for the composites containing the POSS–TPP system indicates that POSS compounds stabilize the carbon residue through physical interactions, i.e., the formation of a ceramic coating on the carbon surface and as a result of a chemical reaction based on the formation of thermally stable Si-C silicon carbide [
36].
It is also worth noting that those composites which contained the POSS–TPP system, especially the PUR–MA–TPP ones, were characterized by higher values of the T50 and TRMAX parameters, along with a simultaneously reduced value of the dm/dt parameter, compared to the PUR–TPP reference sample.
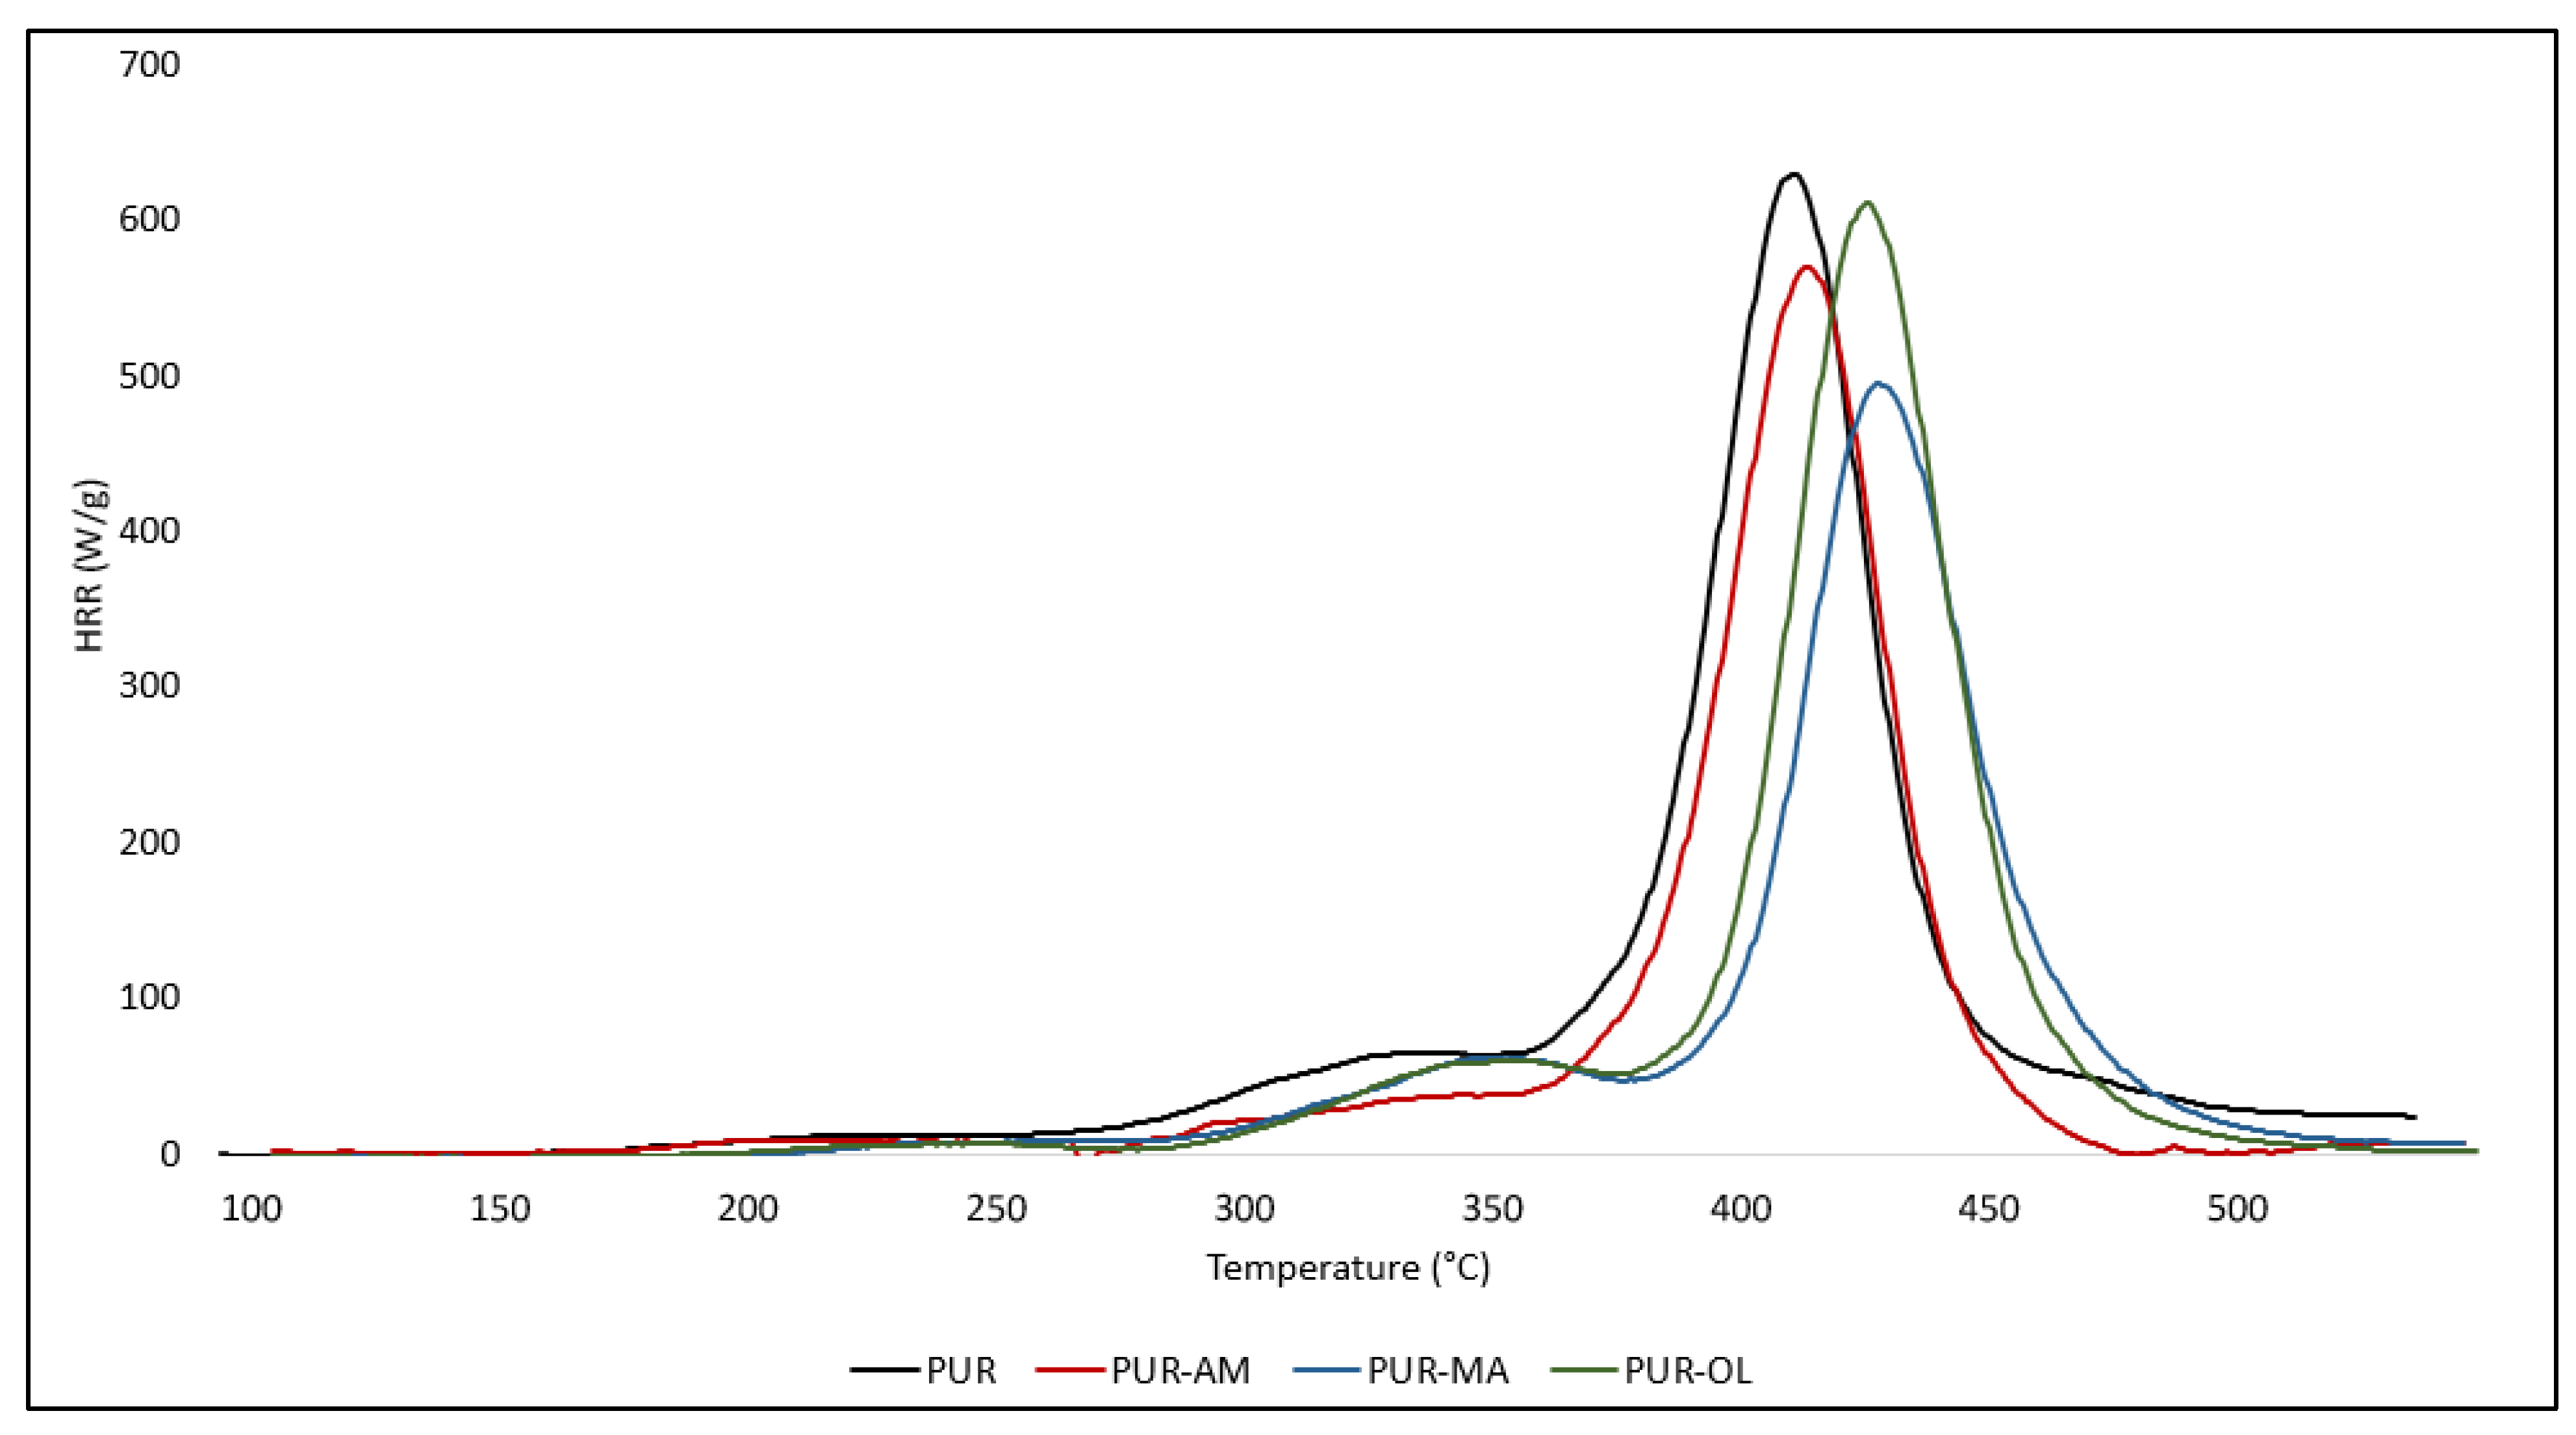
The test results obtained using the PCFC method were corelating positively with those obtained when using the thermal analysis method [
37,
38]. Among the tested POSS compounds, the PUR–MA composite had the highest reduction value for both HRR
MAX and THR parameters. It cannot be excluded that despite the lack of changes in the IR spectrum, the POSS–MA was applied to the structure of the PUR foam through polar groups located at the end of the alkyl chains or bound to the PUR through reversible intermolecular interactions [
39,
40].
POSS–AM and POSS–OL also have a beneficial effect on reducing the flammability of PUR composites; however, the reduction in the values of HRR
MAX and THR parameters was observed for a much smaller extent than in the case of the composite containing POSS–MA (
Figure 6).
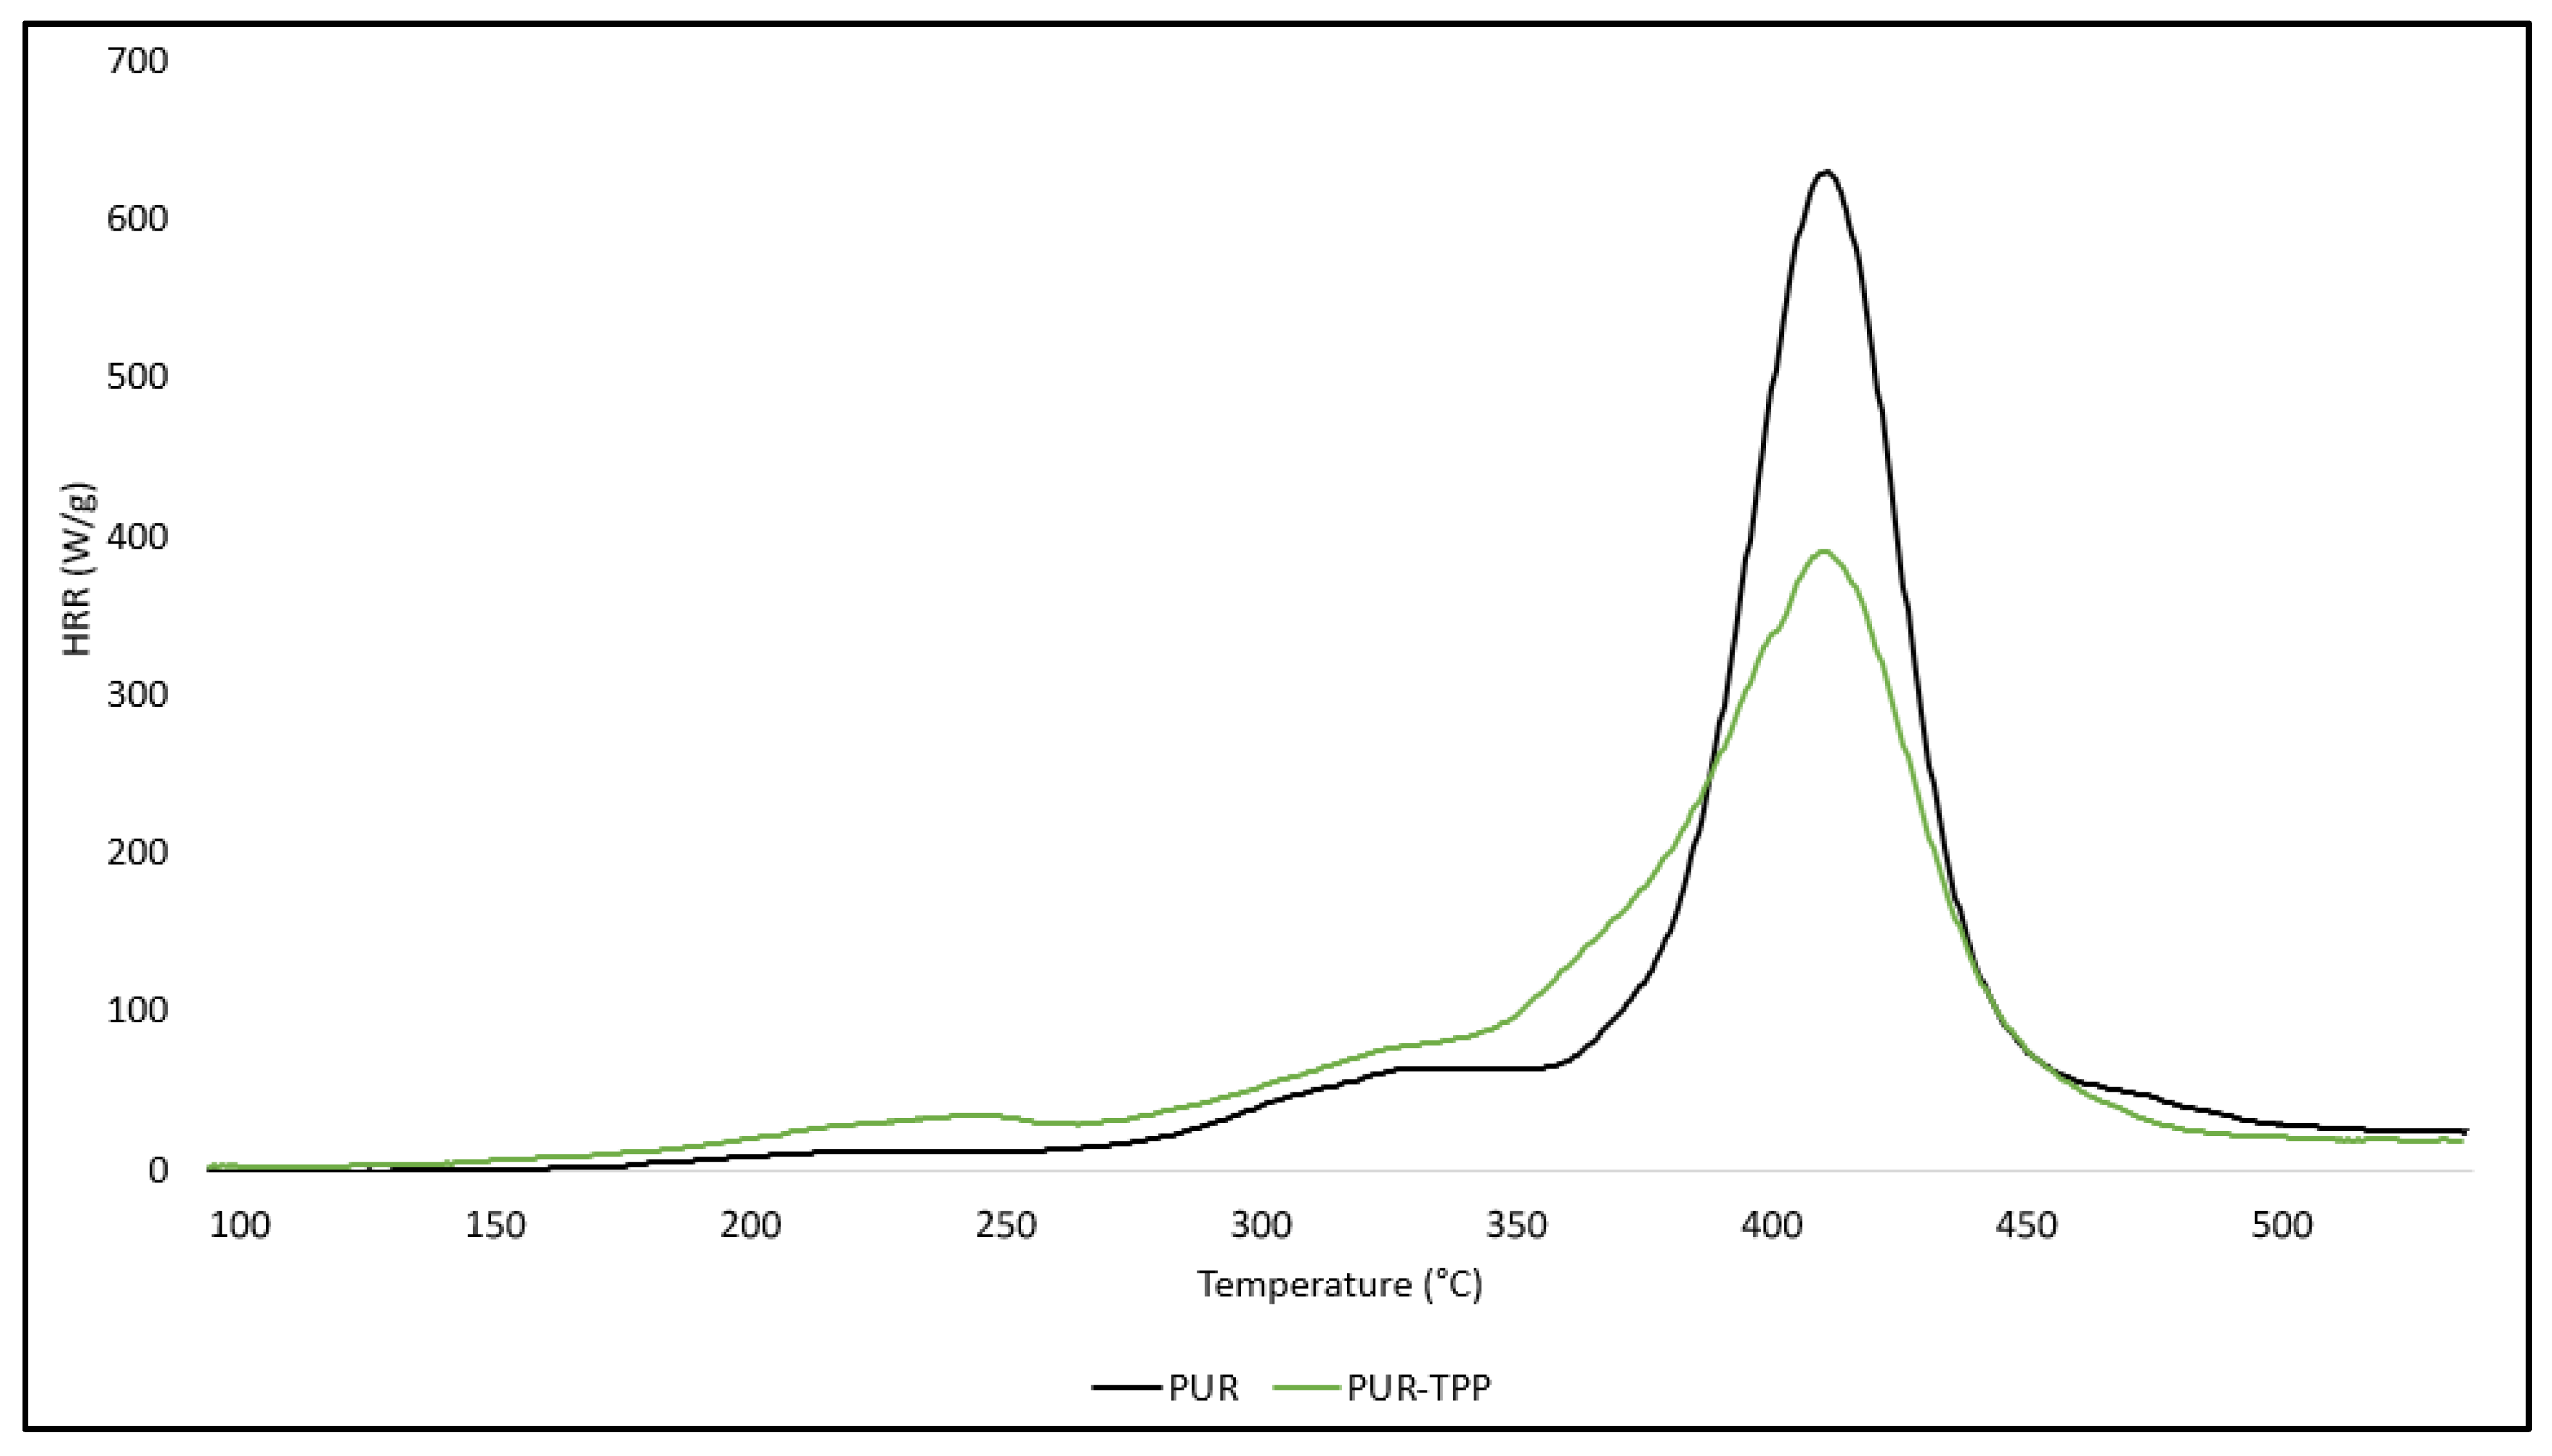
The test results presented in
Table 3 indicate that triphenyl polyphosphorus (TPP) is much more effective in reducing the flammability of PUR compared to POSS compounds. In the presence of TPP, the HRR
MAX parameter was reduced by 38%. It is also worth noting that the TPP significantly reduced the value of the heat capacity parameter, i.e., HRC. Reducing the HRC parameter value by 37.8% significantly limits the susceptibility of the modified PUR foam to both maintaining combustion processes and fire development (
Table 3) (
Figure 7).
The highest degree of fire hazard reduction in the tested PUR foams, expressed by means of the HRR
MAX, THR, and HRC parameter values, was obtained for the synergistic effect of POSS compounds and TPP. The results presented in
Table 3 indicate that all tested composites, i.e., PUR–AM–TPP, PUR–MA–TPP and PUR–OL–TPP, are characterized by similar values of HRR
MAX, THRR
MAX, THR, and HRC (
Figure 8).
Considering that the PUR composites containing the synergistic POSS–TPP system are characterized by the greatest reduction in flammability in comparison to the PUR reference sample, they were next subjected to flammability tests in real conditions (
Table 4).
The test results obtained using the cone calorimetry method confirmed the effectiveness of the POSS–TPP system in the flammability reduction processes of the tested PUR foams. In real conditions, it is worth noting that the POSS–TPP system, especially in the form of AM–TPP and OL–TPP, significantly reduced the total heat released (THR parameter) of the tested PUR composites. In the case of AM–TPP, the THR parameter value was reduced by 70.1%, while it was reduced by 68.7% in the case of OL–TPP compared to the reference sample (PUR) (
Table 4).
It should also be emphasized that the MA–TPP system effectively reduced the MARHE parameter informing about the intensity of fire. The PUR–MA–TPP composite, similarly to the PUR–OL–TPP one, is characterized by a significant reduction time to flameout compared to the PUR–TPP composite. Reducing the extinguishing time of the sample, without increasing the HRRMAX value, reduces the fire hazard of the tested PUR composites.
3.3. Emission of Smoke and Toxic Gases
Smoke is defined as an aerosol of solid or liquid particles generated during the pyrolysis process or thermo-oxidative decomposition of an organic fuel. The amount of smoke generated depends on many factors, including the chemical composition of the fuel, the availability of oxygen, the intensity of the heat flux, as well as the conditions of the combustion process (flameless or flame combustion) [
41].
Reducing the amount of smoke emitted directly translates into increased fire safety. It is common knowledge that smoke hinders the orientation of people caught in a fire; and therefore, it is the main factor causing disorientation and panic. It is also a carrier of toxic organic destructs, especially those coming from the group of dioxins and polycyclic aromatic hydrocarbons [
42].
The obtained test results clearly indicate that the flame-retardant system used for the tested PUR–POSS–TPP composites has a beneficial effect on reducing their smoke production (Ds
MAX parameter,
Table 5).
In the case of composites containing AM–TPP and MA–TPP, the value of the maximum optical density of smoke was reduced by over 32% in comparison to the PUR reference (
Table 5).
Also, the amount of smoke emitted after 4 min of the test, the Ds(4) parameter, is much lower for the composites containing POSS–TPP than for the PUR reference sample.
It should also be emphasized that the PUR–TPP composite is also characterized by lower values of the DsMAX and Ds(4) parameters compared to the PUR reference composite. It is probable that the char formed during the thermal decomposition of TPP of good insulating properties limits the decomposition of the composite and reduces smoke emissions.
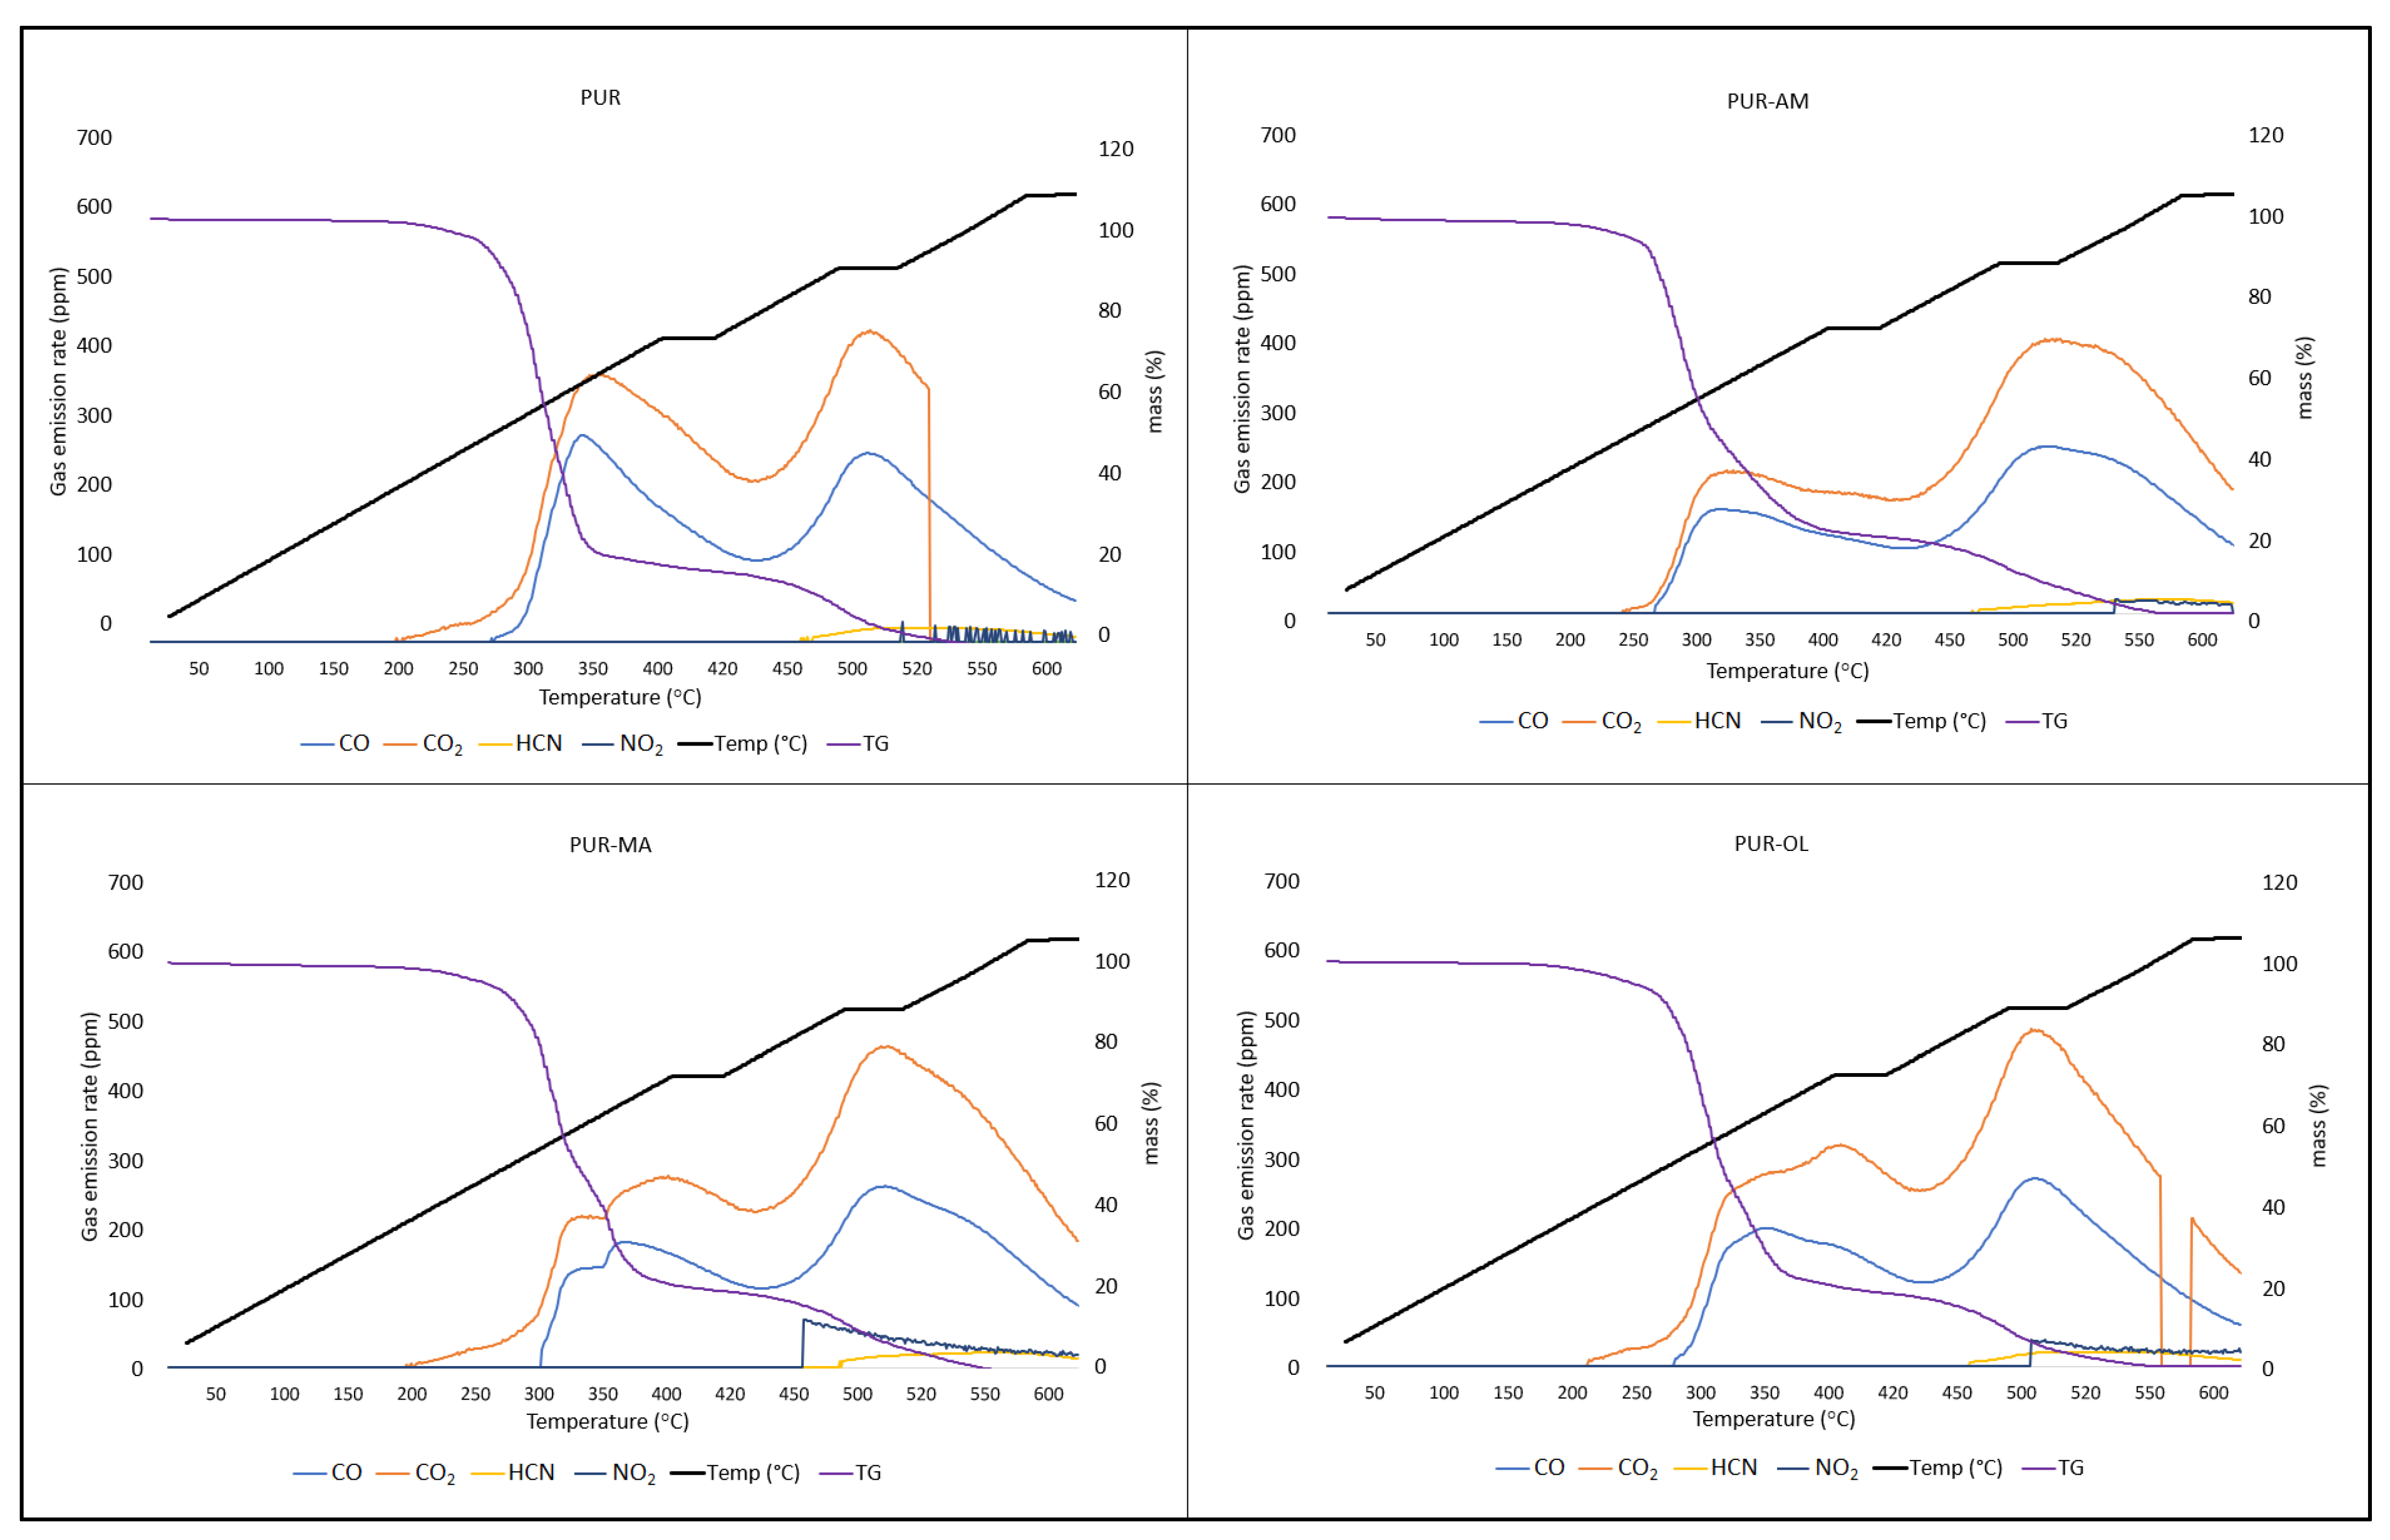
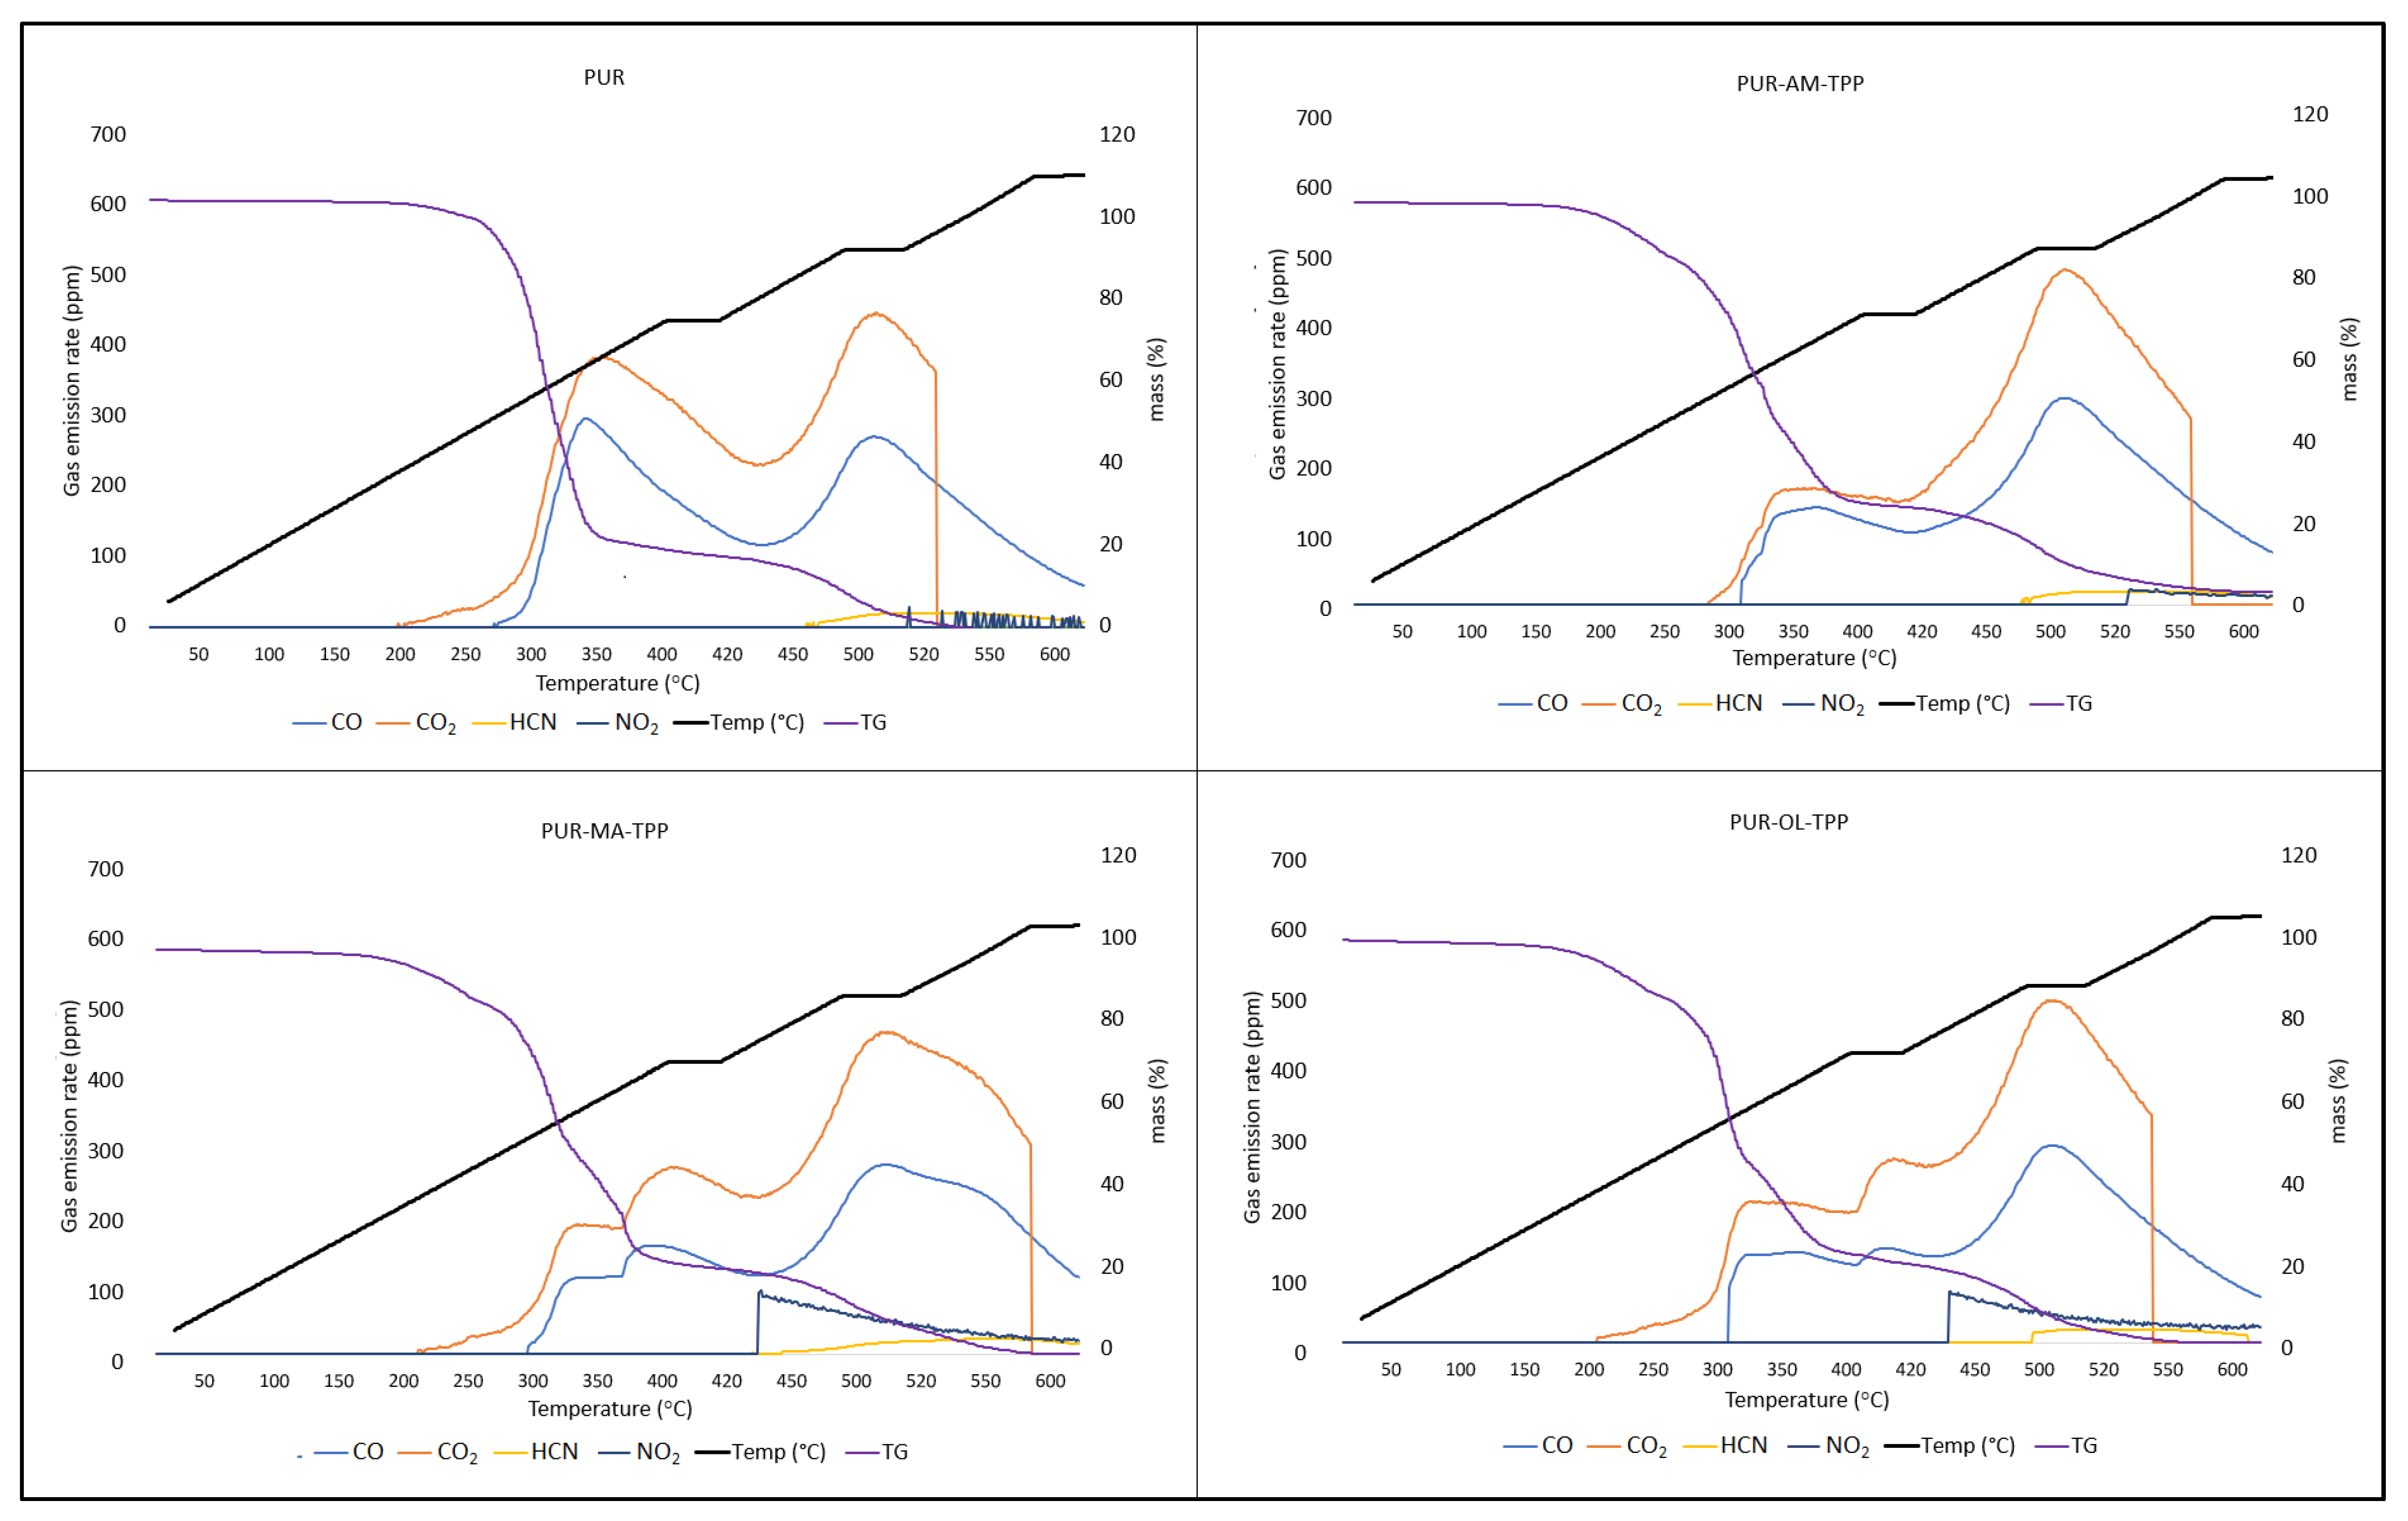
Silsesquioxanes have a beneficial effect on the reduction in toxic gas emissions generated during PUR decomposition, especially when they occur in a synergistic system with TPP (
Table 5) (
Figure 9).
Applying the silsesquioxane compounds to the PUR foam matrix results primarily in the reduction in carbon monoxide emissions. It is worth noting that the amount of hydrogen cyanide emitted was also reduced. However, POSS compounds had an ambiguous effect on the CO2 and NO2 emission values. In the case of the PUR–OL composite, a significant increase in the amount of NO2 emitted was recorded.
Applying the organophosphate compound TPP to the PUR matrix results in reduced CO, CO
2, and HCN emissions compared to the PUR reference sample (
Table 6). Nevertheless, TPP, just like POSS–OL, clearly affects the amount of nitrogen dioxide (NO
2) emissions. Considering that both TPP and POSS–OL do not contain nitrogen, it is possible that TPP and POSS–OL accelerate the oxidative decomposition of the urethane bond.
The synergistic POSS–TPP system clearly reduces the amount and toxicity of gases emitted during the decomposition of polyurethane composites. The POSS–TPP system not only reduces the amount of CO and CO
2, but also the amount of HCN and NO
2 emissions during the decomposition of PUR composites (
Figure 10).
The reduction in toxic gas emissions in the POSS–TPP system results primarily from the formation of a uniform carbon layer during the thermal decomposition of the PUR composite. The main sources of carbon in the PUR–POSS–TPP composite are the aromatic structures of TPP, which, during thermal decomposition of the composite, create a three-dimensional carbon residue with a large specific surface area, also chemically stabilized by the POSS decomposition products. The reduction in the emission values of the determined toxic gases results primarily from their impeded diffusion through the boundary layer, as well as the effect of adsorption processes taking place in the boundary layer.


 ,
, 


