
Effect of the Formation of Hydrophilic and Hydrophobic–Hydrophilic Associates on the Behavior of Copolymers of N-Vinylpyrrolidone with Methyl Acrylate in Aqueous Solutions


 , ,
, ,
Abstract
1. Introduction
2. Materials
3. Methods
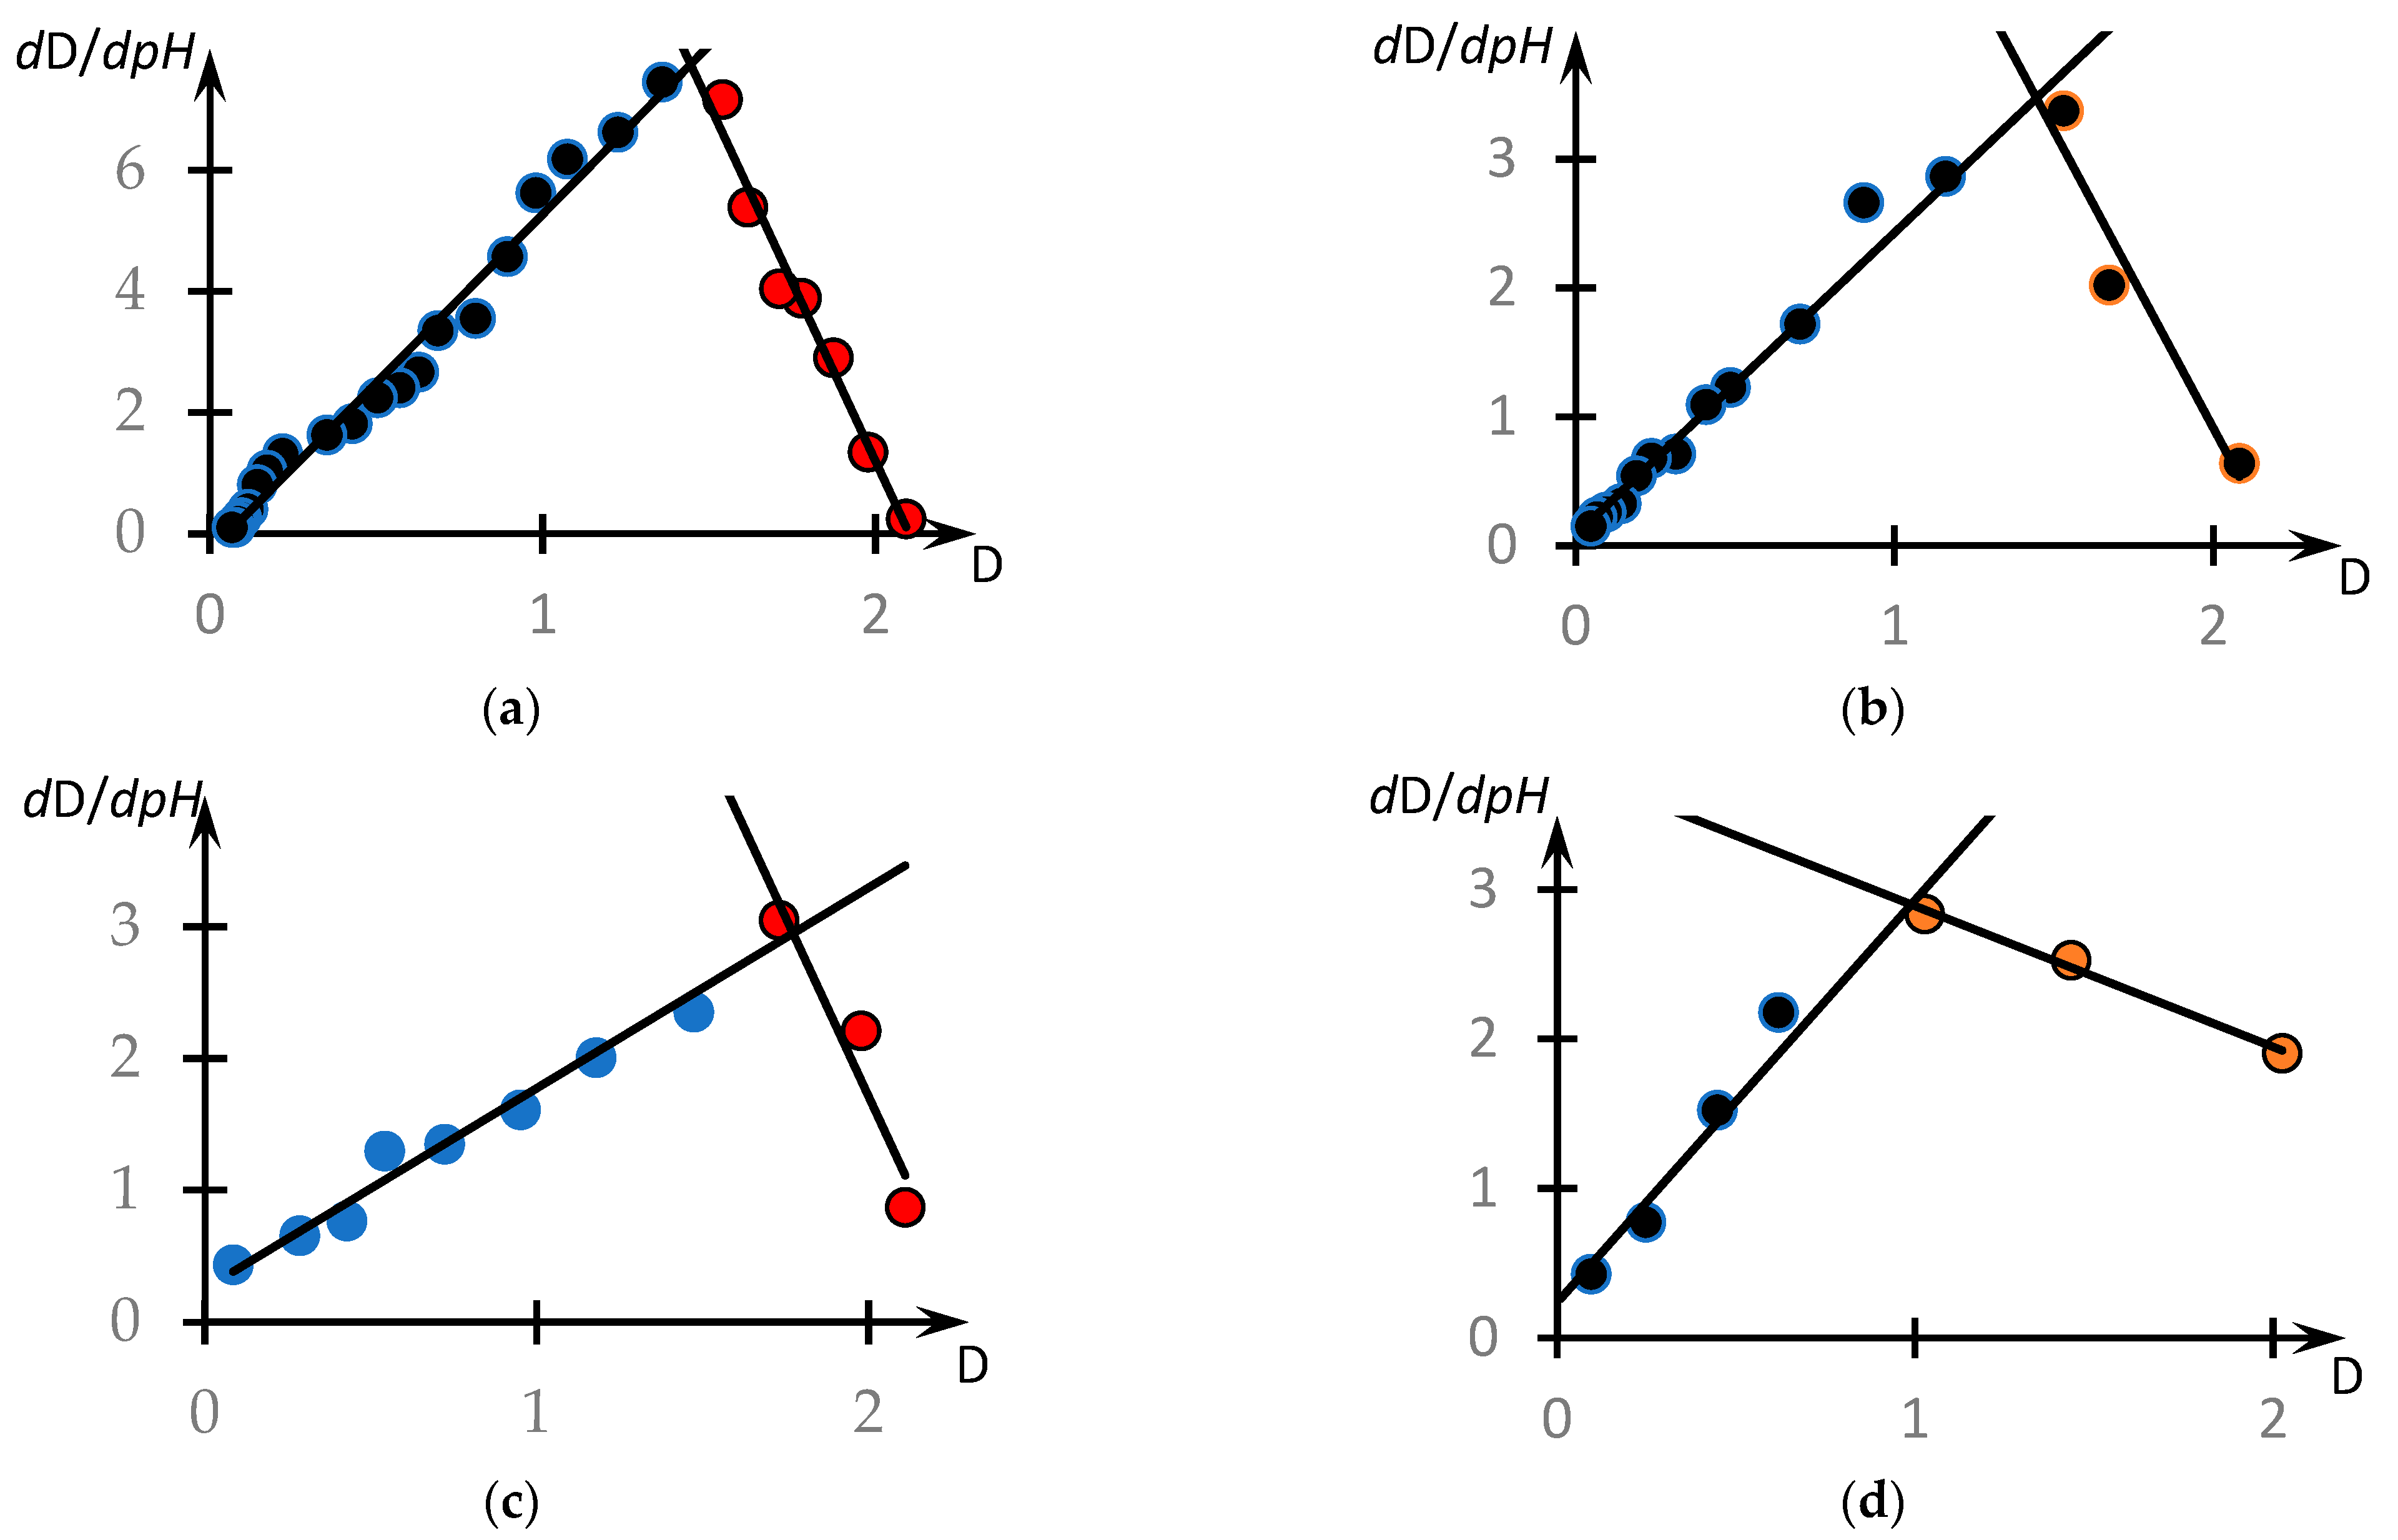
4. Results
5. Discussion
6. Conclusions
Supplementary Materials
Author Contributions
Funding
Institutional Review Board Statement
Data Availability Statement
Conflicts of Interest
References
- Ramírez-Irigoyen, A.J.; García-Verdugo, K.F.; Castillo-Ortega, M.M.; Rodríguez-Félix, D.E.; Encinas, J.C.; Plascencia-Jatomea, M.; Argüelles-Monal, W.; Sauceda, I.S.; Pérez-González, R.; del Castillo-Castro, T. Study of Thermal Transitions of Copolymers Based on N-isopropylacrylamide and Acrylic Acid with Potential for Curcumin Controlled Release. J. Appl. Polym. Sci. 2023, 140, e54338. [Google Scholar] [CrossRef]
- Kojima, C.; Fu, Y.; Tamaki, M. Control of Stimuli Sensitivity in PH-Switchable LCST/UCST-Type Thermosensitive Dendrimers by Changing the Dendrimer Structure. Polymers 2022, 14, 2426. [Google Scholar] [CrossRef] [PubMed]
- Shi, J.; Yu, L.; Ding, J. PEG-Based Thermosensitive and Biodegradable Hydrogels. Acta Biomater. 2021, 128, 42–59. [Google Scholar] [CrossRef] [PubMed]
- Weber, C.; Hoogenboom, R.; Schubert, U.S. Temperature Responsive Bio-Compatible Polymers Based on Poly(Ethylene Oxide) and Poly(2-Oxazoline)S. Prog. Polym. Sci. 2012, 37, 686–714. [Google Scholar] [CrossRef]
- Essawy, H.A.; Ibrahim, H.S. Synthesis and Characterization of Poly(Vinylpyrrolidone-Co-Methylacrylate) Hydrogel for Removal and Recovery of Heavy Metal Ions from Wastewater. React. Funct. Polym. 2004, 61, 421–432. [Google Scholar] [CrossRef]
- Wei, M.; Gao, Y.; Li, X.; Serpe, M.J. Stimuli-Responsive Polymers and Their Applications. Polym. Chem. 2016, 8, 127–143. [Google Scholar] [CrossRef]
- Zhu, L.; Zhao, J.; Guo, Z.; Liu, Y.; Chen, H.; Chen, Z.; He, N. Applications of Aptamer-Bound Nanomaterials in Cancer Therapy. Biosensors 2021, 11, 344. [Google Scholar] [CrossRef]
- Rzaev, Z.M.O.; Dincer, S.; Piskin, E. Functional Copolymers of N-Isopropylacrylamide for Bioengineering Applications. Prog. Polym. Sci. 2007, 32, 534–595. [Google Scholar] [CrossRef]
- Yang, L.; Fan, X.; Zhang, J.; Ju, J. Preparation and Characterization of Thermoresponsive Poly(N-Isopropylacrylamide) for Cell Culture Applications. Polymers 2020, 12, 389. [Google Scholar] [CrossRef]
- Jain, S.; Kirar, M.; Bindeliya, M.; Sen, L.; Soni, M.; Shan, M.; Purohit, A.; Jain, P.K. Novel Drug Delivery Systems: An Overview. Asian J. Dent. Health Sci. 2022, 2, 33–39. [Google Scholar] [CrossRef]
- Bhatt, P.; Kumar, V.; Subramaniyan, V.; Nagarajan, K.; Sekar, M.; Chinni, S.V.; Ramachawolran, G. Plasma Modification Techniques for Natural Polymer-Based Drug Delivery Systems. Pharmaceutics 2023, 15, 2066. [Google Scholar] [CrossRef]
- Madan, H.S. Polymer in Pharmaceutical Drug Delivery System. Int. J. Res. Appl. Sci. Eng. Technol. 2021, 9, 1552–1558. [Google Scholar] [CrossRef]
- Jan, N.; Shah, H.; Khan, S.; Nasar, F.; Madni, A.; Badshah, S.F.; Ali, A.; Bostanudin, M.F. Old Drug, New Tricks: Polymer-Based Nanoscale Systems for Effective Cytarabine Delivery. Naunyn-Schmiedebergs Arch. Pharmacol. 2023. [Google Scholar] [CrossRef] [PubMed]
- Barua, M.; Teniola, O.R.; Laurencin, C.T. Biodegradable Polyphosphazenes for Biomedical Applications. Regen. Eng. Transl. Med. 2023. [Google Scholar] [CrossRef]
- Markandeywar, T.S.; Singh, D.; Narang, R.K. A Complete Sojorum on Thermosensitive Hydrogels for Wound Healing: Recent Developments and Ongoing Research. Curr. Drug Ther. 2024, 19, 123–149. [Google Scholar] [CrossRef]
- Suleymenov, I.E.; Sedlakova, Z.Z.; Kopishev, E.E. New Polymer Materials for Optical Sensor Systems. J. Inorg. Organomet. Polym. Mater. 2019, 29, 758–764. [Google Scholar] [CrossRef]
- Sobrinho, J.A.; Brito Junior, G.A.; Mazali, I.O.; Sigoli, F.A. Water-Soluble Poly(N-Isopropylacrylamide) Nanoparticles Grafted to Trivalent Lanthanide Complexes as Highly Sensitive Ratiometric Nanothermometers. New J. Chem. 2020, 44, 8068–8075. [Google Scholar] [CrossRef]
- Xu, B.; Wang, J.; Cai, C.; Xin, W.; Wei, L.; Yang, Q.; Peng, B.; Hu, Y.; Li, J.; Wang, X. Construction of Laminated Luminescent Solar Concentrator “Smart” Window Based on Thermoresponsive Polymer and Carbon Quantum Dots. Crystals 2022, 12, 1612. [Google Scholar] [CrossRef]
- Salunkhe, T.T.; Kim, I.T. Sequential Dual Coating with Thermosensitive Polymers for Advanced Fiber Optic Temperature Sensors. Sensors 2023, 23, 2898. [Google Scholar] [CrossRef]
- Li, H.; Yu, M.; Dai, J.; Zhou, G.; Sun, J. Upconversion Nanoparticle-Based Fluorescent Film for Distributed Temperature Monitoring of Mobile Phones’ Integrated Chips. Nanomaterials 2023, 13, 1704. [Google Scholar] [CrossRef]
- Zharkova, G.M.; Kovrizhina, V.N.; Petrov, A.P. Capability analysis of using polymer-dispersed cholesterics doped with luminophore for optical diagnosis of flows. Liq. Cryst. Their Appl. 2023, 23, 63–70. [Google Scholar] [CrossRef]
- Kim, Y.-K.; Lim, S.; Kim, D.-H. Effect of Steady and Relaxation Oscillation Using Controlled Chaotic Instabilities in Brillouin Fibers Based Neural Network. In Advances in Natural Computation; Springer: Berlin/Heidelberg, Germany, 2006; pp. 880–883. [Google Scholar]
- Yu, Y.; Cao, Y.; Wang, G.; Pang, Y.; Lang, L. Optical Diffractive Convolutional Neural Networks Implemented in an All-Optical Way. Sensors 2023, 23, 5749. [Google Scholar] [CrossRef]
- Kalimoldayev, M.; Suleimenov, I.; Pak, I.; Vitulyova, E.; Tasbulatova, Z.; Yevstifeyev, V.; Mun, G. To the question of physical implementation of optical neural networks. News Natl. Acad. Sci. Repub. Kazakhstan 2019, 2, 217–224. [Google Scholar] [CrossRef]
- Ilies, D.C.; Zlatev, Z.; Ilies, A.; Zharas, B.; Pantea, E.; Hodor, N.; Indrie, L.; Turza, A.; Taghiyari, H.R.; Caciora, T.; et al. Interdisciplinary Research to Advance Digital Imagery and Natural Compounds for Eco-Cleaning and for Preserving Textile Cultural Heritage. Sensors 2022, 22, 4442. [Google Scholar] [CrossRef]
- Karimov, A.; Kopets, E.; Karimov, T.; Almjasheva, O.; Arlyapov, V.; Butusov, D. Empirically Developed Model of the Stirring-Controlled Belousov–Zhabotinsky Reaction. Chaos Solitons Fractals 2023, 176, 114149. [Google Scholar] [CrossRef]
- Milo, V.; Malavena, G.; Monzio Compagnoni, C.; Ielmini, D. Memristive and CMOS Devices for Neuromorphic Computing. Materials 2020, 13, 166. [Google Scholar] [CrossRef] [PubMed]
- Zakutynskyi, I.; Sibruk, L.; Rabodzei, I. Performance Evaluation of the Cloud Computing Application for IoT-Based Public Transport Systems. East. Eur. J. Enterp. Technol. 2023, 4, 6–13. [Google Scholar] [CrossRef]
- Schmier, S.; Lauer, C.; Schäfer, I.; Klang, K.; Bauer, G.; Thielen, M.; Termin, K.; Berthold, C.; Schmauder, S.; Speck, T.; et al. Developing the Experimental Basis for an Evaluation of Scaling Properties of Brittle and ‘Quasi-Brittle’ Biological Materials. In Biomimetic Research for Architecture and Building Construction; Springer: Berlin/Heidelberg, Germany, 2016; pp. 277–294. [Google Scholar]
- Navlakha, S.; Bar-Joseph, Z. Distributed Information Processing in Biological and Computational Systems. Commun. ACM 2015, 58, 94–102. [Google Scholar] [CrossRef]
- Zhang, Y.; Cai, J.; Li, C.; Wei, J.; Liu, Z.; Xue, W. Effects of Thermosensitive Poly-(N-Isopropylacrylamide) on Blood Coagulation. J. Mater. Chem. B 2016, 4, 3733–3749. [Google Scholar] [CrossRef] [PubMed]
- Dai, Y.; Su, J.; Wu, K.; Ma, W.; Wang, B.; Li, M.; Sung, P.; Shen, Q.; Wang, Q.; Fan, Q. Multifunctional Thermosensitive Liposomes Based on Natural Phase-Change Material: Near-Infrared Light-Triggered Drug Release and Multimodal Imaging-Guided Cancer Combination Therapy. ACS Appl. Mater. Interfaces 2019, 11, 10540–10553. [Google Scholar] [CrossRef] [PubMed]
- Sun, P.; Huang, T.; Wang, X.; Wang, G.; Liu, Z.; Chen, G.; Fan, Q. Dynamic-Covalent Hydrogel with NIR-Triggered Drug Delivery for Localized Chemo-Photothermal Combination Therapy. Biomacromolecules 2020, 21, 556–565. [Google Scholar] [CrossRef]
- Zhang, C.; Yang, J.; Cui, G.; Sun, Z.; Zhao, Y.; Wu, J.; Zhang, S.; Zhao, J.; Bai, H.; Miao, C. A Sensitized Fiber Optic Fabry-Perot Temperature Sensor Based on Virtual Vernier Effect. In Proceedings of the Twelfth International Conference on Information Optics And Photonics (CIOP 2021), Xi’an, China, 23–26 July 2021; Volume 12057. [Google Scholar]
- Lee, J.; Park, S.; Lee, S.; Kweon, H.Y.; Jo, Y.-Y.; Kim, J.; Chung, J.H.; Seonwoo, H. Development of Silk Fibroin-Based Non-Crosslinking Thermosensitive Bioinks for 3D Bioprinting. Polymers 2023, 15, 3567. [Google Scholar] [CrossRef]
- Suleimenov, I.E.; Guven, O.; Mun, G.A.; Uzun, C.; Gabrielyan, O.A.; Kabdushev, S.B.; Agibaeva, L.; Nurtazin, A. Hysteresis Effects During the Phase Transition in Solutions of Temperature Sensitive Polymers. Eurasian Chem. J. 2017, 19, 41. [Google Scholar] [CrossRef]
- Safarov, R.Z.; Kargin, J.B.; Aibuldinov, Y.K.; Zhandildenova, A.K.; Makhmutov, B.B.; Sviderskiy, A.K.; Vatin, N.I. Structure and Content Analysis of Raw Materials for Production of Trimanganese Tetraoxide Pigment. Crystals 2021, 11, 1460. [Google Scholar] [CrossRef]
- Suerbaev, K.A.; Chepaikin, E.G.; Kanapieva, F.M.; Seitenova, G.Z. Carboxylation of Organic Compounds with Metal Alkyl Carbonates (Review). Pet. Chem. 2009, 49, 265–273. [Google Scholar] [CrossRef]
- Burkholder, M.B.; Litster, S. Characterizing Dynamic Hysteresis and Fractal Statistics of Chaotic Two-Phase Flow and Application to Fuel Cells. Phys. Fluids 2016, 28, 053301. [Google Scholar] [CrossRef]
- Zanini, M.; Marschelke, C.; Anachkov, S.E.; Marini, E.; Synytska, A.; Isa, L. Universal Emulsion Stabilization from the Arrested Adsorption of Rough Particles at Liquid-Liquid Interfaces. Nat. Commun. 2017, 8, 15701. [Google Scholar] [CrossRef]
- Wang, W.; Xu, X.; Feng, F.; Shao, Y.; Jian, H.; Liu, H.; Dong, X.-H.; Ge, A.; Yang, S. Interfacial Behaviors of Giant Amphiphilic Molecules Composed of Hydrophobic Isobutyl POSS and Hydrophilic POSS Bearing Carboxylic Acid Groups at the Air-Water Interface. Langmuir 2023, 39, 16854–16862. [Google Scholar] [CrossRef] [PubMed]
- Liu, J.; Guo, H.; Gao, Q.; Li, H.; An, Z.; Zhang, W. Coil–Globule Transition of a Water-Soluble Polymer. Macromolecules 2022, 55, 8524–8532. [Google Scholar] [CrossRef]
- Polanowski, P.; Sikorski, A. Coil–Globule Transition in Two-Dimensional Polymer Chains in an Explicit Solvent. Soft Matter 2023, 19, 7979–7987. [Google Scholar] [CrossRef] [PubMed]
- Podewitz, M.; Wang, Y.; Quoika, P.K.; Loeffler, J.R.; Schauperl, M.; Liedl, K.R. Coil–Globule Transition Thermodynamics of Poly(N-Isopropylacrylamide). J. Phys. Chem. B 2019, 123, 8838–8847. [Google Scholar] [CrossRef]
- Suleimenov, I.; Guven, O.; Mun, G.; Beissegul, A.; Panchenko, S.; Ivlev, R. The Formation of Interpolymer Complexes and Hydrophilic Associates of Poly(Acrylic Acid) and Non-Ionic Copolymers Based on 2-Hydroxyethylacrylate in Aqueous Solutions. Polym. Int. 2013, 62, 1310–1315. [Google Scholar] [CrossRef]
- Kabdushev, S.; Mun, G.; Suleimenov, I.; Alikulov, A.; Shaikhutdinov, R.; Kopishev, E. Formation of Hydrophobic–Hydrophilic Associates in the N-Vinylpyrrolidone and Vinyl Propyl Ether Copolymer Aqueous Solutions. Polymers 2023, 15, 3578. [Google Scholar] [CrossRef] [PubMed]
- Reis, D.; Jones, T. Aromatherapy: Using Essential Oils as a Supportive Therapy. Clin. J. Oncol. Nurs. 2017, 21, 16–19. [Google Scholar] [CrossRef] [PubMed]
- Rubinstein, M.; Colby, R.H. Polymer Physics; Oxford University Press: Oxford, UK, 2003; ISBN 9780198520597. [Google Scholar]
- Pham, P.; Oliver, S.; Wong, E.H.H.; Boyer, C. Effect of Hydrophilic Groups on the Bioactivity of Antimicrobial Polymers. Polym. Chem. 2021, 12, 5689–5703. [Google Scholar] [CrossRef]
- Suleimenov, I.E.; Kabdushev, S.B.; Kadyrzhan, K.; Shaltikova, D.B.; Moldakhan, I. New Technologies for Measuring Viscosity. In Proceedings of the 2020 6th International Conference on Computer and Technology Applications, Antalya, Turkey, 14–16 April 2020; pp. 129–133. [Google Scholar]
- Khutoryanskiy, V.V.; Dubolazov, A.V.; Nurkeeva, Z.S.; Mun, G.A. PH Effects in the Complex Formation and Blending of Poly(Acrylic Acid) with Poly(Ethylene Oxide). Langmuir 2004, 20, 3785–3790. [Google Scholar] [CrossRef] [PubMed]
- Suleimenov, I.; Shaltykova, D.; Sedlakova, Z.; Mun, G.; Semenyakin, N.; Kaldybekov, D.; Obukhova, P. Hydrophilic Interpolymer Associates as a Satellite Product of Reactions of Formation of Interpolymer Complexes. Appl. Mech. Mater. 2013, 467, 58–63. [Google Scholar] [CrossRef]
- Ermukhambetova, B.B.; Suleimenov, I.E.; Alikulov, A.Z.; Moldakhan, I.; Baipakbaeva, S.T.; Mun, G.A. On the Question of the Method for Determining the Critical PH Value during the Formation of Complexes between Nonionic Polymers and Polyacid in Aqueous Solutions. Polym. Sci. Ser. A 2021, 63, 8–14. [Google Scholar] [CrossRef]


| Composition of IMM, mol.% [NVP]:[MA] | Compositions of Copolymers, mol.% [NVP]:[MA] | [η], dL/g | MW′ (kDa) | MN′ (kDa) |
|---|---|---|---|---|
| 90:10 | 71.0:29.0 | 0.43 ± 0.5 | 60.6 ± 0.5 | 36.7 ± 0.5 |
| 80:20 | 60.0:40.0 | 0.47 ± 0.5 | 73.8 ± 0.5 | 45.8 ± 0.5 |
| 70:30 | 52.9:47.1 | 0.51 ± 0.5 | 89.7 ± 0.5 | 53.3 ± 0.5 |
| 60:40 | 51.0:49.0 | 0.41 ± 0.5 | 101.4 ± 0.5 | 57.4 ± 0.5 |
| 50:50 | 44.1:55.9 | 0.23 ± 0.5 | 132.1 ± 0.5 | 69.2 ± 0.5 |
| CNVP | |||
|---|---|---|---|
| 39.9 ± 0.2 | 0.008 ± 0.005 | 2.01 ± 0.05 | 3.5 ± 0.2 |
| 44.1 ± 0.2 | 0.010 ± 0.005 | 1.65 ± 0.05 | 2.9 ± 0.2 |
| 51 ± 0.2 | 0.025 ± 0.005 | 0.22 ± 0.05 | 2.4 ± 0.2 |
| 52.9 ± 0.2 | 0.044 ± 0.005 | −1.19 ± 0.05 | 2.0 ± 0.2 |
| Cpol, mol.% | ||||
|---|---|---|---|---|
| 0.1 | −0.08 ± 0.3 | 0.031 ± 0.005 | 44.0 ± 0.5 | 2.2 ± 0.2 |
| 0.5 | 0.77 ± 0.3 | 0.036 ± 0.005 | 42.0 ± 0.5 | 1.7 ± 0.2 |
| 1 | 0.80 ± 0.3 | 0.026 ± 0.005 | 39.0 ± 0.5 | 1.3 ± 0.2 |
| CNaCl | 0 | 0.005 | 0.01 | 0.1 |
| 2.37 ± 0.3 | 2.76 ± 0.3 | 3.07 ± 0.3 | 3.63 ± 0.3 |
Disclaimer/Publisher’s Note: The statements, opinions and data contained in all publications are solely those of the individual author(s) and contributor(s) and not of MDPI and/or the editor(s). MDPI and/or the editor(s) disclaim responsibility for any injury to people or property resulting from any ideas, methods, instructions or products referred to in the content. |
© 2024 by the authors. Licensee MDPI, Basel, Switzerland. This article is an open access article distributed under the terms and conditions of the Creative Commons Attribution (CC BY) license (https://creativecommons.org/licenses/by/4.0/).
Share and Cite
Shaikhutdinov, R.; Mun, G.; Kopishev, E.; Bakirov, A.; Kabdushev, S.; Baipakbaeva, S.; Suleimenov, I. Effect of the Formation of Hydrophilic and Hydrophobic–Hydrophilic Associates on the Behavior of Copolymers of N-Vinylpyrrolidone with Methyl Acrylate in Aqueous Solutions. Polymers 2024, 16, 584. https://doi.org/10.3390/polym16050584
Shaikhutdinov R, Mun G, Kopishev E, Bakirov A, Kabdushev S, Baipakbaeva S, Suleimenov I. Effect of the Formation of Hydrophilic and Hydrophobic–Hydrophilic Associates on the Behavior of Copolymers of N-Vinylpyrrolidone with Methyl Acrylate in Aqueous Solutions. Polymers. 2024; 16(5):584. https://doi.org/10.3390/polym16050584
Chicago/Turabian StyleShaikhutdinov, Ramazan, Grigoriy Mun, Eldar Kopishev, Akhat Bakirov, Sherniyaz Kabdushev, Saltanat Baipakbaeva, and Ibragim Suleimenov. 2024. "Effect of the Formation of Hydrophilic and Hydrophobic–Hydrophilic Associates on the Behavior of Copolymers of N-Vinylpyrrolidone with Methyl Acrylate in Aqueous Solutions" Polymers 16, no. 5: 584. https://doi.org/10.3390/polym16050584
APA StyleShaikhutdinov, R., Mun, G., Kopishev, E., Bakirov, A., Kabdushev, S., Baipakbaeva, S., & Suleimenov, I. (2024). Effect of the Formation of Hydrophilic and Hydrophobic–Hydrophilic Associates on the Behavior of Copolymers of N-Vinylpyrrolidone with Methyl Acrylate in Aqueous Solutions. Polymers, 16(5), 584. https://doi.org/10.3390/polym16050584