
The Effect of Coupling Agents and Graphene on the Mechanical Properties of Film-Based Post-Consumer Recycled Plastic


Abstract
1. Introduction
2. Materials and Methods
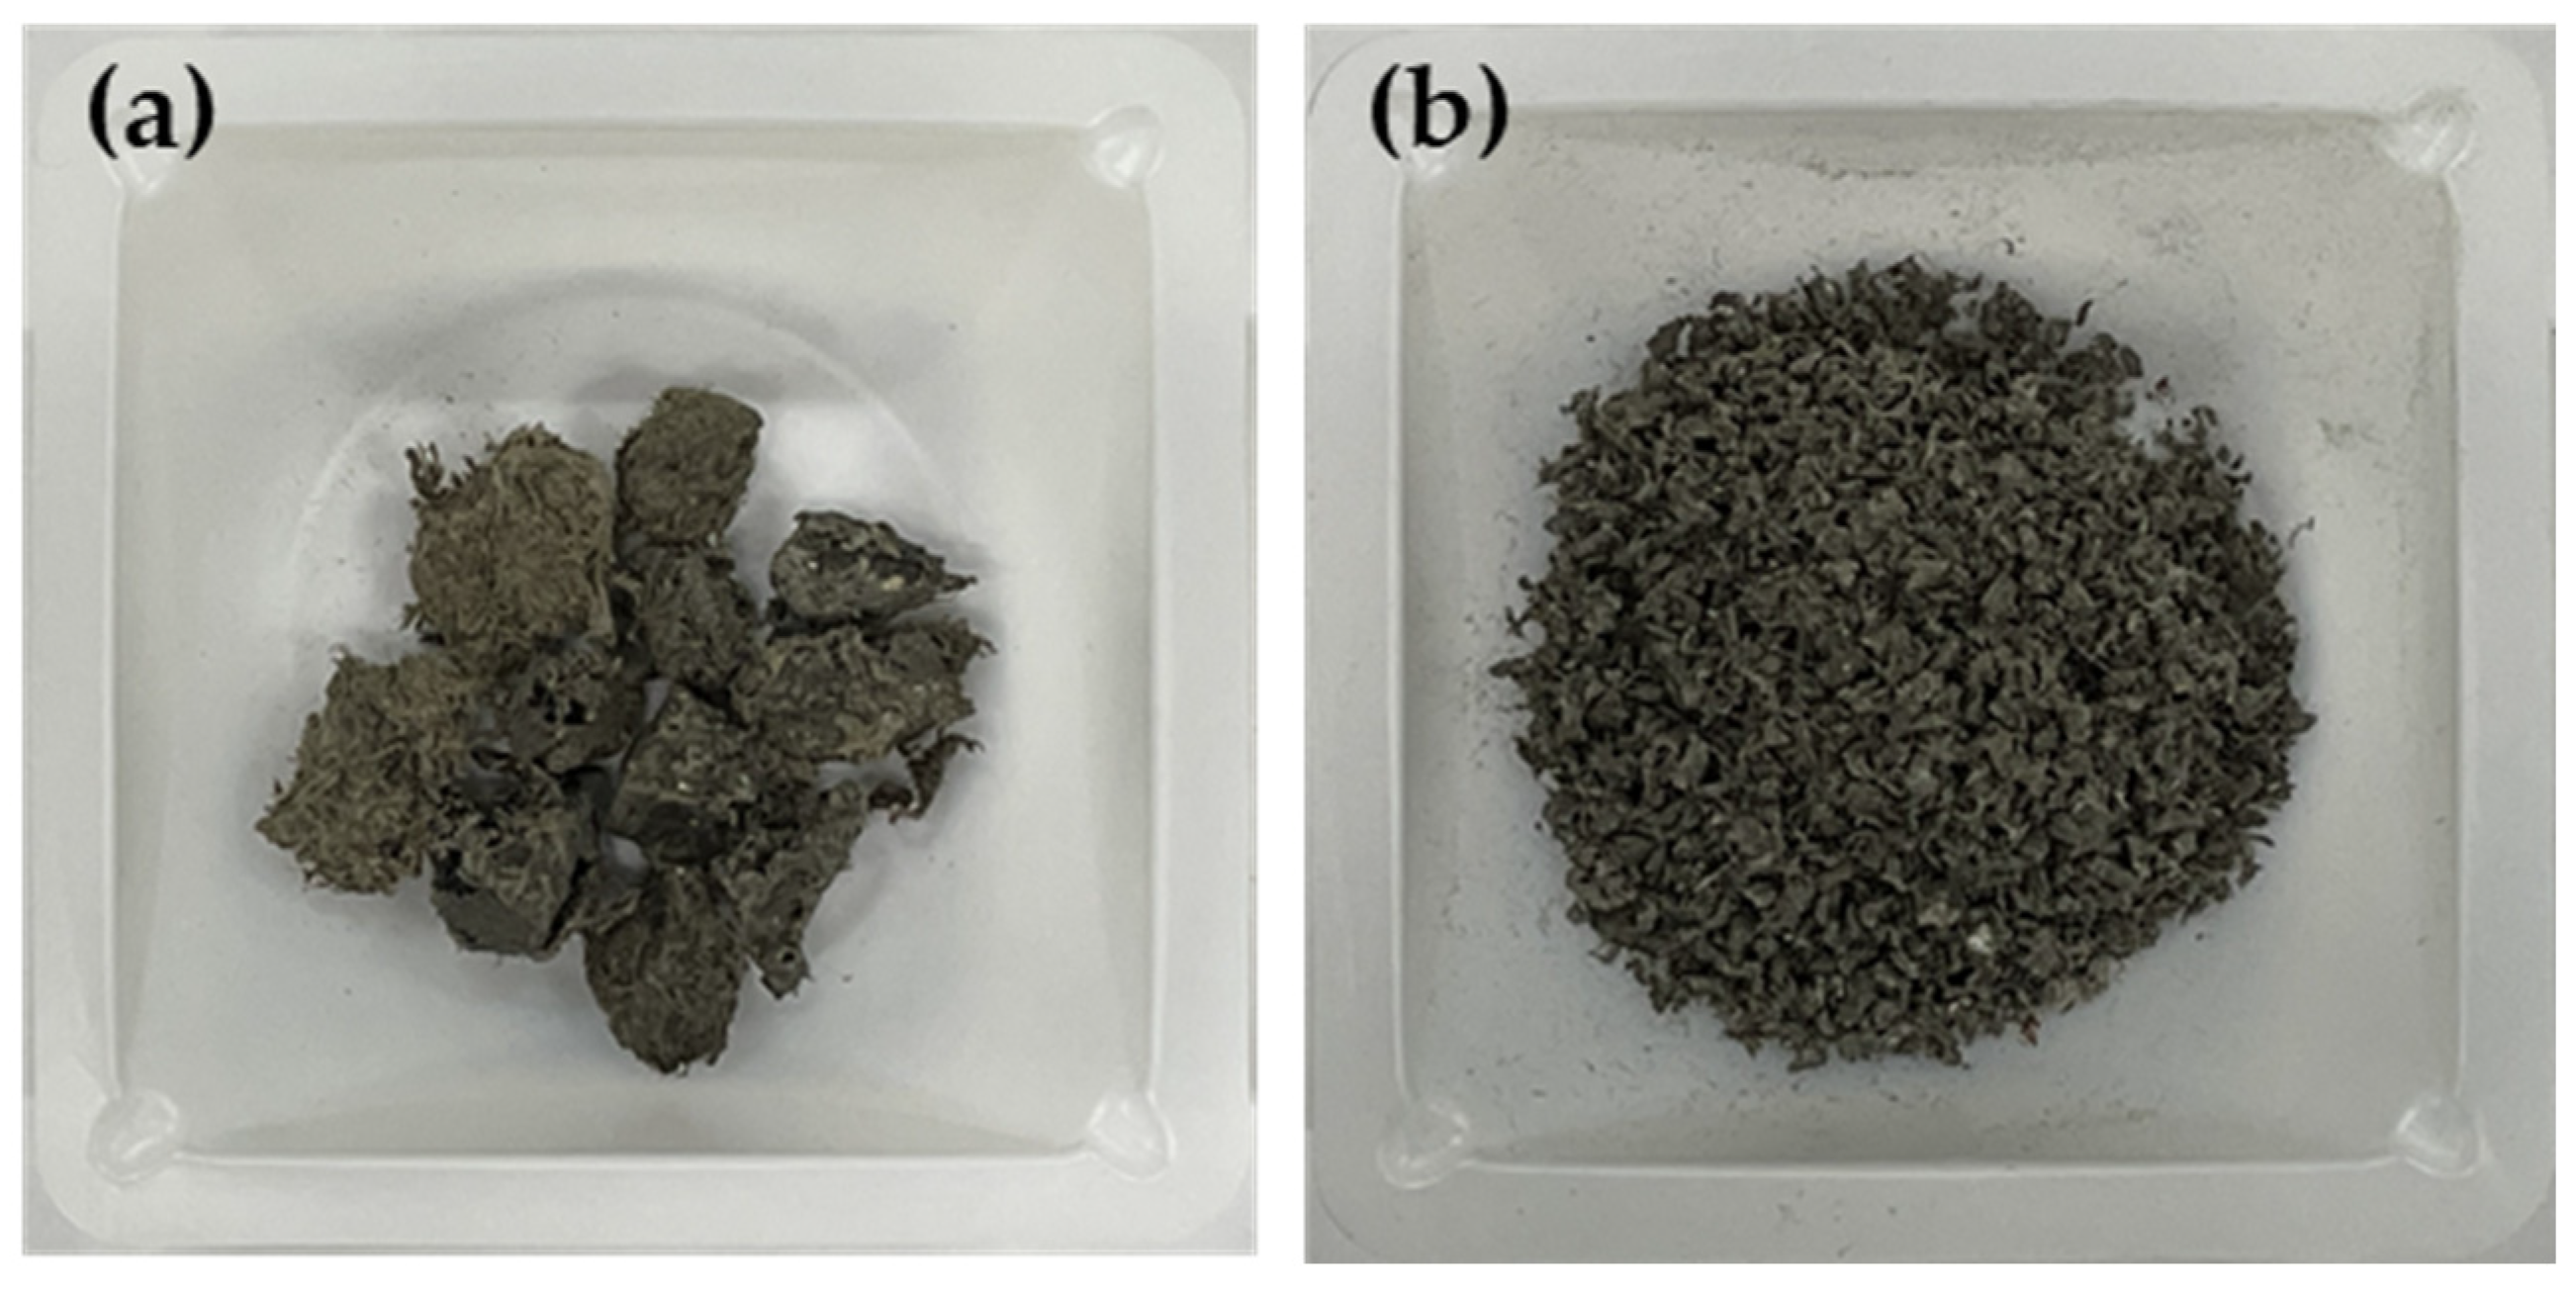
2.1. Materials
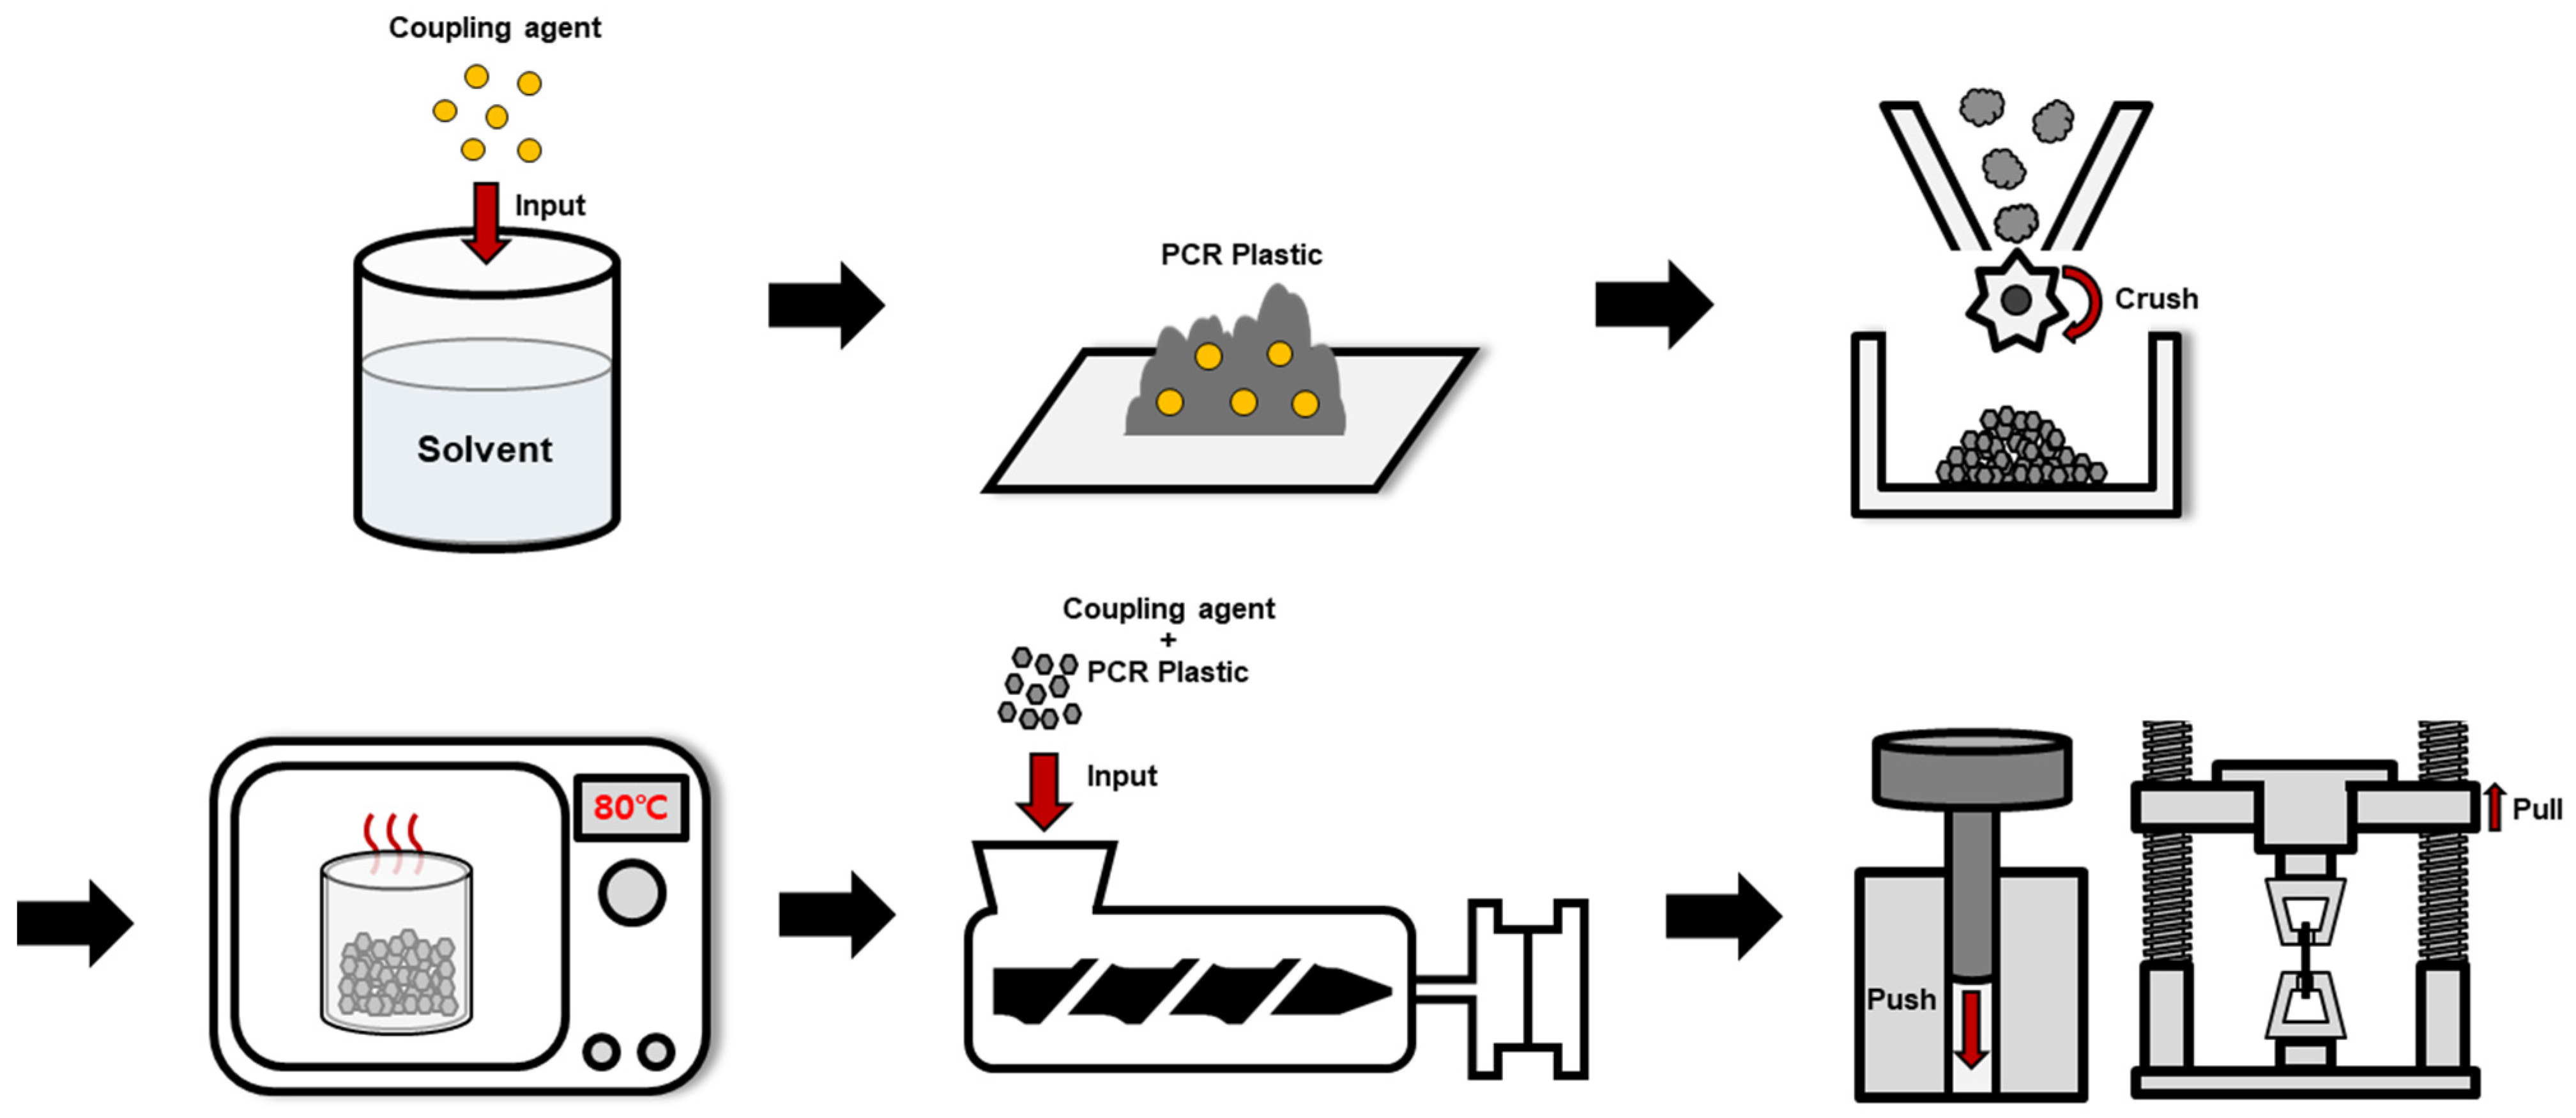
2.2. Methods
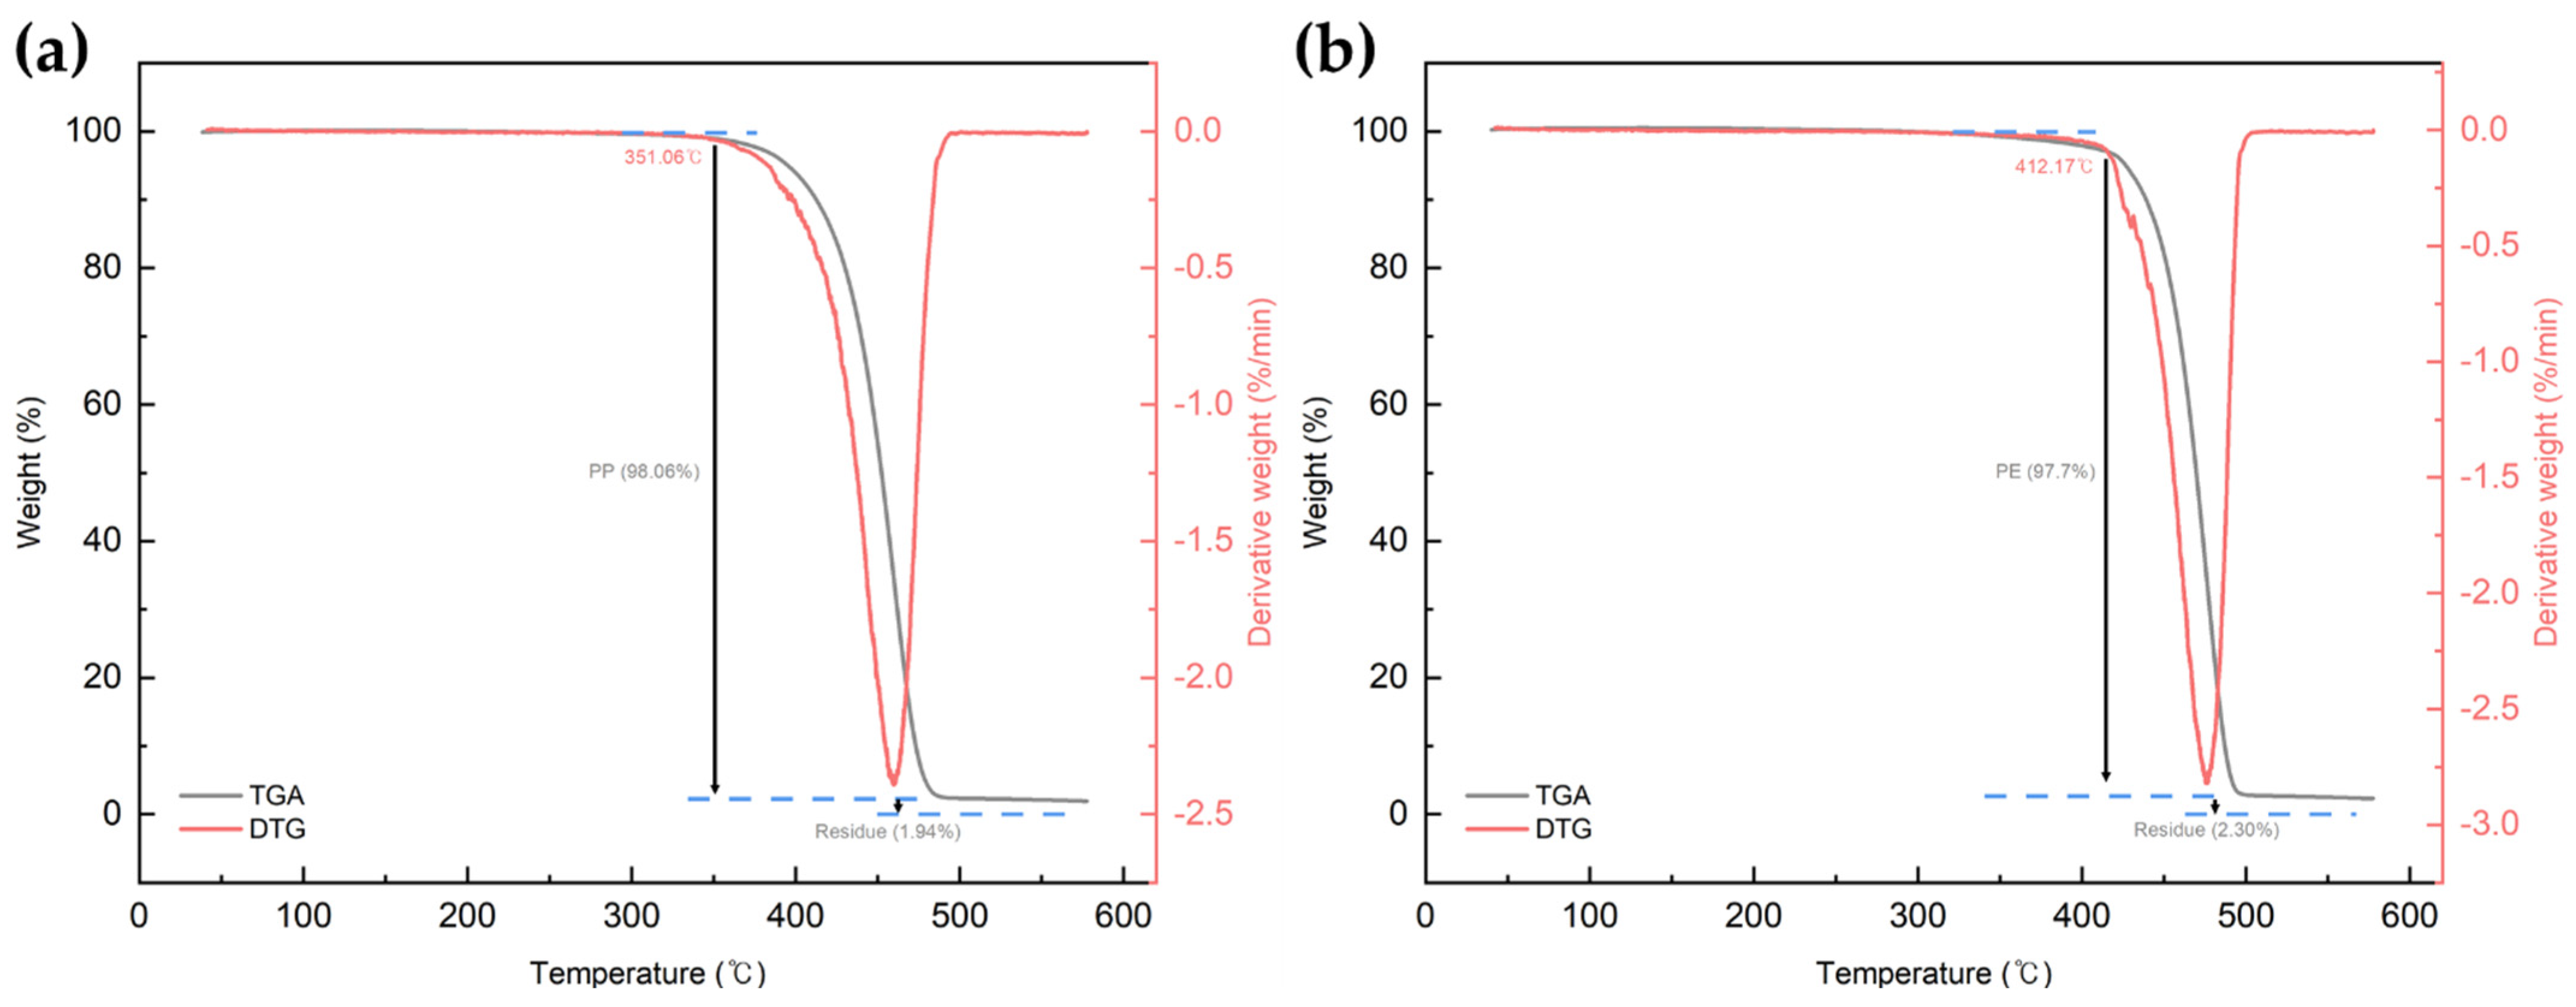
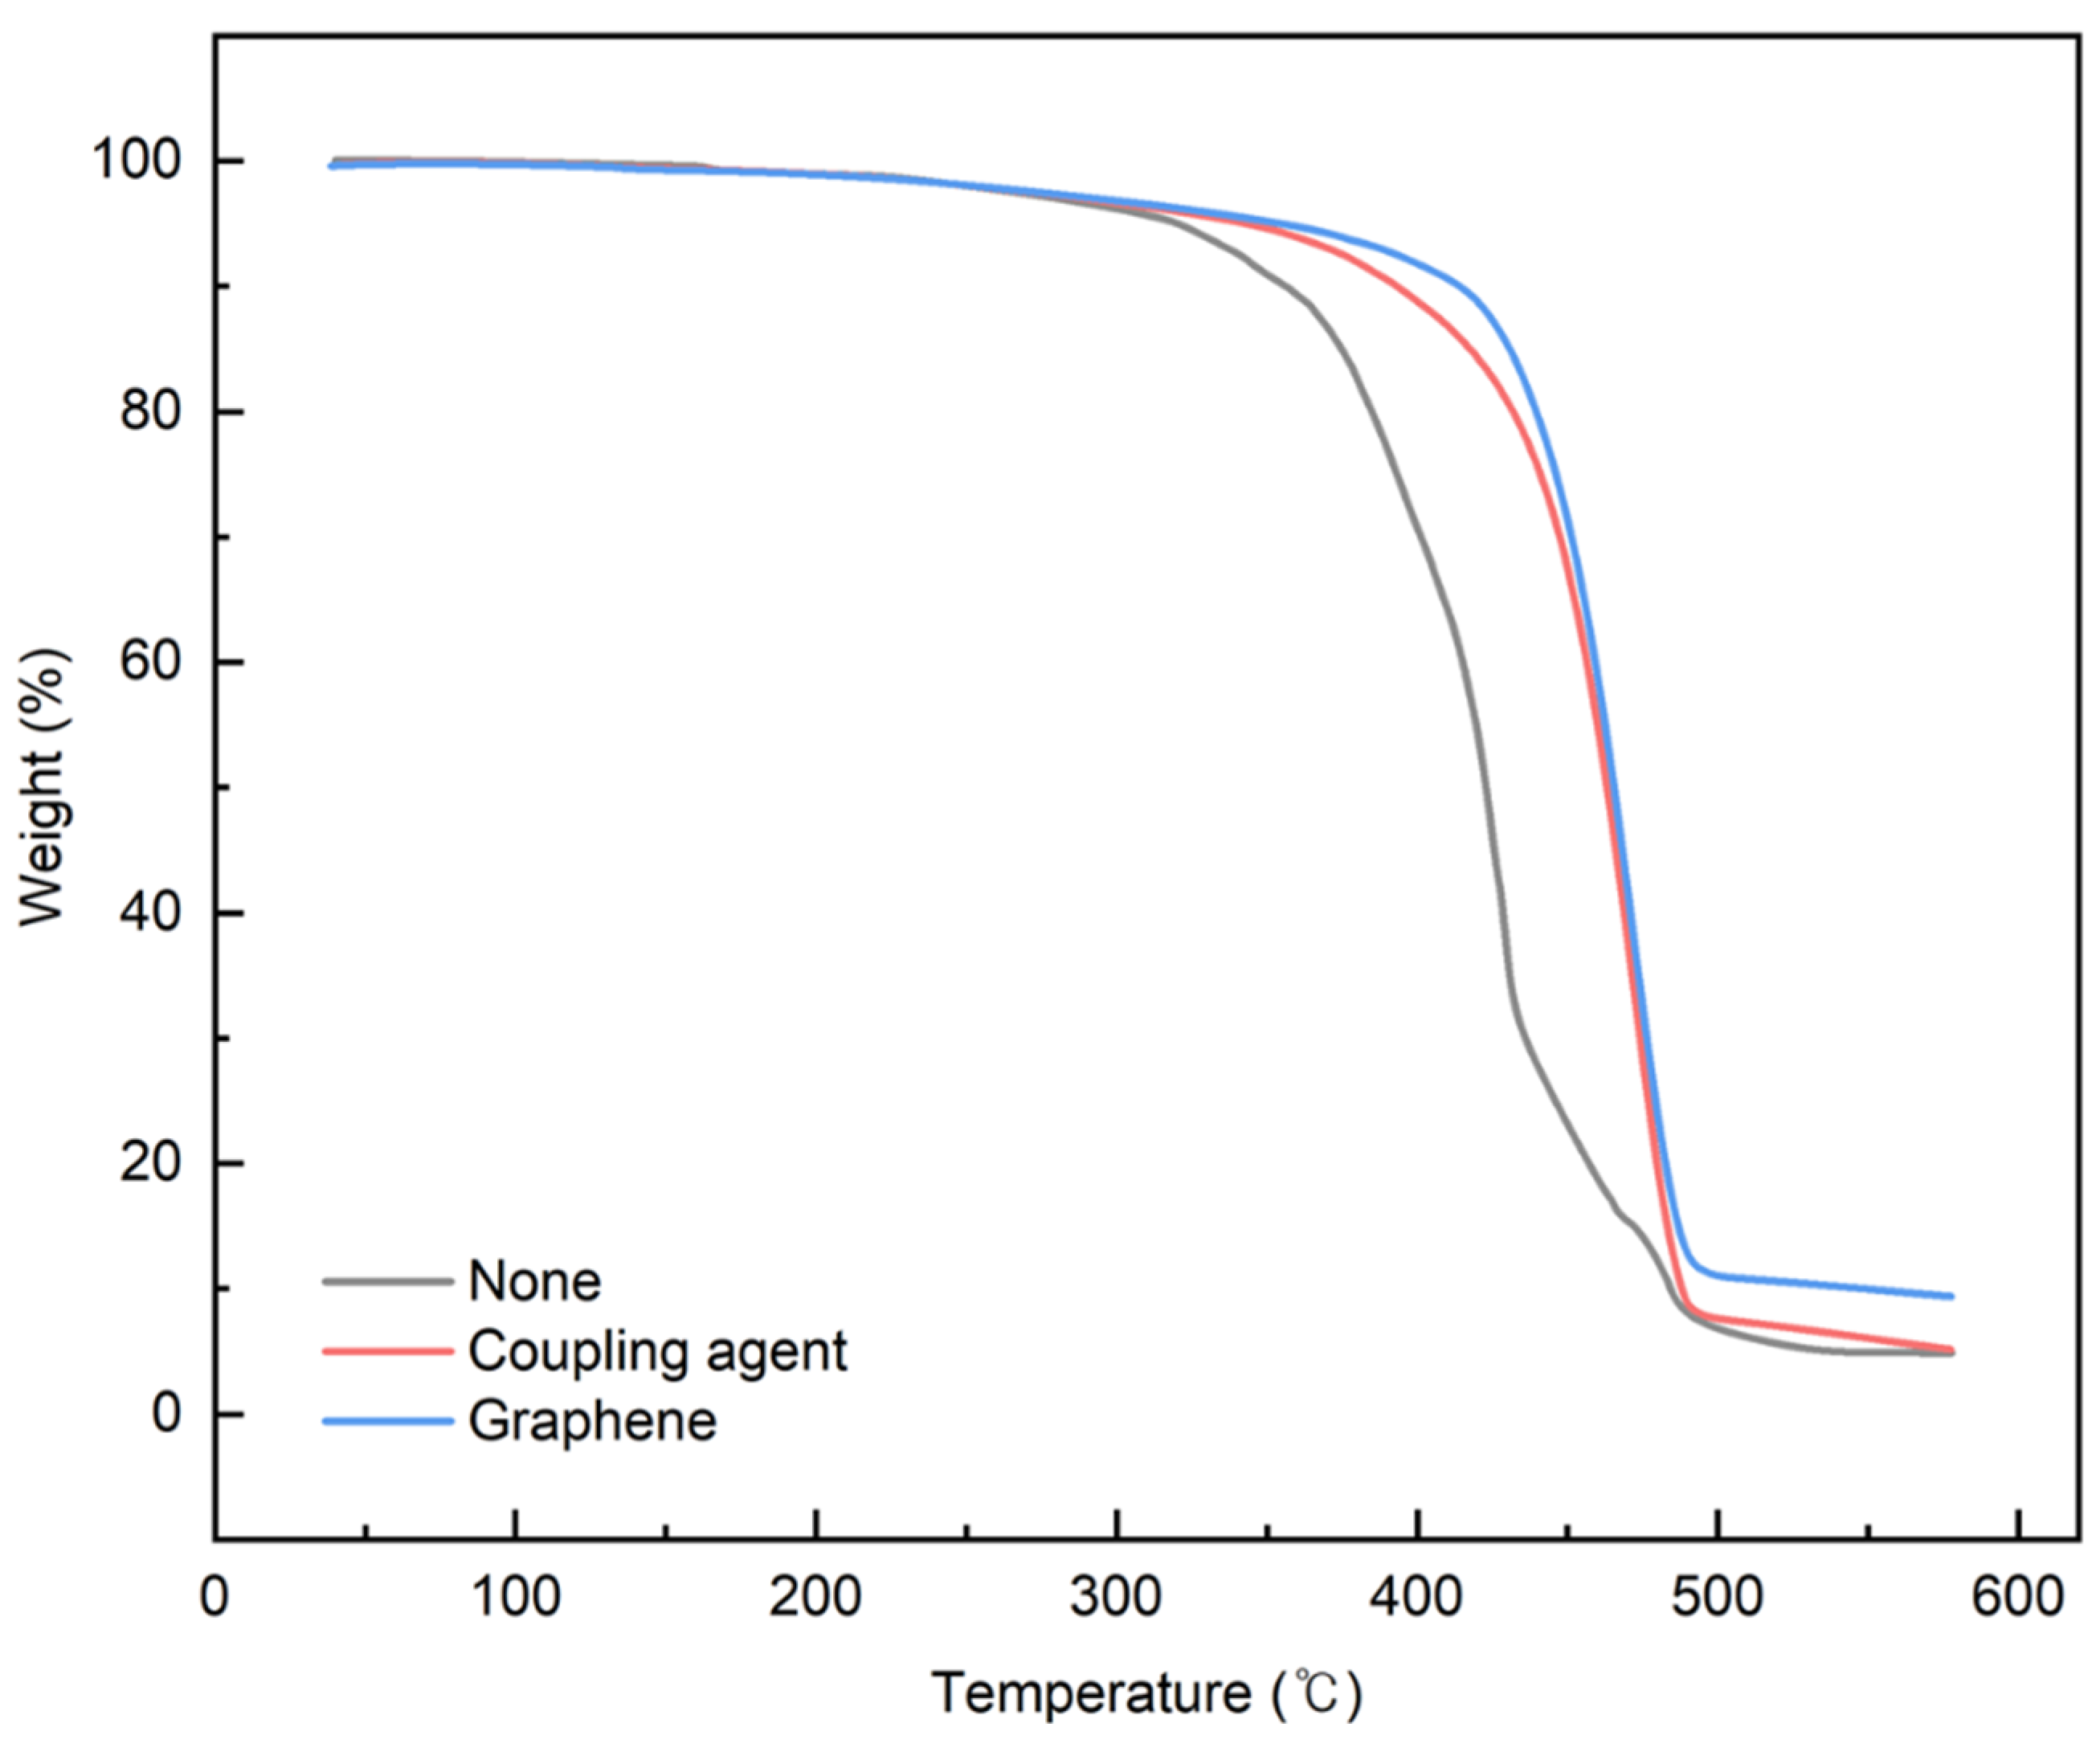
2.2.1. Thermogravimetry Analysis (TGA)
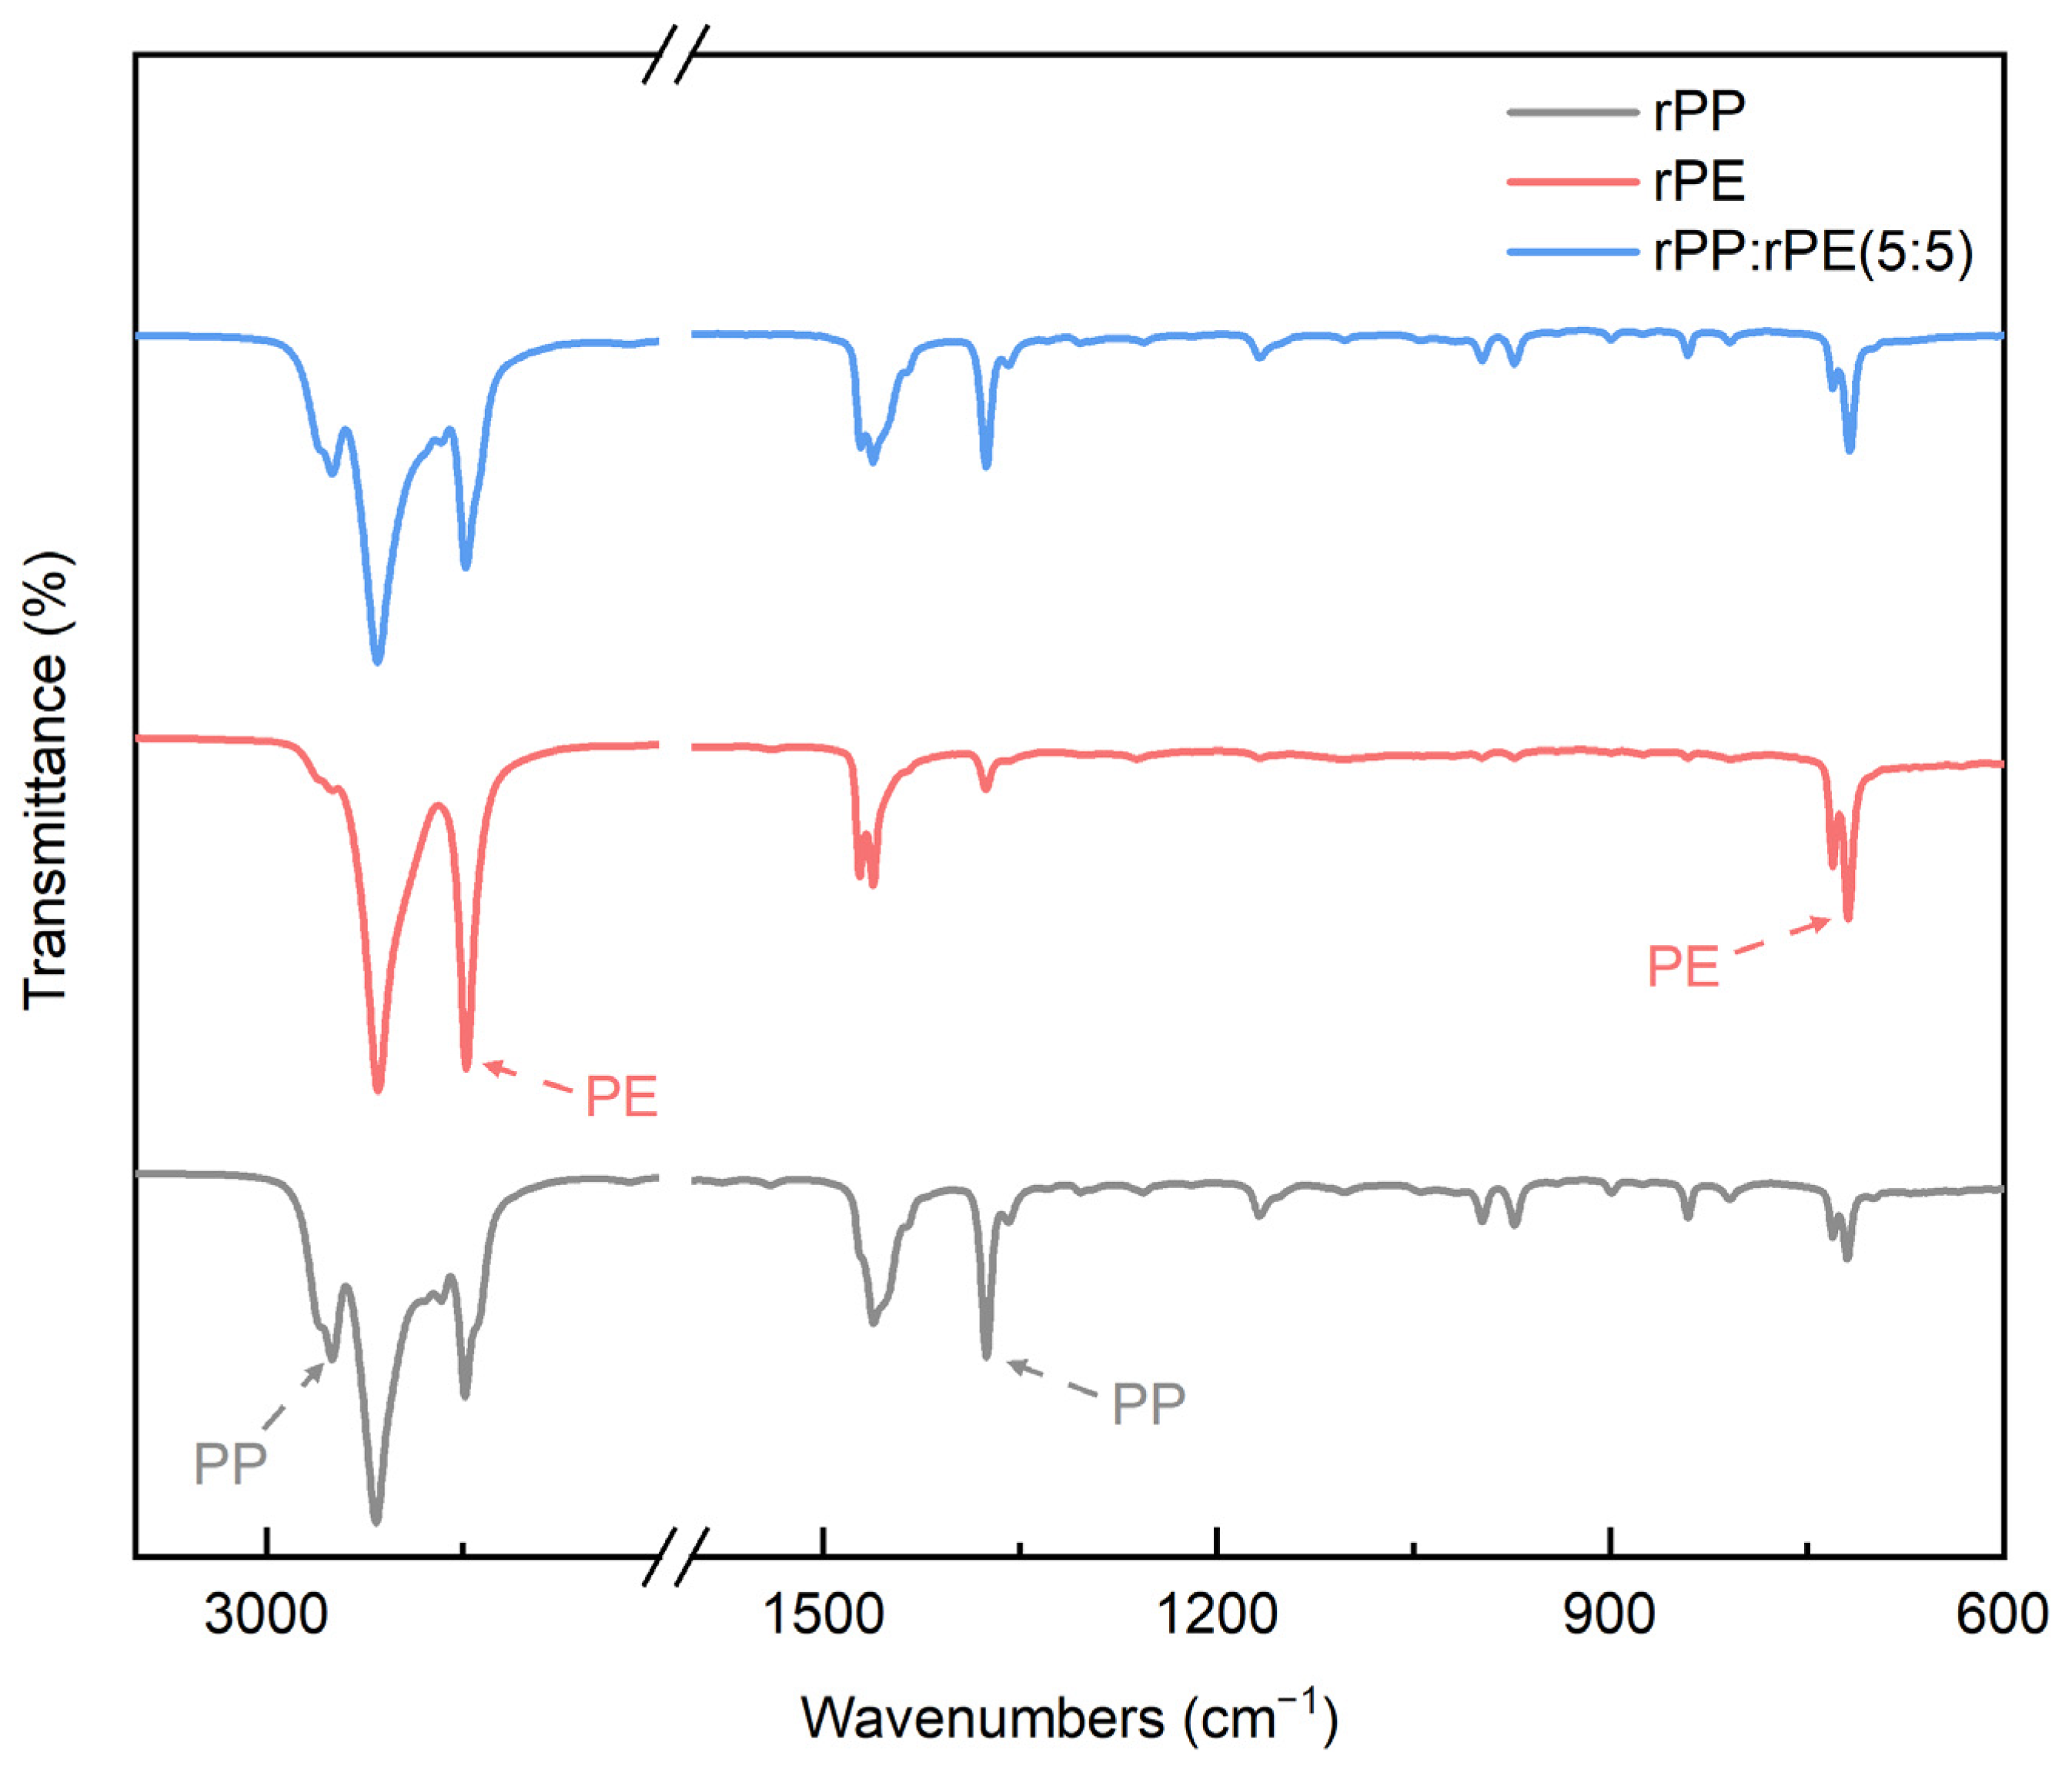
2.2.2. Fourier Transform Infrared Spectroscopy (FT-IR)
2.2.3. Melt Flow Index (MFI)
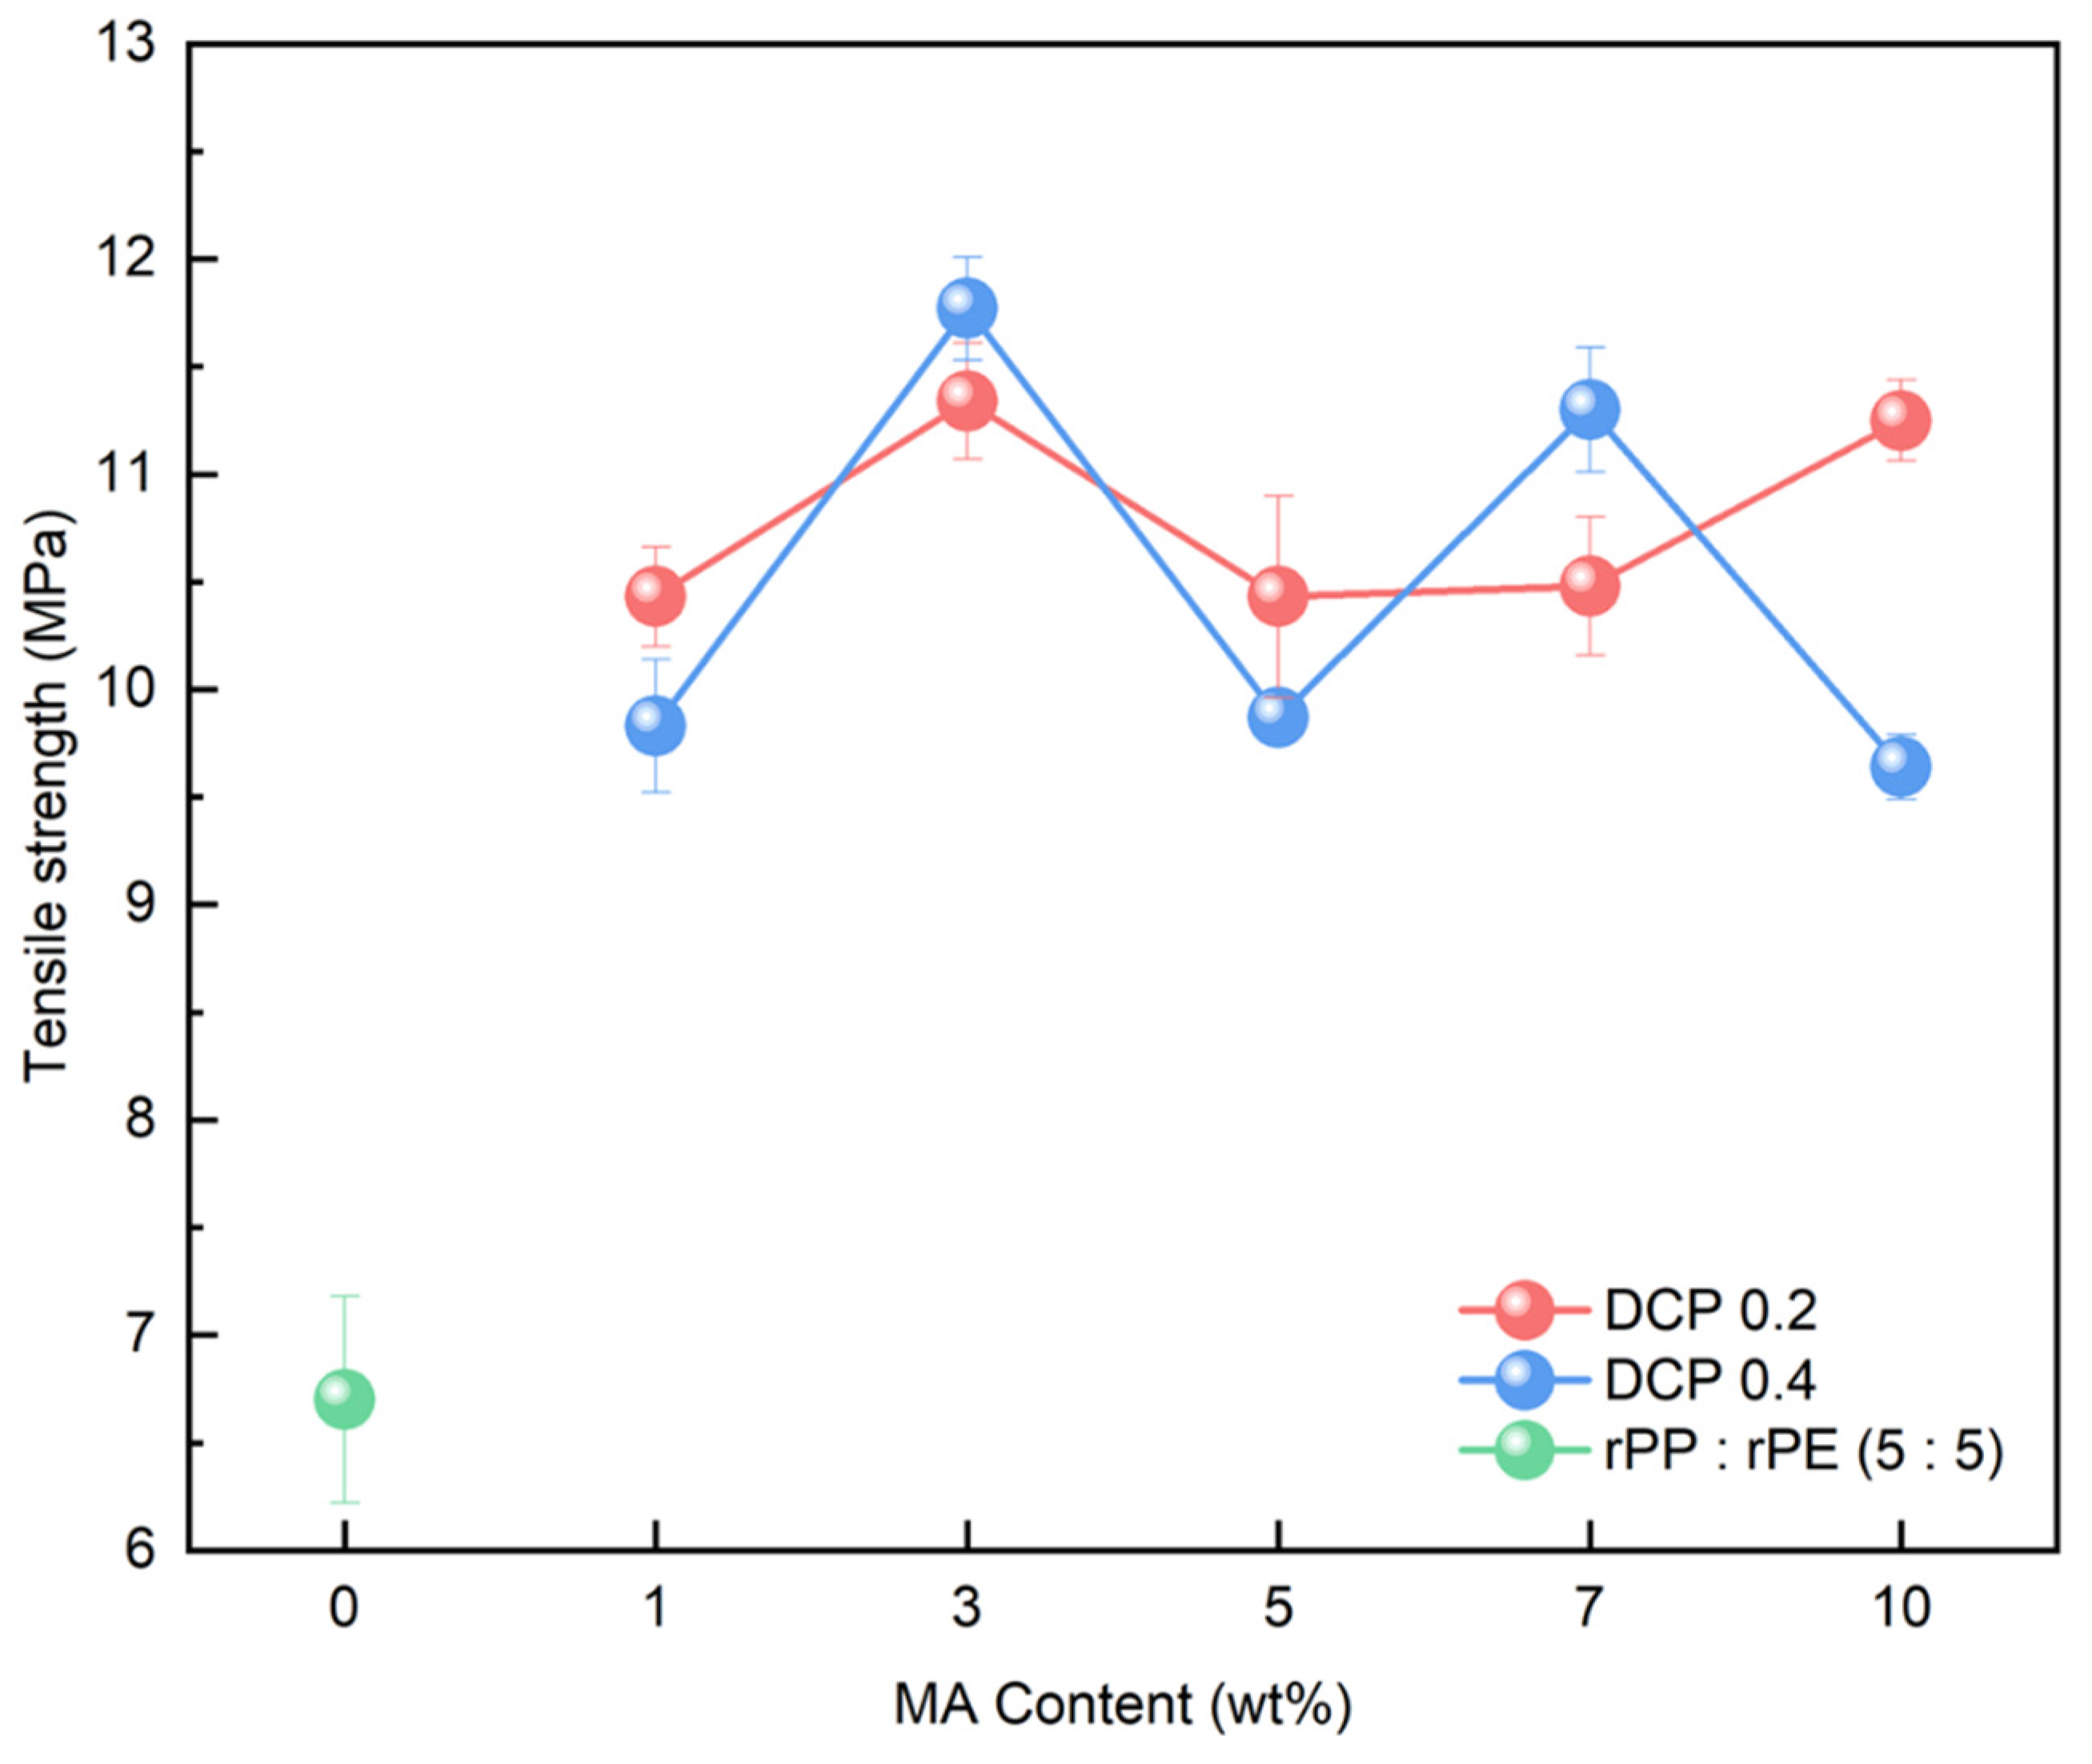
2.2.4. Tensile Strength
3. Results and Discussion
3.1. Characterization of PCR Plastics
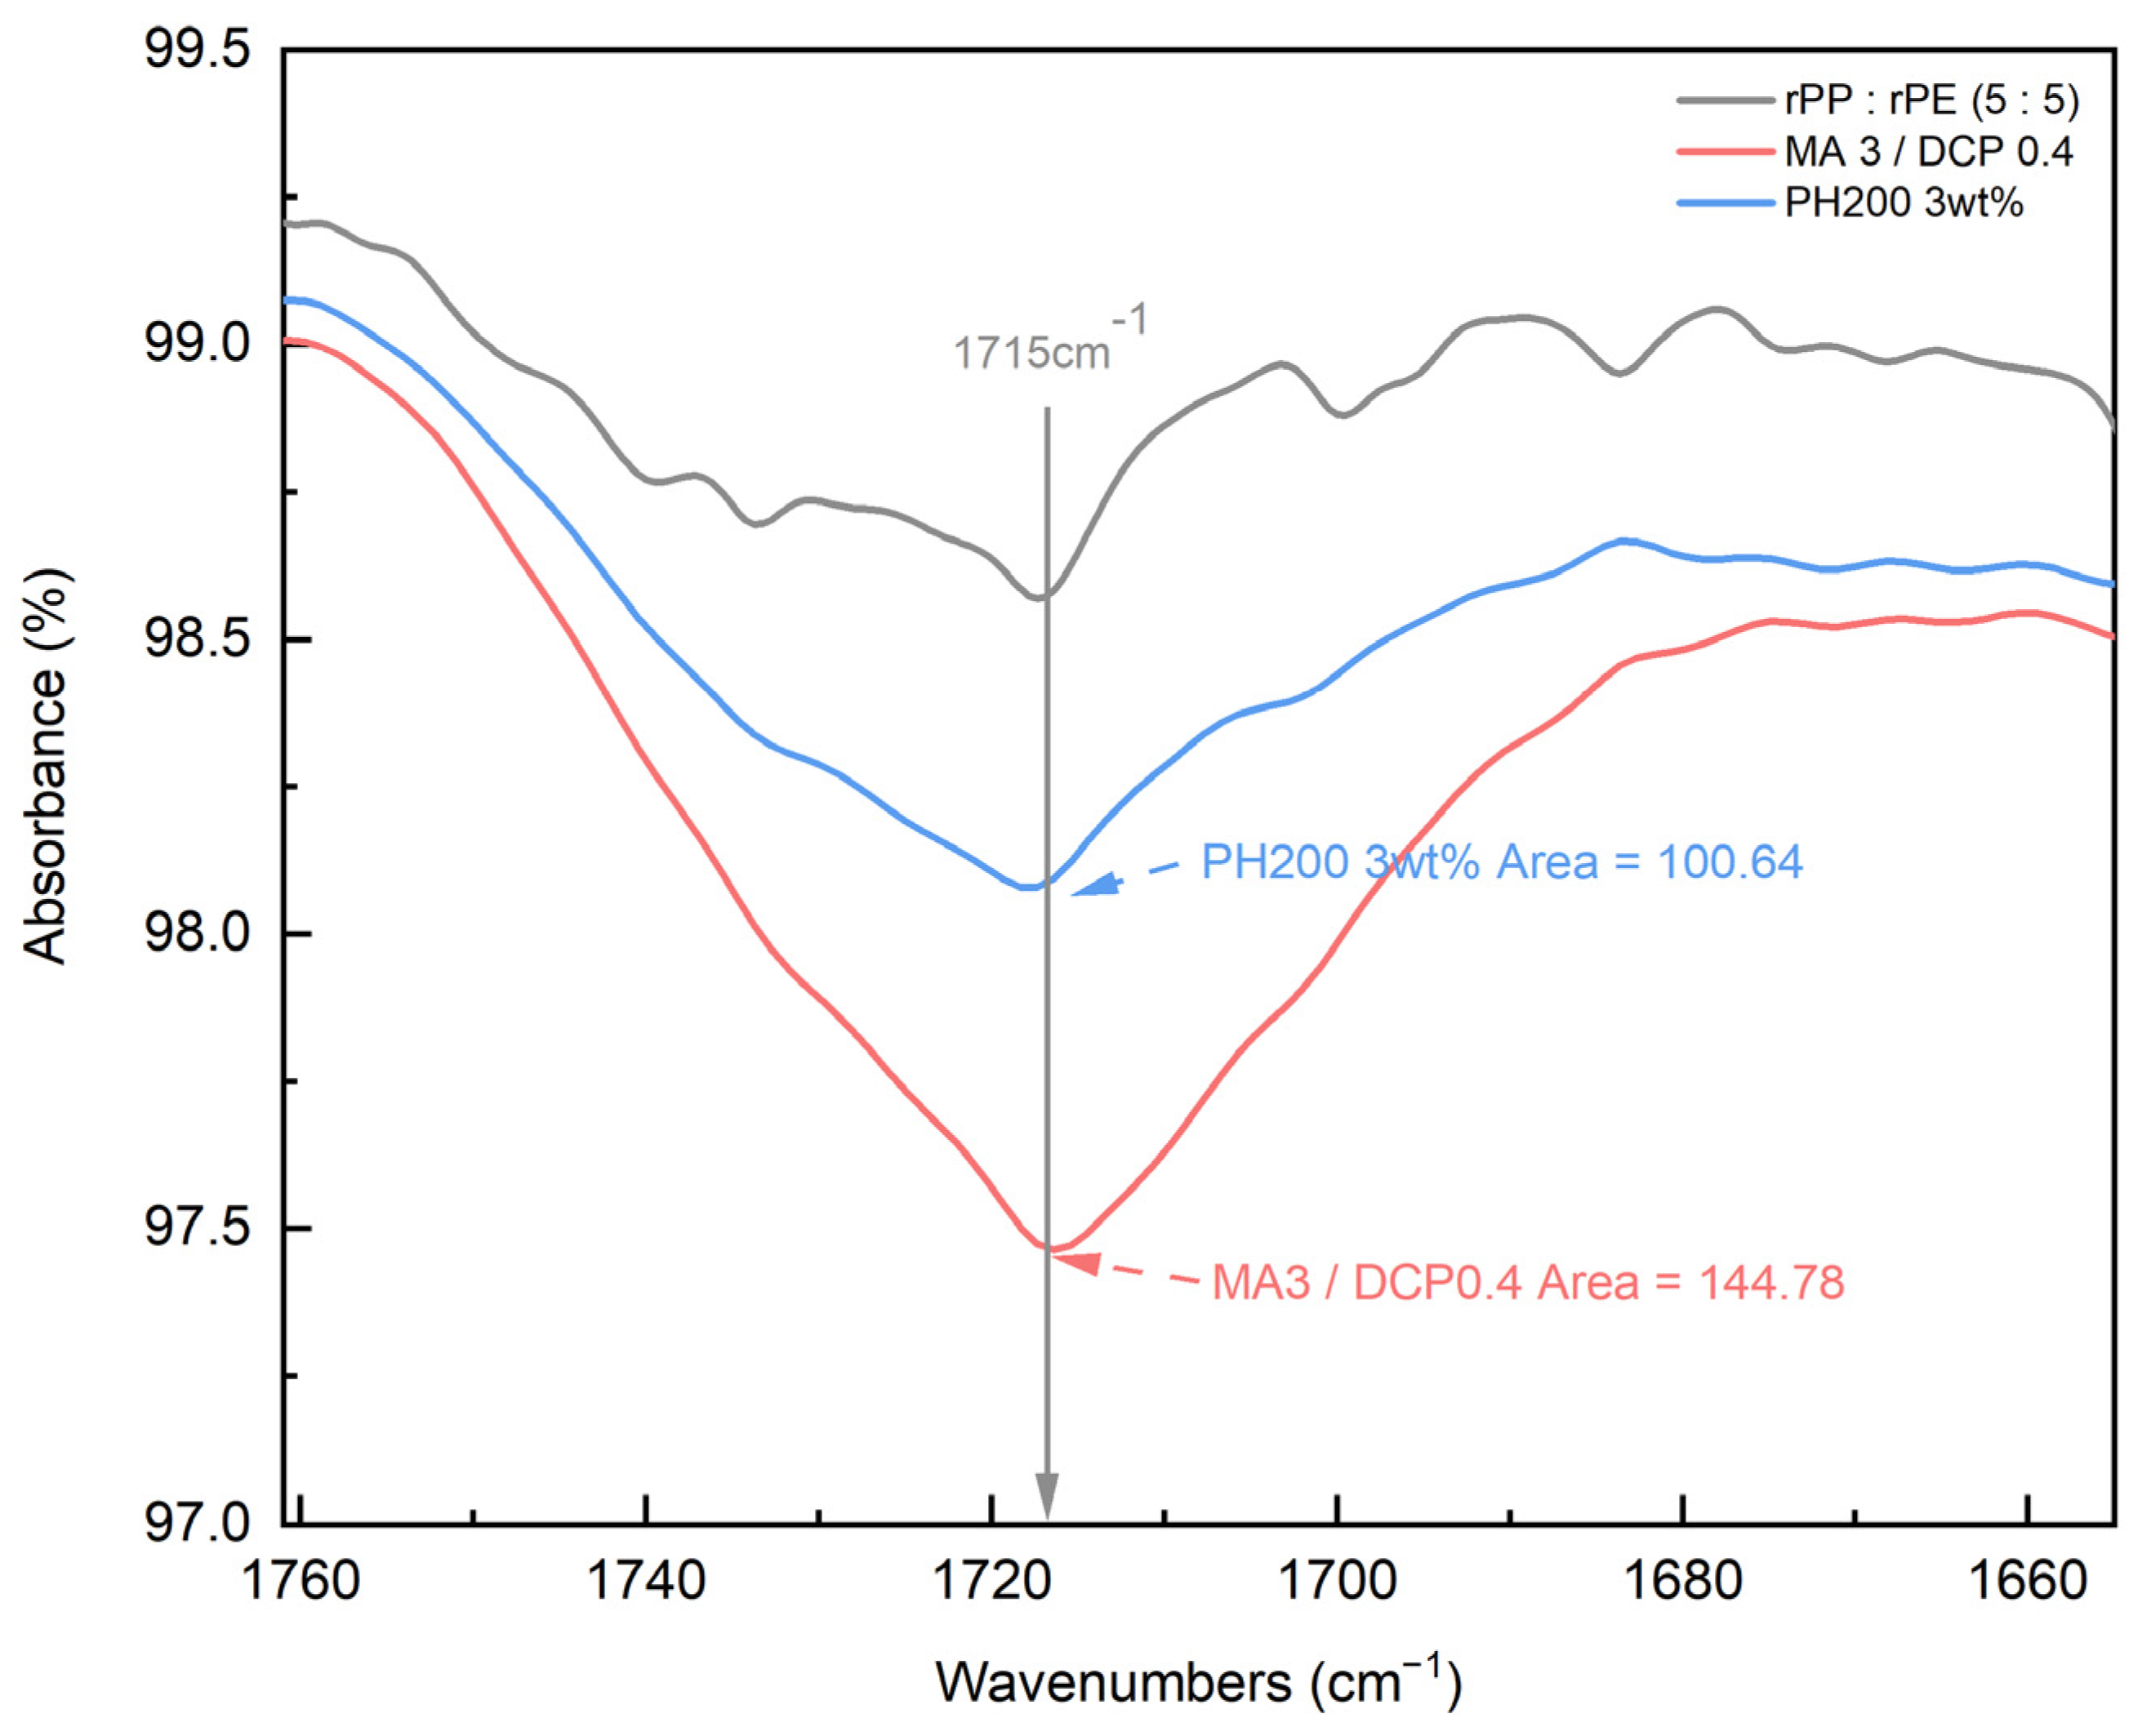
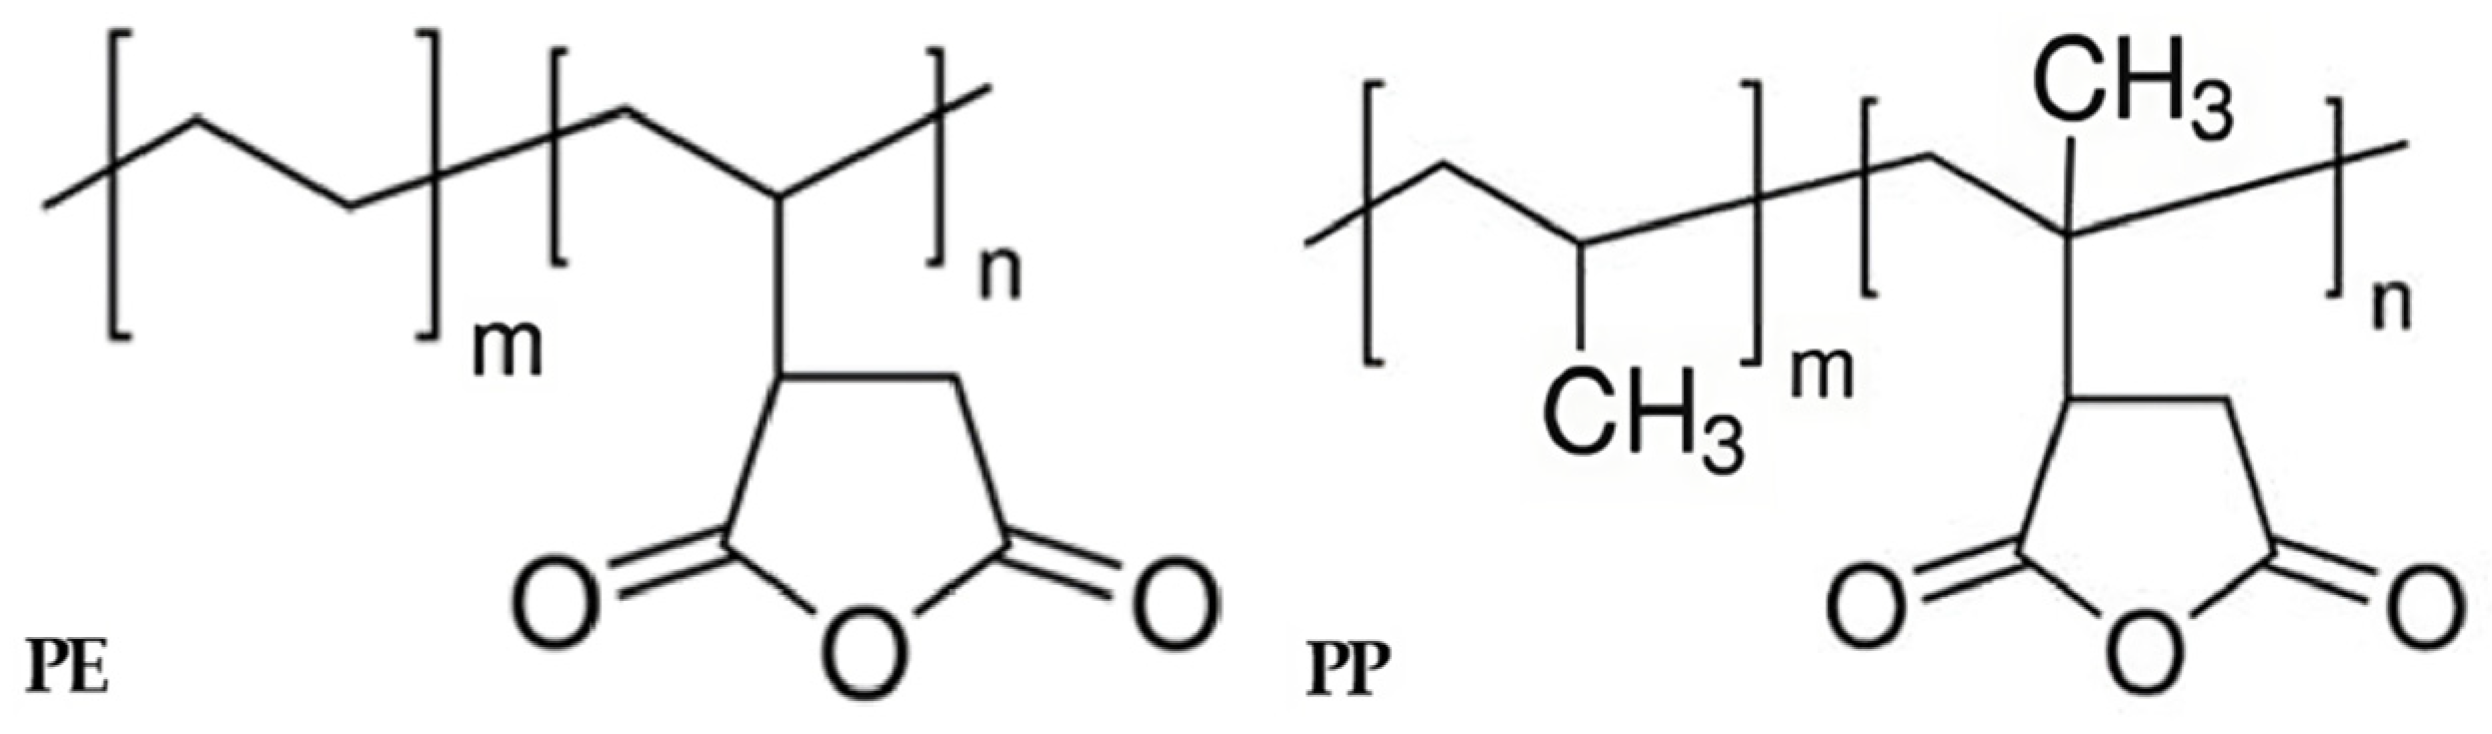
3.2. Optimization of Coupling Agents
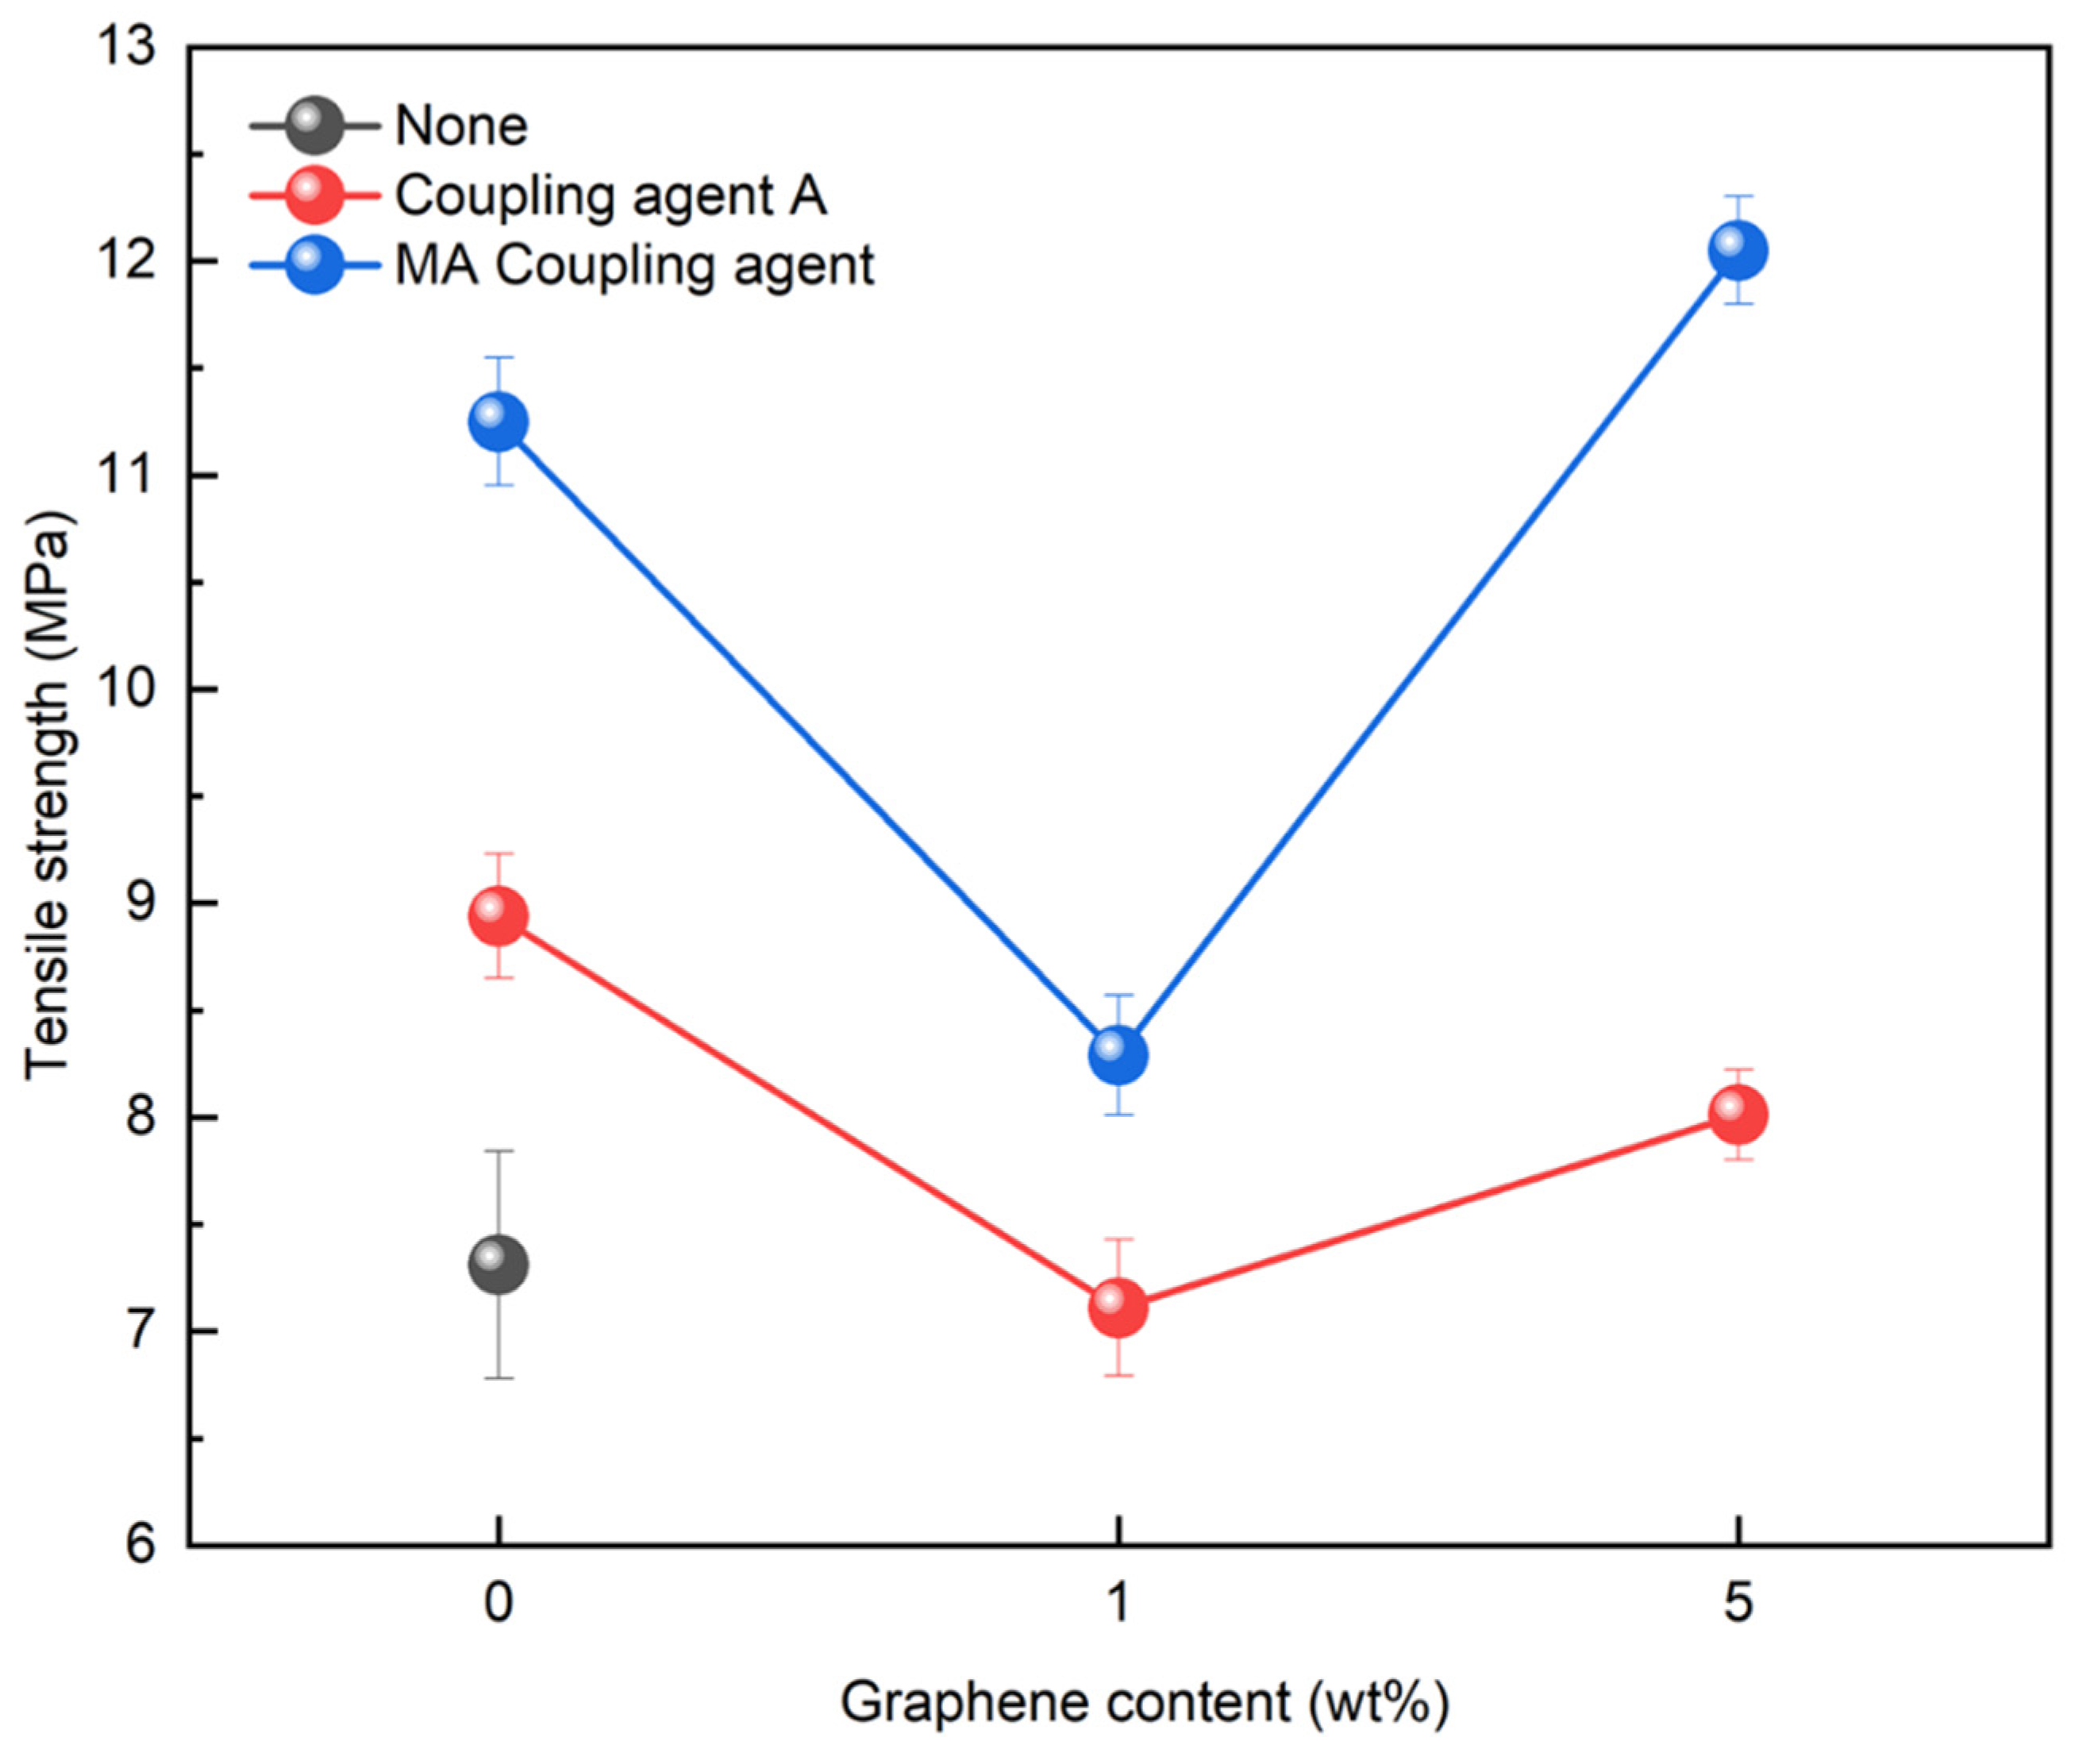
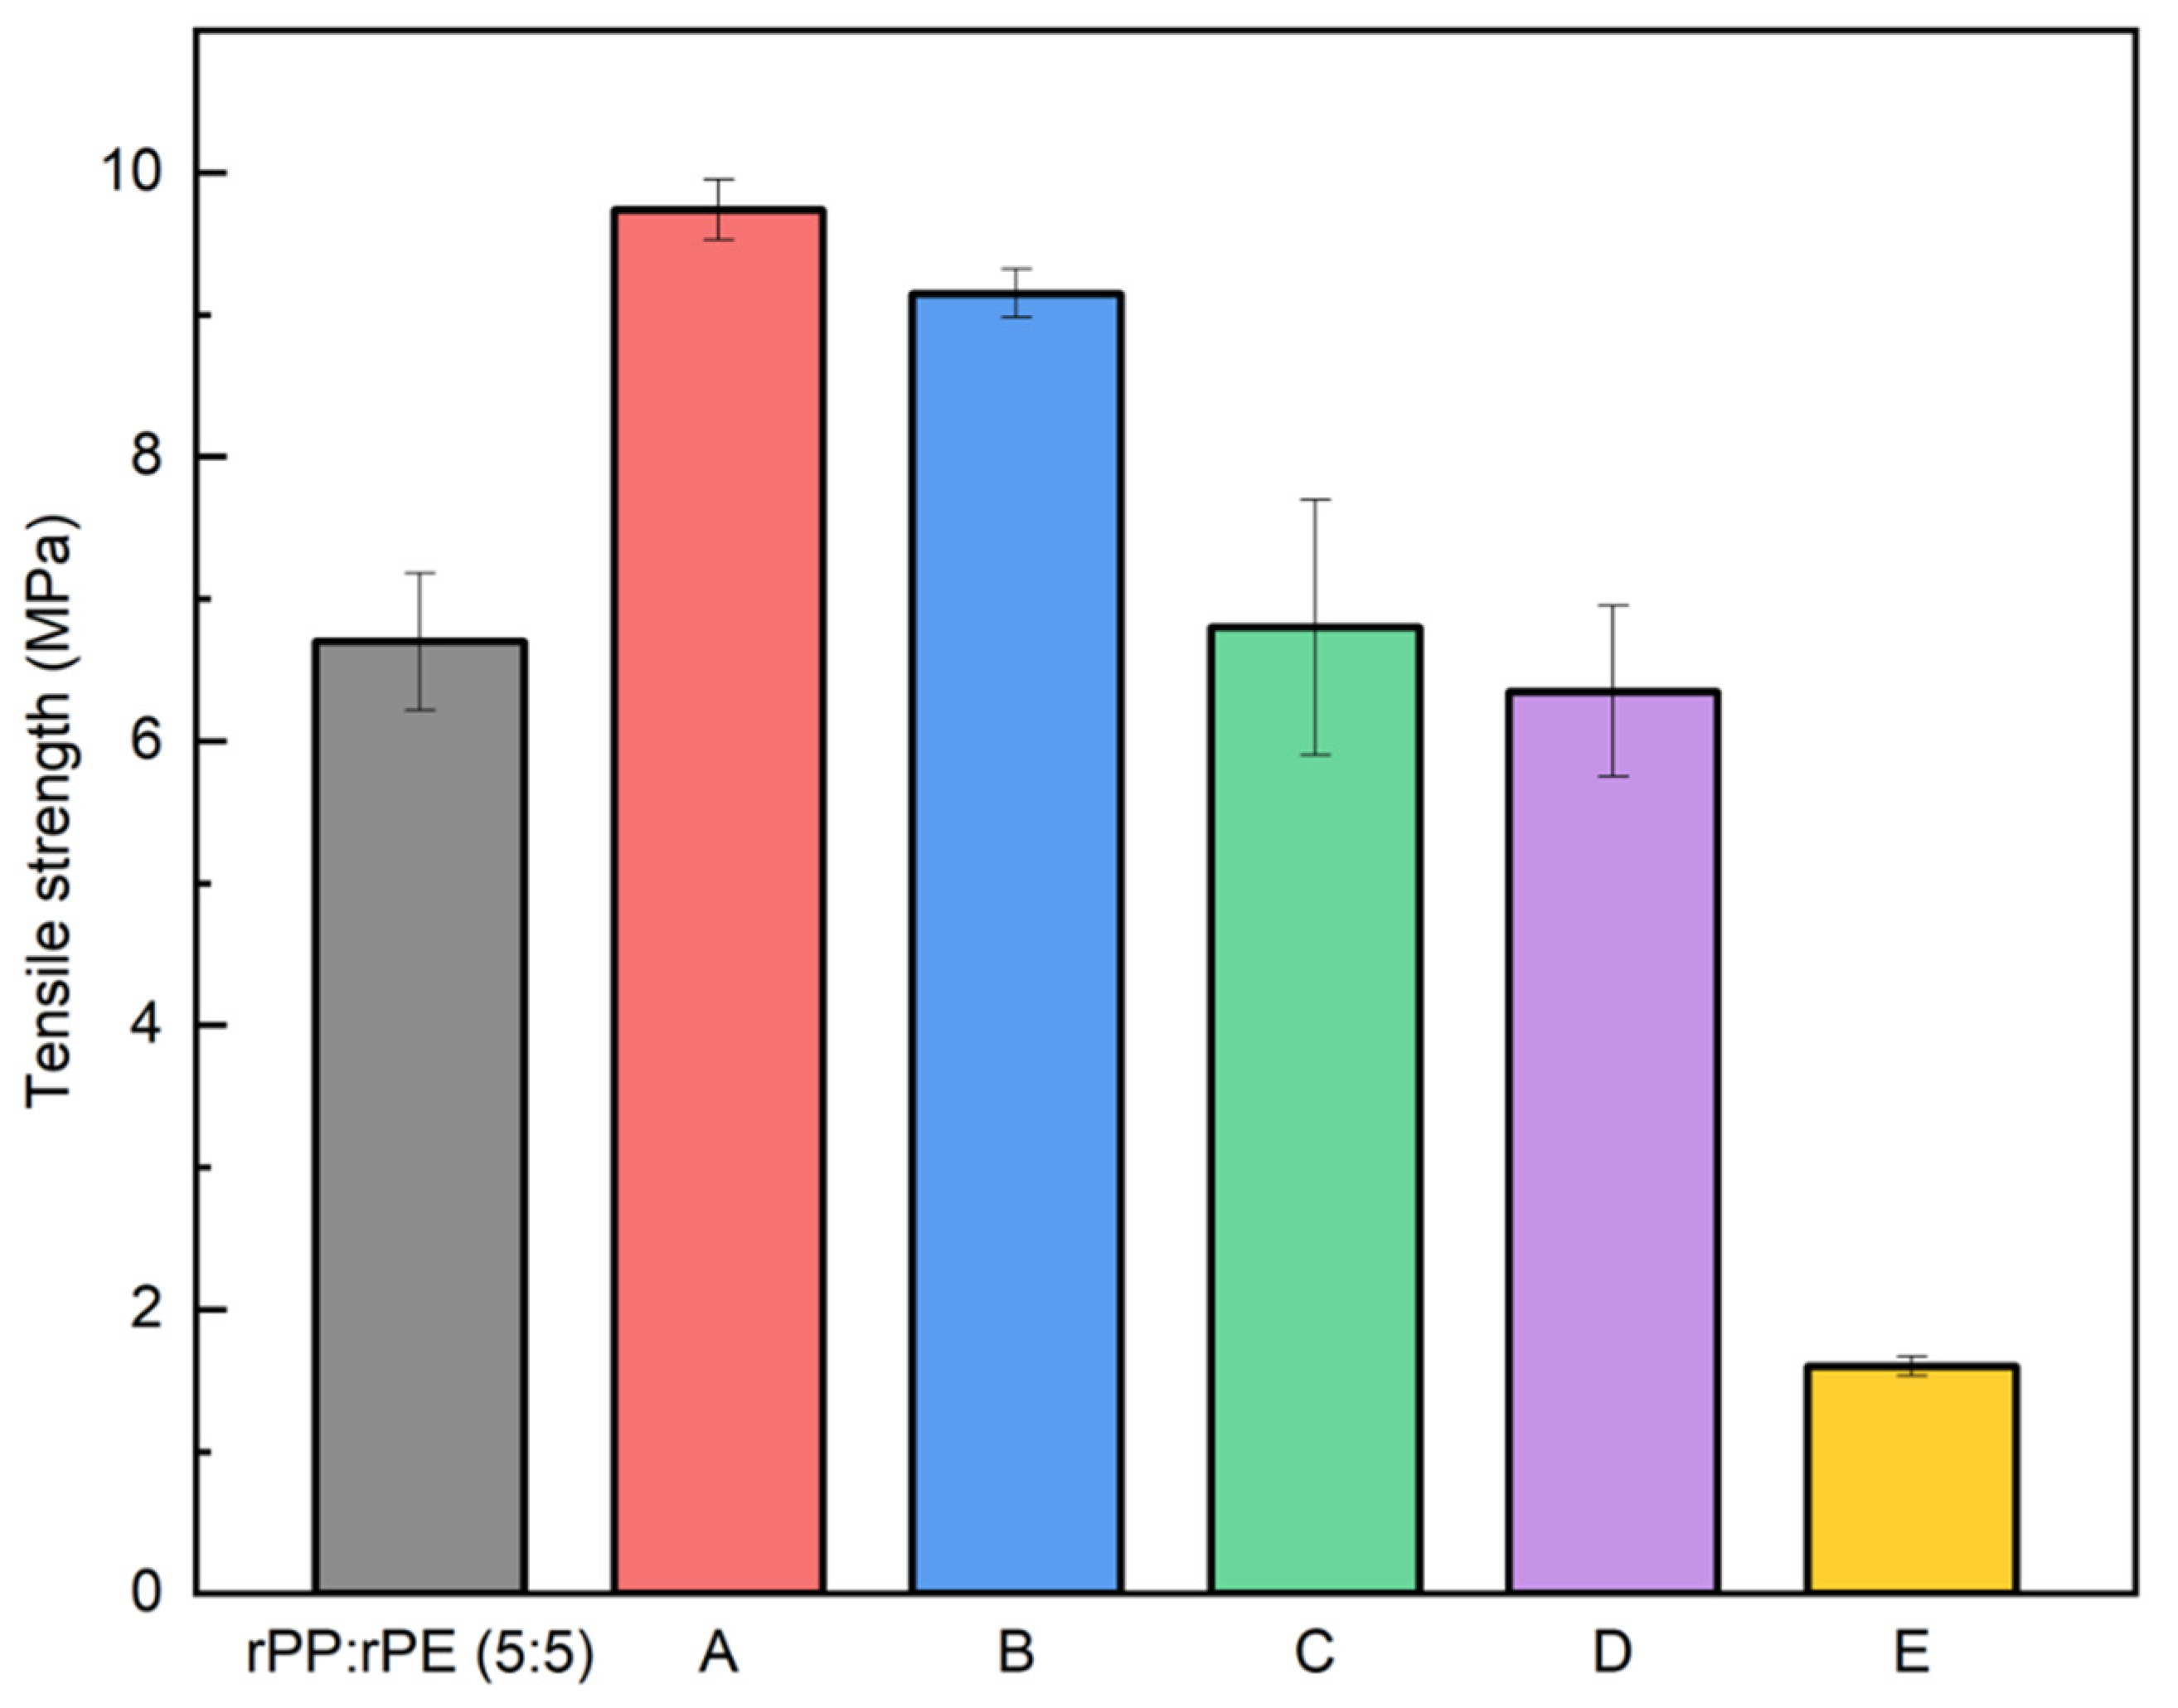
3.3. Application of Coupling Agents to PCR Plastics
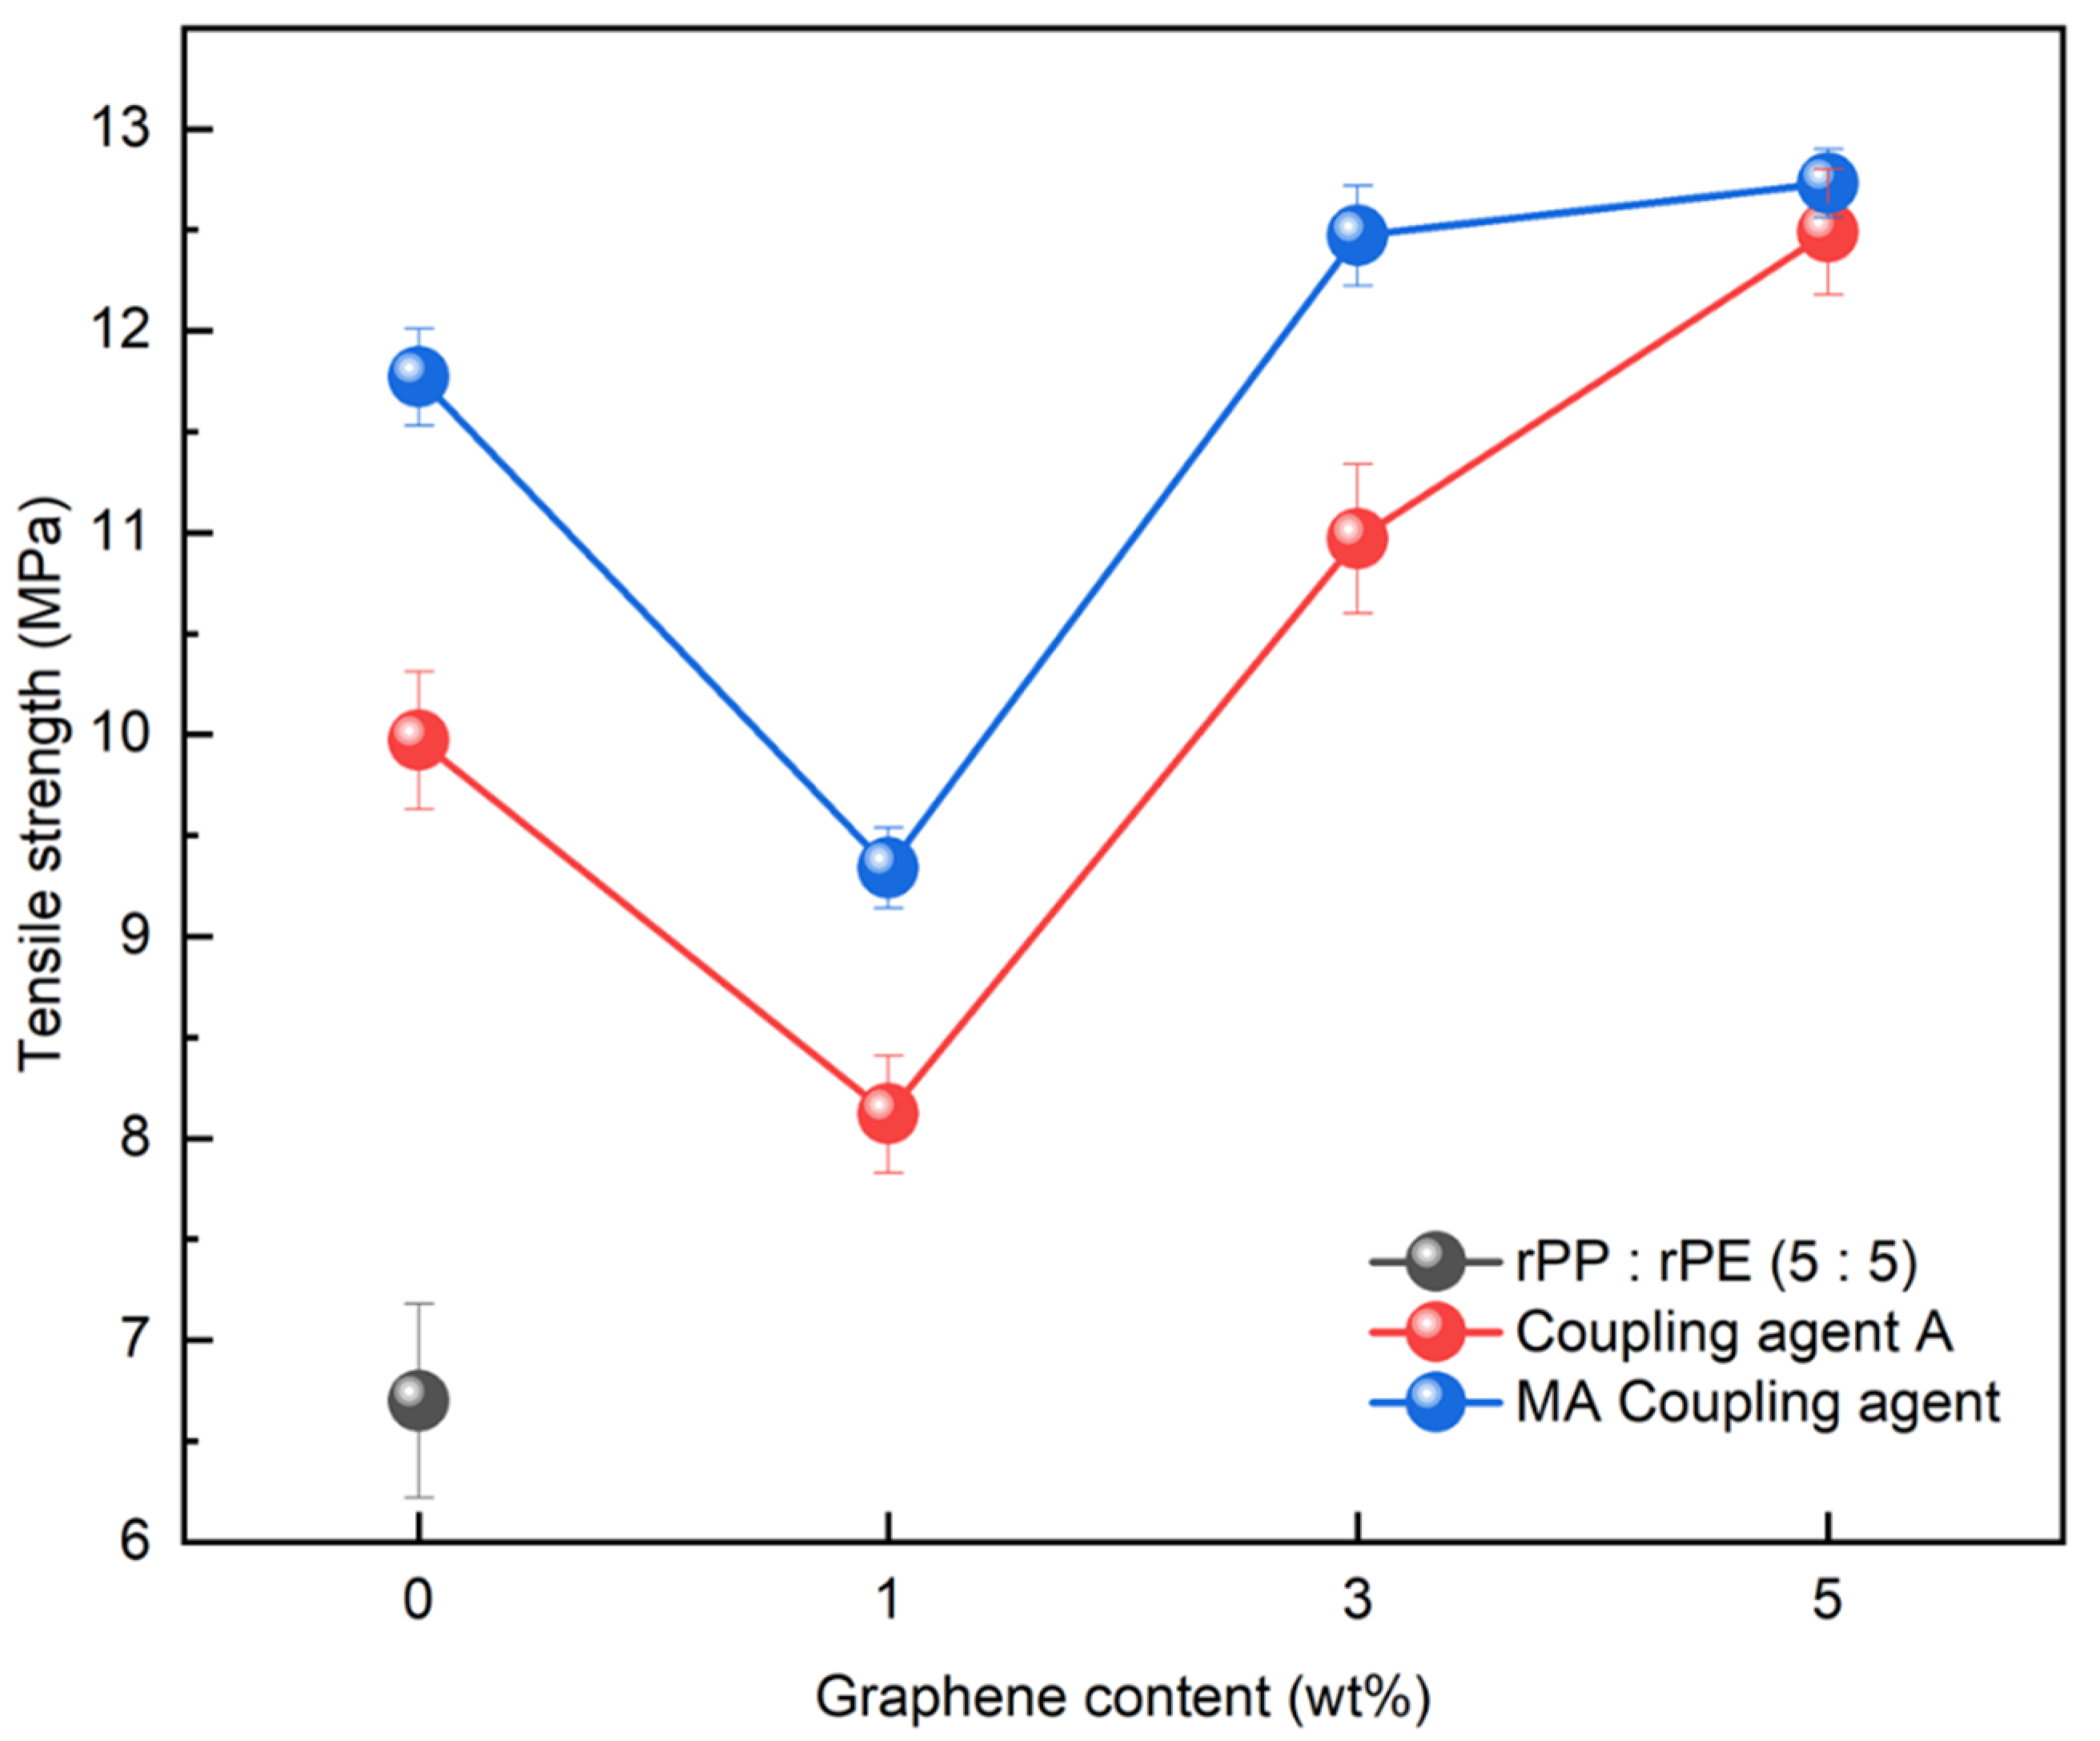
3.4. Application of Graphene to PCR Plastics
4. Conclusions
Author Contributions
Funding
Institutional Review Board Statement
Data Availability Statement
Conflicts of Interest
References
- Maxwell, J. Plastics in the Automotive Industry; Elsevier: Amsterdam, The Netherlands, 1994. [Google Scholar]
- Lux, J.H. Plastics in the space age. J. Franklin Inst. 1994, 226, 21–26. [Google Scholar] [CrossRef]
- Lubin, G.; Dastin, S.J. Aerospace Applications of Composites; Springer: Berlin/Heidelberg, Germany, 1982; pp. 722–743. [Google Scholar]
- Borrelle, S.B.; Ringma, J.; Law, K.L.; Monnahan, C.C.; Lebreton, L.; McGivern, A.; Rochman, C.M. Predicted growth in plastic waste exceeds efforts to mitigate plastic pollution. Science 2020, 369, 1515–1518. [Google Scholar] [CrossRef]
- Adyel, T.M. Accumulation of plastic waste during COVID-19. Science 2020, 369, 1314–1315. [Google Scholar] [CrossRef] [PubMed]
- Ncube, L.K.; Ude, A.U.; Ogunmuyiwa, E.N.; Zulkifli, R.; Beas, I.N. An overview of plastic waste generation and management in food packaging industries. Recycling 2021, 6, 12. [Google Scholar] [CrossRef]
- Baran, B. Resource (in) efficiency in the EU: A case of plastic waste. Ekon. Prawo 2022, 21, 45–62. [Google Scholar] [CrossRef]
- Su, Y.; Zhang, Z.; Wu, D.; Zhan, L.; Shi, H.; Xie, B. Occurrence of microplastics in landfill systems and their fate with landfill age. Water Res. 2019, 164, 114968. [Google Scholar] [CrossRef] [PubMed]
- Verma, R.; Vinoda, K.S.; Papireddy, M.; Gowda, A.N.S. Toxic pollutants from plastic waste-a review. Procedia Environ. Sci. 2016, 35, 701–708. [Google Scholar] [CrossRef]
- He, Q.G.; Huang, C.Y.; Chang, H.; Nie, L.B. Progress in recycling of plastic packaging wastes. Adv. Mat. Res. 2013, 660, 90–96. [Google Scholar] [CrossRef]
- Tajeddin, B.; Arabkhedri, M. Polymer and Food Packaging; Elsevier: Amsterdam, The Netherlands, 2020; pp. 525–543. [Google Scholar]
- Qureshi, M.S.; Oasmaa, A.; Pihkola, H.; Deviatkin, I.; Tenhunen, A.; Mannila, J.; Laine-Ylijoki, J. Pyrolysis of plastic waste: Opportunities and challenges. J. Anal. Appl. Pyrolysis 2020, 152, 104804. [Google Scholar] [CrossRef]
- Zhang, G.H.; Zhu, J.F.; Okuwaki, A. Prospect and current status of recycling waste plastics and technology for converting them into oil in China. Resour. Conserv. Recycl. 2007, 50, 231–239. [Google Scholar] [CrossRef]
- Macosko, C.W. Morphology development and control in immiscible polymer blends. Macromol. Symp. 2000, 149, 171–184. [Google Scholar] [CrossRef]
- Teh, J.W.; Rudin, A.; Keung, J.C. A review of polyethylene–polypropylene blends and their compatibilization. Adv. Polym. Technol. 1994, 13, 1–23. [Google Scholar] [CrossRef]
- Krigbaum, W.R.; Dawkins, J.V.; Via, G.H.; Balta, Y.I. Effect of strain on the thermodynamic melting temperature of polymers. J. Polym. Sci. A-2: Polym. Phys. 1966, 4, 475–489. [Google Scholar] [CrossRef]
- Drozdov, A.D.; Agarwal, S.; Gupta, R.K. The effect of temperature on the viscoelastic response of polymer melts. Int. J. Eng. Sci. 2005, 43, 304–320. [Google Scholar] [CrossRef]
- Kelly, A.L.; Gough, T.; Whiteside, B.R.; Coates, P.D. High shear strain rate rheometry of polymer melts. J. Appl. Polym. Sci. 2009, 114, 864–873. [Google Scholar] [CrossRef]
- Nachtigall, S.M.; Cerveira, G.S.; Rosa, S.M. New polymeric-coupling agent for polypropylene/wood-flour composites. Polym. Test. 2007, 26, 619–628. [Google Scholar] [CrossRef]
- Wah, C.A.; Choong, L.Y.; Neon, G.S. Effects of titanate coupling agent on rheological behaviour, dispersion characteristics and mechanical properties of talc filled polypropylene. Eur. Polym. J. 2000, 36, 789–801. [Google Scholar] [CrossRef]
- Ahmadlouydarab, M.; Chamkouri, M.; Chamkouri, H. Compatibilization of immiscible polymer blends (R-PET/PP) by adding PP-g-MA as compatibilizer: Analysis of phase morphology and mechanical properties. Polym. Bull. 2020, 77, 5753–5766. [Google Scholar] [CrossRef]
- Tucker, J.D.; Lee, S.; Einsporn, R.L. A study of the effect of PP-g-MA and SEBS-g-MA on the mechanical and morphological properties of polypropylene/nylon 6 blends. Polym. Eng. Sci. 2000, 40, 2577–2589. [Google Scholar] [CrossRef]
- Kiran, M.D.; Govindaraju, H.K.; Jayaraju, T.; Kumar, N. Effect of fillers on mechanical properties of polymer matrix composites. Mater. Today Proc. 2018, 5, 22421–22424. [Google Scholar] [CrossRef]
- Kar, G.P.; Biswas, S.; Bose, S. Tailoring the interface of an immiscible polymer blend by a mutually miscible homopolymer grafted onto graphene oxide: Outstanding mechanical properties. Phys. Chem. Chem. Phys. 2015, 17, 1811–1821. [Google Scholar] [CrossRef]
- Cao, Y.; Zhang, J.; Feng, J.; Wu, P. Compatibilization of immiscible polymer blends using graphene oxide sheets. ACS Nano 2011, 5, 5920–5927. [Google Scholar] [CrossRef]
- ASTM D1238-23a; Standard Test Method for Melt flow Rates of Thermoplastics by Extrusion Plastometer. ASTM International: West Conshohocken, PA, USA, 2023.
- Caban, R. FTIR-ATR spectroscopic, thermal and microstructural studies on polypropylene-glass fiber composites. J. Mol. Struct. 2022, 1264, 133181. [Google Scholar] [CrossRef]
- Na, C.K.; Park, G.Y.; Park, H. Polypropylene surface with antibacterial property by photografting 1-vinylimidazole and subsequent chemical modification. Korean J. Chem. Eng. 2018, 35, 1748–1755. [Google Scholar] [CrossRef]
- Takafuji, M.; Ide, S.; Ihara, H.; Xu, Z. Preparation of poly (1-vinylimidazole)-grafted magnetic nanoparticles and their application for removal of metal ions. Chem. Mater. 2004, 16, 1977–1983. [Google Scholar] [CrossRef]
- El-Hamshary, H.; Fouda, M.M.; Moydeen, M.; El-Newehy, M.H.; Al-Deyab, S.S.; Abdel-Megeed, A. Synthesis and antibacterial of carboxymethyl starch-grafted poly (vinyl imidazole) against some plant pathogens. Int. J. Bio. Macromol. 2015, 72, 1466–1472. [Google Scholar] [CrossRef] [PubMed]
- Dulal, N.; Shanks, R.; Gengenbach, T.; Gill, H.; Chalmers, D.; Adhikari, B.; Martinez, I.P. Slip-additive migration, surface morphology, and performance on injection moulded high-density polyethylene closures. J. Colloid Interface. Sci. 2017, 505, 537–545. [Google Scholar] [CrossRef] [PubMed]
- Stuart, B.H. Infrared Spectroscopy: Fundamentals and Applications; John Wiley & Sons: Hoboken, NJ, USA, 2004. [Google Scholar]
- Korol, J.; Hejna, A.; Wypiór, K.; Mijalski, K.; Chmielnicka, E. Wastes from agricultural silage film recycling line as a potential polymer materials. Polymers 2021, 13, 1383. [Google Scholar] [CrossRef] [PubMed]
- Contat-Rodrigo, L.; Ribes-Greus, A.; Imrie, C.T. Thermal analysis of high-density polyethylene and low-density polyethylene with enhanced biodegradability. J. Appl. Polym. Sci. 2002, 86, 764–772. [Google Scholar] [CrossRef]
- Das, P.; Tiwari, P. Valorization of packaging plastic waste by slow pyrolysis. Resour. Conserv. Recycl. 2018, 128, 69–77. [Google Scholar] [CrossRef]
- Rego, A.; Silva, A.S.; Grillo, A.V.; Santos, B.F. Thermogravimetric Study of Raw and Recycled Polyethylene Using Genetic Algorithm for Kinetic Parameters Estimation. Chem. Eng. Trans. 2019, 74, 145–150. [Google Scholar]
- Shafigullin, L.N.; Romanova, N.V.; Gumerov, I.F.; Gabrakhmanov, A.T.; Sarimov, D.R. Thermal properties of polypropylene and polyethylene blends (PP/LDPE). IOP Conf. Ser. Mater. Sci. Eng. 2018, 412, 12070. [Google Scholar] [CrossRef]
- Sharma, S.K.; Nema, A.K.; Nayak, S.K. Polypropylene nanocomposite film: A critical evaluation on the effect of nanoclay on the mechanical, thermal, and morphological behavior. J. Appl. Polym. Sci. 2010, 115, 3463–3473. [Google Scholar] [CrossRef]
- Aboulkas, A.; El Bouadili, A. Thermal degradation behaviors of polyethylene and polypropylene. Part I: Pyrolysis kinetics and mechanisms. Energy Convers. Manag. 2010, 51, 1363–1369. [Google Scholar] [CrossRef]
- Thoden van Velzen, E.U.; Chu, S.; Alvarado Chacon, F.; Brouwer, M.T.; Molenveld, K. The impact of impurities on the mechanical properties of recycled polyethylene. Packag. Technol. Sci. 2021, 34, 219–228. [Google Scholar] [CrossRef]
- Graziano, A.; Titton Dias, O.A.; Sena Maia, B.; Li, J. Enhancing the mechanical, morphological, and rheological behavior of polyethylene/polypropylene blends with maleic anhydride-grafted polyethylene. Polym. Eng. Sci. 2021, 61, 2487–2495. [Google Scholar] [CrossRef]
- Graziano, A.; Jaffer, S.; Sain, M. Review on modification strategies of polyethylene/polypropylene immiscible thermoplastic polymer blends for enhancing their mechanical behavior. J. Elastomers. Plast. 2019, 51, 291–336. [Google Scholar] [CrossRef]
- Jose, S.; Thomas, S.; Parameswaranpillai, J.; Aprem, A.S.; Karger-Kocsis, J. Dynamic mechanical properties of immiscible polymer systems with and without compatibilizer. Polym. Test. 2015, 44, 168–176. [Google Scholar] [CrossRef]
- Jiang, G.; Wu, H.; Guo, S. Reinforcement of adhesion and development of morphology at polymer–polymer interface via reactive compatibilization: A review. Polym. Eng. Sci. 2010, 50, 2273–2286. [Google Scholar] [CrossRef]
- Koning, C.; Van Duin, M.; Pagnoulle, C.; Jerome, R. Strategies for compatibilization of polymer blends. Prog. Polym. Sci. 1998, 23, 707–757. [Google Scholar] [CrossRef]
- Pracella, M.; Haque, M.M.U.; Alvarez, V. Functionalization, compatibilization and properties of polyolefin composites with natural fibers. Polymers 2010, 2, 554–574. [Google Scholar] [CrossRef]
- Clarke, R.W.; Sandmeier, T.; Franklin, K.A.; Reich, D.; Zhang, X.; Vengallur, N.; Chen, E.Y.X. Dynamic crosslinking compatibilizes immiscible mixed plastics. Nature 2023, 616, 731–739. [Google Scholar] [CrossRef] [PubMed]
- Durmaz, B.U.; Aytac, A. Characterization of carbon fiber-reinforced poly (phenylene sulfide) composites prepared with various compatibilizers. J. Compos. Mater. 2020, 54, 89–100. [Google Scholar] [CrossRef]
- Li, H.; Xie, X.M. Morphology development and superior mechanical properties of PP/PA6/SEBS ternary blends compatibilized by using a highly efficient multi-phase compatibilizer. Polymer 2017, 108, 1–10. [Google Scholar] [CrossRef]
- Sclavons, M.; Carlier, V.; De Roover, B.; Franquinet, P.; Devaux, J.; Legras, R. The anhydride content of some commercial PP-g-MA: FTIR and titration. J. Appl. Polym. Sci. 1996, 62, 1205–1210. [Google Scholar] [CrossRef]
- Kong, Y.; Li, Y.; Hu, G.; Cao, N.; Ling, Y.; Pan, D.; Shao, Q.; Guo, Z. Effects of polystyrene-b-poly (ethylene/propylene)-b-polystyrene compatibilizer on the recycled polypropylene and recycled high-impact polystyrene blends. Polym. Adv. Technol. 2018, 29, 2344–2351. [Google Scholar] [CrossRef]
- Abacha, N.; Fellahi, S. Synthesis of polypropylene-graft-maleic anhydride compatibilizer and evaluation of nylon 6/polypropylene blend properties. Polym. Int. 2005, 54, 909–916. [Google Scholar] [CrossRef]
- Ahmed, K.; Raza, N.Z.; Habib, F.; Aijaz, M.; Afridi, M.H. An investigation on the influence of filler loading and compatibilizer on the properties of polypropylene/marble sludge composites. J. Ind. Eng. Chem. 2013, 19, 1805–1810. [Google Scholar] [CrossRef]
- Lodhi, R.S.; Kumar, P.; Achuthanunni, A.; Rahaman, M.; Das, P. Mechanical properties of polymer/graphene composites. In Polymer Nanocomposites Containing Graphene; Woodhead Publishing: Cambridge, UK, 2022; pp. 75–105. [Google Scholar]
- Jiang, L.Y.; Huang, Y.; Jiang, H.; Ravichandran, G.; Gao, H.; Hwang, K.C.; Liu, B. A cohesive law for carbon nanotube/polymer interfaces based on the van der Waals force. J. Mech. Phys. Solids 2006, 54, 2436–2452. [Google Scholar] [CrossRef]
- Jana, R.N.; Mukunda, P.G.; Nando, G.B. Thermogravimetric analysis of compatibilized blends of low density polyethylene and poly (dimethyl siloxane) rubber. Polym. Degrad. Stab. 2003, 80, 75–82. [Google Scholar] [CrossRef]
- Akhlaghi, S.; Sharif, A.; Kalaee, M.; Elahi, A.; Pirzadeh, M.; Mazinani, S.; Afshari, M. Effect of stabilizer on the mechanical, morphological and thermal properties of compatibilized high density polyethylene/ethylene vinyl acetate copolymer/organoclay nanocomposites. Mater. Des. 2012, 33, 273–283. [Google Scholar] [CrossRef]
- Fim, F.D.C.; Basso, N.R.; Graebin, A.P.; Azambuja, D.S.; Galland, G.B. Thermal, electrical, and mechanical properties of polyethylene–graphene nanocomposites obtained by in situ polymerization. J. Appl. Polym. Sci. 2013, 128, 2630–2637. [Google Scholar] [CrossRef]
- Mittal, V.; Chaudhry, A.U. Polymer-graphene nanocomposites: Effect of polymer matrix and filler amount on properties. Macromol. Mater. Eng. 2015, 300, 510–521. [Google Scholar] [CrossRef]
- Wan, Y.J.; Yang, W.H.; Yu, S.H.; Sun, R.; Wong, C.P.; Liao, W.H. Covalent polymer functionalization of graphene for improved dielectric properties and thermal stability of epoxy composites. Compos. Sci. Technol. 2016, 122, 27–35. [Google Scholar] [CrossRef]


| No. | Trade Name | Abbreviation | MFI | Producer |
|---|---|---|---|---|
| A | PH-200 | PP-g-MA (5% of MA) | 100 g/10 min | Lotte Chemical, Seoul, Republic of Korea |
| B | EM-520 | PP-g-LLDPE | 2.3 g/10 min | Lotte Chemical, Seoul, Republic of Korea |
| C | CM-1120H | PP-g-MA (1% of MA) | 70 g/10 min | Lotte Chemical, Seoul, Republic of Korea |
| D | NB2713A | PE-g-LLDPE | 2–4 g/10 min | Woosung Chemical, Yeongcheon, Republic of Korea |
| E | SP2000S | Impact modifier (Nylon) | 2–4 g/10 min | Woosung Chemical, Yeongcheon, Republic of Korea |
| Additive | Content (wt%) |
|---|---|
| MA | 1, 3, 5, 7, 10 |
| DCP | 0.2, 0.4 |
| Graphene | 1, 3, 5 |
| Wavenumber, cm−1 | Area | Area, rPP:rPE (5:5) |
|---|---|---|
| 718 (PE) | 344.92 | 216.74 |
| 1375 (PP) | 439.00 | 290.52 |
| 2847 (PE) | 1463.46 | 1004.22 |
| 2950 (PP) | 1172.91 | 690.69 |
| Type | Coupling Agent | MFI (g/10 min) |
|---|---|---|
| rPP | - | 12.82 |
| rPE | - | 1.08 |
| rPP:rPE (5:5) | - | 4.51 |
| A | 5.33 | |
| MA | 5.14 | |
| PCR plastic | - | 4.92 |
| A | 9.68 | |
| MA | 25.66 |
Disclaimer/Publisher’s Note: The statements, opinions and data contained in all publications are solely those of the individual author(s) and contributor(s) and not of MDPI and/or the editor(s). MDPI and/or the editor(s) disclaim responsibility for any injury to people or property resulting from any ideas, methods, instructions or products referred to in the content. |
© 2024 by the authors. Licensee MDPI, Basel, Switzerland. This article is an open access article distributed under the terms and conditions of the Creative Commons Attribution (CC BY) license (https://creativecommons.org/licenses/by/4.0/).
Share and Cite
Choi, S.; Zhao, J.; Lee, P.C.; Choi, D. The Effect of Coupling Agents and Graphene on the Mechanical Properties of Film-Based Post-Consumer Recycled Plastic. Polymers 2024, 16, 380. https://doi.org/10.3390/polym16030380
Choi S, Zhao J, Lee PC, Choi D. The Effect of Coupling Agents and Graphene on the Mechanical Properties of Film-Based Post-Consumer Recycled Plastic. Polymers. 2024; 16(3):380. https://doi.org/10.3390/polym16030380
Chicago/Turabian StyleChoi, Sungwoong, Jianxiang Zhao, Patrick C. Lee, and Duyoung Choi. 2024. "The Effect of Coupling Agents and Graphene on the Mechanical Properties of Film-Based Post-Consumer Recycled Plastic" Polymers 16, no. 3: 380. https://doi.org/10.3390/polym16030380
APA StyleChoi, S., Zhao, J., Lee, P. C., & Choi, D. (2024). The Effect of Coupling Agents and Graphene on the Mechanical Properties of Film-Based Post-Consumer Recycled Plastic. Polymers, 16(3), 380. https://doi.org/10.3390/polym16030380