Figure 1.
Effect of the ethanol-acetic acid ratio on the optical density and turbidity of the PVA-CS solution.
Figure 1.
Effect of the ethanol-acetic acid ratio on the optical density and turbidity of the PVA-CS solution.
Figure 2.
Graphs of the dependence of shear rates on the dynamic viscosity of PVA-CS solutions at the different ratios of ethanol-acetic acid.
Figure 2.
Graphs of the dependence of shear rates on the dynamic viscosity of PVA-CS solutions at the different ratios of ethanol-acetic acid.
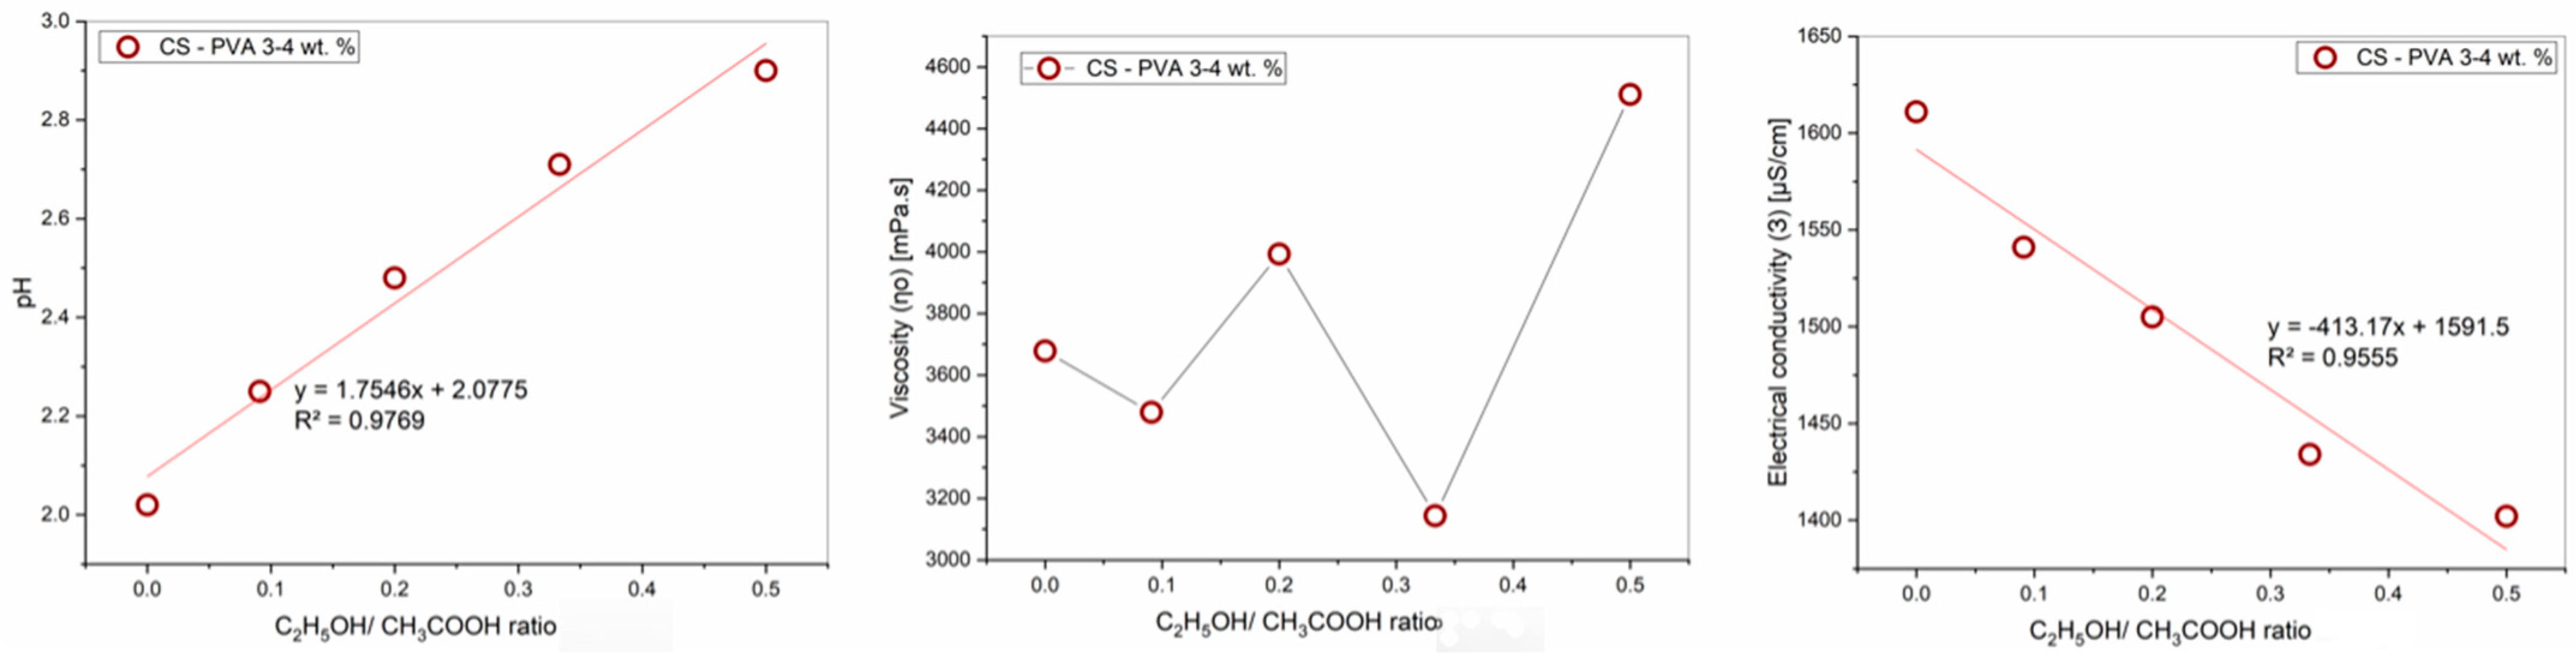
Figure 3.
Graphs of the dependence of the rheological properties of the PVA-CS solution on the ethanol-acetic acid ratios.
Figure 3.
Graphs of the dependence of the rheological properties of the PVA-CS solution on the ethanol-acetic acid ratios.
Figure 4.
The Teas plot for PVA-CS electrospinning solutions with CH3COOH-H2O and CH3COOH-C2H5OH-H2O as the co-solvent system.
Figure 4.
The Teas plot for PVA-CS electrospinning solutions with CH3COOH-H2O and CH3COOH-C2H5OH-H2O as the co-solvent system.
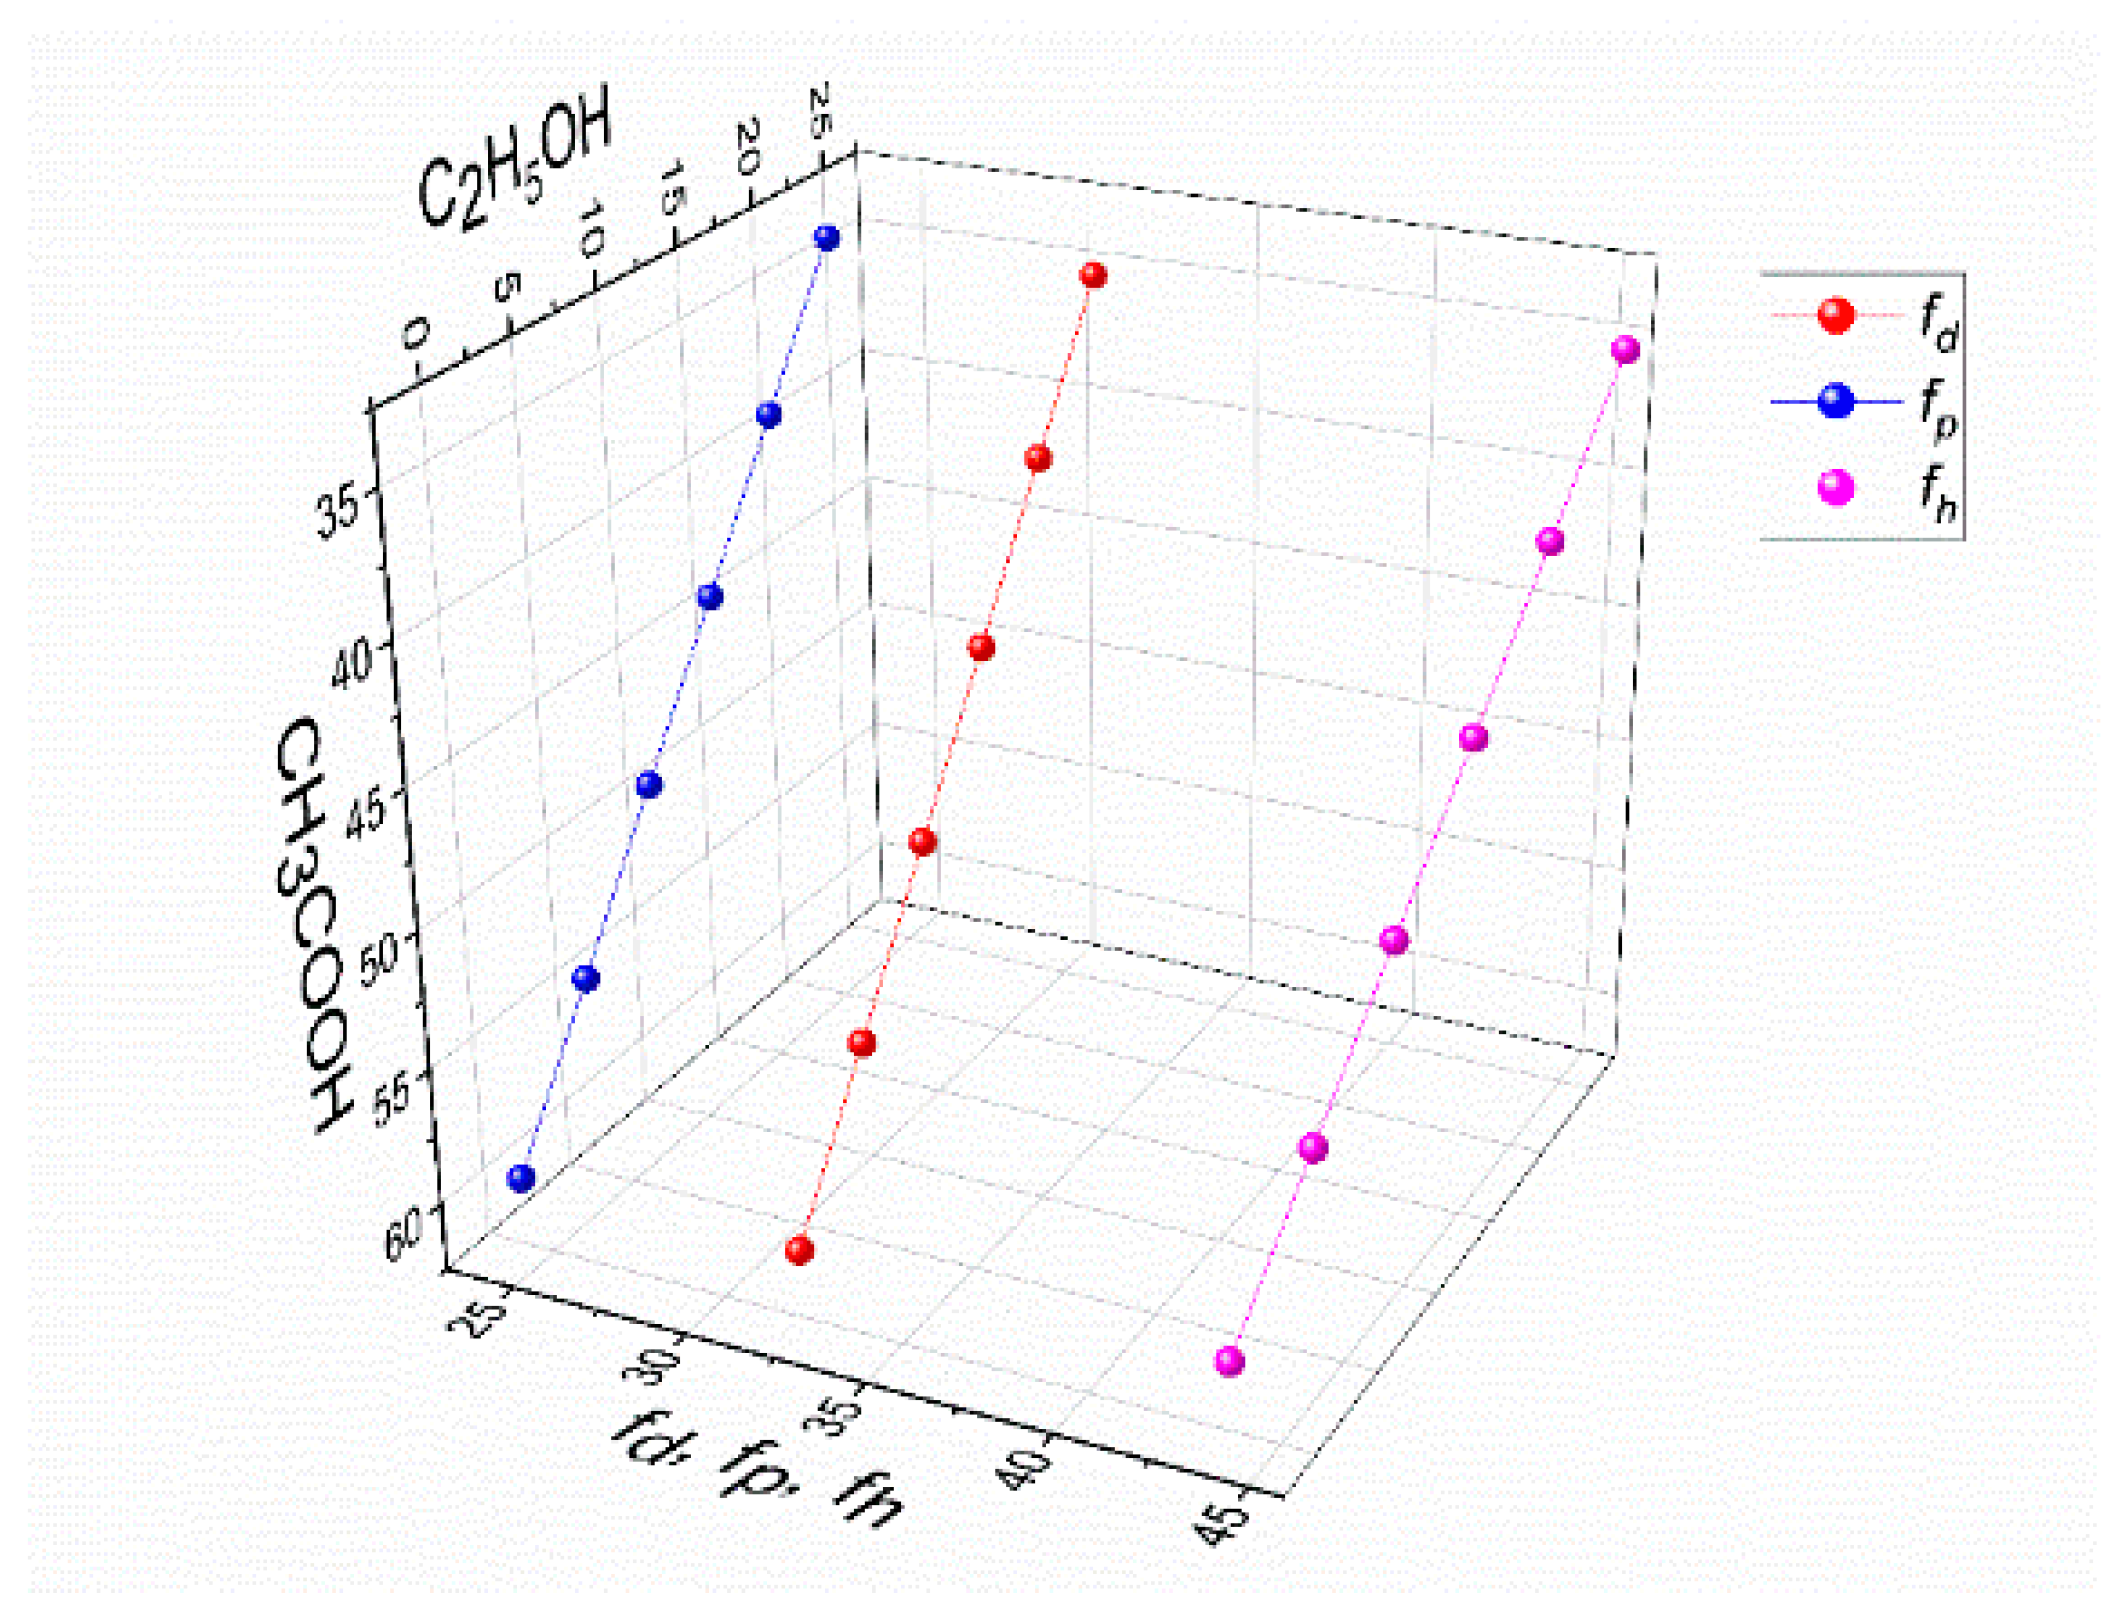
Figure 5.
The values of polar interactions fh, fp, and fd for a mixture of solvents, CH3COOH-C2H5OH-H2O, in the solution of 4% PVA–3% CS.
Figure 5.
The values of polar interactions fh, fp, and fd for a mixture of solvents, CH3COOH-C2H5OH-H2O, in the solution of 4% PVA–3% CS.
Figure 6.
Microscopic images at 100× and 1000× and the diameter distributions of PVA-CS nanofibers obtained from solutions of 4% PVA, 3% CS, and different concentration of acetic acid and ethanol (electrospinning parameters fixed at a collector—needle distance of 140 mm, a feed rate of 0.2 mL/h, and a voltage of 28 kV).
Figure 7.
Microscopic images at 100× and 1000× and the diameter distributions of PVA-CS nanofibers obtained from the solution of PVA-CS (the ratio being 4–3) with an ethanol-acetic acid solvent ratio of 15–45 at a feed rate of 0.2 mL/h, a voltage of 28 kV, and with variation of the needle-collector distance.
Figure 8.
Microscopic images at 100× and 1000× and diameter distributions of PVA-CS nanofibers obtained from the solution of PVA-CS (the ratio 4–3) with an ethanol-acetic acid solvent ratio of 15–45 at a needle-collector distance of 140 mm, a voltage of 28 kV, and a variation of the feed rate from 0.1 to 0.4 mL/h.
Figure 9.
Microscopic images at 100× and 1000× and diameter distributions of PVA-CS nanofibers obtained from the solution of PVA-CS (the ratio 4–3) with an ethanol-acetic acid solvent ratio of 15–45 at a needle-collector distance of 140 mm, a feed rate of 0.3 mL/h, and a variation in voltage from 25 to 30 kV.
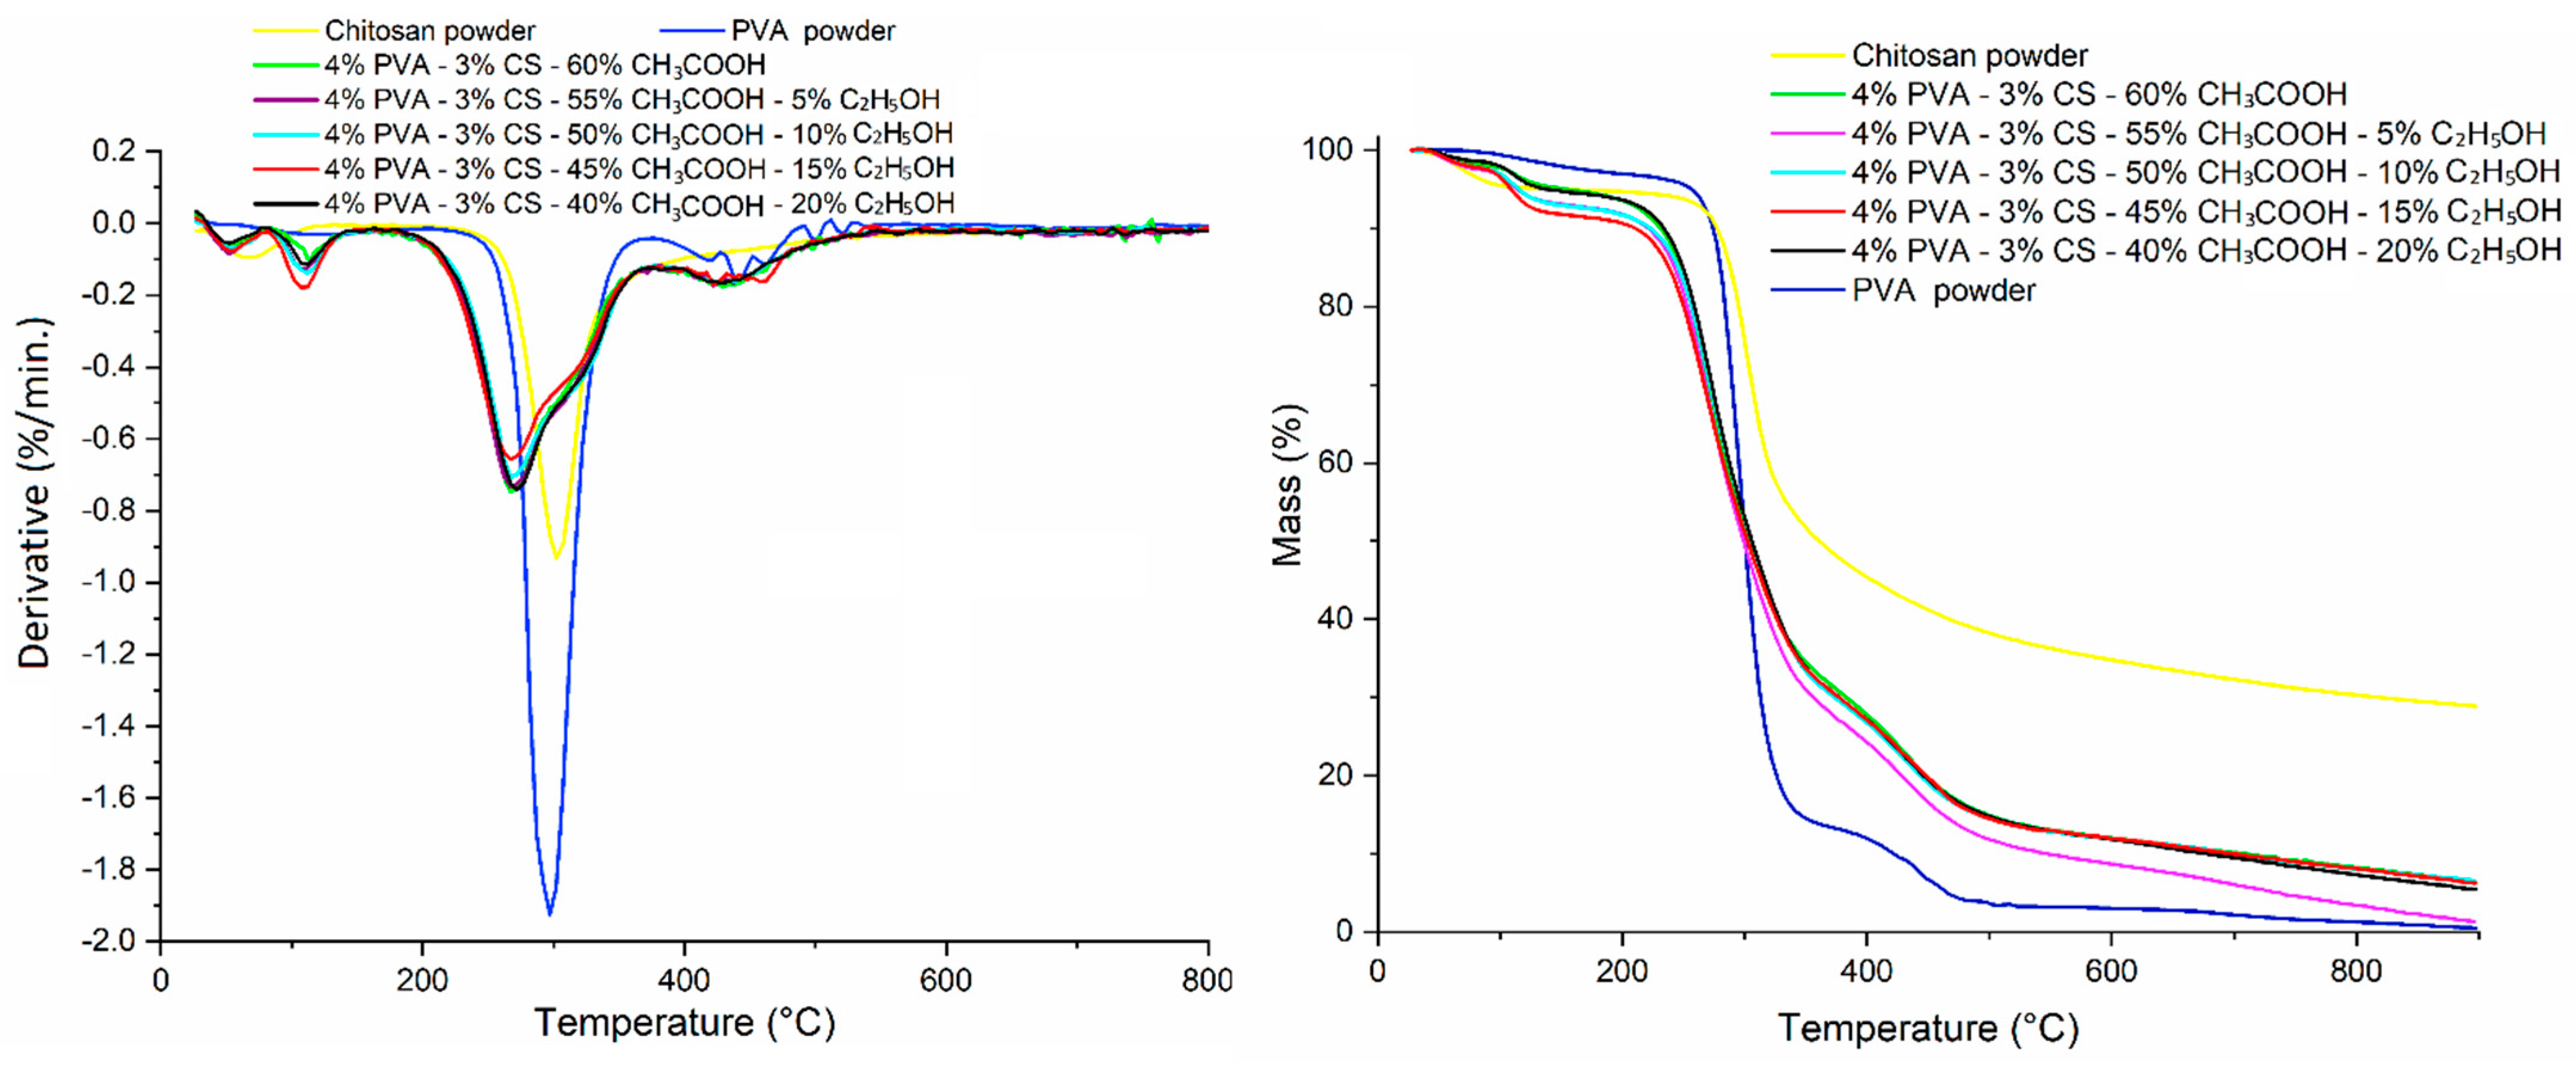
Figure 10.
Infrared spectra of PVA powder, chitosan powder, and PVA-CS nanofibers.
Figure 10.
Infrared spectra of PVA powder, chitosan powder, and PVA-CS nanofibers.
Figure 11.
X-ray diffraction data of PVA powder, CS powder, and PVA nanofibers from an aqueous solution and PVA-CS nanofibers from an aqueous solution with C2H5OH and CH3COOH.
Figure 11.
X-ray diffraction data of PVA powder, CS powder, and PVA nanofibers from an aqueous solution and PVA-CS nanofibers from an aqueous solution with C2H5OH and CH3COOH.
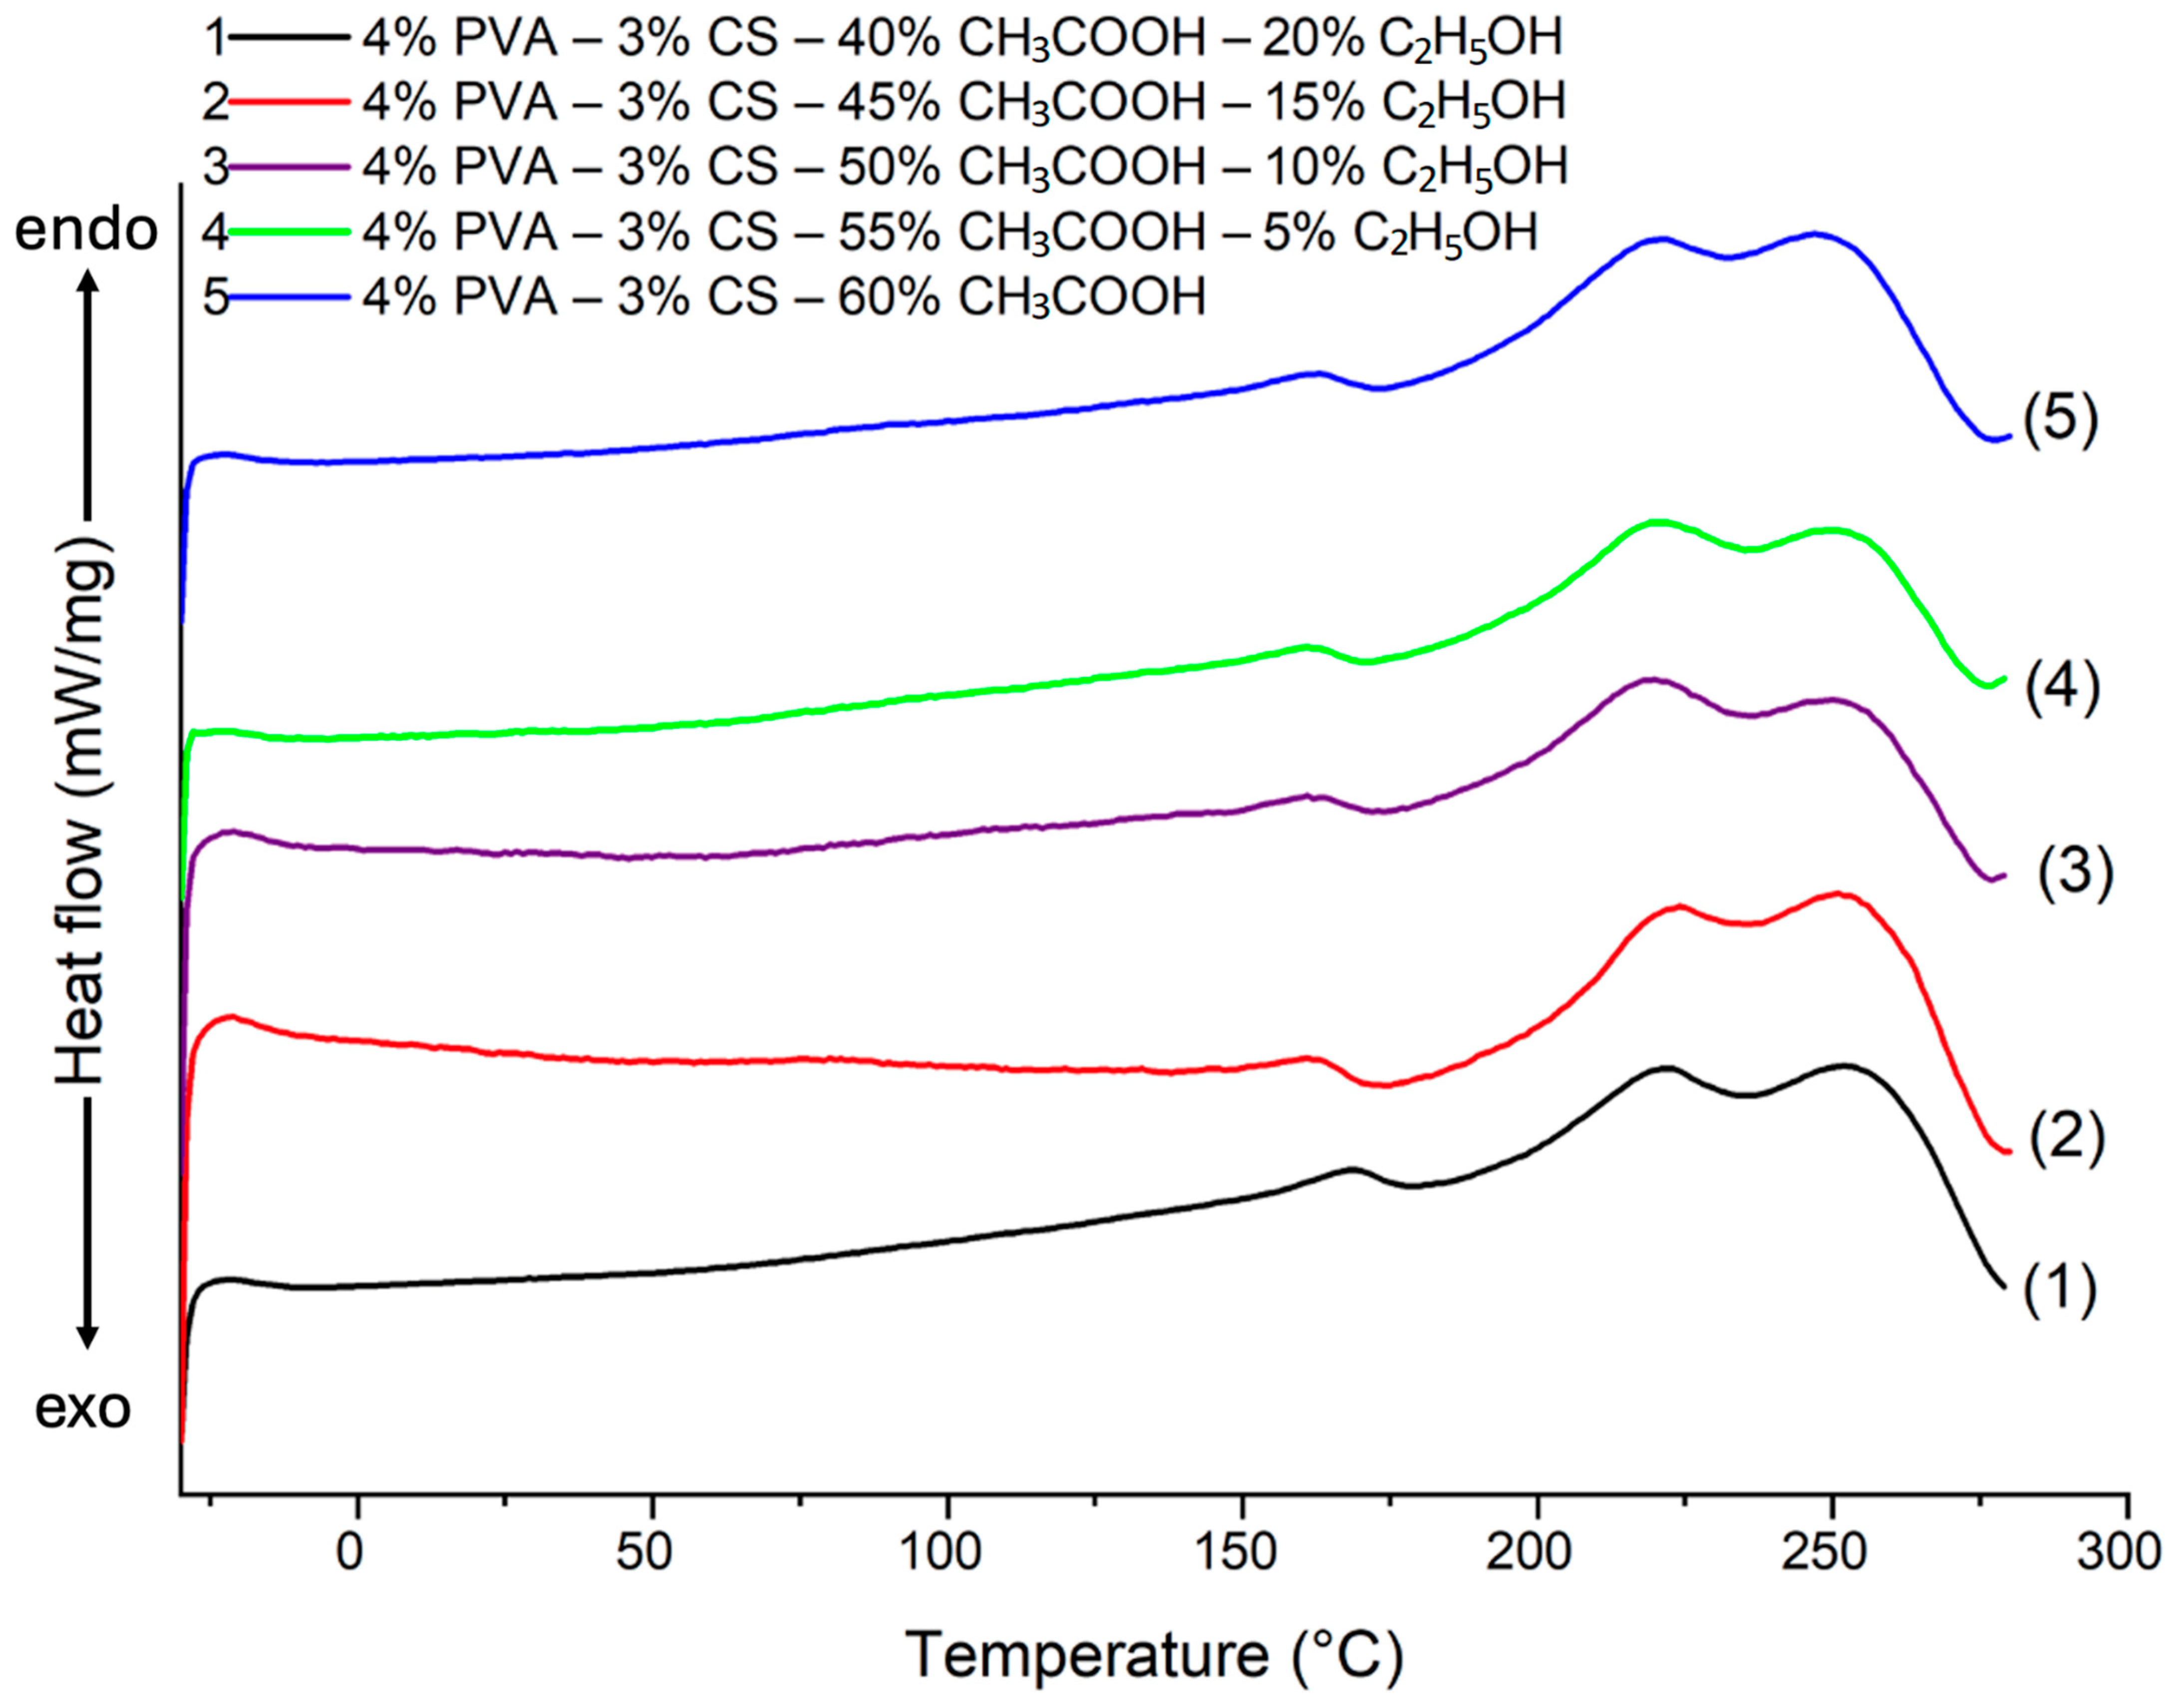
Figure 12.
DSC heating curve of PVA-CS nanofibers at different ethanol-acetic acid ratios.
Figure 12.
DSC heating curve of PVA-CS nanofibers at different ethanol-acetic acid ratios.
Figure 13.
TGA thermogram of PVA powder, CS powder, and PVA-CS nanofibers at different ethanol-acetic acid ratios in initial electrospun solution.
Figure 13.
TGA thermogram of PVA powder, CS powder, and PVA-CS nanofibers at different ethanol-acetic acid ratios in initial electrospun solution.
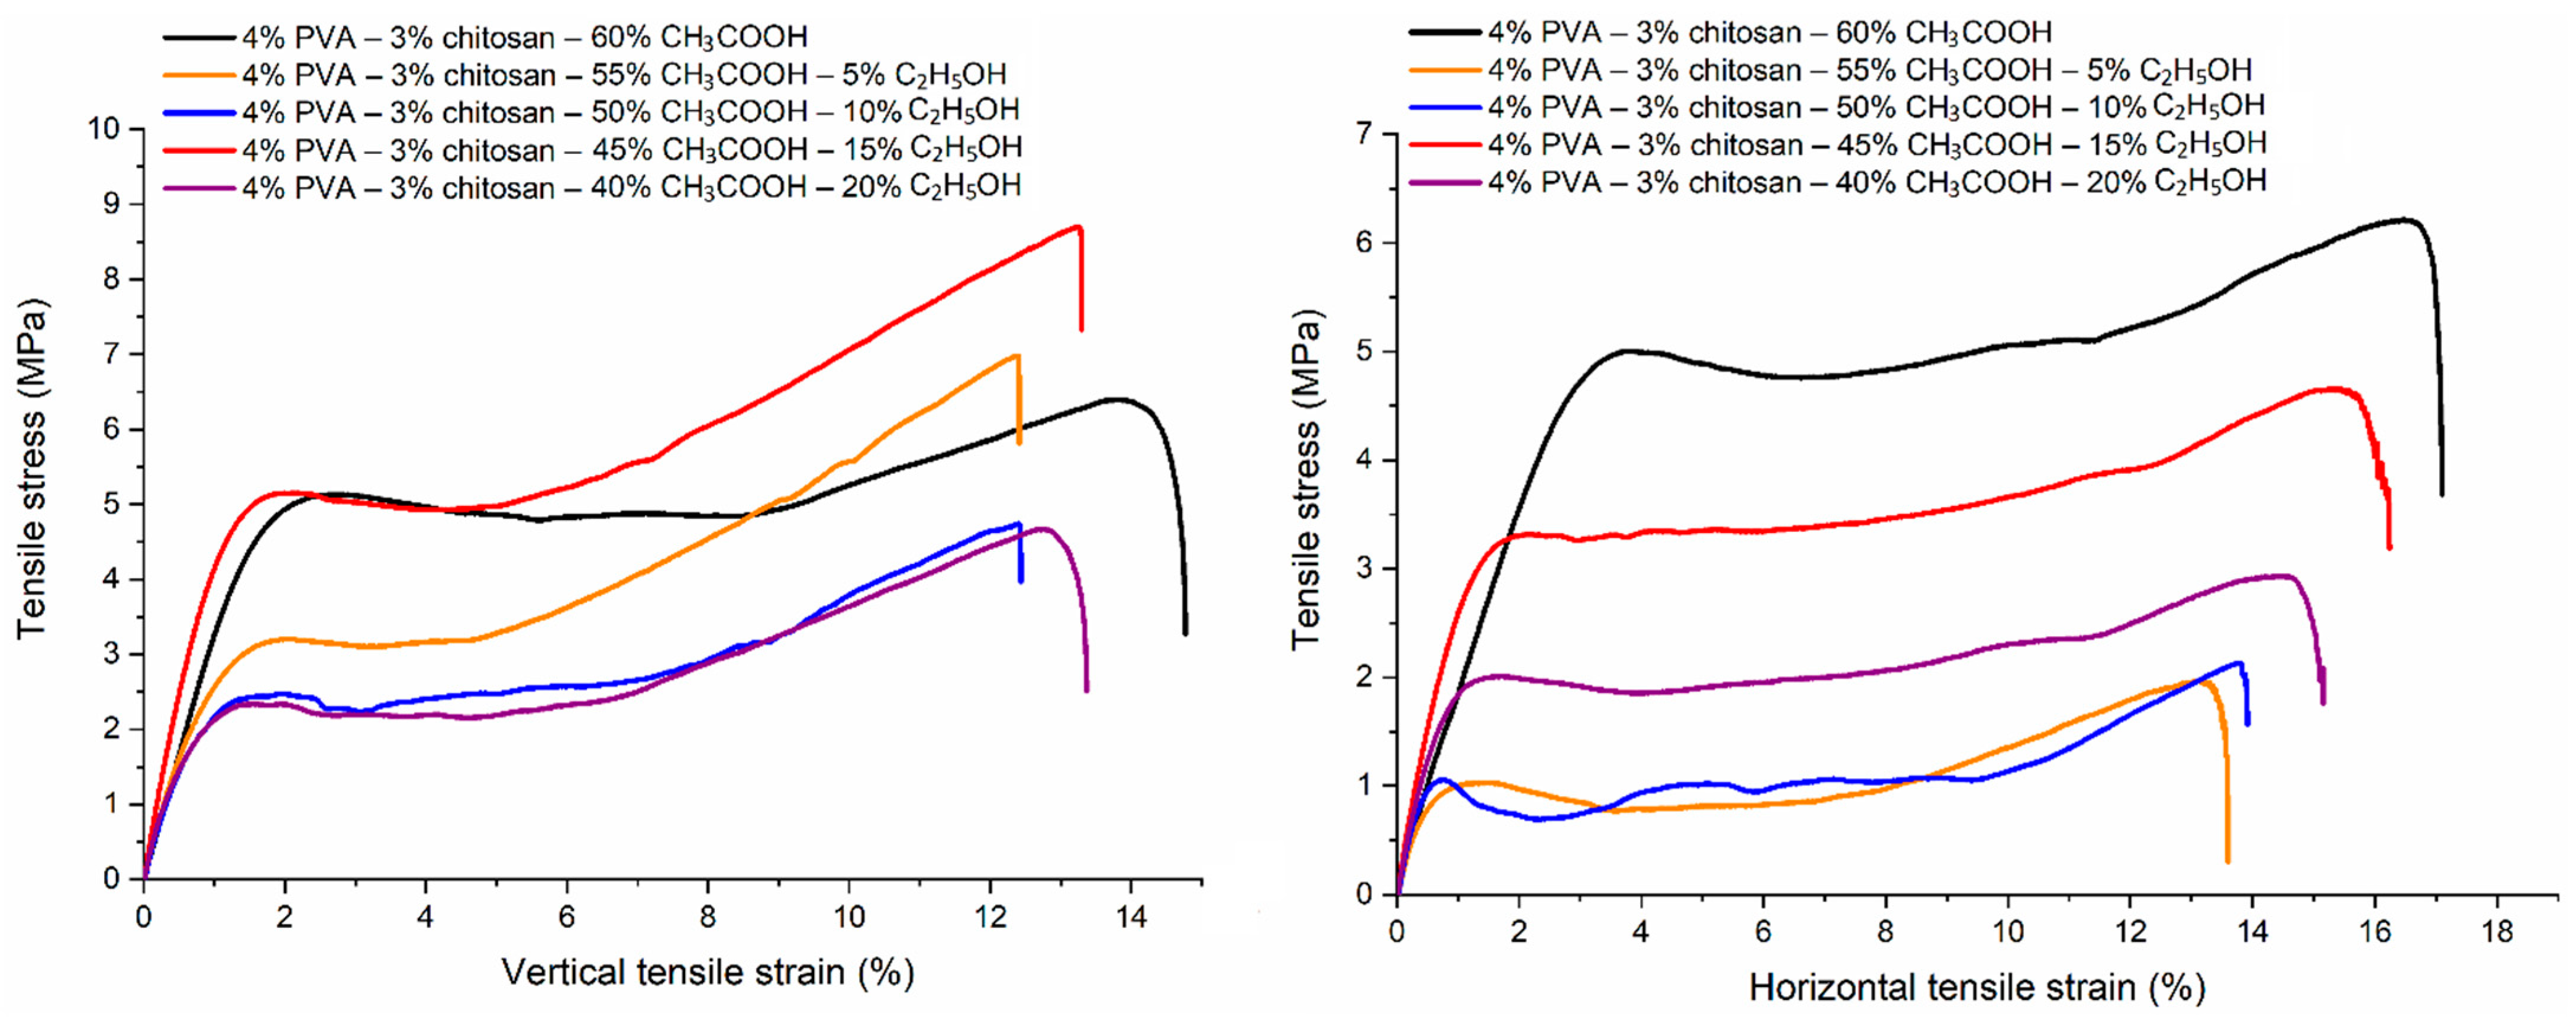
Figure 14.
The deformation of PVA-CS nanofibers according to the ethanol-acetic acid ratios in the electrospun solutions.
Figure 14.
The deformation of PVA-CS nanofibers according to the ethanol-acetic acid ratios in the electrospun solutions.
Figure 15.
Changes in tensile properties of PVA-CS nanofibers according to ethanol-acetic acid ratios in the electrospun solutions.
Figure 15.
Changes in tensile properties of PVA-CS nanofibers according to ethanol-acetic acid ratios in the electrospun solutions.
Table 1.
Effect of the ethanol-acetic acid ratio on the optical density and turbidity of the PVA-CS solution.
Table 1.
Effect of the ethanol-acetic acid ratio on the optical density and turbidity of the PVA-CS solution.
| CH3COOH/C2H5OH, % | Optical Density | Turbidity, FNU |
|---|
| Absorption (A) | Transmission (T), % |
|---|
| 60/0 | 0.315 | 48.4 | 24.7 |
| 55/5 | 0.186 | 65.2 | 23.4 |
| 50/10 | 0.171 | 67.4 | 20.2 |
| 45/15 | 0.173 | 67.2 | 20.8 |
| 40/20 | 0.297 | 50.5 | 44.5 |
Table 2.
The parameters of the Carreau-Yasuda equation for PVA-CS solutions at the different ratios of ethanol-acetic acid.
Table 2.
The parameters of the Carreau-Yasuda equation for PVA-CS solutions at the different ratios of ethanol-acetic acid.
| CH3COOH/C2H5OH, (%) | η0, (mPa·s) | λ · 103 (s) | a | m | R2 |
|---|
| 60/0 | 3678 | 13.86 | 0.93 | 0.611 | 0.9999 |
| 55/5 | 3479 | 7.11 | 0.84 | 0.507 | 0.9995 |
| 50/10 | 3993 | 11.54 | 0.80 | 0.553 | 0.9999 |
| 45/15 | 3143 | 13.70 | 0.92 | 0.617 | 0.9999 |
| 40/20 | 4511 | 7.56 | 0.68 | 0.485 | 0.9999 |
Table 3.
Effect of ethanol-acetic acid ratio on rheological properties of PVA-CS solution.
Table 3.
Effect of ethanol-acetic acid ratio on rheological properties of PVA-CS solution.
| C2H5OH/CH3COOH, (%) | pH | Viscosity η, (mPa·s) | Electrical Conductivity Ɜ, (μS/cm) |
|---|
| 0/60 | 2.02 | 2724.3 | 1611 |
| 5/55 | 2.25 | 2644.6 | 1541 |
| 10/50 | 2.48 | 2796.7 | 1505 |
| 15/45 | 2.71 | 2338.4 | 1434 |
| 20/40 | 2.90 | 3036.7 | 1402 |
Table 4.
The PVA-CS nanofiber fabrication at different concentrations of ethanol and acetic acid under electrospinning conditions: a needle-collector distance of 100–150 mm, a feed rate of 0.1–0.2 mL/h, and a voltage of 16–30 kV.
Table 4.
The PVA-CS nanofiber fabrication at different concentrations of ethanol and acetic acid under electrospinning conditions: a needle-collector distance of 100–150 mm, a feed rate of 0.1–0.2 mL/h, and a voltage of 16–30 kV.
| Distance (mm) | Feed Rate (mL/h) | CCH3COOH
(% w/w) | CC2H5OH
(% w/w) | Voltage (kV) |
|---|
| 16 | 18 | 20 | 22 | 24 | 26 | 27 | 28 | 29 | 30 |
|---|
| 150 | 0.1 | 60 | 0 | O | O | o | + | + | + | + | + | + | + |
| 55 | 5 | O | O | o | + | + | + | + | + | + | + |
| 50 | 10 | O | O | o | + | + | + | + | + | + | + |
| 45 | 15 | O | o | + | + | + | + | + | + | + | + |
| 40 | 20 | O | o | + | + | + | + | + | + | + | + |
| 0.2 | 60 | 0 | O | O | O | o | + | + | + | + | + | + |
| 55 | 5 | O | O | o | o | + | + | + | + | + | + |
| 50 | 10 | O | O | o | o | + | + | + | + | + | + |
| 45 | 15 | O | O | o | + | + | + | + | + | + | + |
| 40 | 20 | O | O | o | + | + | + | + | + | + | + |
| 140 | 0.1 | 60 | 0 | O | o | + | + | + | + | + | + | + | + |
| 55 | 5 | O | O | o | + | + | + | + | + | + | + |
| 50 | 10 | O | O | o | + | + | + | + | + | + | + |
| 45 | 15 | O | o | + | + | + | + | + | + | + | + |
| 40 | 20 | O | o | + | + | + | + | + | + | + | + |
| 0.2 | 60 | 0 | O | O | O | o | + | + | + | + | + | + |
| 55 | 5 | O | O | o | o | + | + | + | + | + | + |
| 50 | 10 | O | O | o | * | + | + | + | + | + | + |
| 45 | 15 | O | O | * | + | + | + | + | + | + | + |
| 40 | 20 | O | O | o | + | + | + | + | + | + | + |
| 120 | 0.1 | 60 | 0 | O | o | + | + | + | + | + | + | + | + |
| 55 | 5 | O | o | + | + | + | + | + | + | + | + |
| 50 | 10 | O | o | + | + | + | + | + | + | + | + |
| 45 | 15 | o | + | + | + | + | + | + | + | + | + |
| 40 | 20 | o | o | + | + | + | + | + | + | + | + |
| 0.2 | 60 | 0 | O | o | o | * | * | + | + | + | + | + |
| 55 | 5 | O | O | o | + | + | + | + | + | + | + |
| 50 | 10 | O | O | o | + | + | + | + | + | + | + |
| 45 | 15 | O | o | + | + | + | + | + | + | + | + |
| 40 | 20 | O | o | o | + | + | + | + | + | + | + |
| 100 | 0.1 | 60 | 0 | O | o | + | + | + | + | + | + | + | + |
| 55 | 5 | O | o | + | + | + | + | + | + | + | + |
| 50 | 10 | O | o | + | + | + | + | + | + | + | + |
| 45 | 15 | o | + | + | + | + | + | + | + | + | + |
| 40 | 20 | o | + | + | + | + | + | + | + | + | + |
| 0.2 | 60 | 0 | O | o | + | + | + | + | + | + | + | + |
| 55 | 5 | O | o | * | + | + | + | + | + | + | + |
| 50 | 10 | O | o | * | + | + | + | + | + | + | + |
| 45 | 15 | o | * | + | + | + | + | + | + | + | + |
| 40 | 20 | o | * | + | + | + | + | + | + | + | + |
Table 5.
The Hansen parameters for the solvents CH
3COOH, C
2H
5OH, and H
2O [
66,
67].
Table 5.
The Hansen parameters for the solvents CH
3COOH, C
2H
5OH, and H
2O [
66,
67].
| Solvent | ∂t | ∂d | ∂p | ∂h |
|---|
| CH3COOH | 21.4 | 14.5 | 8 | 13.5 |
| C2H5OH | 26.5 | 15.8 | 8.8 | 19.4 |
| H2O | 47.8 | 15.6 | 16 | 42.3 |
Table 6.
The fraction solubility parameters for the solvents CH
3COOH, C
2H
5OH, and H
2O [
66].
Table 6.
The fraction solubility parameters for the solvents CH
3COOH, C
2H
5OH, and H
2O [
66].
| Solvent | 100 fd | 100 fp | 100 fh |
|---|
| CH3COOH | 40 | 22 | 38 |
| C2H5OH | 36 | 18 | 46 |
| H2O | 18 | 28 | 54 |
Table 7.
The parameters of fractional solubility in the solution of 4% PVA–3% CS in the mixture of the solvents CH3COOH-C2H5OH-H2O.
Table 7.
The parameters of fractional solubility in the solution of 4% PVA–3% CS in the mixture of the solvents CH3COOH-C2H5OH-H2O.
| CH3COOH wt.% | C2H5OH wt.% | H2O
wt.% | 100 fd | 100 fp | 100 fh | fh − fp | fh − fd | fp − fd |
|---|
| 60 | 0 | 33 | 32.19 | 24.13 | 43.68 | 19.55 | 11.48 | −8.06 |
| 55 | 5 | 33 | 31.98 | 23.91 | 44.11 | 20.19 | 12.13 | −8.06 |
| 50 | 10 | 33 | 31.76 | 23.70 | 44.54 | 20.84 | 12.77 | −8.06 |
| 45 | 15 | 33 | 31.55 | 23.48 | 44.97 | 21.48 | 13.42 | −8.06 |
| 40 | 20 | 33 | 31.33 | 23.27 | 45.40 | 22.13 | 14.06 | −8.06 |
| 35 | 25 | 33 | 31.12 | 23.05 | 45.83 | 22.77 | 14.71 | −8.06 |
Table 8.
Diameter distributions of electrospun PVA nanofibers obtained from solutions of 4% PVA, 3% CS, and different ratios of acetic acid/ethanol with the fixed electrospinning parameters at a collector—needle distance of 140 mm, a feed rate of 0.2 mL/h, and a voltage of 28 kV.
Table 8.
Diameter distributions of electrospun PVA nanofibers obtained from solutions of 4% PVA, 3% CS, and different ratios of acetic acid/ethanol with the fixed electrospinning parameters at a collector—needle distance of 140 mm, a feed rate of 0.2 mL/h, and a voltage of 28 kV.
| Diameter (nm) | C2H5OH/CH3COOH Ratio (% w/w) |
|---|
| 0/60 | 5/55 | 10/50 | 15/45 | 20/40 |
|---|
| Mean | 330 | 320 | 301 | 285 | 337 |
| Standard deviation | 68 | 59 | 68 | 65 | 91 |
| Min | 134 | 147 | 110 | 121 | 170 |
| Max | 587 | 573 | 533 | 592 | 654 |
Table 9.
Diameter distribution of PVA-CS nanofibers obtained from a solution of PVA-CS (the ratio being 4–3) with an ethanol-acetic acid solvent ratio of 15–45 at a feed rate of 0.2 mL/h, a voltage of 28 kV, and with variation of the needle-collector distance.
Table 9.
Diameter distribution of PVA-CS nanofibers obtained from a solution of PVA-CS (the ratio being 4–3) with an ethanol-acetic acid solvent ratio of 15–45 at a feed rate of 0.2 mL/h, a voltage of 28 kV, and with variation of the needle-collector distance.
| Diameter (nm) | Needle-Collector Distance (mm) |
|---|
| 100 | 120 | 130 | 140 | 150 |
|---|
| Mean | 313 | 302 | 295 | 285 | 308 |
| Standard deviation | 77 | 75 | 70 | 65 | 76 |
| Min | 139 | 124 | 124 | 121 | 155 |
| Max | 646 | 562 | 546 | 592 | 540 |
Table 10.
Diameter distribution of PVA-CS nanofibers obtained from the solution of PVA-CS (the ratio being 4–3) with an ethanol-acetic acid ratio of 15–45 at a needle-collector distance of 140 mm, a voltage of 28 kV, and a variation of the feed rate from 0.1 to 0.4 mL/h.
Table 10.
Diameter distribution of PVA-CS nanofibers obtained from the solution of PVA-CS (the ratio being 4–3) with an ethanol-acetic acid ratio of 15–45 at a needle-collector distance of 140 mm, a voltage of 28 kV, and a variation of the feed rate from 0.1 to 0.4 mL/h.
| Diameter (nm) | Feed Rate (mL/h) |
|---|
| 0.1 | 0.2 | 0.3 | 0.4 |
|---|
| Mean | 311 | 285 | 300 | 335 |
| Standard deviation | 75 | 65 | 79 | 83 |
| Min | 154 | 121 | 134 | 131 |
| Max | 513 | 592 | 670 | 650 |
Table 11.
Diameter distribution of PVA-CS nanofibers obtained from the solution of PVA-CS (the ratio being 4–3) with an ethanol-acetic acid solvent ratio of 15–45 at a needle-collector distance of 140 mm, a feed rate of 0.3 mL/h, and a variationin voltage from 25 to 30 kV.
Table 11.
Diameter distribution of PVA-CS nanofibers obtained from the solution of PVA-CS (the ratio being 4–3) with an ethanol-acetic acid solvent ratio of 15–45 at a needle-collector distance of 140 mm, a feed rate of 0.3 mL/h, and a variationin voltage from 25 to 30 kV.
| Diameter (nm) | Voltage (kV) |
|---|
| 25 | 26 | 27 | 28 | 29 | 30 |
|---|
| Mean | 348 | 334 | 309 | 285 | 307 | 318 |
| Standard deviation | 102 | 99 | 91 | 65 | 96 | 114 |
| Min | 97 | 139 | 110 | 121 | 131 | 120 |
| Max | 652 | 734 | 600 | 592 | 644 | 689 |
Table 12.
The lattice parameters of PVA-CS nanofibers obtained from electrospun solutions with different ethanol-acetic acid ratios.
Table 12.
The lattice parameters of PVA-CS nanofibers obtained from electrospun solutions with different ethanol-acetic acid ratios.
| Lattice Parameters | Axial Lengths [Å] | Angles [°] | Cell Volume [Å3] | Crystal-Linity (%) |
|---|
| a | b | c | α | β | γ |
|---|
| Powder | CS | 15.7371 | 8.3352 | 3.0609 | 90 | 90 | 90 | 401.5017 | 48.29 |
| PVA | 15.2596 | 5.2416 | 9.7092 | 90 | 97.188 | 90 | 770.4844 | 57.69 |
| Ethanol-acetic acid | 0–60 | 12.6928 | 3.5873 | 10.8013 | 90 | 95.237 | 90 | 489.7613 | 60.64 |
| 5–55 | 7.6994 | 16.7927 | 6.8328 | 90 | 96.878 | 90 | 877.0803 | 54.64 |
| 10–50 | 15.9762 | 5.5865 | 9.3954 | 90 | 93.823 | 90 | 836.6833 | 62.36 |
| 15–45 | 12.7499 | 7.2561 | 8.637 | 90 | 92.457 | 90 | 798.3136 | 57.45 |
| 20–40 | 16.0564 | 4.1401 | 11.3214 | 90 | 93.814 | 90 | 750.9244 | 52.22 |
Table 13.
DSC data for the thermal desorption of PVA-CS nanofibers at different ethanol-acetic acid ratios in electrospinning solutions.
Table 13.
DSC data for the thermal desorption of PVA-CS nanofibers at different ethanol-acetic acid ratios in electrospinning solutions.
| Ethanol-Acetic Acid Ratio | ΔHPVA (J/g) | χPVA (%) | ΔHCS (J/g) | Tg (°C) | Tm (°C) |
|---|
| 0–60 | 57.22 | 38.15 | 5.86 | 75 | 222, 247 |
| 5–55 | 42.23 | 28.15 | 11.19 | 75 | 220, 249 |
| 10–50 | 44.09 | 29.39 | 9.79 | 84 | 220, 250 |
| 15–45 | 38.72 | 25.81 | 13.82 | 75 | 222, 251 |
| 20–40 | 53.73 | 35.82 | 2.56 | 87 | 223, 252 |
Table 14.
The stages of thermal decomposition and weight reduction of powder and nanofiber samples.
Table 14.
The stages of thermal decomposition and weight reduction of powder and nanofiber samples.
| Degradation Stages | Powder | PVA-CS Nanofibers with Different CH3COOH/C2H5OH Ratios |
|---|
| PVA | CS | 60/0 | 55/5 | 50/10 | 45/15 | 40/20 |
|---|
| First stage | Range (°C) | 25–202 | 25–177 | 25–172 | 25–172 | 25–172 | 25–172 | 25–172 |
| Peaks (°C) | 112 | 67 | 52; 114 | 52; 112 | 52; 112 | 52; 107 | 52; 112 |
| Weight loss (%) | 3.04 | 5.21 | 5.42 | 7.34 | 5.63 | 8.58 | 5.63 |
| Second stage | Range (°C) | 202–367 | 177–462 | 172–377 | 172–377 | 172–377 | 172–377 | 172–377 |
| Peaks (°C) | 297 | 302 | 267 | 272 | 272 | 267 | 272 |
| Weight loss (%) | 83.37 | 77.04 | 63.79 | 64.19 | 62.94 | 61.40 | 64.31 |
| Third stage | Range (°C) | 367–527 | | 377–547 | 377–547 | 377–547 | 377–547 | 377–547 |
| Peaks (°C) | 422; 442; 462 | | 429; 459 | 422; 437 | 427 | 422; 437; 457 | 427 |
| Weight loss (%) | 10.32 | | 17.64 | 18.43 | 16.72 | 16.97 | 16.97 |
Table 15.
Parameters of tensile properties of PVA-CS nanofibers.
Table 15.
Parameters of tensile properties of PVA-CS nanofibers.
| Ethanol-Acetic Acid Ratio | Tensile Strength [MPa] | Elongation at Break [%] | Young’s Modulus [MPa] |
|---|
| Vertical | Horizontal | Vertical | Horizontal | Vertical | Horizontal |
|---|
| 0–60 | 5.9 ± 1.0 | 5.7 ± 0.6 | 14.0 ± 1.7 | 17.1 ± 0.5 | 343 ± 34 | 289 ± 74 |
| 5–55 | 5.6 ± 1.5 | 1.6 ± 0.4 | 12.1 ± 1.6 | 13.3 ± 1.1 | 425 ± 73 | 246 ± 35 |
| 10–50 | 4.7 ± 0.4 | 1.9 ± 0.4 | 11.8 ± 1.5 | 14.0 ± 2.1 | 427 ± 50 | 270 ± 40 |
| 15–45 | 7.9 ± 1.0 | 4.9 ± 1.0 | 13. ± 0.5 | 16.4 ± 0.8 | 546 ± 32 | 333 ± 24 |
| 20–40 | 4.5 ± 0.9 | 2.9 ± 0.2 | 12.7 ± 2.0 | 14.1 ± 1.9 | 398 ± 48 | 330 ± 29 |


 ,
, 


