Article

Applied Investigation of Methyl, Ethyl, Propyl, and Butyl Mercaptan as Potential Poisons in the Gas Phase Polymerization Reaction of Propylene

by
Joaquin Hernandez-Fernandez
1,2,3,4,*,
Juan Esteban Herrera Zabala
4 and
Edgar Marquez
5
1
Chemistry Program, Department of Natural and Exact Sciences, San Pablo Campus, University of Cartagena, Cartagena 131001, Colombia
2
Chemical Engineering Program, School of Engineering, Universidad Tecnologica de Bolivar, Parque Industrial y Tecnológico Carlos Vélez Pombo, Km 1 Vía Turbaco, Turbaco 130001, Colombia
3
Department of Natural and Exact Science, Universidad de la Costa, Barranquilla 080002, Colombia
4
Grupo de Investigación en Ciencias e Ingeniería, Chemistry Program, Department of Natural and Exact Sciences, San Pablo Campus, University of Cartagena, CECOPAT&A, Cartagena 131001, Colombia
5
Grupo de Investigaciones en Química y Biología, Departamento de Química Y Biología, Facultad de CienciasBásicas, Universidad del Norte, Carrera 51B, Km 5, Vía Puerto Colombia, Barranquilla 081007, Colombia
*
Author to whom correspondence should be addressed.
Polymers 2024, 16(20), 2851; https://doi.org/10.3390/polym16202851
Submission received: 26 July 2024 / Revised: 11 August 2024 / Accepted: 15 August 2024 / Published: 10 October 2024
(This article belongs to the Section Polymer Chemistry)

Abstract

:
The polypropylene (PP) synthesis process is crucial in the plastics industry, requiring precise control as it directly impacts the catalytic activity and the final product’s performance. This study investigates the effects of trace amounts of four different mercaptans on the polymerization of propylene using a fourth-generation Ziegler–Natta (ZN) catalyst. Various concentrations of these mercaptans were tested, and results showed that their presence significantly reduced the melt flow index (MFI) of the final PP. The most notable MFI decrease occurred at 37.17 ppm of propyl mercaptan and 52.60 ppm of butyl mercaptan. Methyl and ethyl mercaptan also reduced the MFI at lower concentrations, indicating that mercaptans act as inhibitors by slowing down the polymerization process and reducing the fluidity of molten PP. The highest MFI increase was observed at lower concentrations of each mercaptan, suggesting that smaller molecular inhibitors require less concentration. This trend was also seen in the catalyst’s productivity, where lower concentrations of methyl mercaptan reduced PP production more effectively than higher concentrations of butyl mercaptan. Fourier transform infrared spectroscopy (FTIR) identified interactions between the mercaptans and the ZN catalyst. Computational analysis further supported these findings, providing insights into the molecular interactions and suggesting possible inhibition mechanisms that could impact the final properties of polypropylene.

1. Introduction

The fourth-generation Ziegler–Natta catalyst plays a fundamental role in the industrial manufacture of polyolefins, especially iso-tactic polyethylene and polypropylene, being recognized as one of the most prominent catalysts in this process [1,2,3,4]. In 1953, Karl Ziegler made a crucial discovery when he observed that certain transition metal compounds, such as titanium, vanadium, and zirconium, combined with aluminum alkyls, could catalyze the polymerization of alkenes. This discovery was significant and promising, given that this process could be carried out at temperatures and pressures lower than those required in radical polymerization [5,6]. The following year, Giulio Natta used a similar catalyst system to synthesize polymers with a stereoregular structure. This catalyst system was named the Ziegler–Natta catalyst. This discovery inaugurated the era of the mass production of polymers with stereoregular structures [7].
A typical Ziegler–Natta catalyst system comprises four essential components: TiCl4 acting as a catalyst precursor, MgCl2 as support, electron donors (Lewis bases), and alkyl aluminum as a catalyst activator. The primary function of the Ziegler–Natta catalyst lies in activating and controlling the olefin polymerization reaction. The transition metal compound acts as the active center of the catalyst, initiating the polymerization reaction and allowing the incorporation of the monomers. Meanwhile, the cocatalyst stabilizes the catalytic system and regulates the reaction rate [8,9].
Ziegler–Natta polymerization catalysts based on titanium (TiCl4/MgCl2) show high sensitivity to certain organic compounds that act as inhibitors. Some contaminants affect polymerization catalysts differently, depending on their degree of deactivation. For example, in the production of polypropylene (PP), the most harmful contaminants for catalytic deactivation include carbonyl sulfide (COS), carbon monoxide (CO), hydrogen sulfide (H2S), acetylene (C2H2), oxygen (O2) and arsine/phosphine. In linear low-density polyethylene (LLDPE) processes, the most concerning contaminants in the ethylene monomer feed stream are CO, O2, H2S, acetylene, and CO2 [10,11,12,13,14].
This research focuses on four types of organic compounds: methyl mercaptan, ethyl mercaptan, propyl mercaptan, and butyl mercaptan, which contain sulfur in their structure. They act as inhibitors of the Ziegler–Natta catalyst in the production of polypropylene. This study is not intended to carry out a detailed computational study. Therefore, molecular simulations based on density functional theory (DFT) studies were implemented in a complementary manner to explore the interactions between the molecules of these inhibitors and TiCl4, focusing on its influence on the catalytic activity, the melt flow rate, the molecular weight (Mw), and the production per metric ton of PP. This helped to complement and corroborate the results obtained with the experimental tests. Although numerous computational studies have focused on aspects such as the formation of the first active site of Ti, chain growth, the scaffold, its interaction with electron donors, and the interactions between different classes of molecule inhibitors and the active Ti center, no specific experimental and computational investigations have been carried out on these proposed compounds. This lack of prior research makes this study particularly innovative.

2. Materials and Methods

2.1. Standards and Reagents

Four types of mercaptans were used (methyl mercaptan, ethyl mercaptan, propyl mercaptan, and butyl mercaptan) provided by Merk in Darmstadt, Germany, and with a purity of 99.98%. For PP production, polymer-grade propylene (Shazand Petrochemical, Arak, Iran) was used, along with a fourth-generation Ziegler–Natta catalyst with MgCl2 support and, as an internal donor, diisobutyl phthalate (DIBP) supplied by Sud Chemie, Munich, Germany; The activator used was triethyl aluminum (TEA) of 99.97% purity from Merk, Darmstadt, Germany, diluted in n-heptane provided by Tosoh Finechem Corporation, Shiba, Tokyo. Additionally, tri-n-heptane and acetone were used. Another reagent was cyclohexylmethyldimethoxysilane (CMDMS) from Merk, Germany, used as an external donor, along with hydrogen and nitrogen.

2.2. Polymerization

Figure 1 corresponds to the PP polymerization scheme. Capital letters are assigned to each line of the process. Propylene (A), nitrogen (B), hydrogen (C), and mercaptan (D) are involved in the process. Gases generated during the reaction (E) come from the catalyst before (F) and inside (G) the reactor. Non-propylene that remains unreacted (H) is recycled in the process. The degassing stage of the PP resin (I) involves gases entrained (J) by nitrogen and water vapor, leading to the final resulting PP (K), as detailed in Table 1.
Once the polymerization was completed, acetone was added to stop the process, and subsequently, the suspension was transferred to a receiving flask maintained under a nitrogen (N2) atmosphere. The synthesized powder was washed thrice with 200 mL of heptane and then dried under vacuum at room temperature. The resulting polymer was stored under darkness, nitrogen, and controlled temperature conditions. Crucially, all steps of the procedure were meticulously carried out in a nitrogen atmosphere to avoid exposure to air.
The standard polymerization conditions were as follows: polymerization temperature of 72 °C, catalyst amount of 5.1 kg/h, triethylaluminium activator (TEAL), activator concentration of 0.26 kg/h, 30.1 g/h of H2 and 1.3 TM/ h of propylene at a pressure of 28 bar.
To ensure mercaptan concentrations in the propylene line, an Agilent Technologies 7890B GC-MS was used. The PP resin samples were analyzed using the Agilent 7694E headspace sampler, with a cycle time of 60 min and an oven set to 150 °C, according to Hernández’s method [15].

2.3. Melt Flow Index (MFI) and Average Molecular Weight (Mw)

The melt flow index (MFI) was determined using a Tinius Olsen MP1200 plastome, Horsham, PA, USA. The apparatus’s cylinder was at an operating temperature of 232 °C, and a 2.3 kg piston was used to displace the molten material. With the MFI data obtained, the Bremner method was applied to evaluate the average molecular weight of each polypropylene (PP) sample.

2.4. Infrared (IR) Spectroscopy

Infrared (IR) spectroscopic studies were conducted using a Nicolet iN10MX spectro-scope from Thermo Fisher Scientific (Thermo Scientific, Waltham, MA, USA) equipped with an iN10Z unit. Attenuated total reflection (ATR) mode was used. Spectra were recorded with a resolution of 4 cm−1, spanning a range from 400 to 4000 cm−1, allowing sensitive and accurate identification of various absorption bands.

2.5. Molecular Electrostatic Potentials

For this research, optimized geometry calculations for the various proposed inhibitors were carried out using Gaussian 16 Rev.A03 software with the B3LYP basis set, which has been recognized for its effectiveness in determining molecular structures. Electron densities and electrostatic potentials were then calculated using the 6-311G(d,p) basis set. The proposed molecules were surrounded by a three-dimensional surface that revealed the contour of constant electron density. On this surface, molecular electrostatic potentials were calculated and plotted. These potentials can be visualized with different levels of detail, but our current qualitative goal is to identify the sites most susceptible to nucleophilic, electrophilic, or free radical attacks.

2.6. Fukui Function

UKA FOKUI 2.00 software was used to obtain the quantitative values of the chemical descriptors and the local reactivity properties. These calculations offer detailed information on the local characteristics and reactivity of the inhibitors, the active site of the ZN catalyst, and its support, providing a deeper understanding of its behavior and chemical properties.
Theoretical Complement of the Fukui Function
Assessment of the Global and Local Reactivity Descriptors Methyl Mercaptan, Ethyl Mer-captan, Propyl Mercaptan and Butyl Mercaptan
The most effective method for studying the local selectivity of an inhibitor is through the condensed Fukui function. This function provides insight into how the electron densi-ty within the system changes. Mathematically, Fukui functions are derived from partial derivatives that relate the electron density to the number of electrons at a particular loca-tion within the molecule. These derivatives enable the quantification of that location’s ability to donate or accept electrons through nucleophilicity indices f+ (r), electrophilicity f-(r), and radical f 0 (r), where qN + 1, qN − 1, and qN are the electronic population of atom k in anionic, cationic, and neutral systems, respectively [16].
fk+ = qN + 1 − qN
fk− = qNqN − 1

3. Results

During the chain propagation step in polypropylene (PP) synthesis, the transfer of propylene to Ti-PP occurs, where the olefin is incorporated into the PP-alkyl chain. This phase is sensitive to contaminants that act as inhibitors of various polarities and interact with the active Ti center, being influenced by different factors. In the case of the proposed mercaptans, a preference for coordination with the Ti center on the active Ti-MgCl2 surface is observed. This dynamic shows how the thiol group present in the mercaptans competes with the cocatalyst (TEAL) to bind to the Ti active site of –TiCl3, affecting the bonding of the olefin in the formation of propylene complexes and their insertion, therefore inhibiting the catalytic activity of the ZN system [17].
Initially, the sulfur in the structure coordinates the mercaptans with the Ti of the TiCl4/MgCl2 complex due to the predominance of the two free electron pairs of sulfur over those of propylene, which interact with Ti. The S-Ti interaction prevails over the formation of Ti-propylene complexes since the latter presents fewer barriers and a lower energy gain. To mitigate these interactions, it is essential to eliminate the impurities present in the system and resume the polymerization process.
Points I, J, and K were analyzed when detecting mercaptans at a trace level in the degassing process of the PP resins, as shown in Figure 1. This analysis gave important quantitative results, which were used to support the study on the inhibitory capacity of the samples of the different mercaptans reflected in Table 1.
The efficiency of the Ziegler–Natta catalyst is considerably affected by to the presence of inhibitors, which are adsorbed on the active surface of the TiCl4 crystalline network of the catalyst, favoring the loss of productivity. This interaction brings with it a lack of productivity due to an interference in the ability of the co-catalyst (TEAL) to compete for the active sites of the catalyst since it is occupied by the inhibitor that partially deactivates the catalyst, decreasing its catalytic activity, as reported in previous research by Hernandez-Fernandez [18,19].

3.1. Analysis of the Impact of Different Mercaptans on the Reduction of Metric Tons of Polypropylene (PP) Produced Depending on the Concentration at Various Sampling Points

The loss of productivity of the Ziegler–Natta catalytic system during the manufacture of PP or copolymers is directly related to the intervention of interactions that generate impurities with the Ti active center, generating a loss in the production of the desired polymer [20,21].
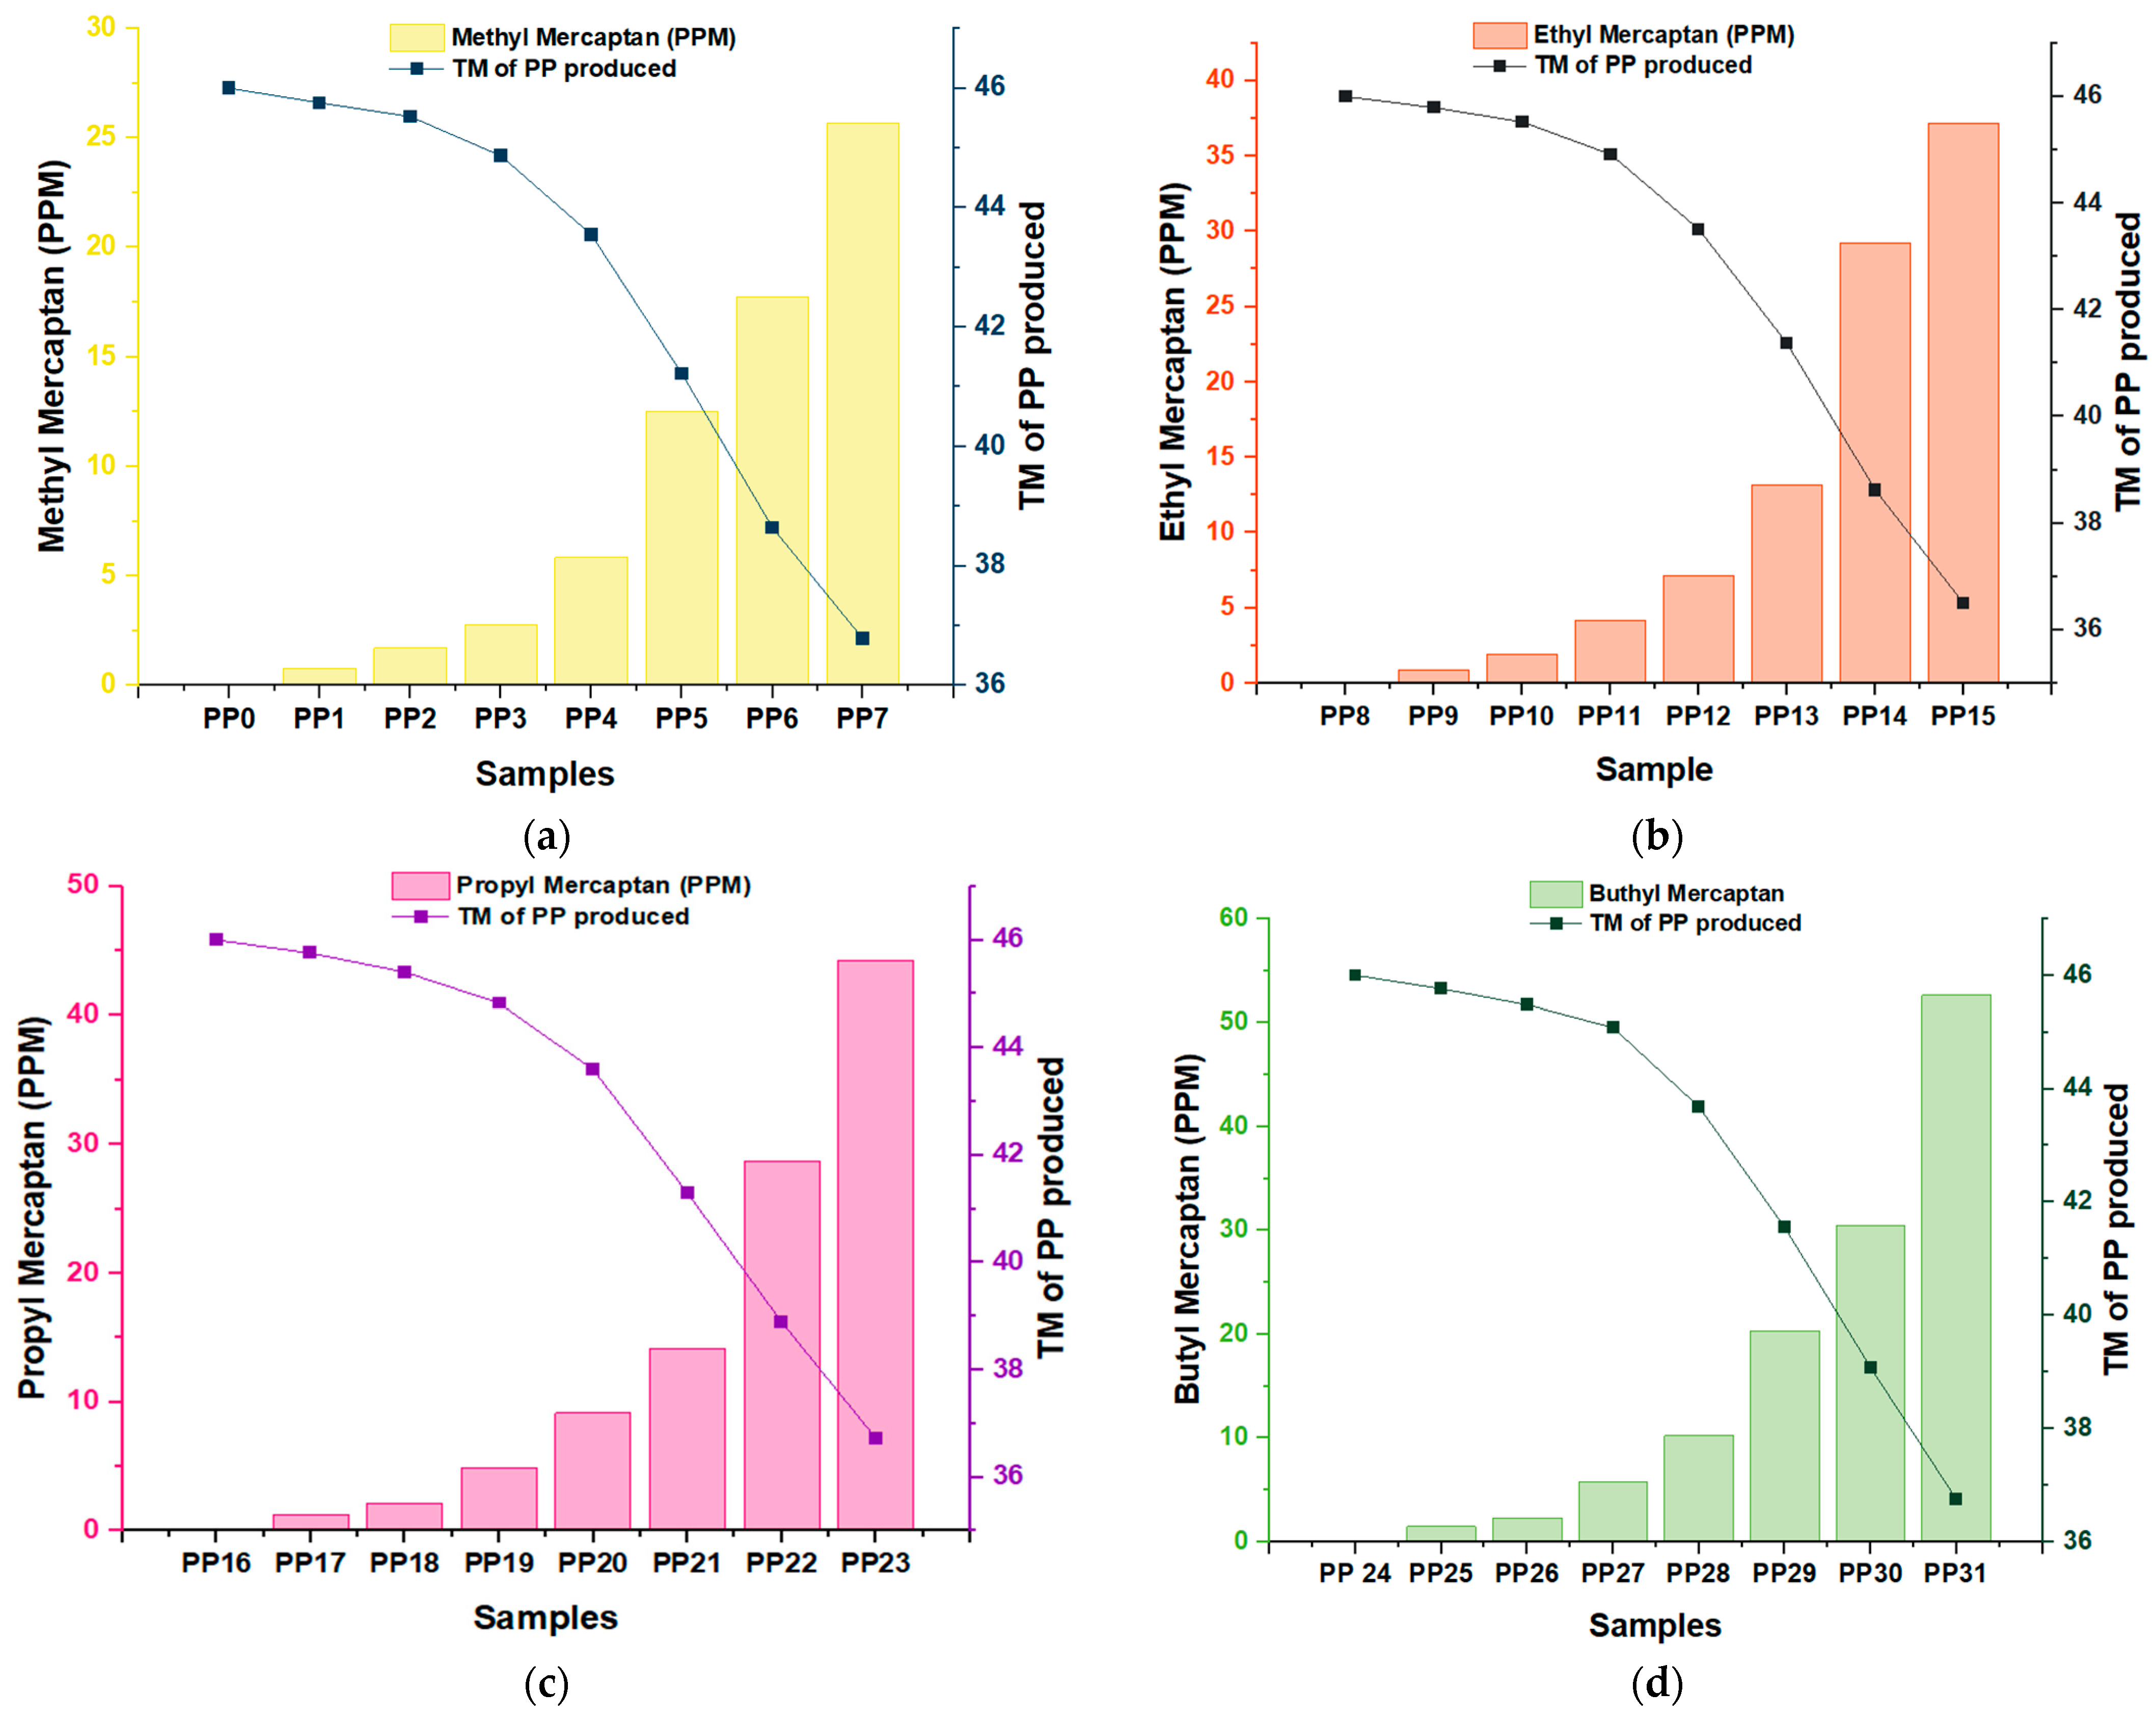
The impact of various mercaptans on the reduction of catalytic activity was analyzed by considering multiple types of specific samples. The graphs in Figure 2 provide a detailed representation of how this decrease in production efficiency per metric ton of PP manifests as a function of the concentration of the inhibitors in each type of sample (PPn). In the first sample of PP0 (Graph a), PP8 (Graph b), PP16 (Graph c), and PP24 (Graph d) without any mercaptan (Figure 2), a catalyst productivity of 46 MT/kg was obtained in each graph. This indicates that the Ziegler–Natta catalyst worked well without adding mercaptan and achieved high polypropylene production. In sample PP1, where approximately 0.78 ppm of methyl mercaptan was added (Figure 2a), there was a production of 45.75 MT/kg, showing a production loss of 0.25 MT/kg; on the other hand, the ethyl mercaptan in sample PP8 with a concentration of 0.87 ppm (Figure 2b) had a production of PP of 45.79 TM/kg, and with this a production loss of 0.21 TM/kg was seen with a ppm concentration of ethyl mercaptan 0.09 times greater than the supplied concentration of methyl mercaptan. However, the production loss of ethyl mercaptan was lower than the production loss of methyl mercaptan. To confirm this trend, we analyzed the graph of another proposed mercaptan and compared it with graph (a). For this, propyl mercaptan was used (Figure 2c) because the concentration in ppm (1.23 TM/kg of propyl mercaptan) is 0.36 times greater than ethyl mercaptan and 0.45 times greater than the concentration supplied. Of methyl mercaptan, however, it can be seen that the production loss of propyl mercaptan was equal to the production loss of methyl mercaptan; despite the difference in concentration mentioned above, this same trend continues in the graph of butyl mercaptan (Figure 2d). This shows that methyl mercaptan acts as an inhibitor with a lower ppm concentration than the rest of the proposed mercaptans.
This is due to the difference in the molecular size of methyl mercaptan concerning the other inhibitors; by coordinating the sulfur with the titanium (S-Ti) on the active surface of the catalyst, the size of the chain allows the mercaptan to adsorb and couple correctly. This is a better way to achieve more effective inhibition. When analyzing all the graphs together, we see that, in each PP sample, when the molecular size of the inhibitory species increased, a higher concentration of butyl mercaptan, propyl mercaptan, and ethyl mercaptan was needed (just in this order, from highest to lowest concentration) to assimilate or equalize the production loss per metric ton of methyl mercaptan.
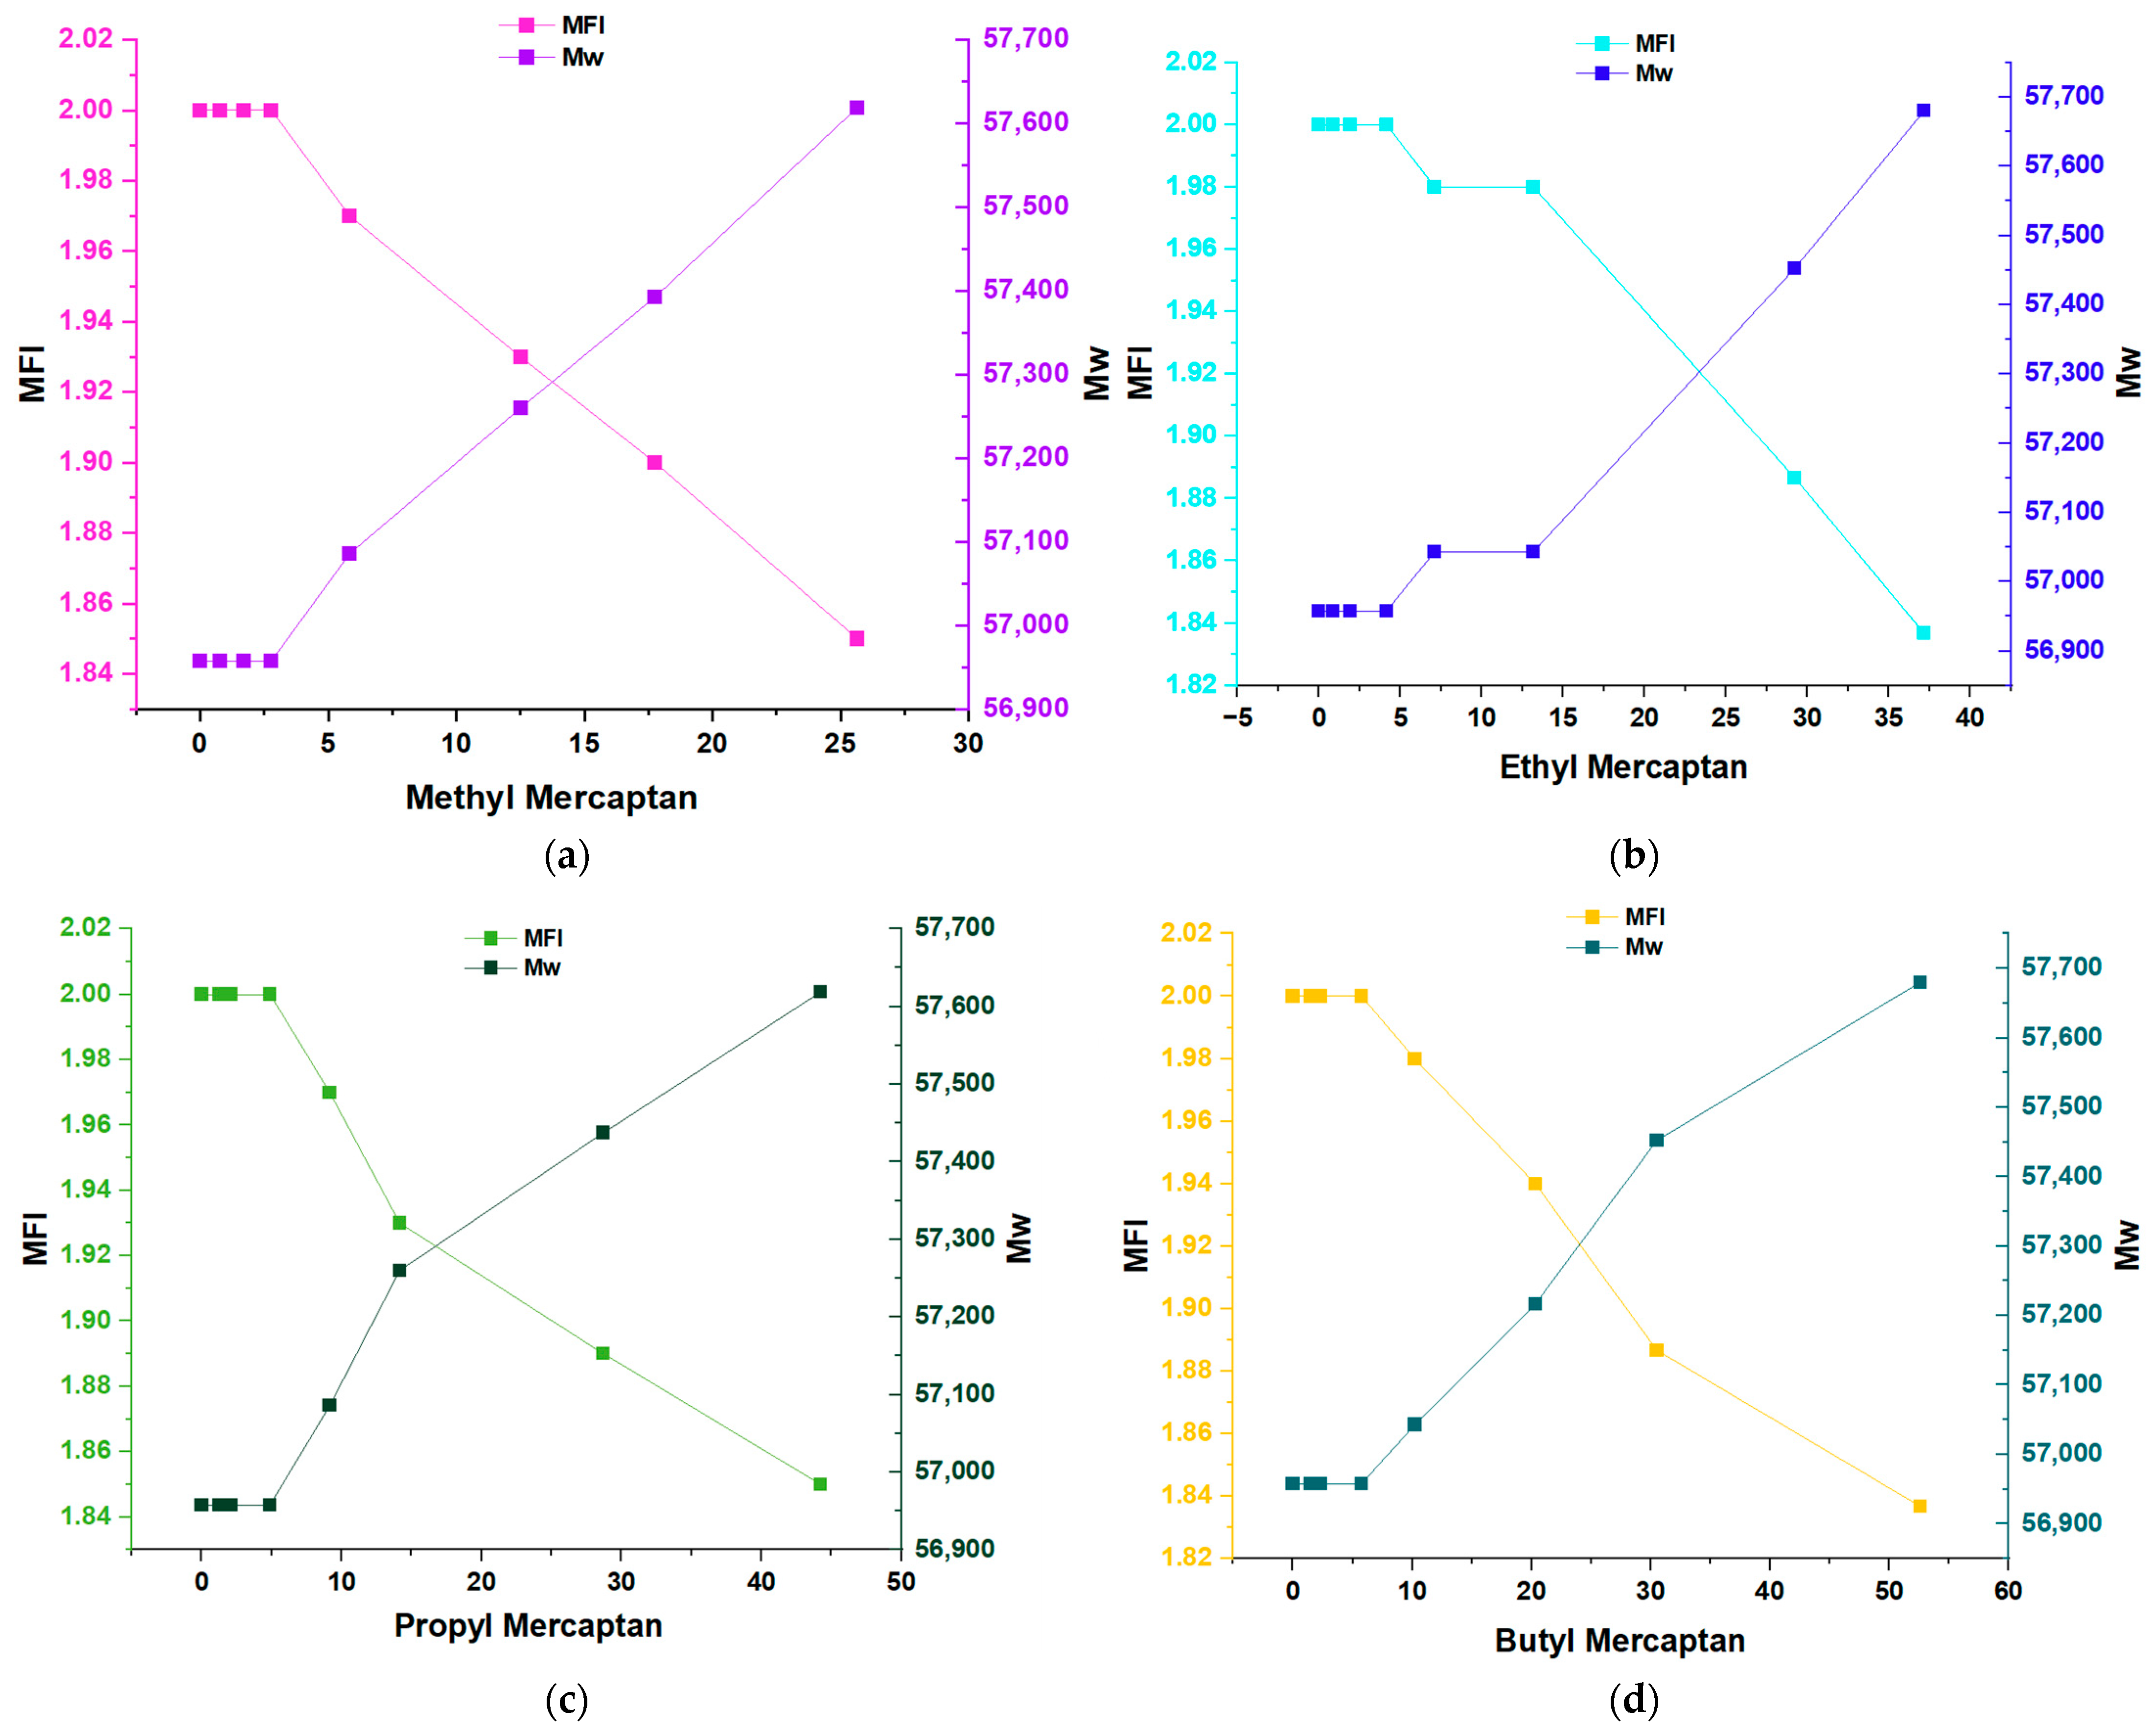
The evaluation of the change in the average molecular weight (Mw) of the samples studied using the Bramner equation shows that in (Figure 3a–d), an increase in Mw was noted as the ppm concentration of the samples increased. In four different inhibitors, it can be seen that the value of Mw was 56,950 kDalton in the first four concentrations of each mercaptan; from this point on, the value of Mw increased constantly until reaching a value close to 57,700 kDalton.
This phenomenon indicates that these four types of mercaptans: methyl mercaptan, ethyl mercaptan, propyl mercaptan, and butyl mercaptan, exert a substantial impact on the properties of the material by forming stable complexes during the polymerization reaction. This influences the structure of the material, the polymer chain, and, therefore, its final properties, such as its average molecular mass (Mw).

3.2. Impact and Effects on Flow Index (MFI) and Mw of PP

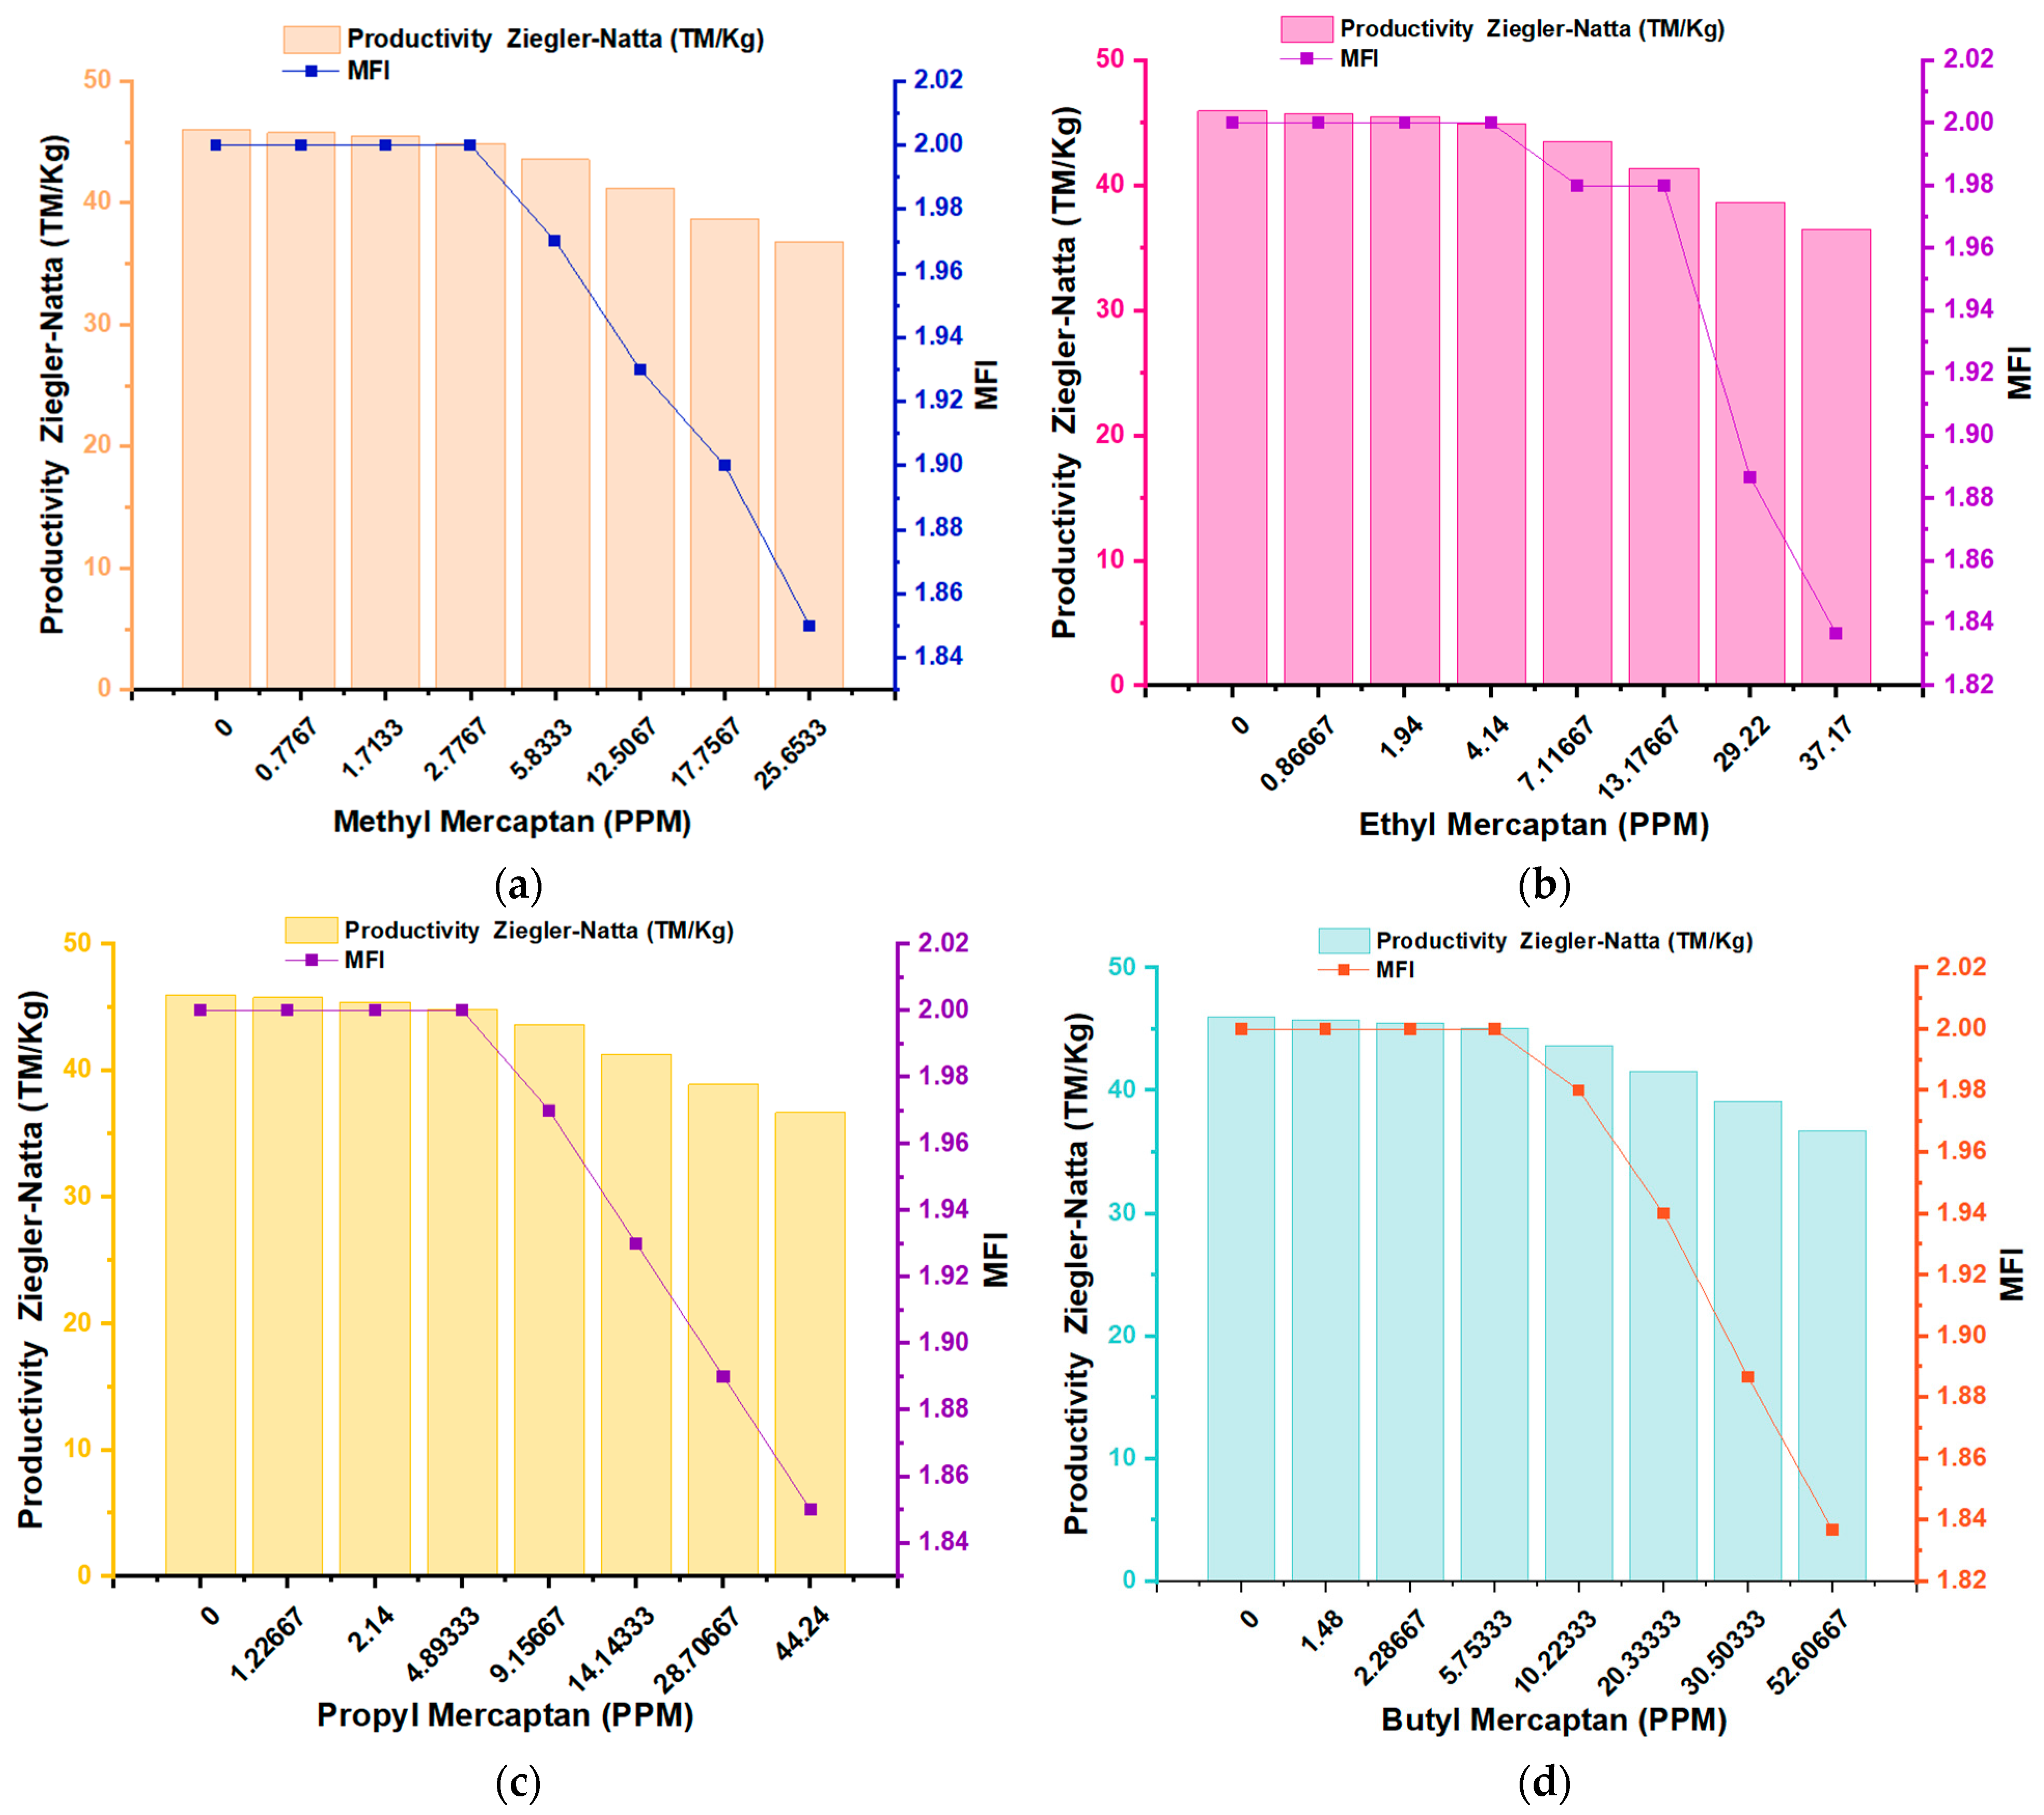
In the analysis of the graphs of the different mercaptans regarding the MFI variable (Figure 4), it can be seen that the highest MFI was for a concentration of 0 ppm of the inhibitors; on the contrary, when the inhibitors reached their highest concentrations of (25.65 ppm) for methyl mercaptan, (37.17 ppm) for ethyl mercaptan, (44.24 ppm) for propyl mercaptan and (52.60 ppm) for butyl mercaptan, there was a decrease in the MFI for all samples, where it can be seen that the MFI value remained constant at 2.0 g/10 min in the first four concentrations of the different mercaptans. From this, we know how the MFI value decreases depending on the ppm concentration. In particular, it can be seen in graph (b), which corresponds to ethyl mercaptan, how after lowering the MFI value, it remains constant in two different concentrations, this being the value of 1.89 g/10 min; this reveals the effect of inhibitors on properties such as the melt index of the polymer. In addition, we can estimate the processing of the melt since the higher the MFI values, the greater the fluidity of the melt, and the lower the MFI values, the lower the fluidity of the polymer melt [22,23]. The MFI measurements in each copolymer sample were carried out in triplicate for each concentration of the mercaptans present.
The Bramner equation shows the relationship between the MFI and the average molecular weight (Mw). In Figure 5a–d, an inversely proportional relationship is observed between the MFI and the Mw. Samples with an MFI of 2.0 g/10 min appeared with a Mw that was around 56,950 kDalton. The MFI between 1.97 and 1.93 g/10 min showed a Mw between 57,500 and 57,340 kDaltons. The samples of the copolymers with the highest MFI values ranged between 25.7 and 27.1 g/10 min, with a Mw that ranged between 35,304 and 34,854 kDaltons. It is important to highlight that an increase in molecular weight can negatively affect the processability of the polymer. Polymers with high molecular weight often exhibit higher viscosities, which complicates their handling during processes such as extrusion or injection molding. In applications that require greater flexibility or ease of processing, excessive molecular weight could be counterproductive.

3.3. Molecular Electrostatic Potential

The molecular electrostatic potential (MEP) map is a crucial tool for studying molecular structure and global reactivity, providing a detailed representation of a molecule’s charge distribution and electron availability. This method uses colors to outline the different regions of the molecule based on their electron density [24,25]. In the MEP, red areas indicate a higher electron density, suggesting the presence of nucleophilic sites in the molecule, that is, regions with a high probability of donating electrons. In contrast, the blue areas represent an electron deficiency, signaling the presence of electrophilic sites, where the molecule has a greater affinity for accepting electrons.
These characteristics are essential to understanding the chemical reactivity of the molecule since they allow us to predict how it will interact with other chemical species. By identifying the nucleophilic and electrophilic sites in the MEP, it is possible to determine which areas of the molecule are most likely to participate in chemical reactions and how they may interact with other substances.
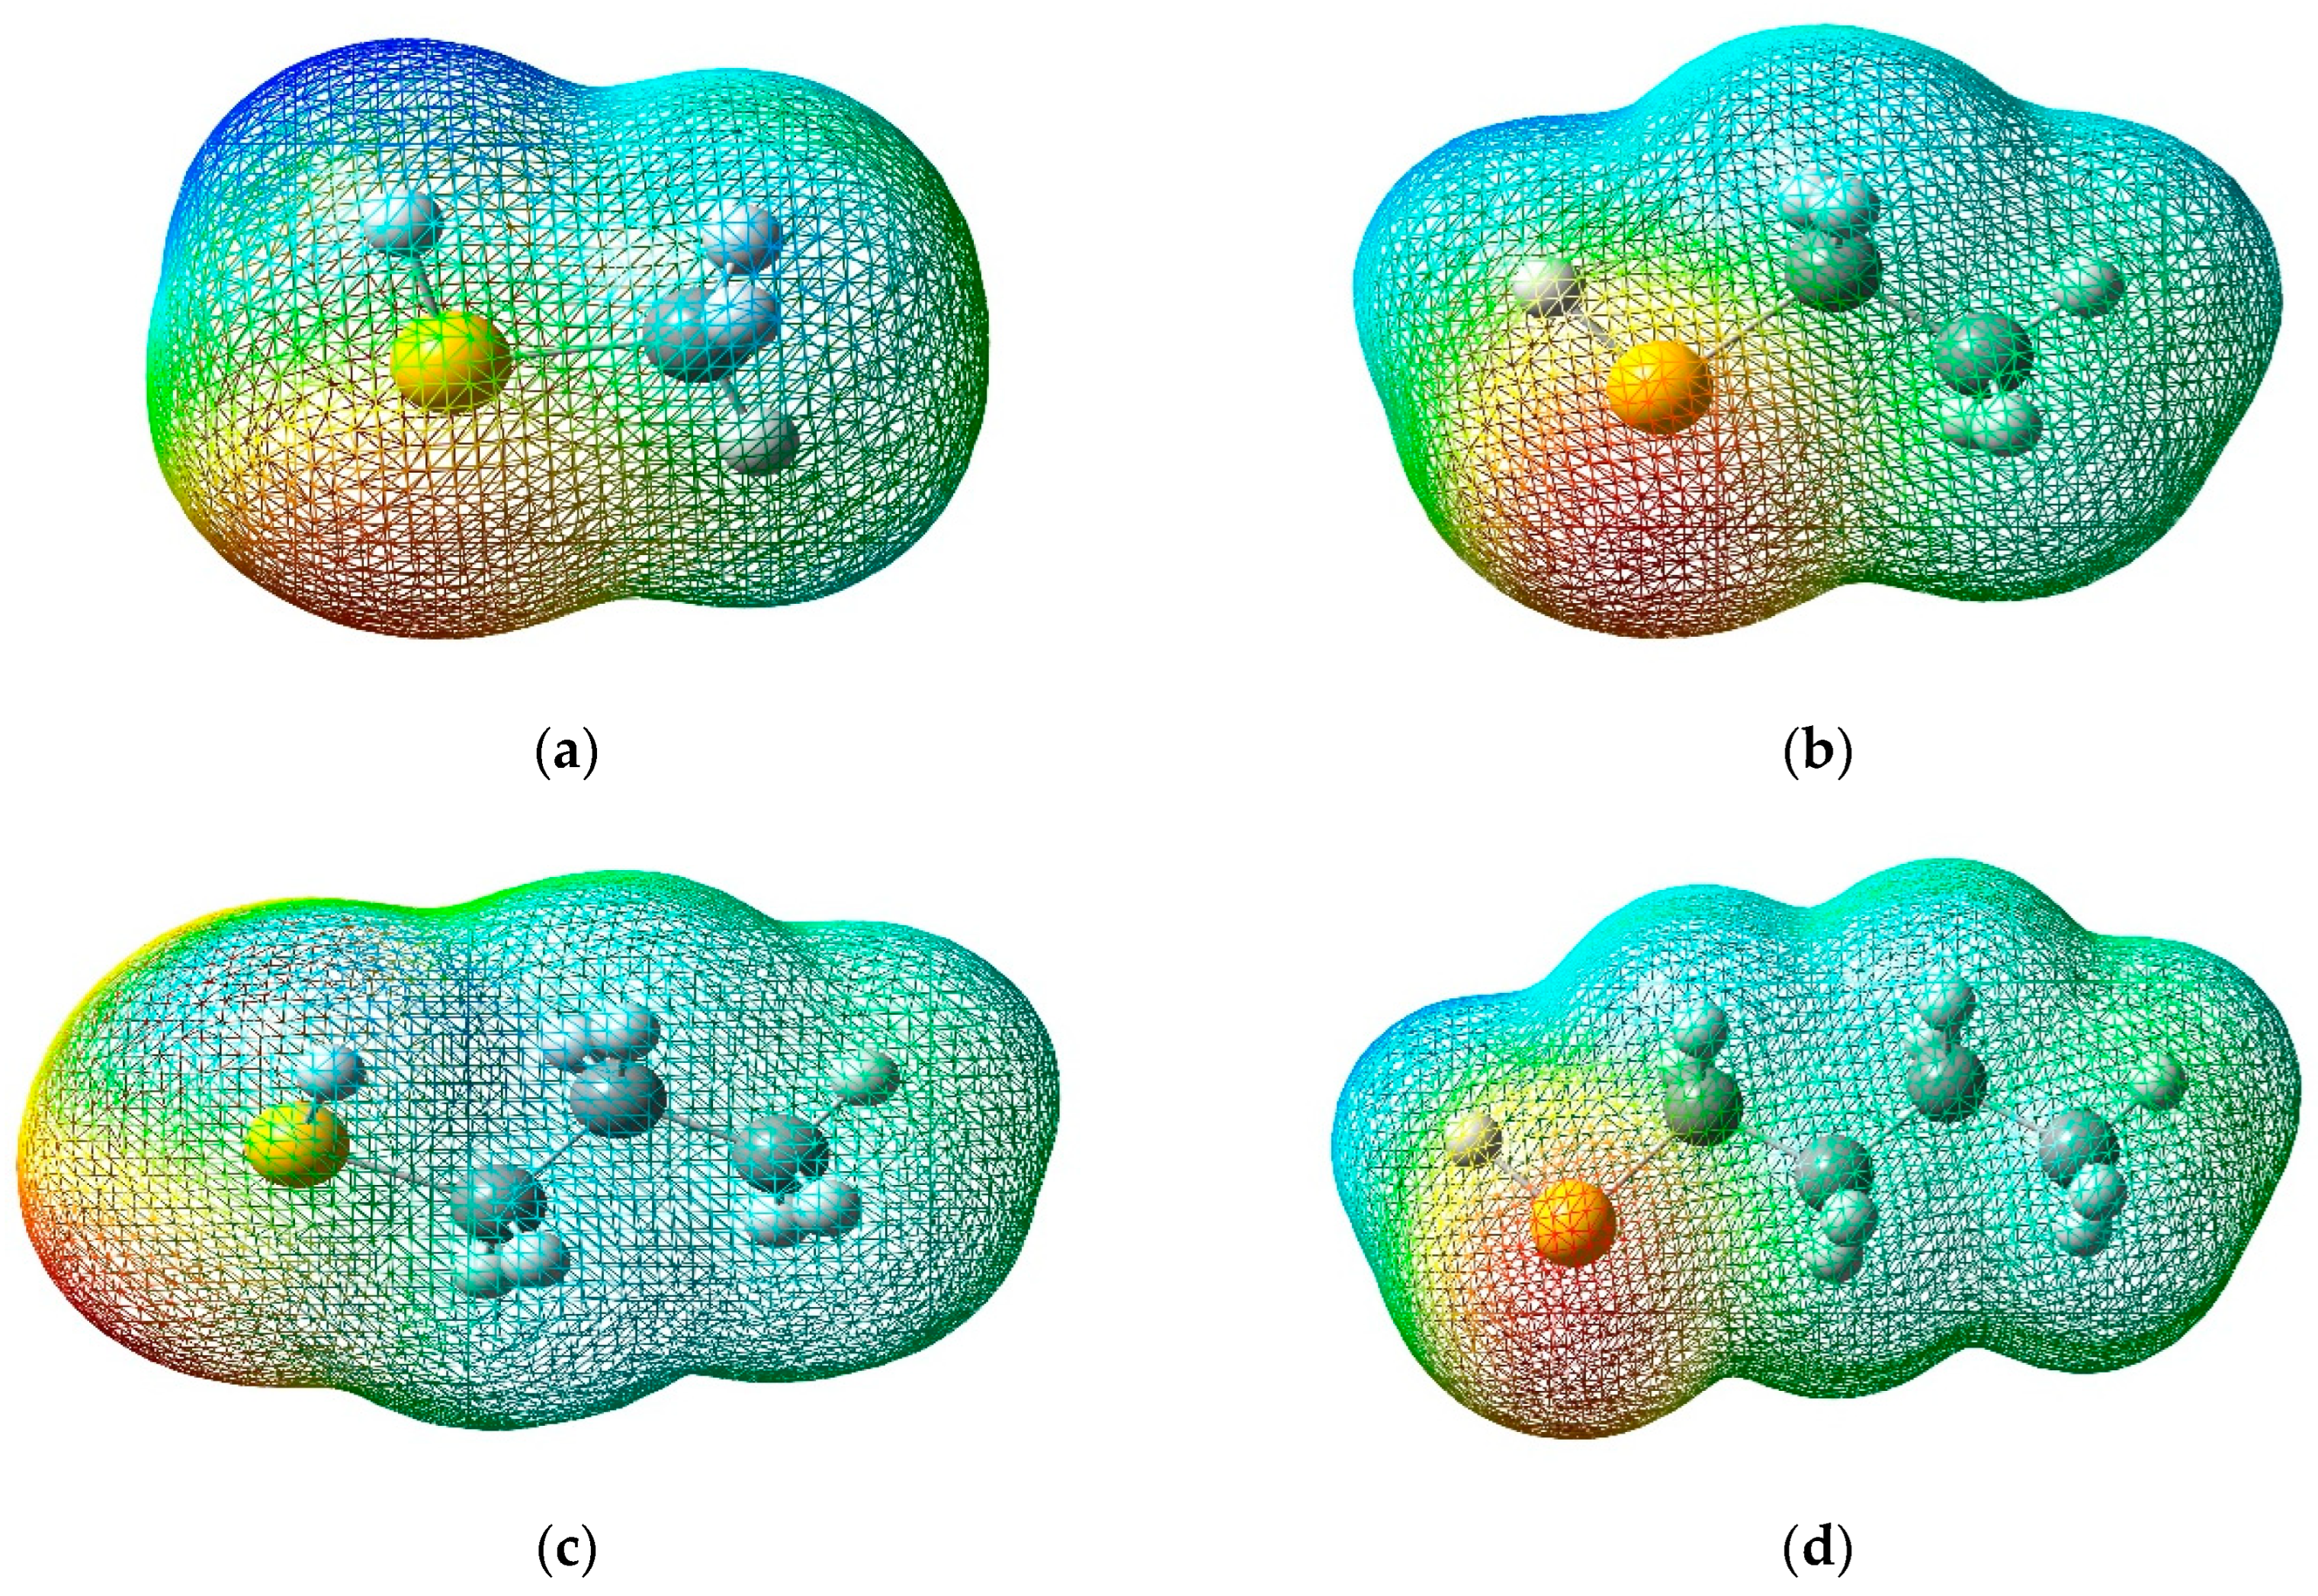
Figure 6 shows a three-dimensional representation of the electrostatic effect, covering a range of values that goes from −3.907 × 10⁻² to 3.907 × 10⁻² for methyl mercaptan, −2.854 × 10⁻² up to 2.854 × 10⁻² for ethyl mercaptan, −2.867 × 10⁻² to 2.867 × 10⁻² for propyl mercaptan and −2.885 × 10⁻² and 2.885 × 10⁻² for butyl mercaptan.
According to Figure 6, for these four types of mercaptans, the blue, green, and red colors represent the regions with the most positive electrostatic potential, zero potential, and the most negative electrostatic potential, respectively. The red and yellow regions are mainly found on the sulfur atom, indicating that it is the most reactive site for an electrophilic attack. On the other hand, the blue regions around the hydrogen atoms are the most reactive sites for a nucleophilic attack.
This MEP information is relevant to the ZN catalyst inhibition approach because it suggests that the proposed mercaptans can act as inhibitors by interacting with the active sites on the catalyst. The central region of the Ziegler–Natta catalyst stands out for its blue tone, located on the titanium atom. The blue tone shown in Figure 7 suggests a more significant electron deficiency in that area and, therefore, a greater tendency to accept electrons.
This information provided by the MEP indicates that the proposed mercaptans could act as inhibitors of the ZN catalyst. This is caused by the interactions with the catalyst in its electrophilic regions. Thus, they can form a stable complex and consequently negate the interactions. The catalyst may have the desired reagent (be it AlEt3 or the same PP), preventing the catalytic process from being carried out correctly [15,16,26,27,28,29,30,31,32,33,34,35,36,37,38,39,40,41,42,43,44,45,46,47,48,49,50].

3.4. Analysis of Methyl Mercaptan, Ethyl Mercaptan, Propyl Mercaptan, and Butyl Mercaptan as Inhibitors of the ZN Catalyst

This study focuses on studying the trends of mercaptans as inhibitors of the ZN catalyst using density functional theory (DFT) at the B3LYP/6-311G(d,p) level. The Fukui index was used to investigate local reactivity to predict the most likely sites where nucleophilic and electrophilic attacks may occur. The repercussions that a compound with the ability to inhibit and thus reduce catalytic activity can have are often due to how the inhibitor molecule binds to the surface of the metal. This interaction can occur in two ways: physical (physisorption) or chemical (chemisorption); this depends directly on the strength of this connection. For chemisorption, one of the reactive molecules acts as an electron pair donor; on the other hand, a different molecule acts as an electron pair acceptor [30,31,32].

Fukui Features

To understand the Fukui function, one must know that it is divided into two parts: there is the nucleophilic Fukui function, ƒr+, which indicates the areas with a greater probability of suffering a nucleophilic attack by electron-rich species, and in contrast to this there is the electrophilic Fukui function, ƒr, which shows the areas where there is a greater probability of an electrophilic attack by a species lacking electrons. In this way, the Fukui function helps in understanding and identifying the sites most likely to react in a molecule. The dual descriptor Δfr is used, understood as the difference between ƒr+ and ƒr. If Δf has a positive character, it indicates a greater probability of being attacked by a nucleophilic species in those areas; in contrast to this, if Δfr is obtained with a negative character, this indicates a greater probability of being attacked by an electrophilic species. To have a greater understanding of the reactive nature of the molecule, calculations and tables were carried out for the quantitative interpretation of the Fukui functions (ƒ0, ƒ+ and ƒ) for each site of the molecule. The information it provides helps to interpret the qualitative reactivity and, with this, the selectivity of specific sites within the molecule. Table 2, Table 3, Table 4 and Table 5 show values associated with the Fukui functions of each type of mercaptan, thereby identifying which areas of the molecule are most likely to react and how this can happen—a reaction with different chemical species [33,34].
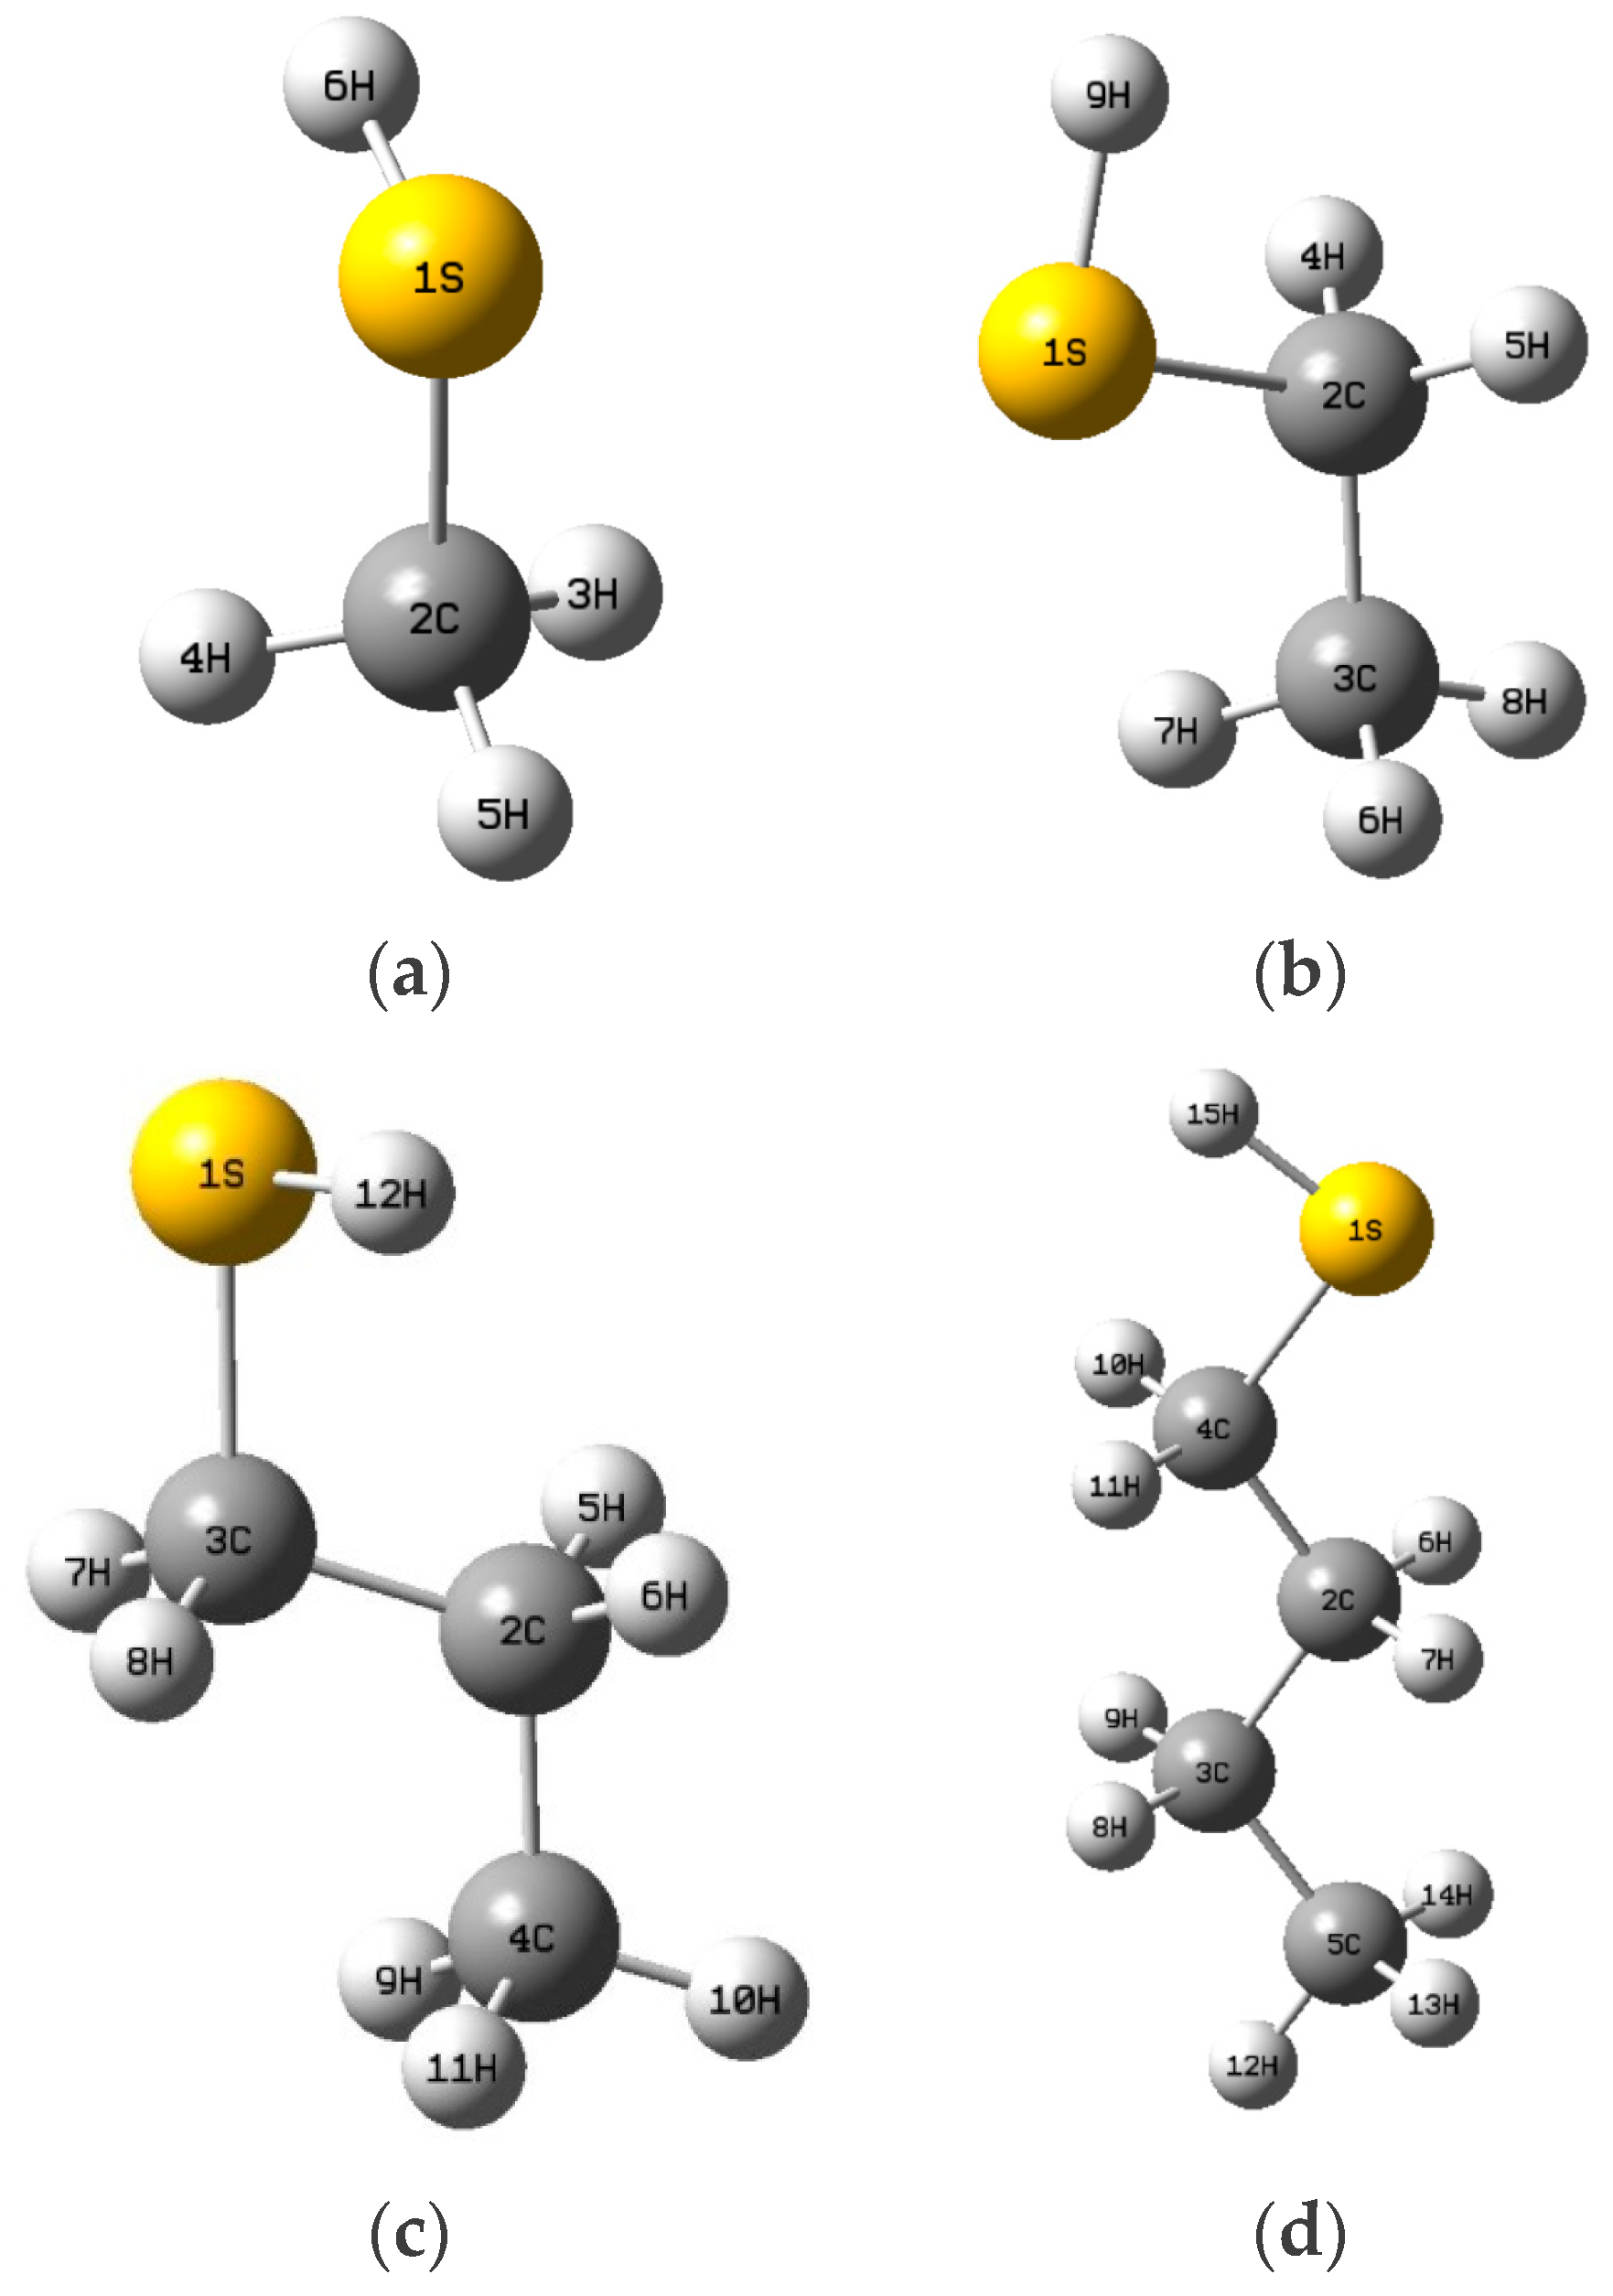
Calculations of the Fukui function for each mercaptan have allowed the identification of the sites most likely to undergo nucleophilic attack by the mercaptans (see Table 1, Table 2, Table 3, Table 4 and Table 5). Higher f values are obtained at atom number 1, representing sulfur (see Figure 8), with values ranging from f (0.9095–0.7416), also highlighting its susceptibility to electrophilic attacks. In contrast, for methyl mercaptan, the 2C carbon atom is more prone to nucleophilic attacks with an f+ value (0.6773) compared to other atoms. For ethyl mercaptan, the trend of the carbon atom prevails with an f+ value (0.2927), and the 3C carbon atom shows a more notable susceptibility with an f+ value (0.3019). On the other hand, for propyl mercaptan and butyl mercaptan, the 2C carbon atom changes its trend, drastically decreasing the probability of a nucleophilic attack; however, the electrophilic trend increases significantly with an f+ value (0.3692) for the 3C carbon atom, and additionally, the 4C carbon atom increases with an f+ value (0.3444). For butyl mercaptan, the 3C carbon atom decreases drastically for f+ (0.1348) and slightly for the 4C carbon atom f+ (0.3328).
A greater reactivity and probability of electrophilic attacks are interpreted in the case of sulfur atoms (represented by the number 1S). Likewise, the quantitative values show that sulfur is the atom most prone to radioactive attacks. This can be evidenced since they present Δf (−0.866) for methyl mercaptan, Δf (−0.84) for ethyl mercaptan, Δf (−0.7994) for propyl mercaptan, and Δf (−0.6933) for butyl mercaptan.
The results in Table 6 reveal that the chlorine atoms in the two, three, and four positions of TiCl4 are particularly susceptible to electrophilic attacks. In contrast, the titanium atom at position one is the primary site for a nucleophilic attack.
Furthermore, it was observed that both the titanium in position one and the chlorine atoms in positions two, three, and four are the most vulnerable to free radical attacks (see Figure 9).
Regarding the support spatial conformation of the Ziegler–Natta catalyst (a) and its active site (b). e (Table 7), it has been identified that the atoms in positions two and nine are particularly susceptible to nucleophilic attacks. These atoms are of particular interest since, according to previous research, alcohols react with magnesium cations in these positions. To support these findings, data have been compiled in Table 7, which presents the specific values of f, f+, f0, Δf for each of the atoms on the catalyst’s surface. These values provide a solid basis for understanding the tendency of the atoms above to be affected by nucleophilic attacks.

3.5. Experimental Analysis by FTIR of the Reaction Product of ZN With Each Mercaptan of Interest

Analyzing the Fourier transform infrared (FTIR) spectra of the ZN catalyst samples after their reactions with each of the four mercaptans under study in this experiment offers a detailed view of their interactions with the active center of titanium. FTIR spectra reveal significant changes in the mercaptans’ structure and chemical bonds when they come into contact with the catalyst, providing a deeper understanding of the catalysis processes and the surface dynamics in Ziegler–Natta systems. Figure 7 shows five spectra identified as ZN–methyl mercaptan, ZN–ethyl mercaptan, ZN–propyl mercaptan, ZN-butyl mercaptan, and ZN. The Ti–Cl bond is detected in the region from 618 to 555 cm−1 for the ZN complex [37]. This indicates the formation of complexes or the adsorption of species on the catalytic surface, where the Ti–Cl bond is identified in the range of 603 to 617 cm−1, showing a closeness in the region of this bond.
In each spectrum, a peak can also be seen at 1510 cm−1, which is characteristic of the Cl–Mg bond typical of the catalyst support. Peaks are observed between 1474 cm−1 and 1510 cm−1, corresponding to the stretching vibration of the C–H bonds, particularly associated with the -CH2 group. Between 2972 and 2990 cm−1, peaks typical of -CH3 are identified. These alkyl groups are present in the aliphatic chain of the four mercaptans investigated in this work. In the ZN spectra with each mercaptan, peaks are observed between 450 and 480 cm−1, which, compared with the literature, are characteristic of the vibration of the Ti–S bond. A shift of the peak to the left can also be observed for the Ti–Cl bond at 493 cm−1.
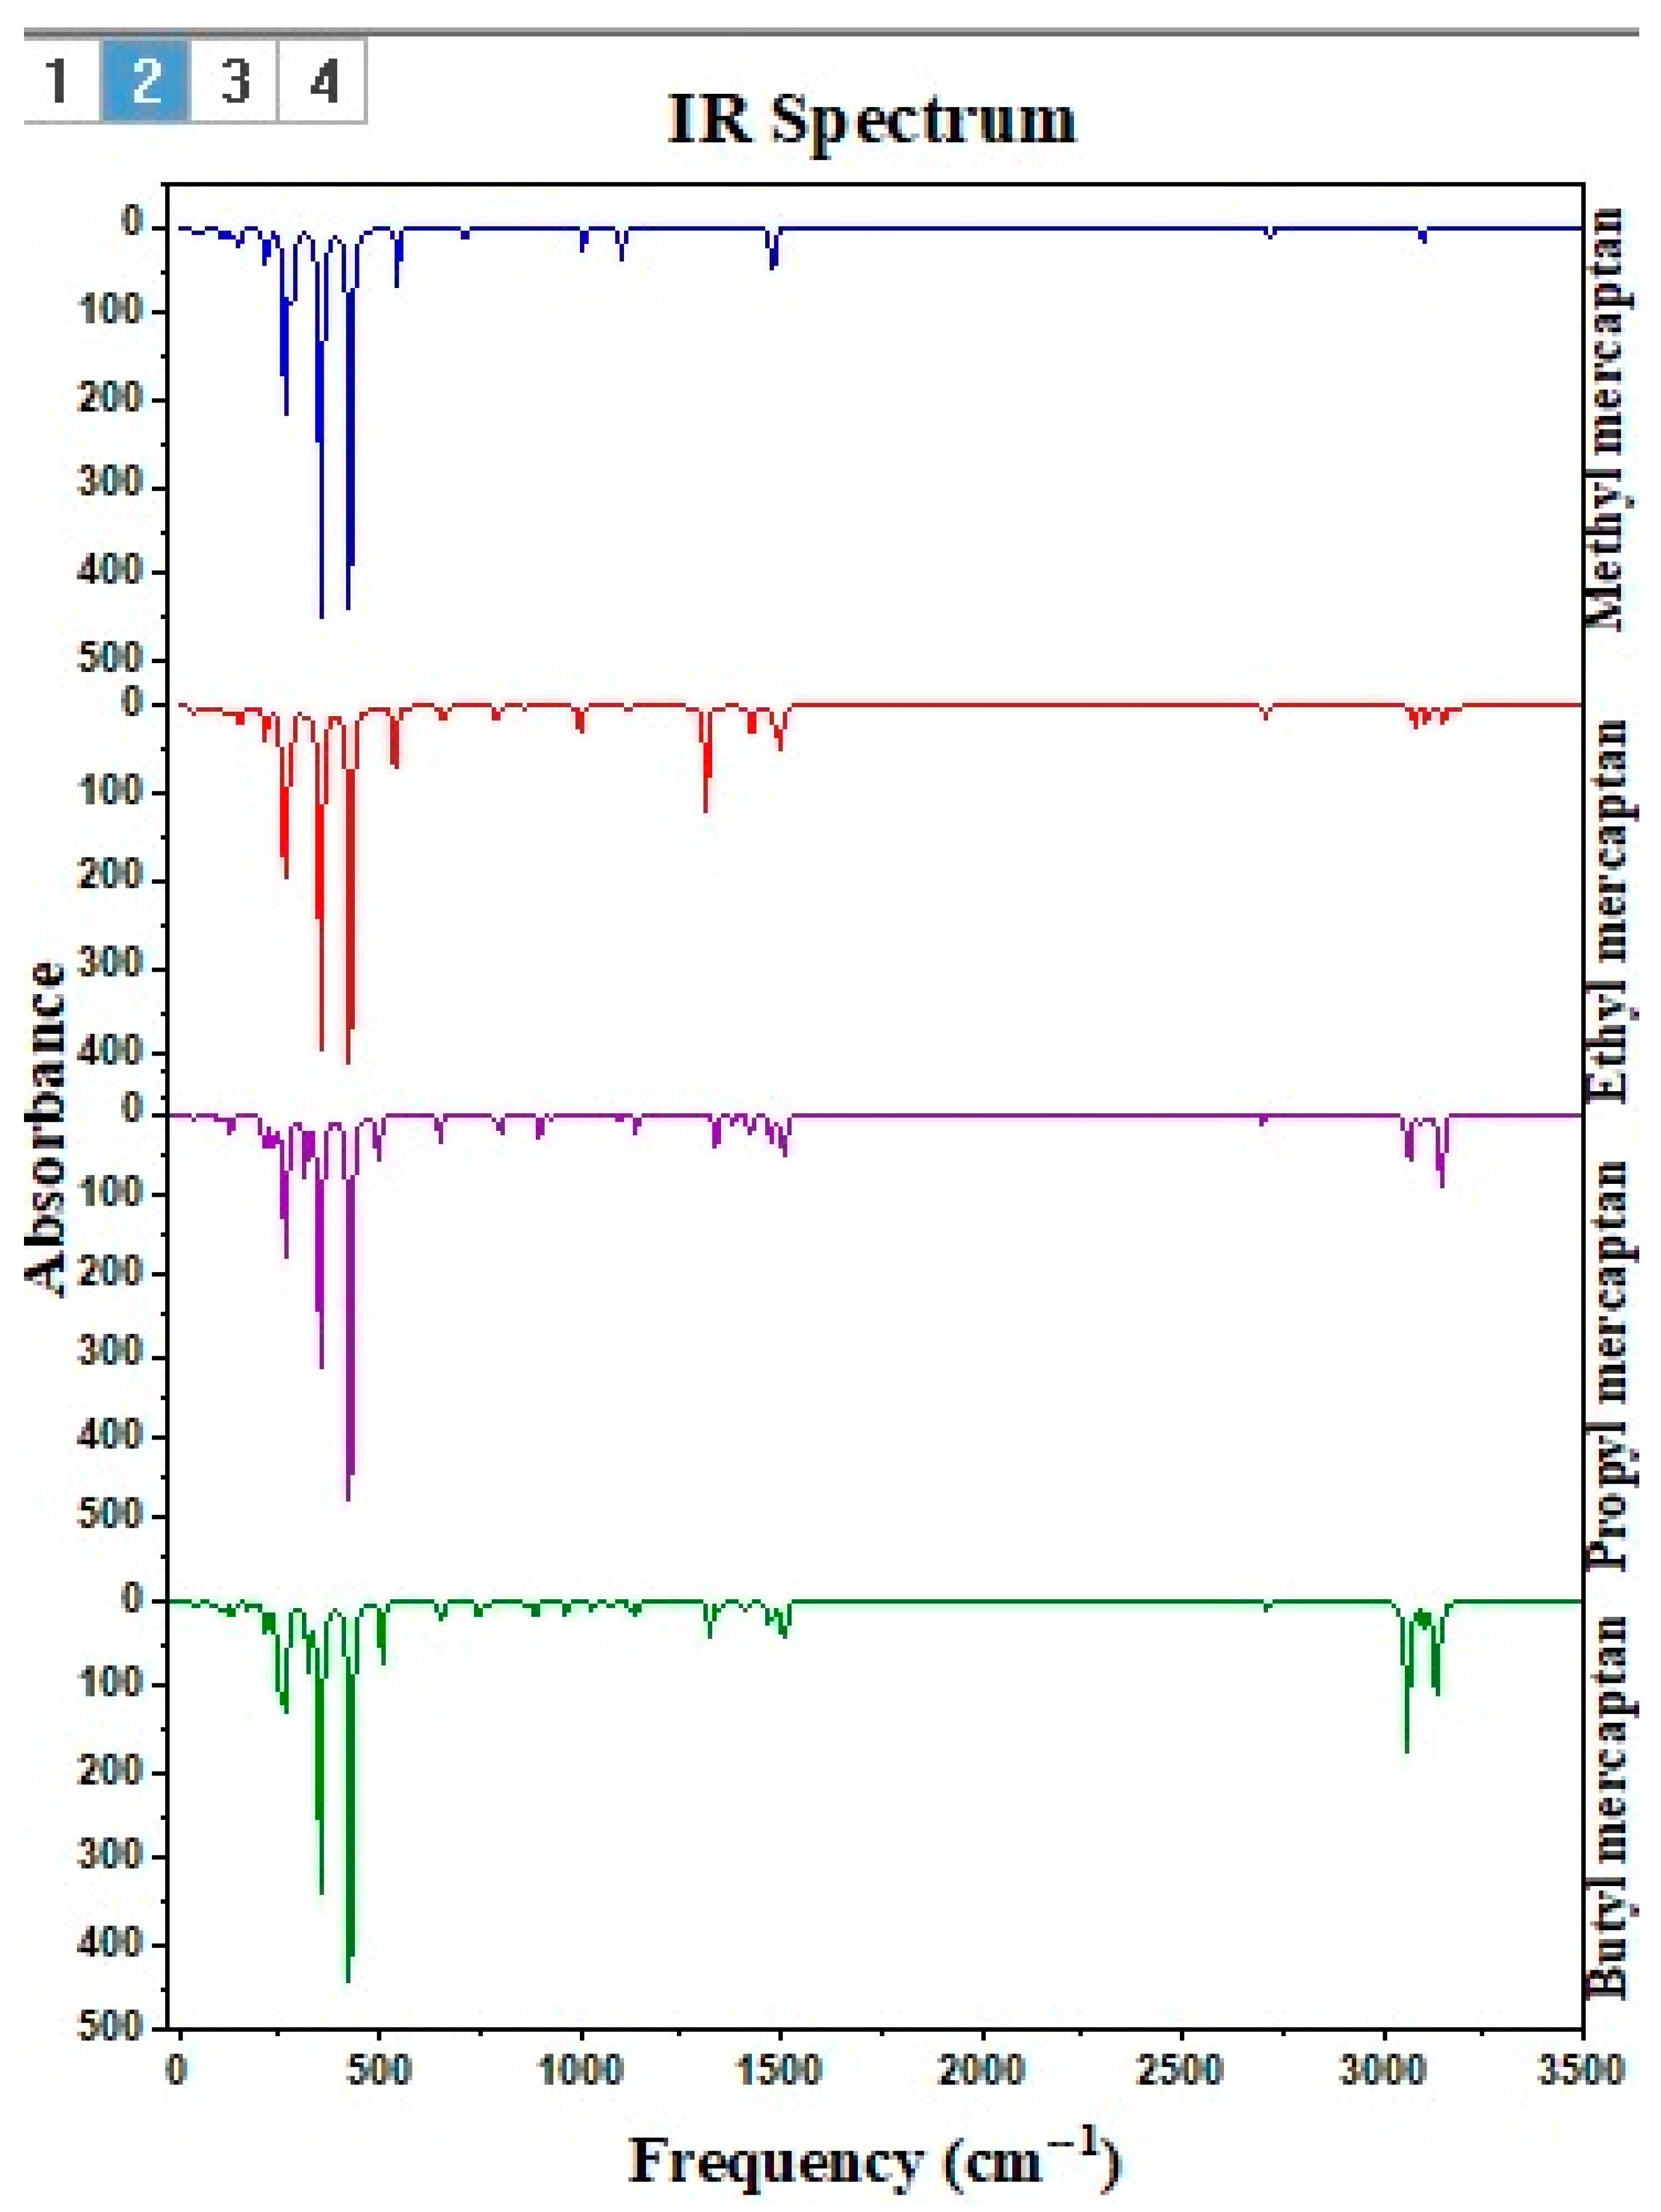
Figure 10 shows the possible torsion–rotation for a robust parallel band centered at 644 cm−1 and a weaker band centered at 727 cm−1 for the C–S bond in the Ti–S–C junction in the ZN–methyl mercaptan complex. Such bands in similar regions were also identified when FTIR analyzed pure methyl mercaptan [38,39].
Table 8 shows the frequencies identified in Figure 10 for the titanium–sulfur (Ti-S), titanium–chlorine (Ti–Cl), chlorine–magnesium (Cl–Mg), sulfur–carbon (S–CH3 and S–CH2) and carbon–hydrogen (CH3 and CH2) for the complexes ZN–methyl mercaptan, ZN–ethyl mercaptan, ZN–propyl mercaptan and ZN–butyl mercaptan. In the spectra corresponding to the mercaptans, specifically ZN–methyl mercaptan, ZN–ethyl mercaptan, ZN–propyl mercaptan, and ZN–butyl mercaptan, a peak of crucial importance was identified that confirms the reactions indicated in Table 9, corresponding to the Cl–Ti–S–CH2 bond and the Cl–Ti–S–CH3 bond in the literature. The values reported for this type of vibration correspond to 644 and 728 cm−1.

4. Discussion

This study of the presence of mercaptans in the Ziegler–Natta (ZN) catalyst was carried out to determine and evaluate the percentage of production loss measured in metric tons per kilogram of solvent (TM/kg) and, in addition, to analyze the effects of these compounds on the properties and final characteristics of polypropylene (PP). To measure the efficiency of the four proposed mercaptans, a comparison was made with a study previously carried out by Hernández Fernández on an evaluation of the reactivity of methanol and hydrogen sulfide waste with the catalyst [35]. Mercaptans are the direct focus in the inhibitory interaction of methanol since mercaptans are sulfur analogs of alcohols [36]. For this, it is necessary to delve into the mercaptans’ possible interactions with the ZN catalyst’s active site during the synthesis of PP to determine its inhibitory tendency. It can be seen in the results presented in Table 1 that the most potent inhibitory capacity belongs to methyl mercaptan since it produces a productivity loss of 0.54% with a concentration of only 0.78 ppm compared to butyl mercaptan, which has with the lowest inhibitory capacity among the four mercaptans with a loss of 0.51% but requiring a concentration of 1.48 ppm. When comparing these results with the methanol present in the study carried out by Hernández, the methanol does not manage to match the values of the productivity loss of the mercaptans, being a value of methanol 0.35% with a concentration of 4.3 ppm, evidencing a much higher concentration but with a lower productivity loss value. The computational study was carried out to support the experimental research following specific guidelines, such as the analysis of the chemical nature of the inhibitors. Previous research has identified other inhibitors that affect ZN productivity [15,16,40,41,42,43,44,45,46,47,48,49,50].
The UKA FOKUI 2.00 software was used to obtain the quantitative values of the mercaptans to determine the local reactivity properties (see Table 2, Table 3, Table 4 and Table 5), where the numerical values of the sulfur atoms found are shown. In position one (see Figure 8), it is observed that the Δfr for the sulfur atoms are Δf (−0.866) for methyl mercaptan, Δf (−0.84) for ethyl mercaptan, Δf (−0.7994) for propyl mercaptan, Δf (−0.6933) for butyl mercaptan, showing a nature susceptible to electrophilic attacks. Hernandez’s research shows the oxygen atom present in position five (see Figure 10) in the methanol molecule also presents this same tendency but with a lower Δfr (see Table 5), this being Δf (−0.280), evidencing a low susceptibility to electrophilic attacks compared to mercaptans. In the electrostatic potential (MEP) map, the values varied from −3.907 × 10⁻² to 3.907 × 10⁻² for methyl mercaptan, from −2.854 × 10⁻² to 2.854 × 10⁻² for ethyl mercaptan, from −2.867 × 10⁻² to 2.867 × 10⁻² for propyl mercaptan, and from −2.885 × 10⁻² to 2.885 × 10⁻² for butyl mercaptan, the sites most prone to electrophilic attack being those around the atom of sulfur. Similarly, the methanol molecule exhibits an electrostatic potential range varying from −6.288 × 10⁻² to 6.288 × 10⁻² eV. This shows that mercaptans exhibit a superior inhibitory effect at a quantitative and qualitative level. This research could lead to more in-depth studies on the inhibitory capacity of mercaptans in the polymerization process at an industrial level, which is a novel and unexplored area.

5. Conclusions

This research demonstrates that trace-level concentrations of four different mercaptans negatively affect the production of polypropylene (PP) and the catalytic activity of the Ziegler–Natta (ZN) catalyst. Increasing mercaptan concentrations inversely impacted the ZN catalyst’s productivity, with methyl mercaptan being the most potent inhibitor, reducing productivity with the smallest concentration. The study also identified an inverse relationship between the polymer’s melt index and molecular weight (Mw), while higher mercaptan concentrations correlated directly with increased Mw. These findings indicate that mercaptans significantly alter the polymer structure, potentially affecting its performance during manufacturing and in subsequent applications, primarily due to their strong tendency to donate electrons to the titanium active center of the ZN catalyst, thus acting as inhibitors in the polymerization process.

Author Contributions

Conceptualization, J.H.-F., J.E.H.Z. and E.M.; Methodology, J.H.-F. and J.E.H.Z.; Software, J.H.-F. and E.M.; Validation, J.H.-F.; Formal analysis, J.H.-F., J.E.H.Z. and E.M.; Investigation, J.H.-F., J.E.H.Z. and E.M.; Resources, J.H.-F.; Data curation, J.H.-F.; Writing—original draft, J.H.-F.; Writing—review & editing, J.H.-F., J.E.H.Z. and E.M.; Visualization, J.H.-F. and E.M.; Supervision, J.H.-F.; Project administration, J.H.-F.; Funding acquisition, J.H.-F. and E.M. All authors have read and agreed to the published version of the manuscript.

Funding

This research received no external funding.

Institutional Review Board Statement

Not applicable.

Informed Consent Statement

Not applicable.

Data Availability Statement

The original contributions presented in the study are included in the article, further inquiries can be directed to the corresponding author.

Conflicts of Interest

The authors declare no conflicts of interest.

References

  1. Huang, J.; Rempel, G.L. Ziegler-Natta catalysts for olefin polymerization: Mechanistic insights from metallocene systems. Prog. Polym. Sci. 1995, 20, 459–526. [Google Scholar] [CrossRef]
  2. Cossee, P. Ziegler-Natta catalysis I. Mechanism of polymerization of α-olefins with Ziegler-Natta catalysts. J. Catal. 1964, 3, 80–88. [Google Scholar] [CrossRef]
  3. Jiang, X.; He, A. Stereospecific polymerization of olefins with supported Ziegler–Natta catalysts. Polym. Int. 2014, 63, 179–183. [Google Scholar] [CrossRef]
  4. Kalita, A.; Boruah, M.; Das, D.; Dolui, S.K. Ethylene polymerization on polymer supported Ziegler-Natta catalyst. J. Polym. Res. 2012, 19, 9892. [Google Scholar] [CrossRef]
  5. Shamiri, A.; Chakrabarti, M.H.; Jahan, S.; Hussain, M.A.; Kaminsky, W.; Aravind, P.V.; Yehye, W.A. The influence of Ziegler-Natta and metallocene catalysts on polyolefin structure, properties, and processing ability. Materials 2014, 7, 5069–5108. [Google Scholar] [CrossRef] [PubMed]
  6. Mülhaupt, R. Catalytic Polymerization and Post Polymerization Catalysis Fifty Years after the Discovery of Ziegler’s Catalysts. Macromol. Chem. Phys. 2003, 204, 289–327. [Google Scholar] [CrossRef]
  7. Bora, R.R.; Wang, R.; You, F. Waste polypropylene plastic recycling toward climate change mitigation and circular economy: Energy, environmental, and technoeconomic perspectives. ACS Sustain. Chem. Eng. 2020, 8, 16350–16363. [Google Scholar] [CrossRef]
  8. Pernusch, D.C.; Spiegel, G.; Paulik, C.; Hofer, W. Influence of Poisons Originating from Chemically Recycled Plastic Waste on the Performance of Ziegler–Natta Catalysts. Macromol. React. Eng. 2022, 16, 2100020. [Google Scholar] [CrossRef]
  9. Blaakmeer, E.M.; Antinucci, G.; Correa, A.; Busico, V.; van Eck, E.R.; Kentgens, A.P. Structural characterization of electron donors in Ziegler–Natta catalysts. J. Phys. Chem. C 2018, 122, 5525–5536. [Google Scholar] [CrossRef]
  10. Tangjituabun, K.; Kim, S.Y.; Hiraoka, Y.; Taniike, T.; Terano, M.; Jongsomjit, B.; Praserthdam, P. Effects of various poisoning compounds on the activity and stereospecificity of heterogeneous Ziegler–Natta catalyst. Sci. Technol. Adv. Mater. 2008, 9, 024402. [Google Scholar] [CrossRef]
  11. Hernández-Fernández, J.; Lopez-Martinez, J.; Barceló, D. Development and validation of a methodology for quantifying partsper-billion levels of arsine and phosphine in nitrogen, hydrogen and liquefied petroleum gas using a variable pressure sampler coupled to gas chromatography-mass spectrometry. J. Chromatogr. A 2021, 1637, 461833. [Google Scholar] [CrossRef] [PubMed]
  12. Chacon, H.; Cano, H.; Fernández, J.H.; Guerra, Y.; Puello-Polo, E.; Ríos-Rojas, J.F.; Ruiz, Y. Effect of Addition of Polyurea as an Aggregate in Mortars: Analysis of Microstructure and Strength. Polymers 2022, 14, 1753. [Google Scholar] [CrossRef]
  13. Soga, K.; Sano, T.; Yamamoto, K.; Shiono, T. The role of additives on the improvement of the isotacticity of polypropylene—A possible interpretation. Chem. Lett. 1982, 11, 425–428. [Google Scholar] [CrossRef]
  14. Sacchi, M.C.; Tritto, I.; Locatelli, P. The function of amines in conventional and supported Ziegler-Natta catalysts. Eur. Polym. J. 1988, 24, 137–140. [Google Scholar] [CrossRef]
  15. Hernández-Fernández, J.; López-Martínez, J. Experimental study of the auto-catalytic effect of triethylaluminum and TiCl4 residuals at the onset of non-additive polypropylene degradation and their impact on thermo-oxidative degradation and pyrolysis. J. Anal. Appl. Pyrolysis 2021, 155, 105052. [Google Scholar] [CrossRef]
  16. Pavon, C.; Aldas, M.; Hernández-Fernández, J.; López-Martínez, J. Comparative characterization of gum rosins for their use as sustainable additives in polymeric matrices. J. Appl. Polym. Sci. 2021, 139, 51734. [Google Scholar] [CrossRef]
  17. Mier, J.; Artiaga, R.; Soto, L.G. Síntesis de Polímeros. Pesos Moleculares. Conformación y Configuración; Universidade da Coruña: La Coruña, Spain, 1997. [Google Scholar]
  18. Hernández-Fernández, J.; Puello-Polo, E.; Marquez, E. Study of the Chemical Activities of Carbon Monoxide, Carbon Dioxide, and Oxygen Traces as Critical Inhibitors of Polypropylene Synthesis. Polymers 2024, 16, 605. [Google Scholar] [CrossRef] [PubMed]
  19. Hernández-Fernández, J.; González-Cuello, R.; Ortega-Toro, R. Parts per Million of Propanol and Arsine as Responsible for the Poisoning of the Propylene Polymerization Reaction. Polymers 2023, 15, 3619. [Google Scholar] [CrossRef]
  20. Krukau, A.V.; Vydrov, O.A.; Izmaylov, A.F.; Scuseria, G.E. Influence of the exchange screening parameter on the performance of screened hybrid functionals. J. Chem. Phys. 2006, 125, 224106. [Google Scholar] [CrossRef]
  21. Albeladi, A.; Moman, A.; McKenna, T.F. Impact of Process Poisons on the Performance of Post-Phthalate Supported Ziegler–Natta Catalysts in Gas Phase Propylene Polymerization. Macromol. React. Eng. 2023, 17, 2200049. [Google Scholar] [CrossRef]
  22. Bonachela, S.; López, J.C.; Granados, M.R.; Magán, J.J.; Hernández, J.; Baille, A. Effects of gravel mulch on surface energy balance and soil thermal regime in an unheated plastic greenhouse. Biosyst. Eng. 2020, 192, 1–13. [Google Scholar] [CrossRef]
  23. Pavon, C.; Aldas, M.; López-Martínez, J.; Hernández-Fernández, J.; Arrieta, M.P. Films Based on Thermoplastic Starch Blended with Pine Resin Derivatives for Food Packaging. Foods 2021, 10, 1171. [Google Scholar] [CrossRef]
  24. Zülfikaroğlu, A.; Batı, H.; Dege, N. A theoretical and experimental study on isonitrosoacetophenone nicotinoyl hydrazone: Crystal structure, spectroscopic properties, NBO, NPA and NLMO analyses and the investigation of interaction with some transition metals. J. Mol. Struct. 2018, 1162, 125–139. [Google Scholar] [CrossRef]
  25. Shukla, B.K.; Yadava, U. DFT calculations on molecular structure, MEP and HOMO-LUMO study of 3-phenyl-1-(methyl-sulfonyl)-1H-pyrazolo [3,4-d] pyrimidine-4-amine. Mater. Today Proc. 2022, 49, 3056–3060. [Google Scholar] [CrossRef]
  26. Rai, P.K.; Sonne, C.; Brown, R.J.; Younis, S.A.; Kim, K.H. Adsorption of environmental contaminants on micro-and nano-scale plastic polymers and the influence of weathering processes on their adsorptive attributes. J. Hazard. Mater. 2022, 427, 127903. [Google Scholar] [CrossRef]
  27. Joaquin, H.F.; Juan, L. Quantification of poisons for Ziegler Natta catalysts and effects on the production of polypropylene by gas chromatographic with simultaneous detection: Pulsed discharge helium ionization, mass spectrometry and flame ionization. J. Chromatogr. A 2020, 1614, 460736. [Google Scholar] [CrossRef]
  28. Bahri-Laleh, N.; Hanifpour, A.; Mirmohammadi, S.A.; Poater, A.; Nekoomanesh-Haghighi, M.; Talarico, G.; Cavallo, L. Computational modeling of heterogeneous Ziegler-Natta catalysts for olefins polymerization. Prog. Polym. Sci. 2018, 84, 89–114. [Google Scholar] [CrossRef]
  29. Tangjituabun, K.; Kim, S.Y.; Hiraoka, Y.; Taniike, T.; Terano, M.; Jongsomjit, B.; Praserthdam, P. Poisoning of active sites on ziegler-natta catalyst for propylene polymerization. Chin. J. Polym. Sci. 2008, 26, 547–552. [Google Scholar] [CrossRef]
  30. Magni, E.; Somorjai, G.A. Preparation and surface science characterization of model Ziegler−Natta catalysts. Role of undercoordinated surface magnesium atoms in the chemisorption of TiCl4 on MgCl2 thin films. J. Phys. Chem. B 1998, 102, 8788–8795. [Google Scholar] [CrossRef]
  31. Udhayakalaa, P.; Rajendiranb, T.V.; Gunasekaran, S. Theoretical evaluation of corrosion inhibition performance of some triazole derivatives. J. Adv. Sci. Res. 2012, 3, 71–77. [Google Scholar]
  32. Jumabaev, A.; Holikulov, U.; Hushvaktov, H.; Issaoui, N.; Absanov, A. Intermolecular interactions in ethanol solution of OABA: Raman, FTIR, DFT, M062X, MEP, NBO, FMO, AIM, NCI, RDG analysis. J. Mol. Liq. 2023, 377, 121552. [Google Scholar] [CrossRef]
  33. Pandey, A.K.; Baboo, V.; Mishra, V.N.; Singh, V.K.; Dwivedi, A. Comparative Study of Molecular Docking, Structural, Electronic, Vibrational Spectra and Fukui Function Studies of Thiadiazole Containing Schiff Base—A Complete Density Functional Study. Polycycl. Aromat. Compd. 2021, 42, 13–39. [Google Scholar] [CrossRef]
  34. Bharathy, G.; Prasana, J.C.; Muthu, S.; Irfan, A.; Asif, F.B.; Saral, A.; Aayisha, S. Evaluation of electronic and biological interactions between N-[4-(Ethylsulfamoyl) phenyl] acetamide and some polar liquids (IEFPCM solvation model) with Fukui function and molecular docking analysis. J. Mol. Liq. 2021, 340, 117271. [Google Scholar] [CrossRef]
  35. Hernández-Fernández, J.; González-Cuello, R.; Ortega-Toro, R. Evaluation of the Reactivity of Methanol and Hydrogen Sulfide Residues with the Ziegler–Natta Catalyst during Polypropylene Synthesis and Its Effects on Polymer Properties. Polymers 2023, 15, 4061. [Google Scholar] [CrossRef] [PubMed]
  36. Lowe, P.A. Sulphur Analogues of the Alcohols and their Derivatives. In Supplements to the 2nd Edition of Rodd’s Chemistry of Carbon Compounds; Elsevier: Amsterdam, The Netherlands, 1975; pp. 109–123. [Google Scholar]
  37. Hernández-Fernández, J.; Ortega-Toro, R.; Castro-Suares, J. Multiple Traces of Families of Epoxy Derivatives as New Inhibitors of the Industrial Polymerization Reaction of Propylene. Polymers 2024, 16, 2028. [Google Scholar] [CrossRef]
  38. Beaman, C.W.; Lees, R.M.; Xu, L.-H.; Billinghurst, B.E. FTIR synchrotron spectroscopy of lower modes of methyl-D3 mercaptan (CD3SH). J. Mol. Spectrosc. 2023, 392, 111739. [Google Scholar] [CrossRef]
  39. Lees, R.M.; Xu, L.-H.; Billinghurst, B.E. High-resolution Fourier transform synchrotron spectroscopy of the C–S stretching band of methyl mercaptan, CH332SH. J. Mol. Spectrosc. 2016, 319, 30–38. [Google Scholar] [CrossRef]
  40. Hernández-Fernández, J. Quantification of oxygenates, sulphides, thiols and permanent gases in propylene. A multiple linear regression model to predict the loss of efficiency in polypropylene production on an industrial scale. J Chromatogr. A 2020, 1628, 461478. [Google Scholar] [CrossRef]
  41. Hernández-Fernández, J.; Guerra, Y.; Puello-Polo, E.; Marquez, E. Effects of Different Concentrations of Arsine on the Synthesis and Final Properties of Polypropylene. Polymers 2022, 14, 3123. [Google Scholar] [CrossRef] [PubMed]
  42. Hernández-Fernández, J.; Juan, L.M. Autocatalytic influence of different levels of arsine on the thermal stability and pyrolysis of polypropylene. J. Anal. Appl. Pyrolysis. 2022, 161, 105385. [Google Scholar] [CrossRef]
  43. Hernández-Fernández, J.; Vivas-Reyes, R.; Toloza, C.A.T. Experimental Study of the Impact of Trace Amounts of Acetylene and Methylacetylene on the Synthesis, Mechanical and Thermal Properties of Polypropylene. Int. J. Mol. Sci. 2022, 23, 12148. [Google Scholar] [CrossRef]
  44. Hernandez-Fernández, J.; Guerra, Y.; Espinosa, E. Development and Application of a Principal Component Analysis Model to Quantify the Green Ethylene Content in Virgin Impact Copolymer Resins During Their Synthesis on an Industrial Scale. J. Polym. Environ. 2022, 30, 4800–4808. [Google Scholar] [CrossRef]
  45. Hernández-Fernández, J.; Castro-Suarez, J.R.; Toloza, C.A.T. Iron Oxide Powder as Responsible for the Generation of Industrial Polypropylene Waste and as a Co-Catalyst for the Pyrolysis of Non-Additive Resins. Int. J. Mol. Sci. 2022, 23, 11708. [Google Scholar] [CrossRef] [PubMed]
  46. Hernández-Fernández, J.; Ortega-Toro, R.; Castro-Suarez, J.R. Theoretical–Experimental Study of the Action of Trace Amounts of Formaldehyde, Propionaldehyde, and Butyraldehyde as Inhibitors of the Ziegler–Natta Catalyst and the Synthesis of an Ethylene–Propylene Copolymer. Polymers 2023, 15, 1098. [Google Scholar] [CrossRef] [PubMed]
  47. Hernández-Fernández, J.; Puello-Polo, E.; Márquez, E. Furan as Impurity in Green Ethylene and Its Effects on the Productivity of Random Ethylene–Propylene Copolymer Synthesis and Its Thermal and Mechanical Properties. Polymers 2023, 15, 2264. [Google Scholar] [CrossRef]
  48. Hernández-Fernández, J.; Puello-Polo, E.; Marquez, E. Experimental–Density Functional Theory (DFT) Study of the Inhibitory Effect of Furan Residues in the Ziegler–Natta Catalyst during Polypropylene Synthesis. Int. J. Mol. Sci. 2023, 24, 14368. [Google Scholar] [CrossRef]
  49. Hernández-Fernández, J.; González-Cuello, R.; Ortega-Toro, R. Dimethylformamide Impurities as Propylene Polymerization Inhibitor. Polymers 2023, 15, 3806. [Google Scholar] [CrossRef] [PubMed]
  50. Hernández-Fernández, J.; Cano, H.; Aldas, M. Impact of Traces of Hydrogen Sulfide on the Efficiency of Ziegler–Natta Catalyst on the Final Properties of Polypropylene. Polymers 2022, 14, 3910. [Google Scholar] [CrossRef]
Figure 1. Production process diagram for polypropylene (PP).
Polymers 16 02851 g001
Figure 2. There is a loss of productivity per metric ton depending on the inhibitor (ppm), Methyl Mercaptan (a), Ethyl Mercaptan (b), Propyl Mercaptan (c), Butyl Mercaptan (d), and the type of sample.
Polymers 16 02851 g002
Figure 3. Effect of traces of Methyl Mercaptan (a), Ethyl Mercaptan (b), Propyl Mercaptan (c), and Butyl Mercaptan (d); Zigler–Natta productivity (MT/kg) about the Mw of the polymer.
Polymers 16 02851 g003
Figure 4. Effect of traces of Methyl Mercaptan (a), Ethyl Mercaptan (b), Propyl Mercaptan (c) and Butyl Mercaptan (d); Zigler–Natta productivity (MT/kg) over melt flow index (MFI).
Polymers 16 02851 g004
Figure 5. Flow rate and Mw of Methyl Mercaptan (a), Ethyl Mercaptan (b), Propyl Mercaptan (c) and Butyl Mercaptan (d).
Polymers 16 02851 g005
Figure 6. Molecular electrostatic potential map; (a) Methyl Mercaptan (b) Ethyl Mercaptan (c) Propyl Mercaptan (d) Butyl Mercaptan.
Polymers 16 02851 g006
Figure 7. (a) Electrostatic potential map of the Ziegler–Natta catalyst; (b) Electrostatic potential map of Methyl Mercaptan.
Polymers 16 02851 g007
Figure 8. Spatial Conformation of Methyl Mercaptan (a), Ethyl Mercaptan (b), Propyl Mercaptan (c), Butyl Mercaptan (d).
Polymers 16 02851 g008
Figure 9. Spatial conformation of the Ziegler–Natta catalyst (a) and its active site (b).
Polymers 16 02851 g009
Figure 10. The infrared spectrum of ZN-methyl mercaptan, ZN-ethyl mercaptan, ZN-propyl mercaptan, and ZN-butyl mercaptan.
Polymers 16 02851 g010
Table 1. Amount of methyl mercaptan, ethyl mercaptan, propyl mercaptan, and butyl mercaptan introduced during the polymerization process. Measurement of Mw, MFI, % Zigler–Natta productivity, and % lost production in the catalytic system (Average table).
Methyl Mercaptan (PPM)0.000.781.712.785.8312.5117.7625.65
TM of PP Produced46.0045.7545.5244.8743.5441.2238.6436.78
Productivity Ziegler–Natta (TM/Kg)46.0045.7545.5244.8743.5441.2238.6436.78
% Productivity Loss0.000.541.042.465.3410.4016.0020.04
MFI2.002.002.002.001.971.931.901.85
% MFI loss00001.503.505.07.50
Ethyl Mercaptan (PPM)0.000.871.944.147.1213.1829.2237.17
TM of PP Produced46.0045.7945.5244.9143.5141.3638.6236.50
Productivity Ziegler–Natta (TM/Kg)46.0045.7945.5244.9143.5141.3638.6236.50
% Productivity Loss0.000.461.042.365.4110.0816.0520.66
MFI2.002.002.002.001.981.981.891.84
% MFI loss0000115.658.15
Propyl Mercaptan (PPM)0.001.232.144.899.1614.1428.7144.24
TM of PP Produced46.0045.7545.4044.8343.5941.2938.8936.73
Productivity Ziegler–Natta (TM/Kg)46.0045.7545.4044.8343.5941.2938.8936.73
% Productivity Loss0.000.541.302.555.2310.2415.4620.16
MFI2.002.002.002.001.971.931.891.85
% MFI loss00001.503.505.507.50
Butyl Mercaptan (PPM)0.001.482.295.7510.2220.3330.5052.61
TM of PP Produced46.0045.7645.4845.0843.6841.5539.0836.75
Productivity Ziegler–Natta (TM/Kg)46.0045.7645.4845.0843.6841.5539.0836.75
% Productivity Loss0.000.511.132.005.049.6715.0520.12
MFI2.002.002.002.001.981.941.891.84
% MFI loss0001136.678.16
Table 2. Local descriptors for Methyl Mercaptan.
#ff+f0Δf
10.90950.04350.4765−0.866
20.02720.67730.35230.6501
30.03140.06760.04950.0362
40.03140.06750.04950.0361
500.07390.0370.0739
60.00050.07010.03530.0696
Table 3. Local descriptors for Ethyl Mercaptan.
#ff+f0Δf
10.88660.04660.4666−0.84
20.02010.29270.15640.2726
30.00450.30190.15320.2974
40.03520.0740.05460.0388
50.03520.0740.05460.0388
60.00920.03030.01980.0211
70.00920.03030.01980.0211
800.05060.02530.0506
900.09950.04970.0995
Table 4. Local descriptors for Propyl Mercaptan.
#ff+f0Δf
10.82710.02770.4274−0.7994
20.03970.03370.0367−0.006
30.06540.36920.21730.3038
40.02880.34440.18660.3156
50.00460.01450.00950.0099
60.0010.03850.01970.0375
70.00120.0370.01910.0358
80.02780.03340.03060.0056
90.00110.01320.00710.0121
100.00240.02960.0160.0272
110.00060.02420.01240.0236
120.00040.03460.01750.0342
Table 5. Local descriptors for Butyl Mercaptan.
#ff+f0Δf
10.74160.04830.395−0.6933
20.04910.04230.0457−0.0068
30.03610.13480.08550.0987
40.01430.33280.17350.3185
50.00180.09990.05080.0981
60.03020.01710.0237−0.0131
70.03130.0140.0226−0.0173
80.01540.02090.01820.0055
90.01110.02380.01740.0127
100.03440.06650.05040.0321
110.03480.06690.05090.0321
1200.01170.00580.0117
130.00010.01210.00610.012
1400.01090.00550.0109
15−0.00010.09820.0490.0983
Table 6. Fukui functions for TiCl4.
#ff+f0Δf
10.00010.79680.39860.7968
20.37410.05060.2125−0.3234
30.1630.05030.1073−0.1137
40.3730.05130.2125−0.3229
50.08780.05090.0693−0.0368
Table 7. Fukui functions for ZN support.
#ff+f0Δf
10.03130.03040.0309−0.0009
20.00130.44330.22230.442
30.55540.00320.2793−0.5522
40.01090.00290.0069−0.008
50.00110.03510.01810.034
60.00040.01980.01010.0194
70.00030.00360.00190.0033
80.00070.02870.01470.028
90.00070.36070.18070.36
100.00050.02360.01200.0231
110.00030.01230.00630.012
120.00000.00370.00190.0037
130.00680.00170.0043−0.0051
140.35230.00270.1775−0.3496
150.01940.02480.02210.0054
160.00640.00140.0039−0.005
170.00600.00060.0033−0.0054
180.00600.00140.0037−0.0046
190.00020.00010.0002−0.0001
Table 8. Frequencies (cm−1) of characteristic bonds present in ZN–Mercaptans.
BondsZN-PropylZN-Methyl MercaptanZN-Ethyl MercaptanZN-Propyl MercaptanZN-Butyl Mercaptan
Ti-S--------430445475477
Ti-Cl618–555493725591599
Cl-Mg15101456151016251634
Cl-Ti-S-CH2----------------644–720647–725642–728
Cl-Ti -S-CH3--------644–722------------------------
-CH32995–29693058305429973115–2986
-CH21517–1480--------1518–14441511–14491513–1467
Table 9. Symbolic representation of the reactions of the process.
ReagentsProducts
TiCl4 + CH3SCH3STiCl4
TiCl4 + CH3CH2SCH3CH2S TiCl4
TiCl4 + CH3CH2CH2SCH3CH2CH2STiCl4
TiCl4 + CH3CH2CH2CH2SCH3CH2CH2CH2STiCl4
Disclaimer/Publisher’s Note: The statements, opinions and data contained in all publications are solely those of the individual author(s) and contributor(s) and not of MDPI and/or the editor(s). MDPI and/or the editor(s) disclaim responsibility for any injury to people or property resulting from any ideas, methods, instructions or products referred to in the content.