
Polysaccharide Composite Alginate–Pectin Hydrogels as a Basis for Developing Wound Healing Materials

 ,
,  , , ,
, , , 
Abstract
1. Introduction
2. Materials and Methods
2.1. Preparation of Gels
2.2. Atomic Force Microscopic Imaging
2.3. Dynamic Light Scattering
2.4. Raman Spectroscopy
2.5. Cell Viability
3. Results and Discussion
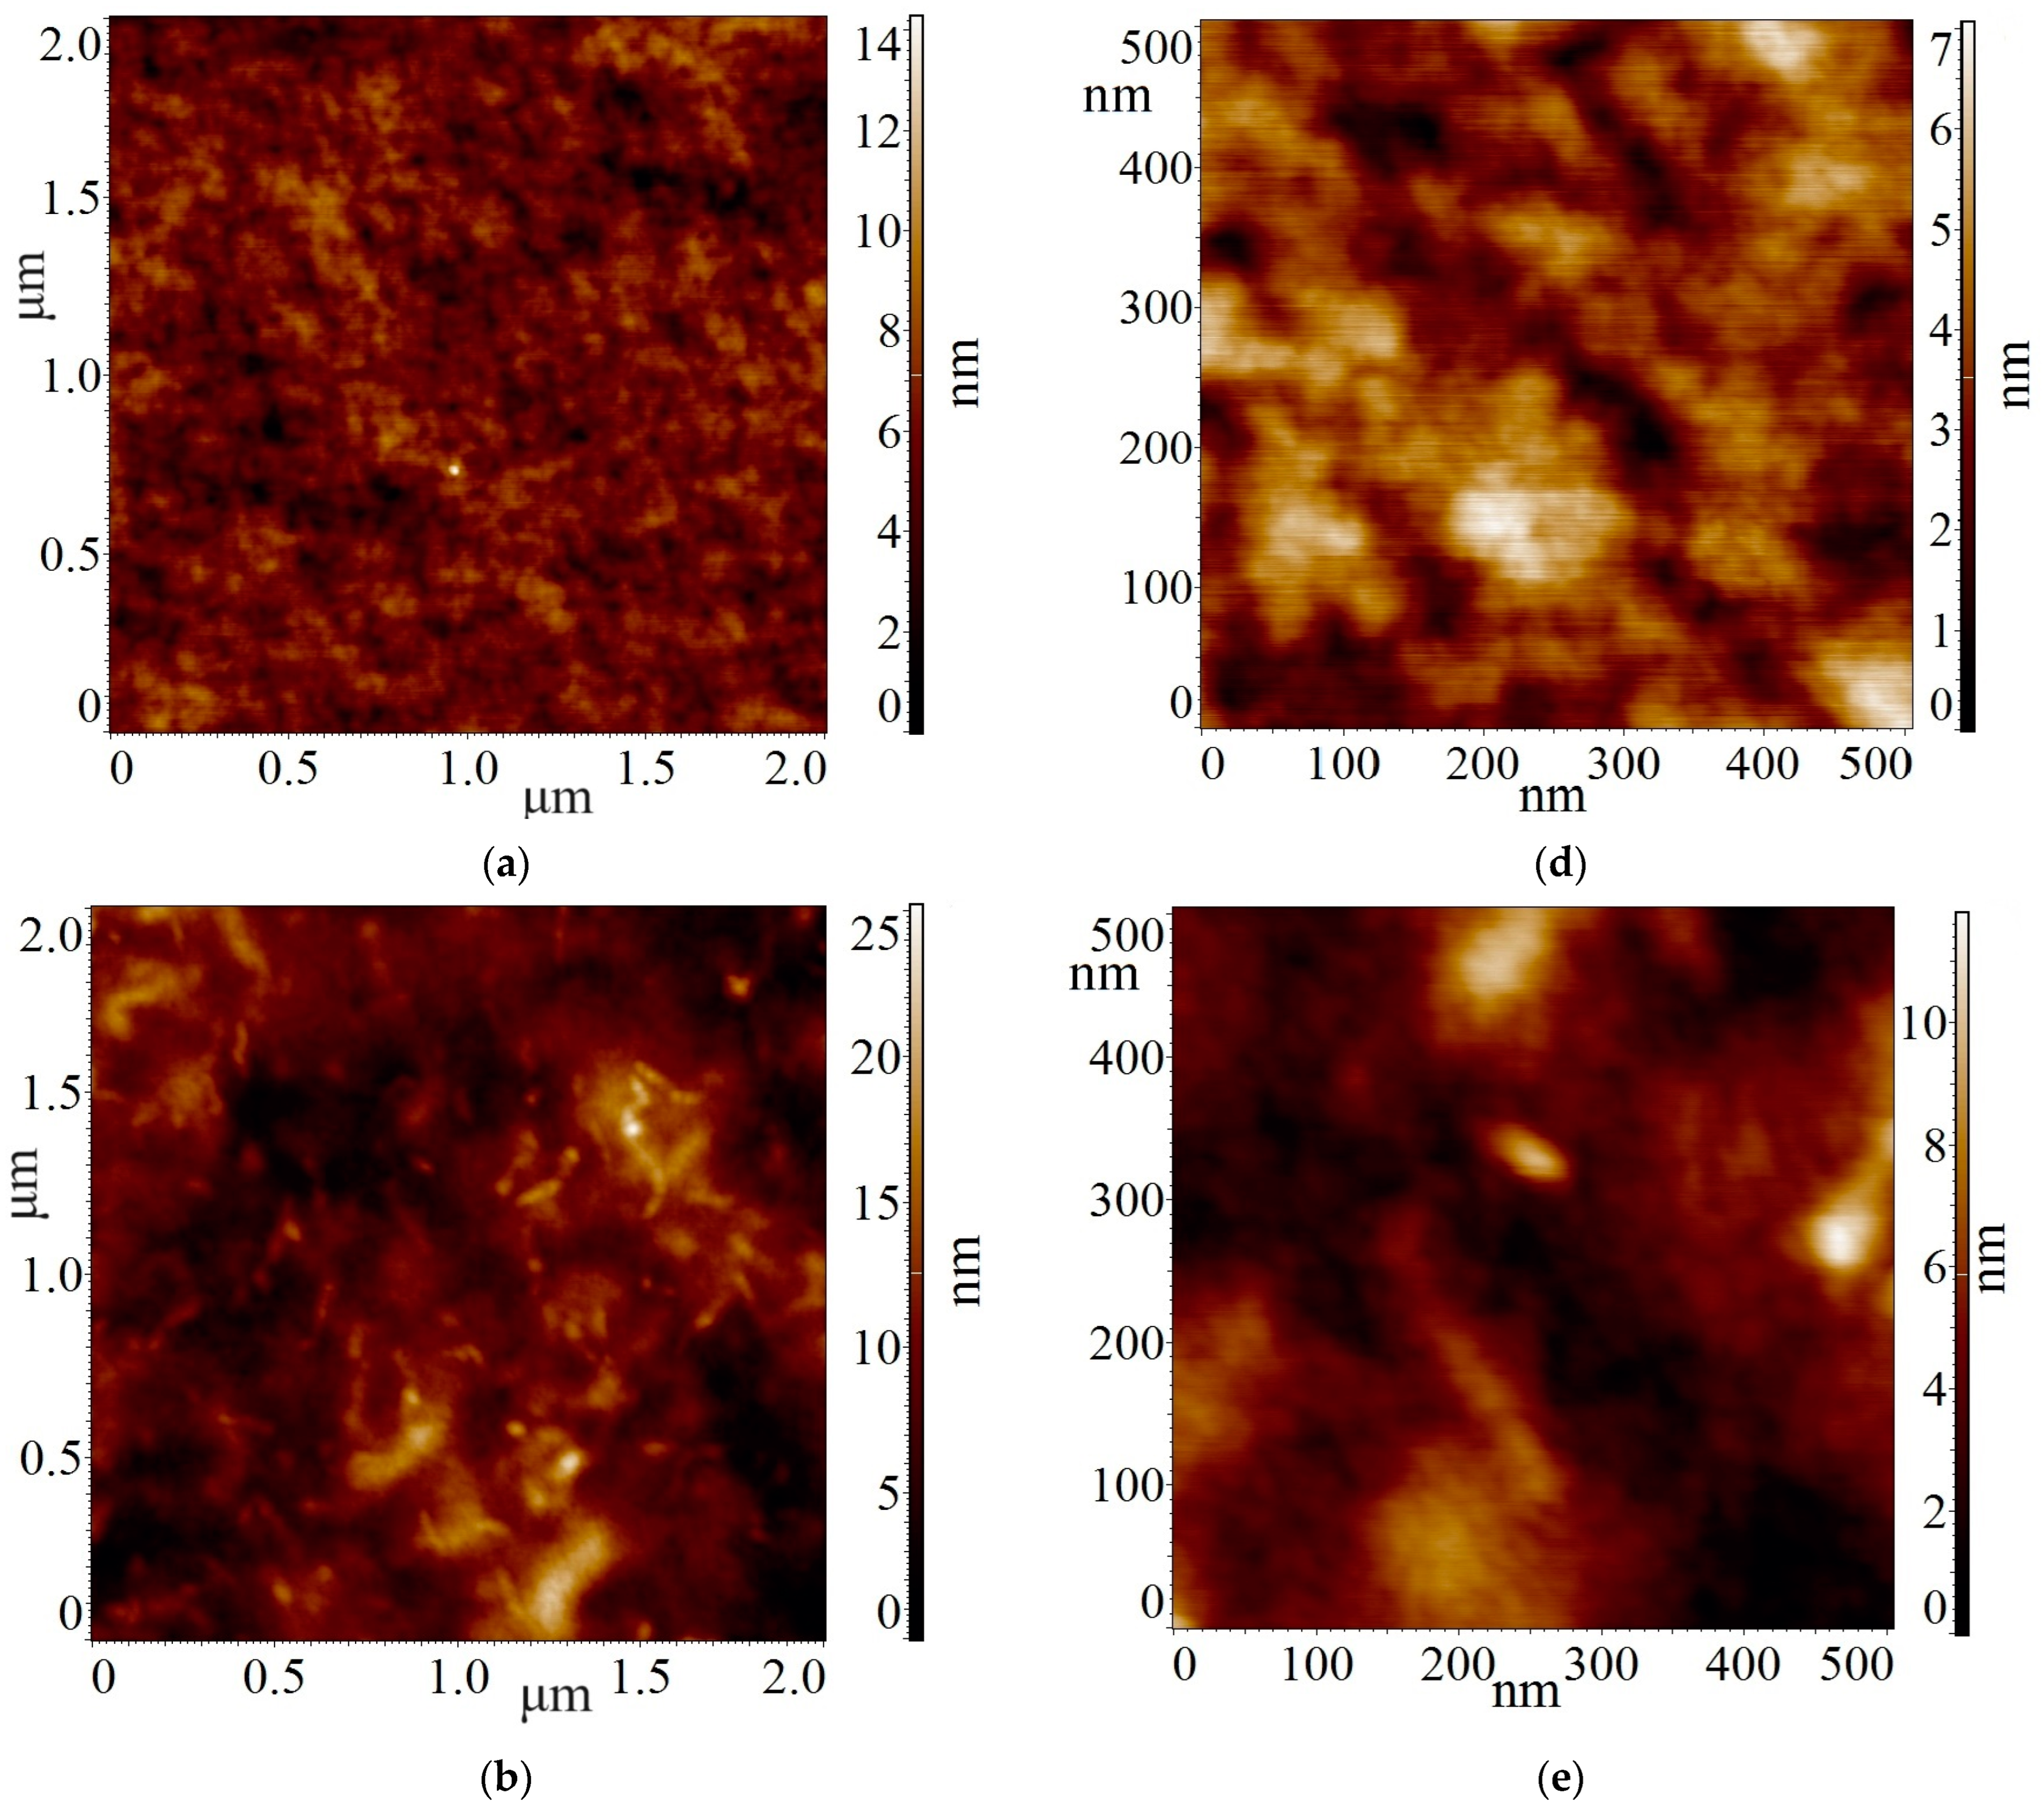
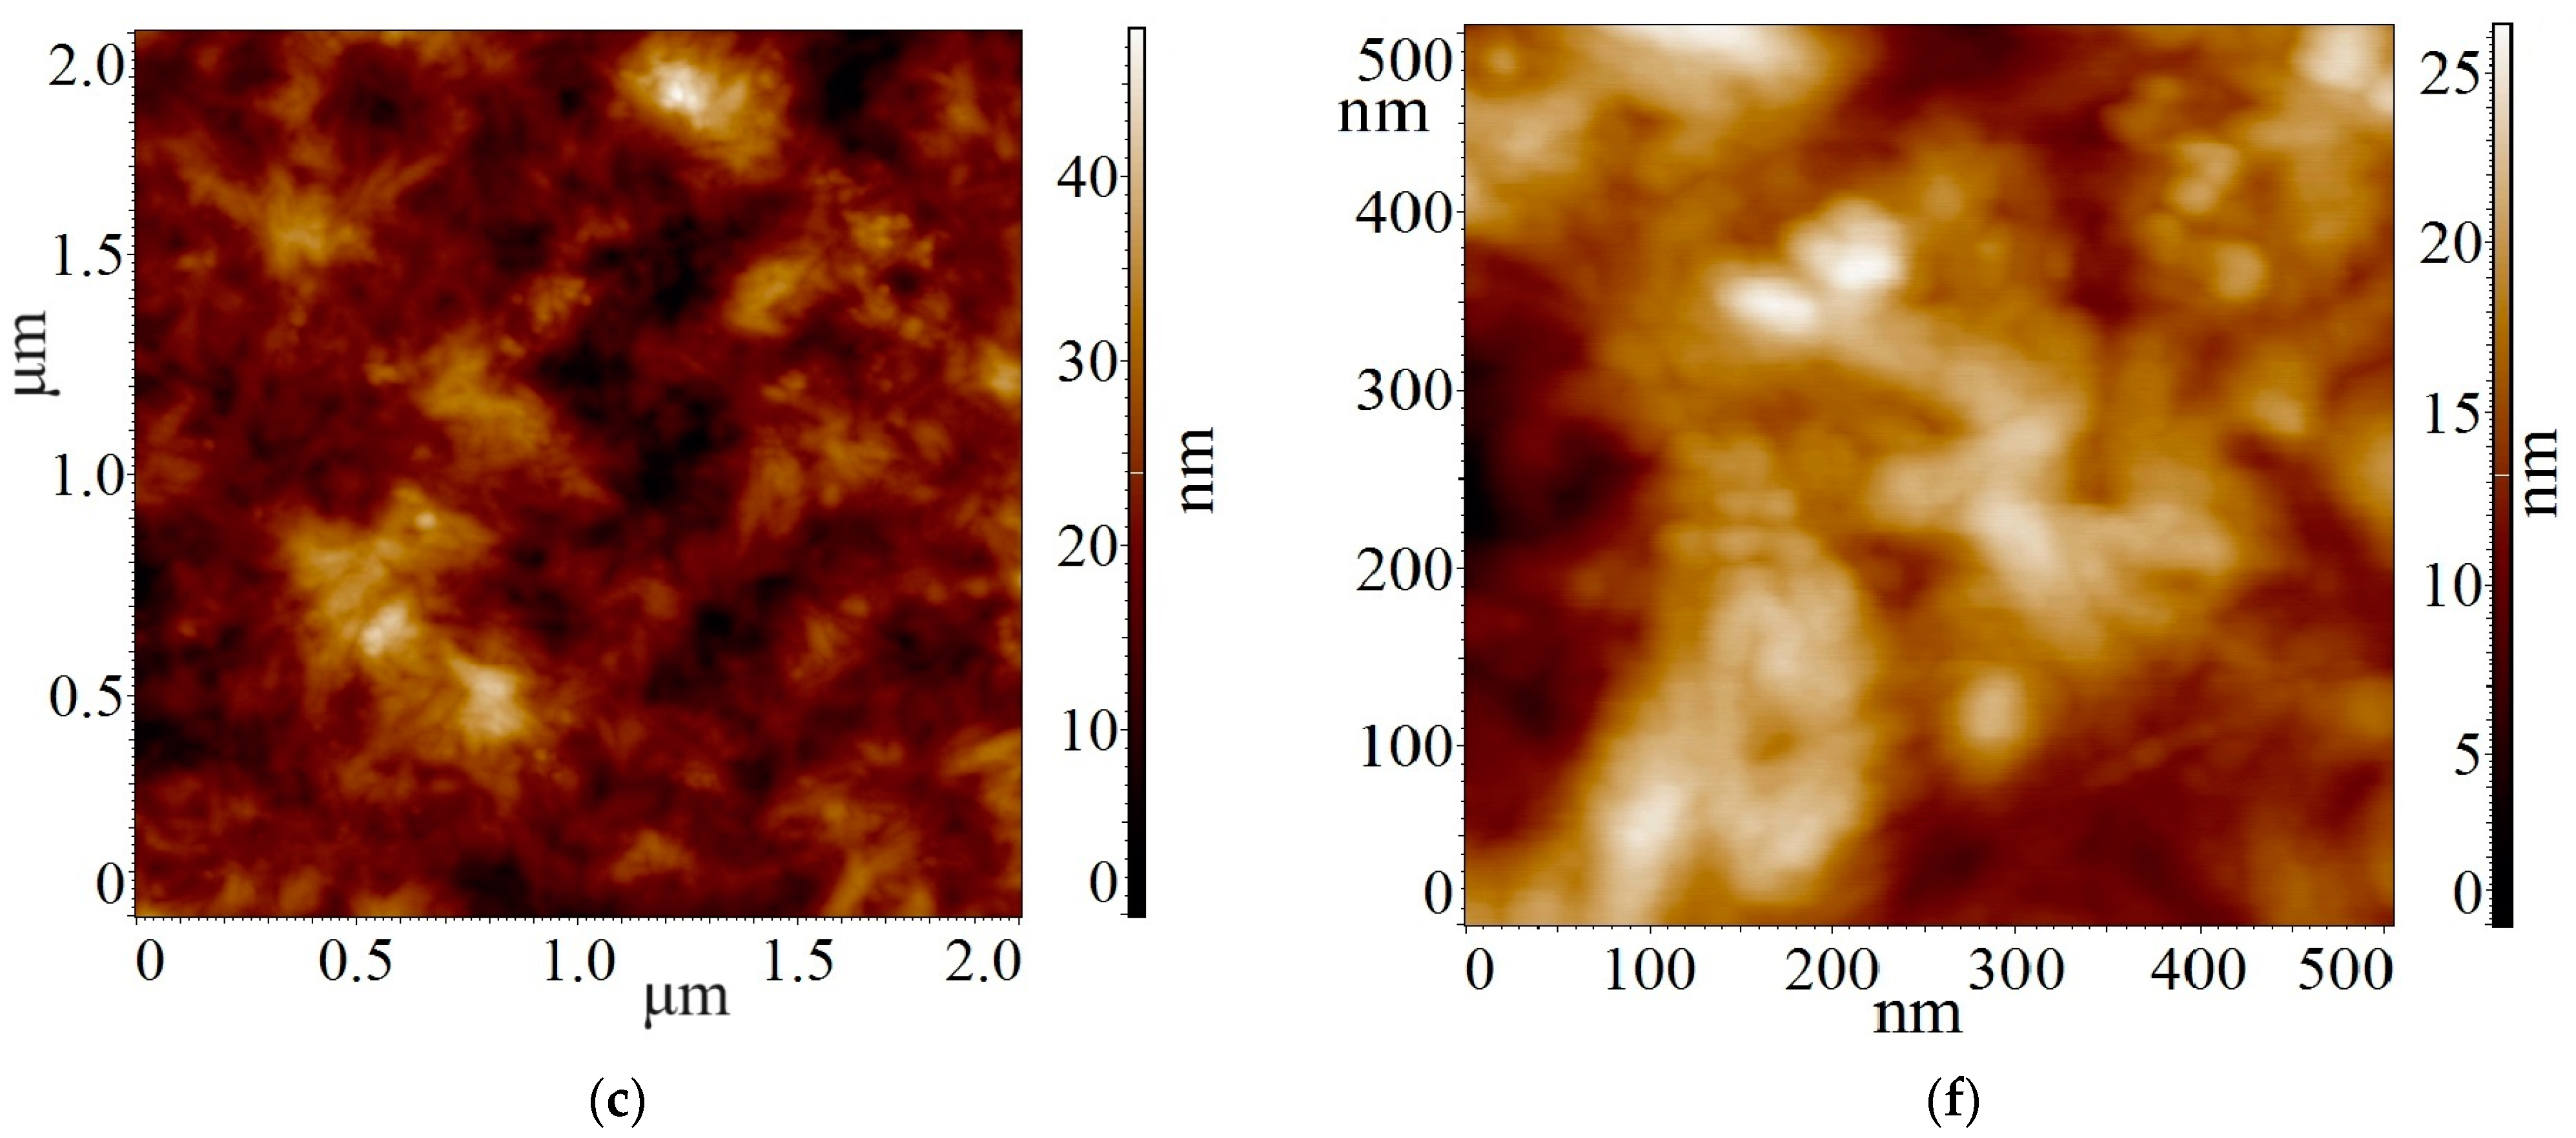
3.1. AFM Results
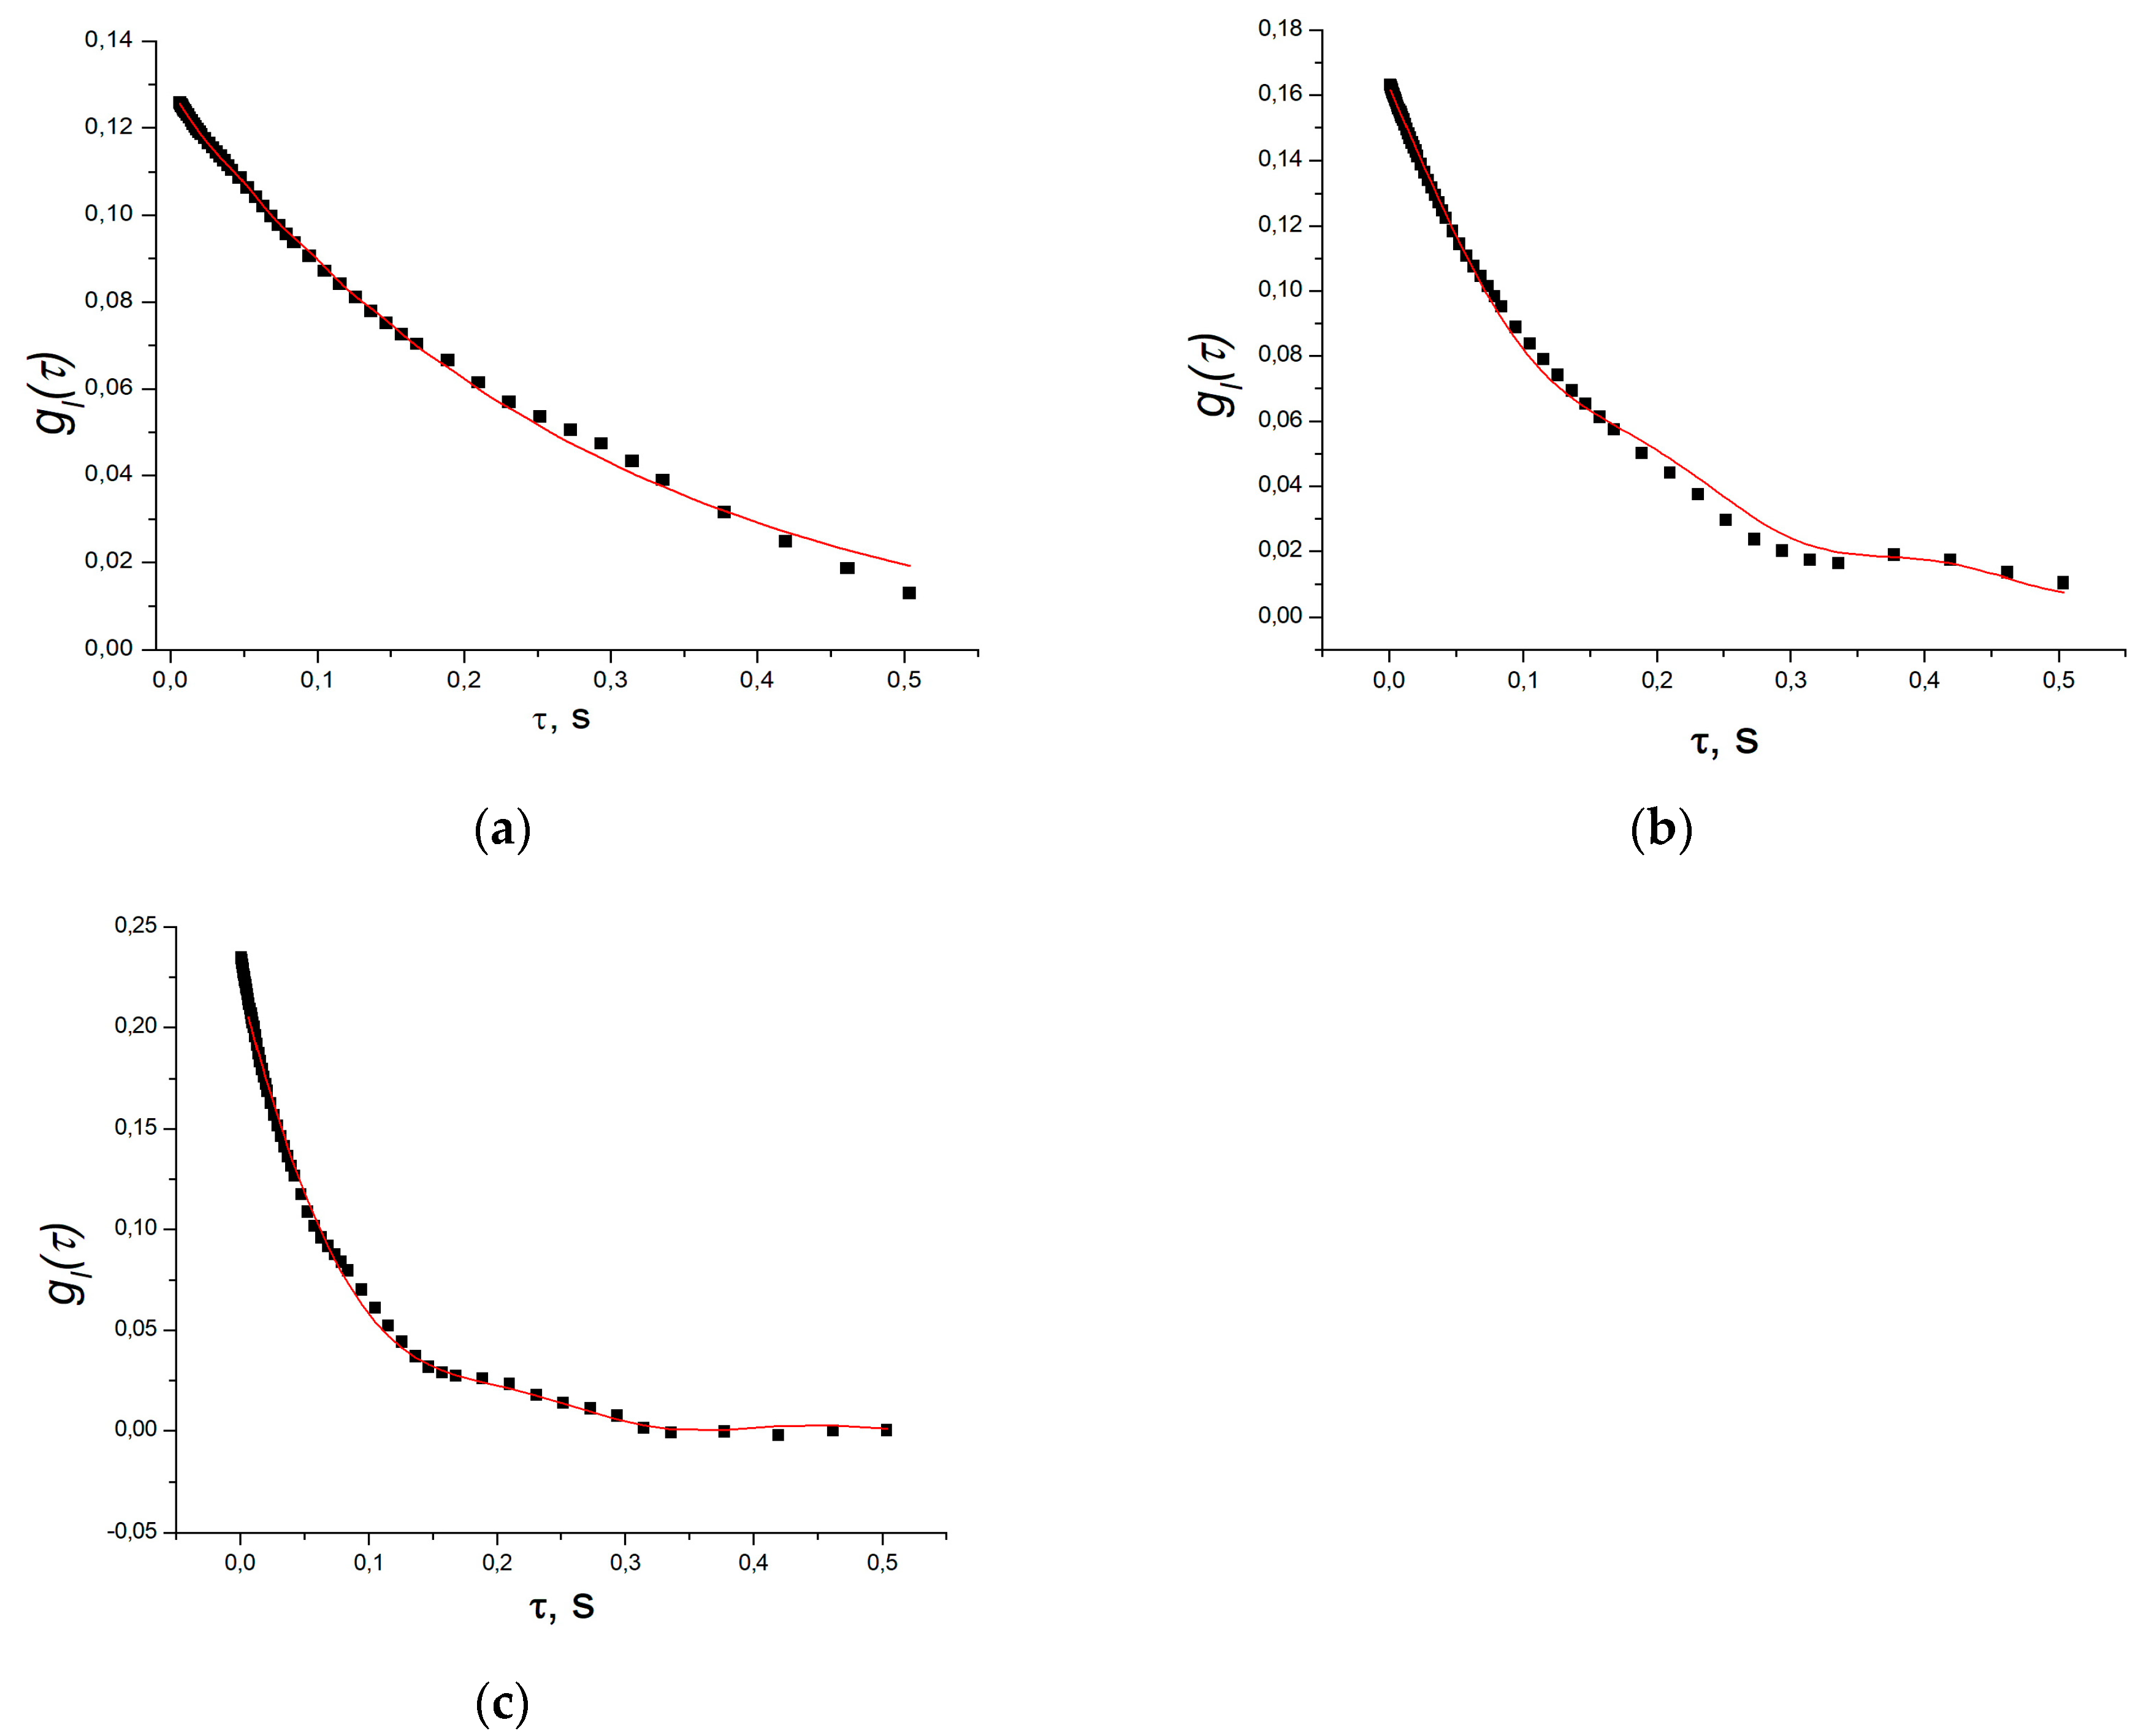
3.2. DLS Results
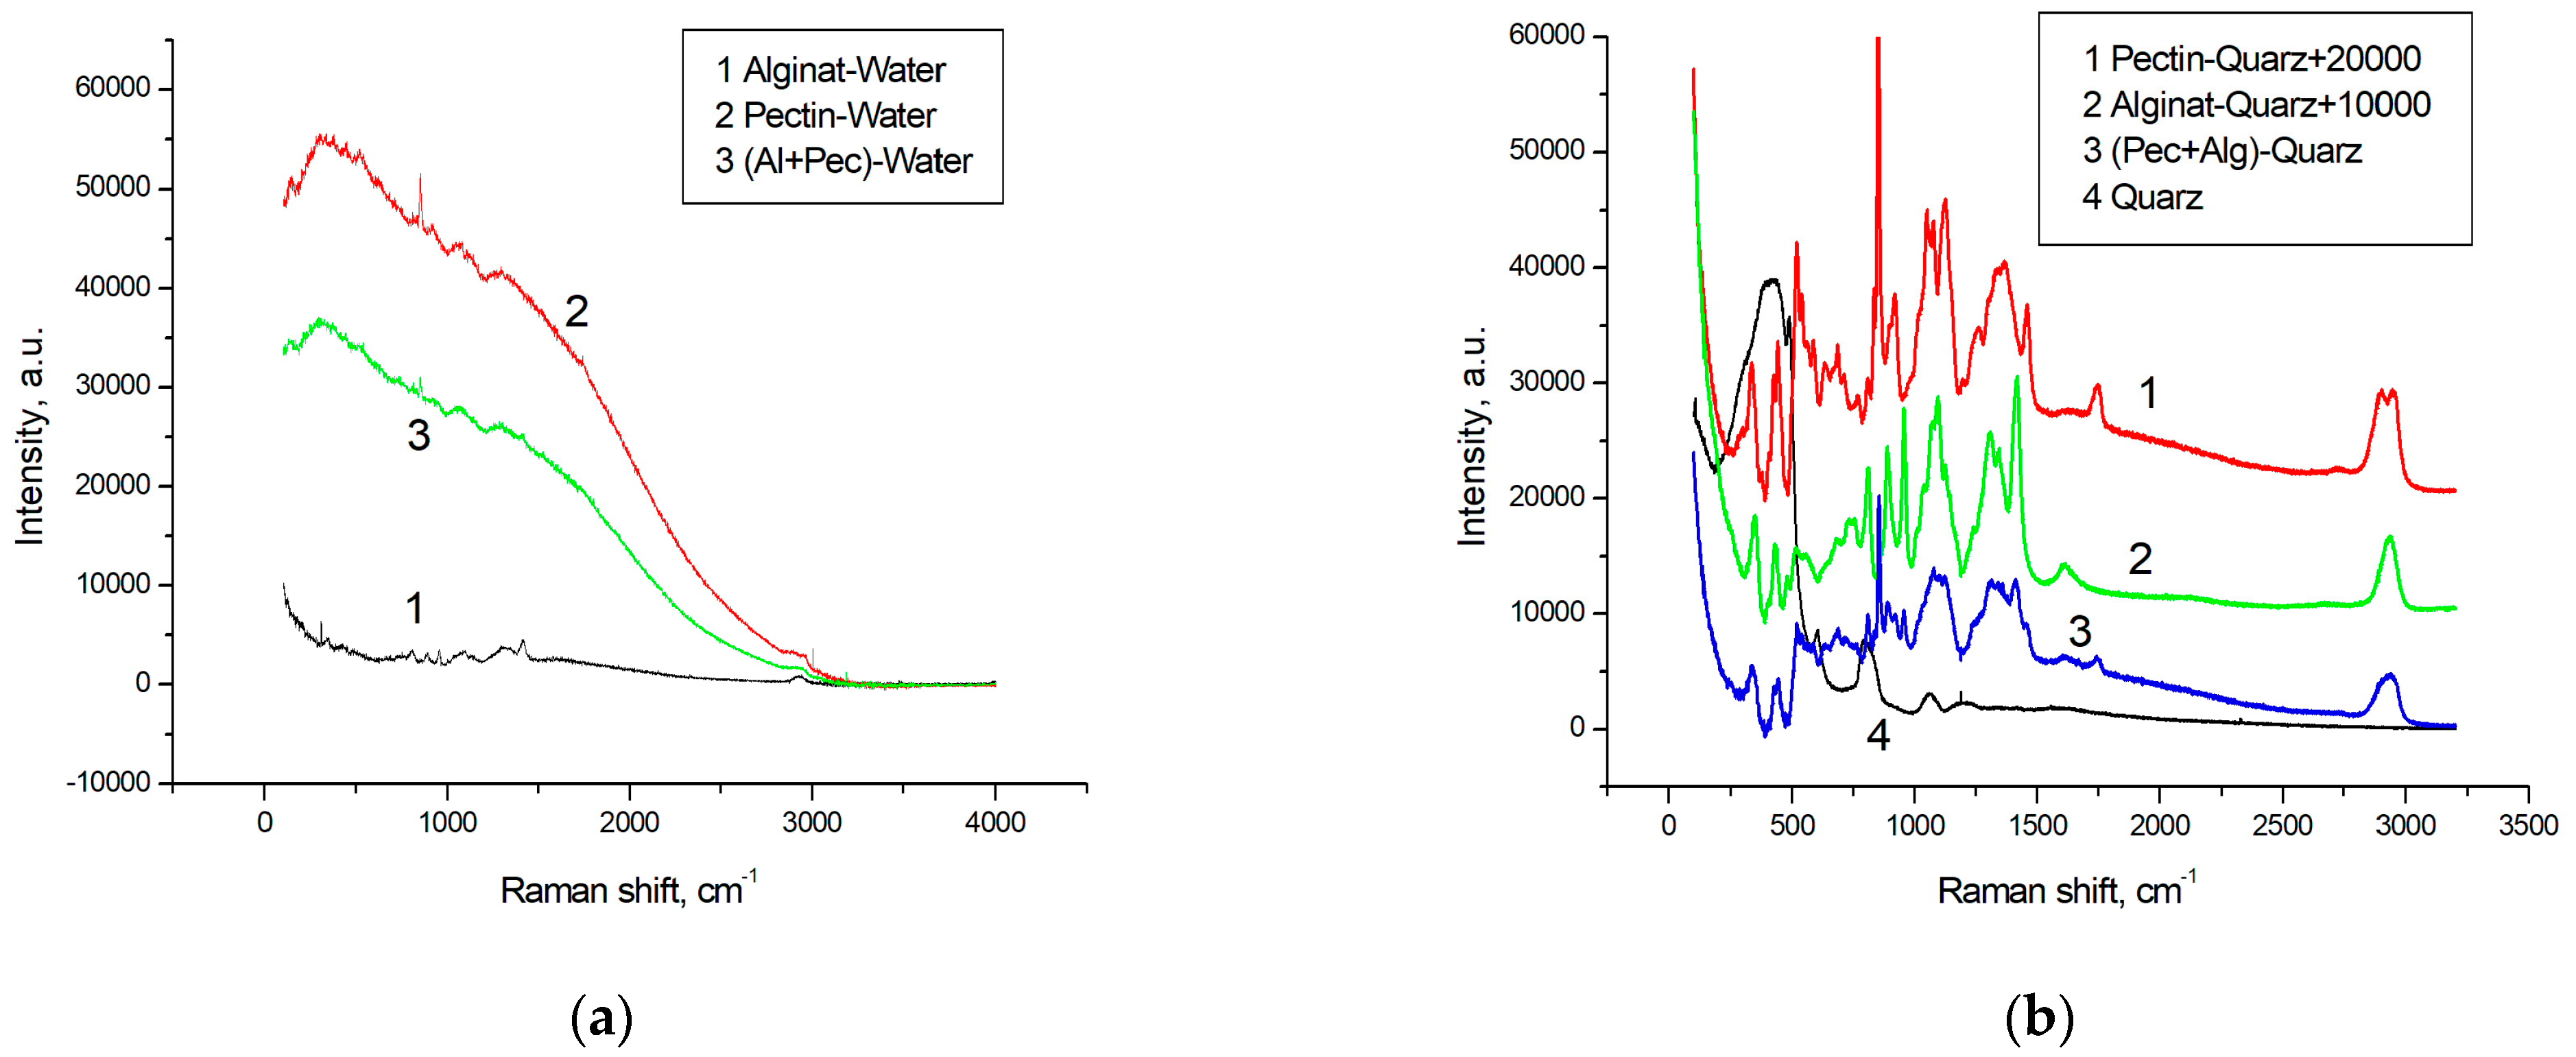
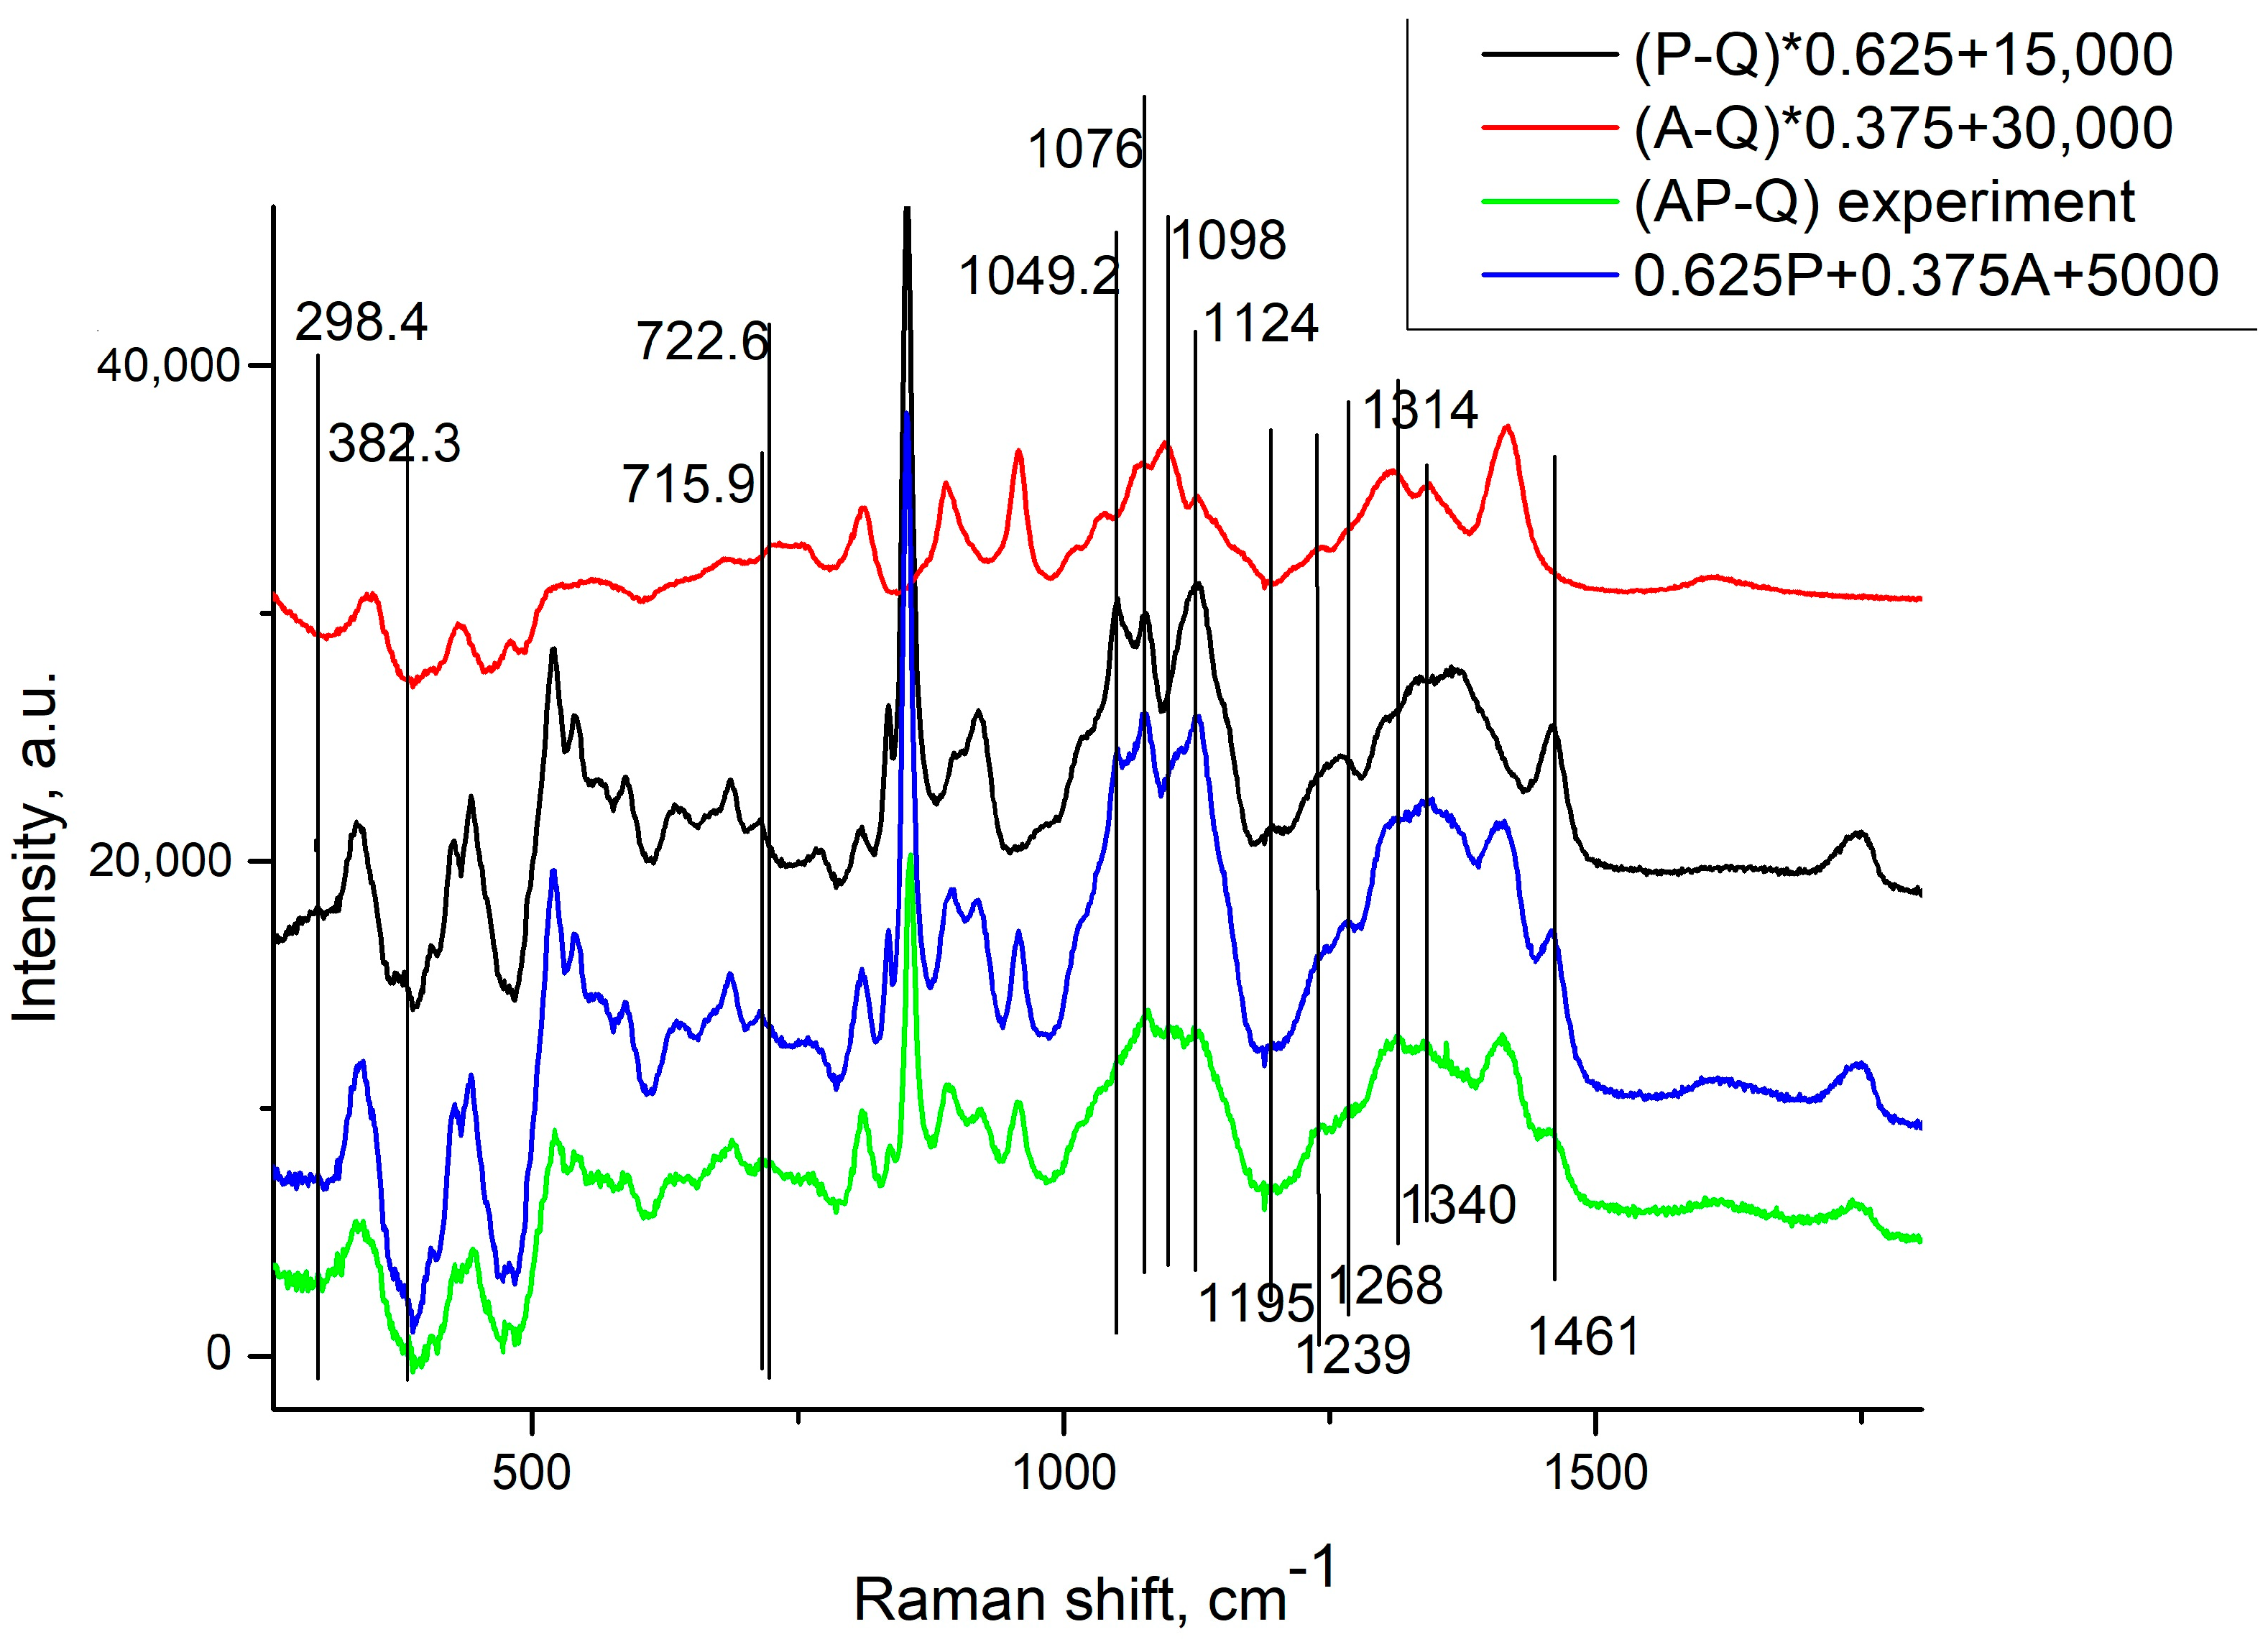
3.3. RS Results
3.4. Biocompatibility Tests
4. Conclusions
Author Contributions
Funding
Institutional Review Board Statement
Informed Consent Statement
Data Availability Statement
Conflicts of Interest
References
- Oltarzhevskaya, N.D.; Korovina, M.A.; Krichevsky, G.E.; Shchedrina, M.A.; Egorova, E.A. The opportunities of using polysaccharides for the wound treatment. Prof. B. M. Kostyuchenok J. 2019, 6, 24–31. [Google Scholar] [CrossRef]
- Yuan, N.; Shao, K.; Huang, S.; Chen, C. Chitosan, alginate, hyaluronic acid and other novel multifunctional hydrogel dressings for wound healing: A review. Int. J. Biol. Macromol. 2023, 240, 124321. [Google Scholar] [CrossRef] [PubMed]
- Priya, S.; Choudhari, M.; Tomar, Y.; Desai, V.M.; Innani, S.; Dubey, S.K.; Singhvi, G. Exploring polysaccharide-based bio-adhesive topical film as a potential platform for wound dressing application: A review. Carbohydr. Polym. 2024, 327, 121655. [Google Scholar] [CrossRef] [PubMed]
- Iacob, A.T.; Drăgan, M.; Ionescu, O.M.; Profire, L.; Ficai, A.; Andronescu, E.; Confederat, L.G.; Lupașcu, D. An Overview of Biopolymeric Electrospun Nanofibers Based on Polysaccharides for Wound Healing Management. Pharmaceutics 2020, 12, 983. [Google Scholar] [CrossRef] [PubMed]
- Hu, H.; Xu, F.J. Rational design and latest advances of polysaccharide-based hydrogels for wound healing. Biomater. Sci. 2020, 8, 2084–2101. [Google Scholar] [CrossRef] [PubMed]
- Tanaka, A.; Nagate, T.; Matsuda, H. Acceleration of wound healing by gelatin film dressings with epidermal growth factor. J. Vet. Vet. Med. Sci. 2005, 67, 909–913. [Google Scholar] [CrossRef] [PubMed]
- Balakrishnan, B.; Mohanty, M.; Umashankar, P.; Jayakrishnan, A. Evaluation of an in situ forming hydrogel wound dressing based on oxidized alginate and gelatin. Biomaterials 2005, 26, 6335–6342. [Google Scholar] [CrossRef]
- Junker, J.P.; Kamel, R.A.; Caterson, E.; Eriksson, E. Clinical impact upon wound healing and inflammation in moist, wet, and dry environments. Adv. Wound Care 2013, 2, 348–356. [Google Scholar] [CrossRef]
- Lindenbaum, E.S.; Tendler, M.; Beach, D. Serum-free cell culture medium induces acceleration of wound healing in guinea-pigs. Burns 1995, 21, 110–115. [Google Scholar] [CrossRef]
- Del Gaudio, P.; Amante, C.; Civale, R.; Bizzarro, V.; Petrella, A.; Pepe, G.; Campiglia, P.; Russo, P.; Aquino, R.P. In situ gelling of alginate-pectin blend particles loaded with Ac2-26. Carbohydr. Polym. 2020, 227, 115–305. [Google Scholar] [CrossRef]
- Fletcher, J. Understanding wound dressings: Alginates. Nurs. Times 2005, 101, 53–54. [Google Scholar]
- Baranoski, S. Choosing a wound dressing, part 2. Nursing 2008, 38, 14–15. [Google Scholar] [CrossRef] [PubMed]
- Boateng, J.S.; Matthews, K.H.; Stevens, H.N.E.; Eccleston, G.M. Wound healing dressings and drug delivery systems: A review. J. Pharm. Pharm. Sci. 2008, 97, 2892–2923. [Google Scholar] [CrossRef] [PubMed]
- Aquino, R.P.; Auriemma, G.; Mencherini, T.; Russo, P.; Porta, A.; Adami, R.; Liparoti, S.; Della Porta, G.; Reverchon, E.; Del Gaudio, P. Design and production of gentamicin/dextrans microparticles by supercritical assisted atomisation for the treatment of wound bacterial infections. Int. J. Pharm. 2013, 440, 188–194. [Google Scholar] [CrossRef] [PubMed]
- Gohil, R.M. Synergistic blends of natural polymers, pectin and sodium alginate. J. Appl. Polym. Sci. 2010, 120, 2324–2336. [Google Scholar] [CrossRef]
- Neves, S.C.; Gomes, D.B.; Sousa, A.; Bidarra, S.J.; Petrini, P.; Moroni, L.; Barrias, C.C.; Granja, P.L. Biofunctionalized pectin hydrogels as 3D cellular microenvironments. J. Mater. Chem. 2015, 3, 2096–2108. [Google Scholar] [CrossRef]
- Pereira, R.F.; Barrias, C.C.; Bártolo, P.J.; Granja, P.L. Cell-instructive pectin hydrogels crosslinked via thiol-norbornene photo-click chemistry for skin tissue engineering. Acta Biomater. 2018, 66, 282–293. [Google Scholar] [CrossRef]
- Walkenström, P.; Kidman, S.; Hermansson, A.M.; Rasmussen, P.B.; Hoegh, L. Microstructure and rheological behavior of alginate/pectin mixed gels. Food Hydrocoll. 2003, 17, 593–603. [Google Scholar] [CrossRef]
- Toft, K.; Grasdalen, H.; Smidsrod, O. Synergistic gelation of alginates and pectins. In Chemistry and Function of Pectins; ACS Symposium Series; American Chemical Society: Washington, DC, USA, 1986; Volume 310, pp. 117–132. [Google Scholar] [CrossRef]
- Thom, D.; Dea, I.C.; Morris, E.R.; Powell, D.A. Interchain association of alginate and pectins. Prog. Food Nutr. Sci. 1982, 6, 97–108. [Google Scholar]
- Oakenfull, D.; Scott, A.; Chai, E. The mechanism of formation of mixed gels by high methoxyl pectins and alginates. In Gums and Stabilisers for the Food Industry, 2nd ed.; Williams, P.A., Phillips, G.O., Eds.; Woodhead Publishing: Cambridge, UK, 1990; Volume 10, pp. 243–264. [Google Scholar]
- Lofgren, C.; Walkenstrom, P.; Hermansson, A.-M. Microstructure and rheological behavior of pure and mixed pectin gels. Biomacremolecules 2002, 3, 1144–1153. [Google Scholar] [CrossRef]
- Morris, V.J.; Chilvers, G.R. Cold setting alginate-pectin mixed gels. J. Sci. Food Agric. 1984, 35, 1370–1376. [Google Scholar] [CrossRef]
- Rao, M.A.; Cooley, H.J. Rates of structure development during gelation and softening of high-methoxyl pectin-sodium alginate fructose mixtures. Food Hydrocoll. 1995, 9, 229–235. [Google Scholar] [CrossRef]
- Kovalenko, K.V.; Krivokhizha, S.V.; Masalov, A.V.; Chaikov, L.L. Correlation spectroscopy measurements of particle size using an optical fiberprobe. Bull. Lebedev Phys. Inst. 2009, 36, 95–103. [Google Scholar] [CrossRef]
- Photocor-FC. Available online: https://www.photocor.com/products/photocor-fc (accessed on 6 December 2023).
- Available online: https://www.renishaw.com/en/invia-confocal-raman-microscope-6260 (accessed on 11 November 2023).
- Fadeeva, I.V.; Trofimchuk, E.S.; Forysenkova, A.A.; Ahmed, A.I.; Gnezdilov, O.I.; Davydova, G.A.; Kozlova, S.G.; Antoniac, A.; Rau, J.V. Composite Polyvinylpyrrolidone-Sodium Alginate-Hydroxyapatite Hydrogel Films for Bone Repair and Wound Dressings Applications. Polymers 2021, 13, 3989. [Google Scholar] [CrossRef] [PubMed]
- Draget, K.I.; Phillips, G.O.; Williams, P.A. Alginate. In Handbook of Hydrocolloids; CRC Press: Abington, PA, USA, 2000; pp. 379–396. [Google Scholar]
- Fraeye, I.; Duvetter, T.; Doungla, E.; Van Loey, A.; Hendrickx, M. Fine-tuning the properties of pectin calcium gels by controlling pectin fine structure, gel composition and environmental conditions. Trends Food Sci. Technol. 2010, 21, 219–228. [Google Scholar] [CrossRef]
- Zhang, B.; Hu, B.; Nakauma, M.; Funami, T.; Nishinari, K.; Draget, K.I.; Phillips, G.O.; Fang, Y. Modulation of calcium-induced gelation of pectin by oligoguluronate as compared to alginate. Food Res. Int. 2019, 116, 232–240. [Google Scholar] [CrossRef] [PubMed]
- Nakauma, M.; Funami, T.; Fang, Y.; Nishinari, K.; Draget, K.I.; Phillips, G.O. Calcium binding and calcium-induced gelation of normal low-methoxyl pectin modified by low molecular-weight polyuronate fraction. Food Hydrocoll. 2017, 69, 318–328. [Google Scholar] [CrossRef]
- Shibayama, M. Universality and Specificity of Polymer Gels Viewed by Scattering Methods. Bull. Chem. Soc. Jpn. 2006, 79, 1799–1819. [Google Scholar] [CrossRef]
- Cummins, H.; Pike, E.R. Photon Correlation and Light Beating Spectroscopy; Plenum Press: New York, NY, USA, 1974; Volume 3. [Google Scholar]
- Dhont, J.K. An Introduction to Dynamics of Colloids; Elsevier: Amsterdam, The Netherlands, 1996; Volume 2. [Google Scholar]
- Martin, J.E.; Wilcoxon, J.P. Critical Dynamics of the Sol-Gel Transition. Phys. Rev. Lett. 1988, 61, 373–376. [Google Scholar] [CrossRef]
- Shibayama, M.; Okamoto, M. Dynamic light scattering study on gelatin aqueous solutions and gels. J. Chem. Phys 2001, 115, 4285–4291. [Google Scholar] [CrossRef]
- Muthukumar, M. Screening Effect on Viscoelasticity near the Gel Point. Macromolecules 1989, 22, 4656–4658. [Google Scholar] [CrossRef]
- Xu, X.; Cuautle, J.J.A.F.; Kouyate, K.; Roozen, N.B.; Goossens, J.; Menon, P.; Malayil, M.K.; Salenbien, R.; Rajesh, R.N.; Glorieux, C.; et al. Evolution of elastic and thermal properties during TMOS-gel formation determinedby ringing bottle acoustic resonance spectroscopy, impulsive stimulated scattering, photopyroelectric spectroscopy and the hot ball method. J. Phys. D Appl. Phys. 2016, 49, 085502. [Google Scholar] [CrossRef]
- Geissler, E. Dynamic Light Scattering in Gels and Solutions. Period. Polytech. Chem. Eng. 2022, 66, 525–535. [Google Scholar] [CrossRef]
- Chaikov, L.L.; Kirichenko, M.N.; Krivokhizha, S.V.; Kupov, M.R.; Lobanov, A.N.; Sverbil, P.P.; Nagaev, E.I.; Shkirin, A.V. Two Convenient Methods for Detection of Non-Dairy Fats in Butter by Dynamic Light Scattering and Luminescence Spectroscopy. Appl. Sci. 2023, 13, 8563. [Google Scholar] [CrossRef]
- Krivokhizha, S.V.; Kupov, M.R.; Lobanov, A.N.; Sverbil, P.P.; Chaikov, L.L. A Simple New Way to Detect Butter Adulteration by Palm Oil Using Luminescence. Bull. Lebedev Phys. 2022, 49, 444–449. [Google Scholar] [CrossRef]
- Wu, P.M.; Chung, C.Y.; Chen, Y.R.; Su, Y.H.; Chang-Liao, K.S.; Chi, P.W.; Paul, T.; Chen, Y.J.; Chen, Y.L.; Wang, S.F.; et al. Vibrational and electrochemical studies of pectin-a candidate towards environmental friendly lithium-ion battery development. PNAS Nexus 2022, 1, pgac127. [Google Scholar] [CrossRef] [PubMed]
- Synytsya, A.; Copıkova, J.; Matejka, P.; Machovic, V. Fourier transform Raman and infrared spectroscopy of pectins. Carbohydr. Polym. 2003, 54, 97–106. [Google Scholar] [CrossRef]
- Schmid, T.; Messmer, A.; Yeo, B.S.; Zhang, W.; Zenobi, R. Towards chemical analysis of nanostructures in biofilms II: Tip-enhanced Raman spectroscopy of alginates. Anal. Bioanal. Chem. 2008, 391, 1907–1916. [Google Scholar] [CrossRef]
- Winning, H.; Viereck, N.; Salomonsen, T.; Larsen, J.; Engelsen, S.B. Quantification of blockiness in pectins-A comparative study using vibrational spectroscopy and chemometrics. Carbohydr. Res. 2009, 344, 1833–1841. [Google Scholar] [CrossRef]
- Sekkal, M.; Doincq, V.; Legrand, P.; Huvenne, J.P. Investigation of the glycosidic linkages in several oligosaccharides using FTIR and FT-Raman spectroscopies. J. Mol. Struct. 1995, 349, 349. [Google Scholar] [CrossRef]
- Pielesz, A.; Klimczak, M.; Bak, K. Raman spectroscopy and WAXS method as a tool for analysing ion-exchange properties of alginate hydrogels. Int. J. Biol. Macromol. 2008, 43, 438. [Google Scholar] [CrossRef] [PubMed]
- Edwards, H.G.M.; Falk, M.J.; Sibley, M.G.; Alvarez-Benedi, J.; Rull, F. GEORAMAN 2007. Spectrochim. Acta Part A 1998, 54, 903. [Google Scholar] [CrossRef]
- Campos-Vallete, M.M.; Chandía, N.P.; Clavijo, E.; Leal, D.; Matsuhiro, B.; Osorio-Román, I.O.; Torres, S. Characterization of sodium alginate and its block fractions by surface-enhanced Raman spectroscopy. J. Raman Spectrosc. 2009, 41, 758–763. [Google Scholar] [CrossRef]
- Baranska, M.; Schulz, H.; Baranski, R.; Nothnagel, T.; Christensen, L.P. In situ simultaneous analysis of polyacetylenes, carotenoids and polysaccharides in carrot roots. J. Agric. Food Chem. 2005, 53, 6565–6571. [Google Scholar] [CrossRef]
- Biswal, T.; Barik, B.; Sahoo, P.K. Synthesis and characterization of magnetite-pectin-alginate hybrid bionanocomposite. Sci. Nanotechnol. 2016, 4, 203. [Google Scholar] [CrossRef]
- Nkenmogne Kamdem, I.E.; Saidou, C.; Ngassoum, M.B.; Ndjouenkeu, R. Synergistic interactions in dilute aqueous solutions between alginate and tropical vegetal hydrocolloids. Heliyon 2020, 6, e04348. [Google Scholar] [CrossRef]
- Zamri, N.I.I.; Zulmajdi, S.L.N.; Daud, N.Z.A. Insight into the adsorption kinetics, mechanism, and thermodynamics of methylene blue from aqueous solution onto pectin-alginate-titania composite microparticles. SN Appl. Sci. 2021, 3, 222. [Google Scholar] [CrossRef]


| θ | Alginate (A) | Pectin (P) | Alginate + Pectin (AP) |
|---|---|---|---|
| 35° | 162.5 ± 2 | 31.7 ± 7.7 | - |
| 311 ± 11 | - | - | |
| 45° | 153.5 ± 6.0 | 25.7 ± 5.5 | 3.36 ± 1.35 |
| 309 ± 9 | - | 11.9 ± 1.3 | |
| 60° | 162.2 ± 1.2 | 31.5 ± 1.4 | 4.4 ± 0.4 |
| 321 ± 14 | - | 11.4 ± 2.0 | |
| 120° | 155.0 ± 0.9 | 24.0 ± 3.2 | 3.12 ± 0.16 |
| - | - | 12.1 ± 1.6 |
| Angle | Value | Alginate | Pectin | Mixture 1:1 |
|---|---|---|---|---|
| 45° | Γ (s−1) | 82.6 ± 10.2 | 3.30 ± 0.25 | 3.64 ± 1.54 |
| Γ/q2 × 10−9 (cm2/s) | 8.05 | 0.322 | 0.355 | |
| (s−1) | 153.5 ± 6.0 | 25.7 ± 5.5 | 3.36 ± 1.35 | |
| (s−1) | 309 ± 9 | - | 11.9 ± 1.3 | |
| (s−1) | - | - | 1.26 * | |
| B/A | 0.230 ± 0.008 | 0.033 ± 0.007 | 0.09 ± 0.02 0.491 * | |
| 60° | Γ (s−1) | 146.3 ± 0.007 | 5.86 ± 0.17 | 5.46 ± 0.18 |
| Γ/q2 × 10−9 (cm2/s) | 8.35 | 0.334 | 0.311 | |
| (s−1) | 162.2 ± 1.2 | 31.5 ± 1.4 | 4.4 ± 0.4 | |
| (s−1) | 321 ± 14 | - | 11.4 ± 2.0 | |
| B/A | 0.204 ± 0.032 | 0.033 ± 0.002 | 0.075 ± 0.016 | |
| 120° | Γ (s−1) | 118.7 ± 0.008 | 15.6 ± 0.06 | 17.4 ± 0.06 |
| Γ/q2 × 10−9 (cm2/s) | 2.26 | 0.297 | 0.331 | |
| (s−1) | 155 ± 0.9 | 24.0 ± 3.2 | 3.12 ± 0.16 | |
| (s−1) | - | - | 12.1 ± 1.6 | |
| B/A | 0.340 ± 0.013 | 0.109 ± 0.03 | 0.103 ± 0.007 |
| Sample | Total Number of Cells per mm2 | Number of Non-Viable Cells per mm2 | Viability, % |
|---|---|---|---|
| Sodium alginate | 198.6 ± 20.6 | 1.6 ± 1.3 | 99.2 ± 0.2 |
| Pectin | 187.4 ± 11.7 | 3.4 ± 1.7 | 98.2 ± 0.3 |
| Sodium alginate/pectin | 187.0 ± 9.7 | 3.4 ± 1.5 | 98.1 ± 0.2 |
| Control | 206.0 ± 16.4 | 0.4 ± 0.5 | 99.8 ± 0.1 |
Disclaimer/Publisher’s Note: The statements, opinions and data contained in all publications are solely those of the individual author(s) and contributor(s) and not of MDPI and/or the editor(s). MDPI and/or the editor(s) disclaim responsibility for any injury to people or property resulting from any ideas, methods, instructions or products referred to in the content. |
© 2024 by the authors. Licensee MDPI, Basel, Switzerland. This article is an open access article distributed under the terms and conditions of the Creative Commons Attribution (CC BY) license (https://creativecommons.org/licenses/by/4.0/).
Share and Cite
Davydova, G.A.; Chaikov, L.L.; Melnik, N.N.; Gainutdinov, R.V.; Selezneva, I.I.; Perevedentseva, E.V.; Mahamadiev, M.T.; Proskurin, V.A.; Yakovsky, D.S.; Mohan, A.G.; et al. Polysaccharide Composite Alginate–Pectin Hydrogels as a Basis for Developing Wound Healing Materials. Polymers 2024, 16, 287. https://doi.org/10.3390/polym16020287
Davydova GA, Chaikov LL, Melnik NN, Gainutdinov RV, Selezneva II, Perevedentseva EV, Mahamadiev MT, Proskurin VA, Yakovsky DS, Mohan AG, et al. Polysaccharide Composite Alginate–Pectin Hydrogels as a Basis for Developing Wound Healing Materials. Polymers. 2024; 16(2):287. https://doi.org/10.3390/polym16020287
Chicago/Turabian StyleDavydova, Galina A., Leonid L. Chaikov, Nikolay N. Melnik, Radmir V. Gainutdinov, Irina I. Selezneva, Elena V. Perevedentseva, Muhriddin T. Mahamadiev, Vadim A. Proskurin, Daniel S. Yakovsky, Aurel George Mohan, and et al. 2024. "Polysaccharide Composite Alginate–Pectin Hydrogels as a Basis for Developing Wound Healing Materials" Polymers 16, no. 2: 287. https://doi.org/10.3390/polym16020287
APA StyleDavydova, G. A., Chaikov, L. L., Melnik, N. N., Gainutdinov, R. V., Selezneva, I. I., Perevedentseva, E. V., Mahamadiev, M. T., Proskurin, V. A., Yakovsky, D. S., Mohan, A. G., & Rau, J. V. (2024). Polysaccharide Composite Alginate–Pectin Hydrogels as a Basis for Developing Wound Healing Materials. Polymers, 16(2), 287. https://doi.org/10.3390/polym16020287