1. Introduction
Materials used for applications such as membranes, filters, scaffolds, and wound dressings require certain features, for instance, mechanical consistency, biocompatibility, biodegradability, and a particular microstructure or morphology, to satisfy their expected performance. Materials that are constituted by submicrometric materials or nanofibers are able respond to these requirements due to their specific morphology, size and potential orientation [
1]. The morphology and topography of materials can highly influence their final properties. These properties include, among others, mechanical properties [
2], wettability [
3,
4], adhesion, and a differentiation of the cells can be affected [
5]. A particular case is represented by fibrous materials, as fibers have a high aspect ratio which can lead to a higher impact on the final morphology and even on the topography from, for example, the preferential orientation of the fibers [
6].
Well controlled architectures and morphologies can be achieved by electrospinning. It has been stated that the orientation of electrospun material may have a profound effect on cells [
7,
8]. In addition, one study by Zhao et al., showed that PLA nanofibers with immobilized hyaluronic acid are more efficient against cancer cells than disordered nanofibers [
9].
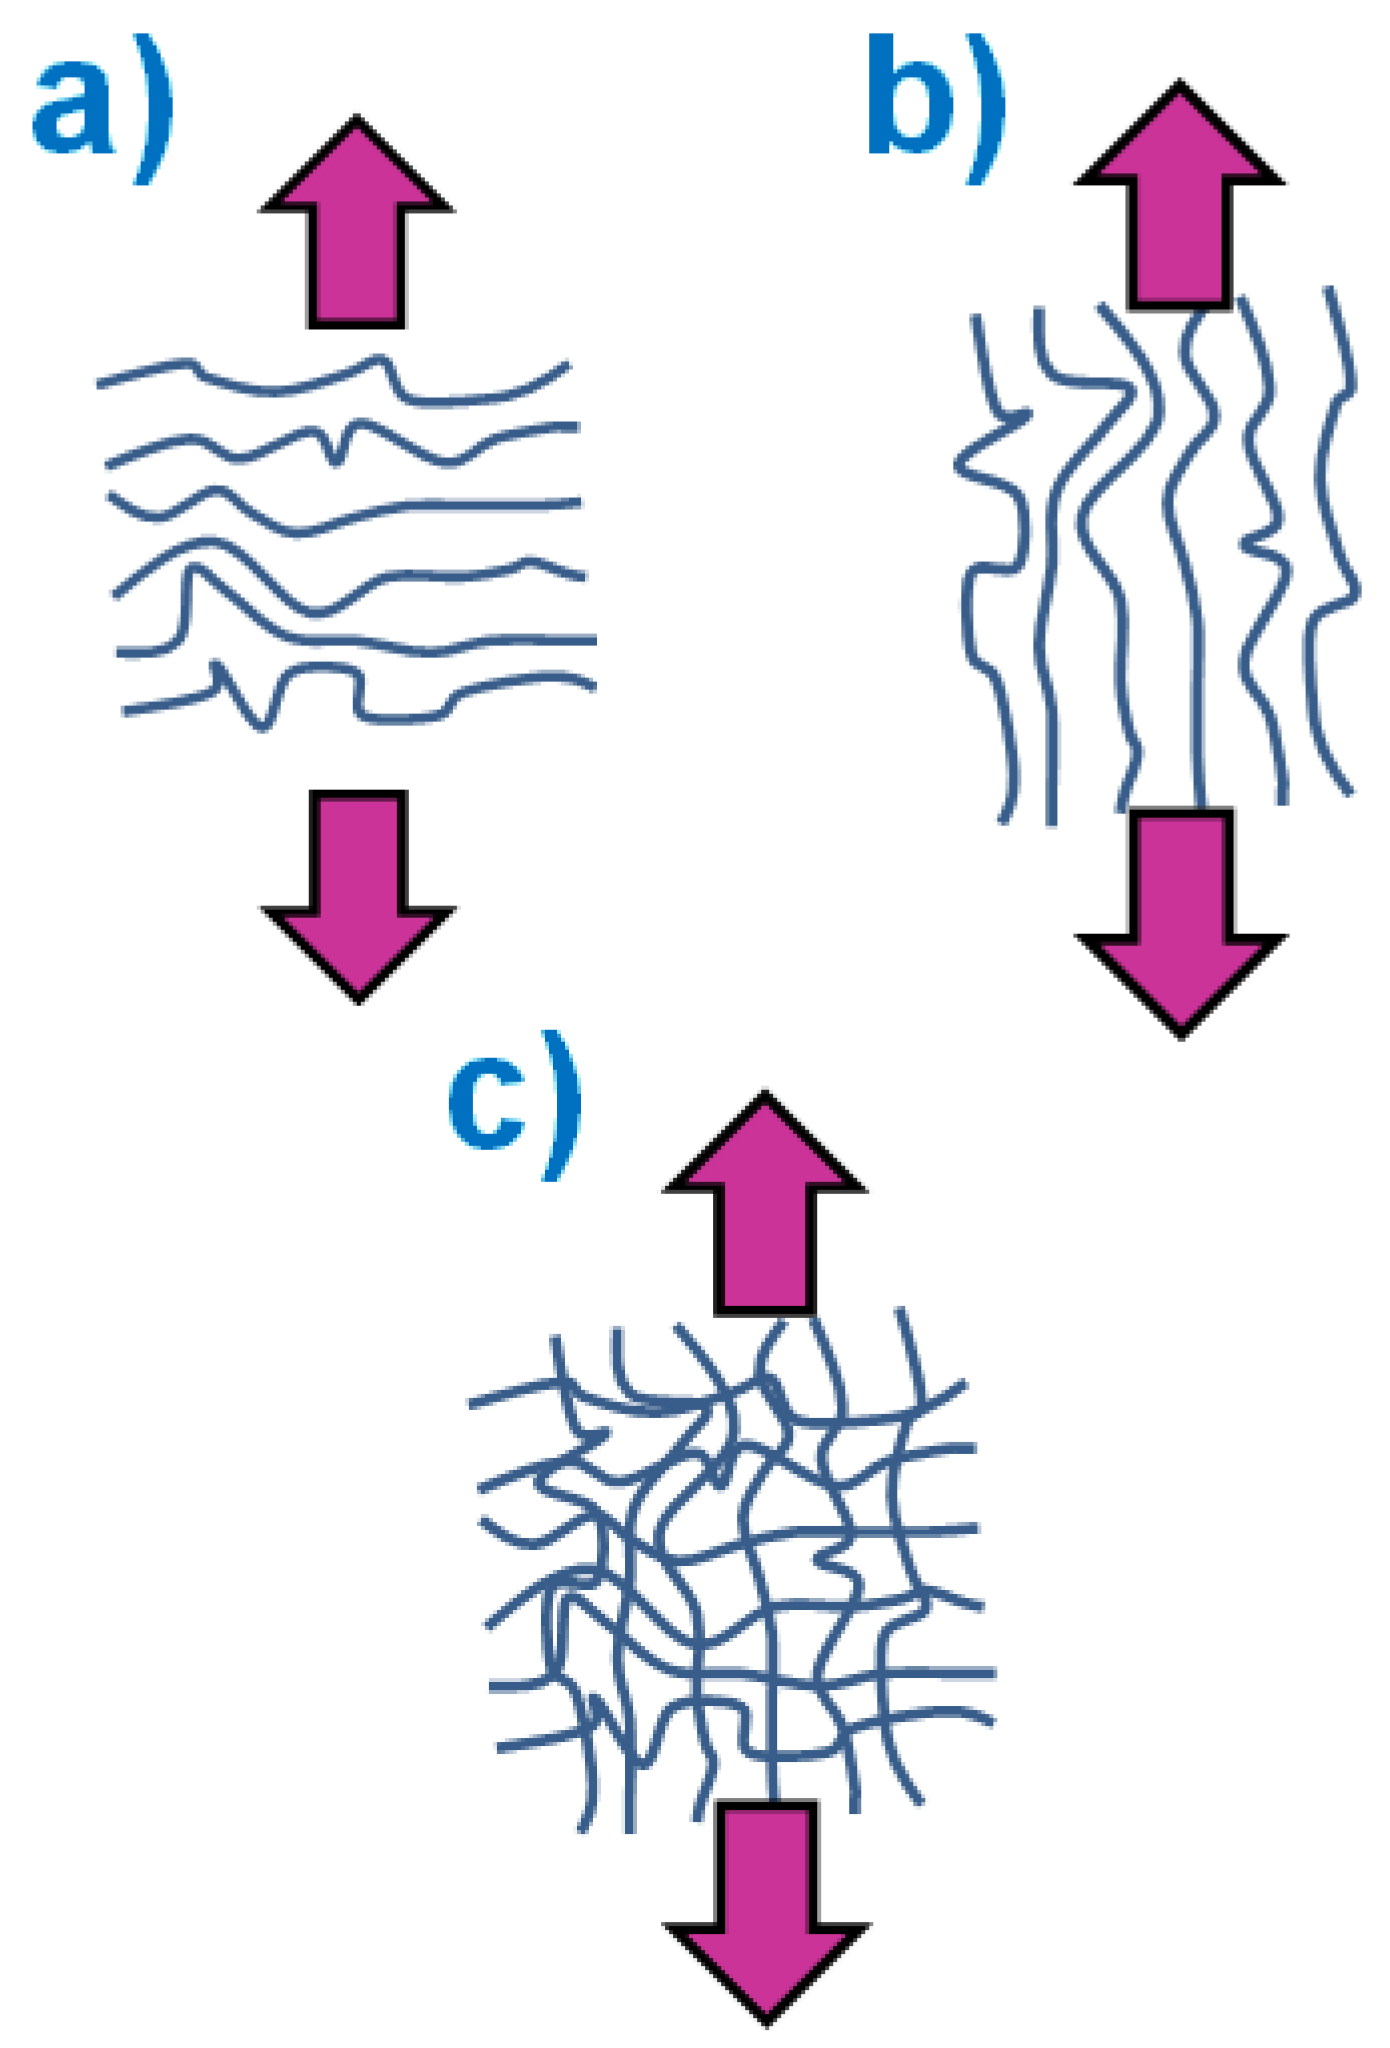
Fibrillar morphology can also affect mechanical properties. This occurs mainly as a result of two contributions: firstly, the size and shape of the fibers and, secondly, the preferential orientation of the fibers, such as those schematically represented in
Figure 1.
We can clearly realize how the direction of application of mechanical loads may affect the material response. When a load is applied parallel to the direction of the long axis of the fibers, better transmission of loads onto fibers is expected and therefore higher mechanical resistance. In fact, M. Lorente et al. have recently showed this behavior in the particular case of polyethylene oxide fibrous materials [
2]. Besides mechanical properties and cell growth [
10], fiber morphology and orientation can affect the wettability of materials. Several works have showed how morphology can affect the wettability behavior of materials. For instance, in the particular case of polystyrene, it has been reported that, when the material is prepared with a clear flat surface, the water contact angle is around 90°; however, when its morphology arises from submicrometric fibers it is possible for the same polymer to show superhydrophobic behavior even with water contact angles that are clearly higher than 150° [
11].
Currently, several methods have been described to prepare materials which allow for the achievement of well-controlled architectures and morphologies that in turn are sometimes even able to mimic the structures of living tissues [
8]. Among the methods by which to prepare materials constituted by submicrometric fibers, electrospinning (ES) has, as already mentioned, gained popularity. ES allows for the obtaining of highly porous materials that are mainly constituted by fibers that may have diameters below 100 nm. These nanofibers can mimic extracellular matrices, such as those that can be found in the dermic layer of the skin, and, as a consequence, it is expected they can stimulate cells favoring tissue regeneration [
12]. In summary, ES is based on the interaction between a polymer solution emerging from a capillary and a high electric field when applying a potential between the capillary and a collector. As a consequence of the interaction, the polymer solution can be stretched to form fibers while the solvent is evaporating. Although it has been demonstrated that, after choosing adequate ES processing conditions, quite homogeneous materials can be obtained in terms of morphology, certain concerns affect the final use of ES for certain purposes. For example, relatively low production rates are obtained as, in most cases, the solution feeding rate needs to be low. Furthermore, the necessity of a high electric field also introduces difficulties to the process. This is because not all of the systems can interact properly with it to overcome the force exerted on the solution. Because of this, several researchers have more recently been paying attention to another method, known as solution blow spinning (SBS) [
13,
14,
15,
16,
17,
18]. In SBS a polymer solution is injected with the aid of a syringe. A stream of a polymer solution is stretched and projected onto a collector by the action of a pressurized gas. The process is similar to electrospinning, although, in this case, the driving force for stretching the solution is pressurized gas instead of an intense electric field, which makes it more versatile for the preparation of materials. Moreover, solution blow spinning has the potential to be used in situ [
19], for example, during a surgical procedure applied directly to the body or a wound, which can be convenient for its use in the preparation of biomaterials.
As has been mentioned, regardless of the nature of a material, microstructure can significantly affect the final properties. In the general case of porous materials, the size, shape and number of pores are important microstructural characteristics to consider. These are factors that, in the particular case of fibrous materials, are directly related with the size, concentration and preferential orientation of fibers. Besides, when extrapolating this microstructure to the surface of the materials important consequences can also be expected. Because of the high aspect ratio, when fibrillar microstructures are considered for scaffolds cells [
20] there is also a lot of interest in controlling the orientation of microfeatures. In particular, it is known that the regeneration of highly ordered structures such as those associated with tendons and ligaments can only be carried out effectively in supports (“scaffolds”) that can provide a topographic guide for cells [
20]. In fact, since extracellular matrices are formed by organized collagen fibers, many studies have been carried out on the effect of fiber alignment obtained by electrospinning on several types of cells [
21,
22]. The existence of an intense electric field in ES may be a factor favoring the preferential orientation since the stretching of the solution should occur following the field lines; however, as it was mentioned above the necessity of using an electric field might be a disadvantage. Due to this, other methods such as SBS also able to produce fibers should be investigated.
A few works have focused on the use of SBS [
23] and ES [
24,
25] to obtain fibrous materials where their constituted fibers show preferential orientations. However, the reported distributions of fibers orientations may be confusing since the analysis is usually based on the use of very complicated methods of image analysis [
24,
25] which results depends on the previous preparation of the image (brightness, contrast, etc.) and on the values of the parameters required by the model to carry out the analysis. Some other works studied the preferential orientation from the simple use of ImageJ software through a manual analysis, by directly measuring the angle associated to the position of the long axis of the fibers on the images obtained by SEM [
26,
27]. In a work carried out by Jian Zhong et al. in 2015, highly aligned electrospun material was obtained, and reported angles corresponding to the nanofibers’ orientation were low and showing monomodal distribution [
26]. In another work by Li, Y et al. 2021, ImageJ analysis of manually measured fibers showed that in ES, the increase of rotational speed of the collector up to 2000 RPM, enables obtaining aligned nanofibers, while with rotational speeds of collector around 300 RPM, orientation was random [
27]. Therefore, it is reasonable to think that there is still a necessity of using easy and comprehensible methods of image analysis to study morphology quantitatively or at least semi-quantitatively.
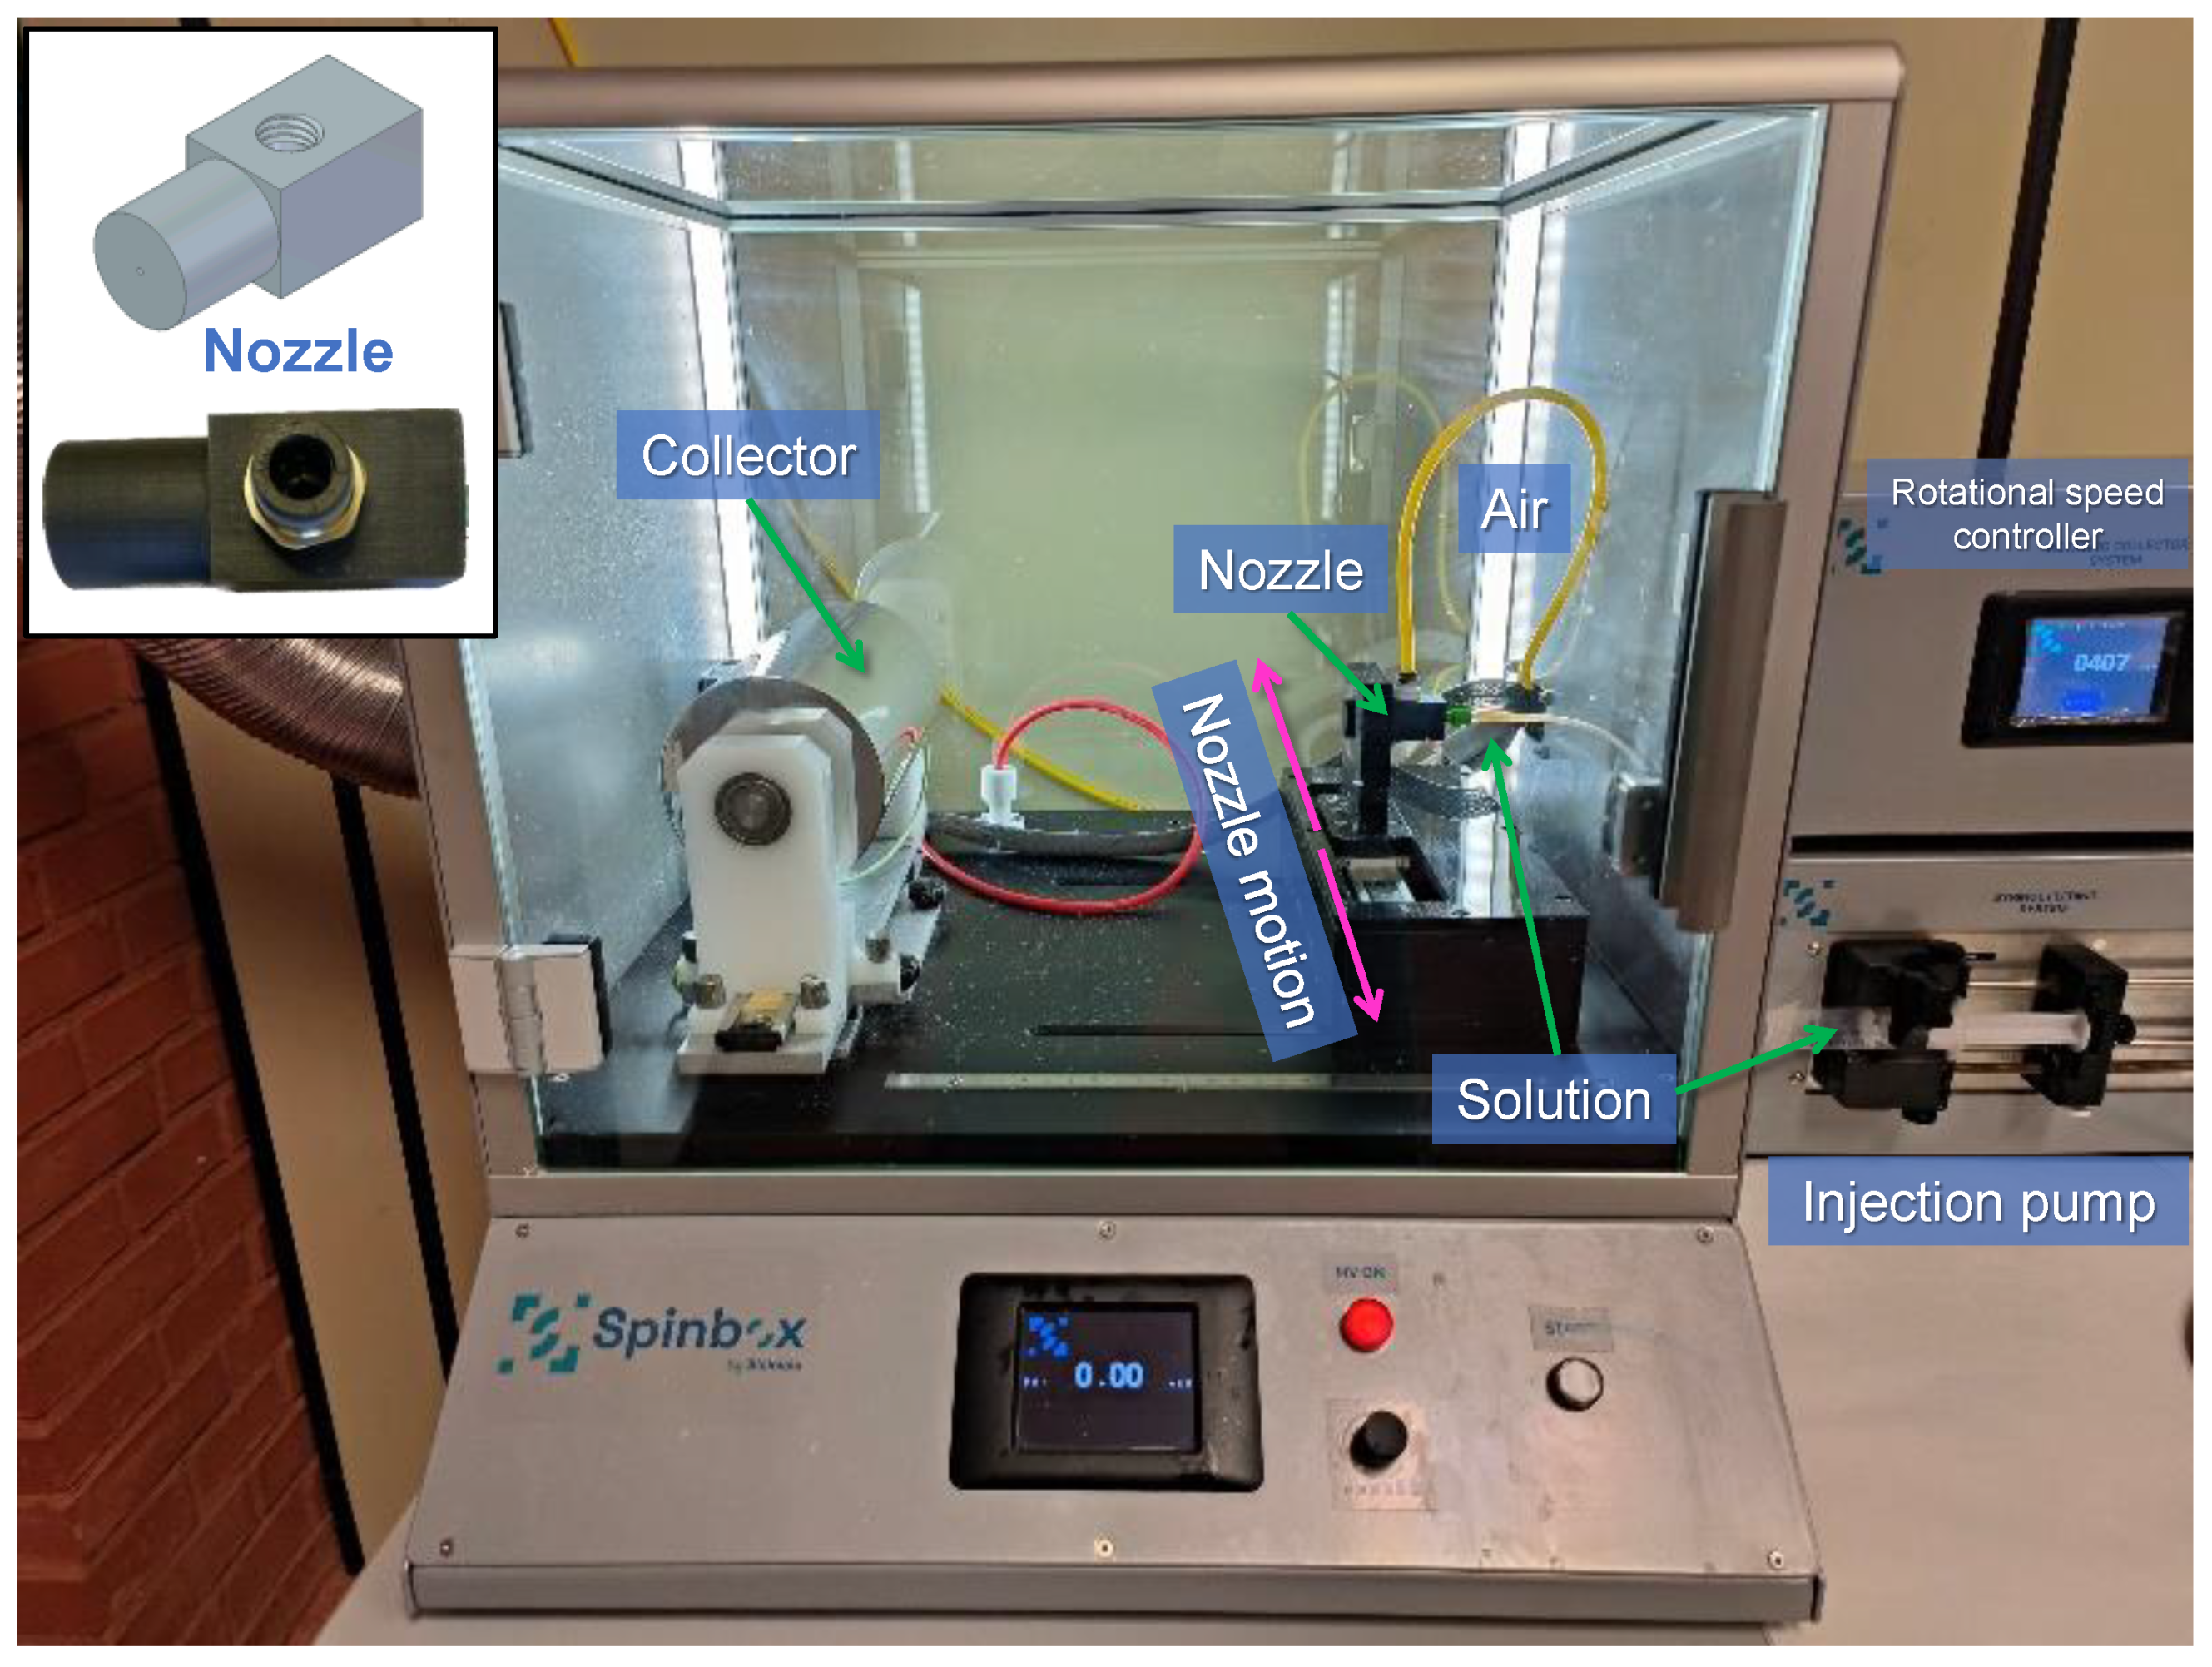
In this work, polylactic acid materials are prepared using a modified electrospinning device to carry out solution blow spinning with the intention of obtaining morphologies constituted by submicrometric fibers. The main aim of the work is to modify the morphology of the PLA in order to understand its influence on different properties and, as a consequence, on the performance of the material. As the unique variable used to modify the morphology, the rotational speed of a cylindrical collector is considered (250, 500, 1000 and 2000 rpm). Morphological and structural characterization of the SBS prepared PLA materials is carried out looking for their relationship with mechanical and wettability behavior, as well as with the adhesion and development of DH5-α E. coli bacteria.
3. Results and Discussion
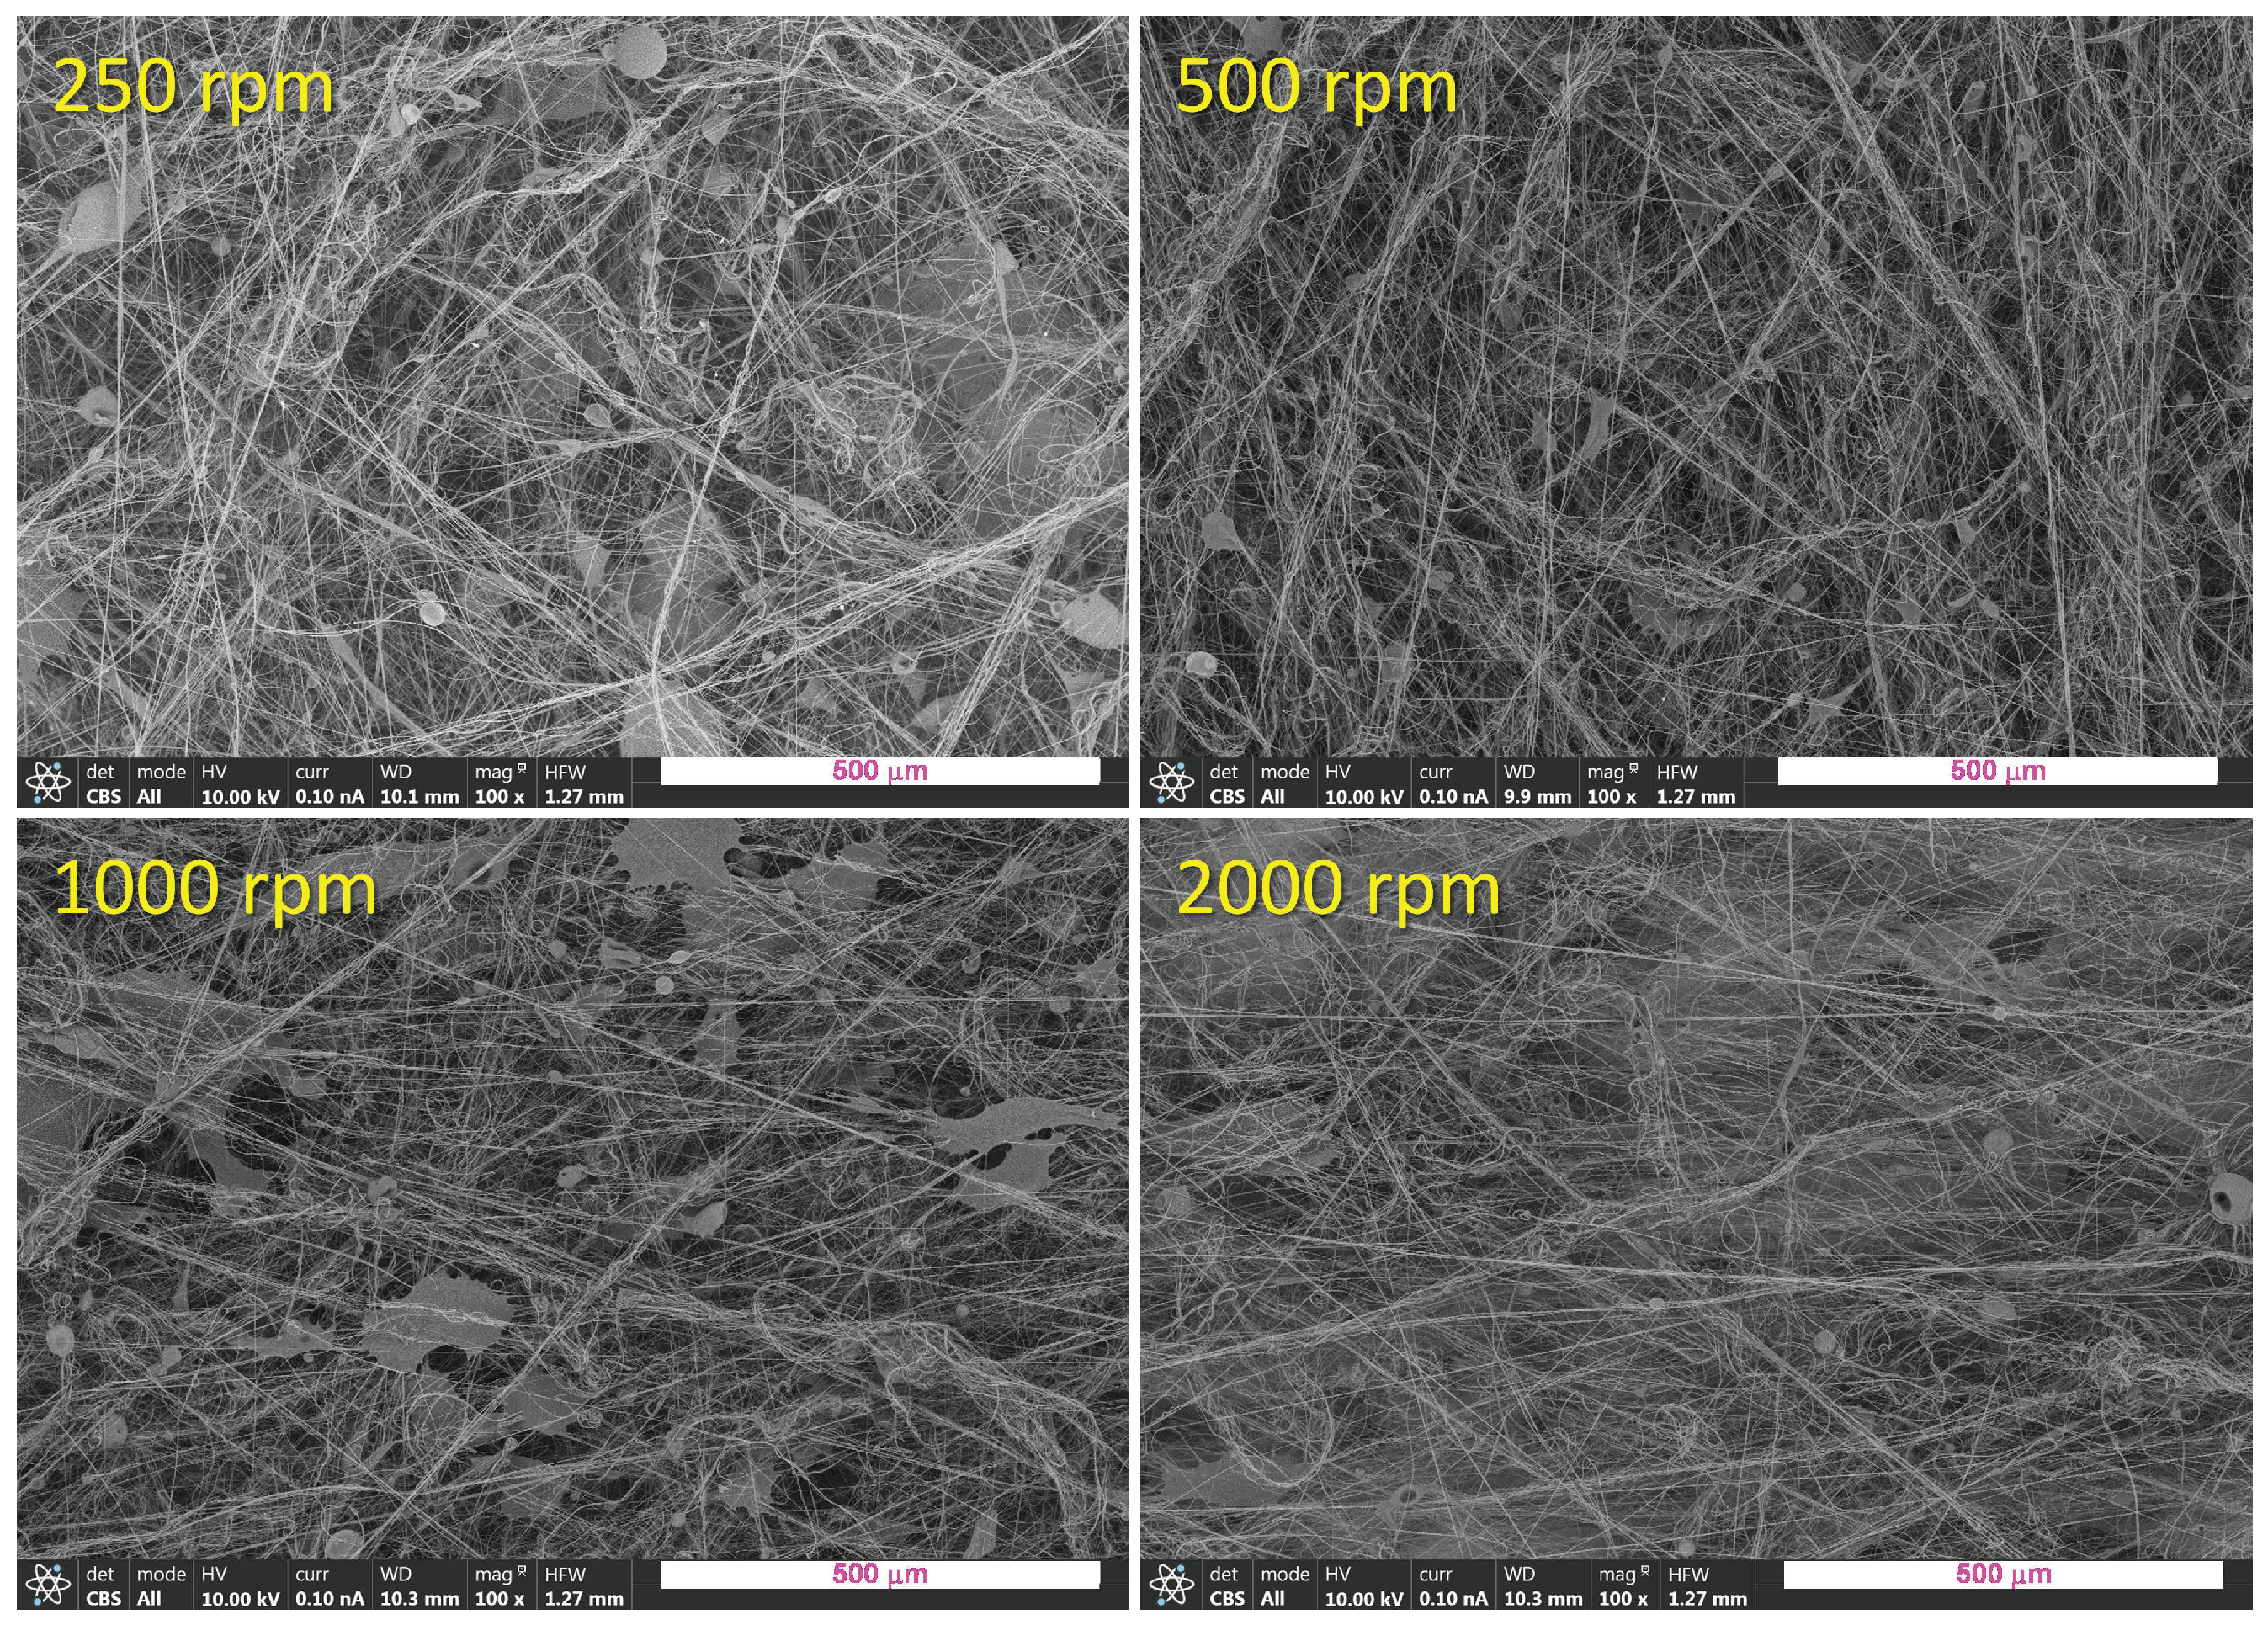
In the
Figure 3 FESEM images of the PLA mats obtained at different rotational speeds of the collector are shown at a magnification of 100×. All the materials are mainly constituted by fibers showing quite similar morphology where differences in microfeatures cannot be observed, probably because of the relatively low magnification used. In order to have quantitative information arising from the morphology, higher magnification was used and a careful image analysis was carried out by the use of the free software ImageJ.
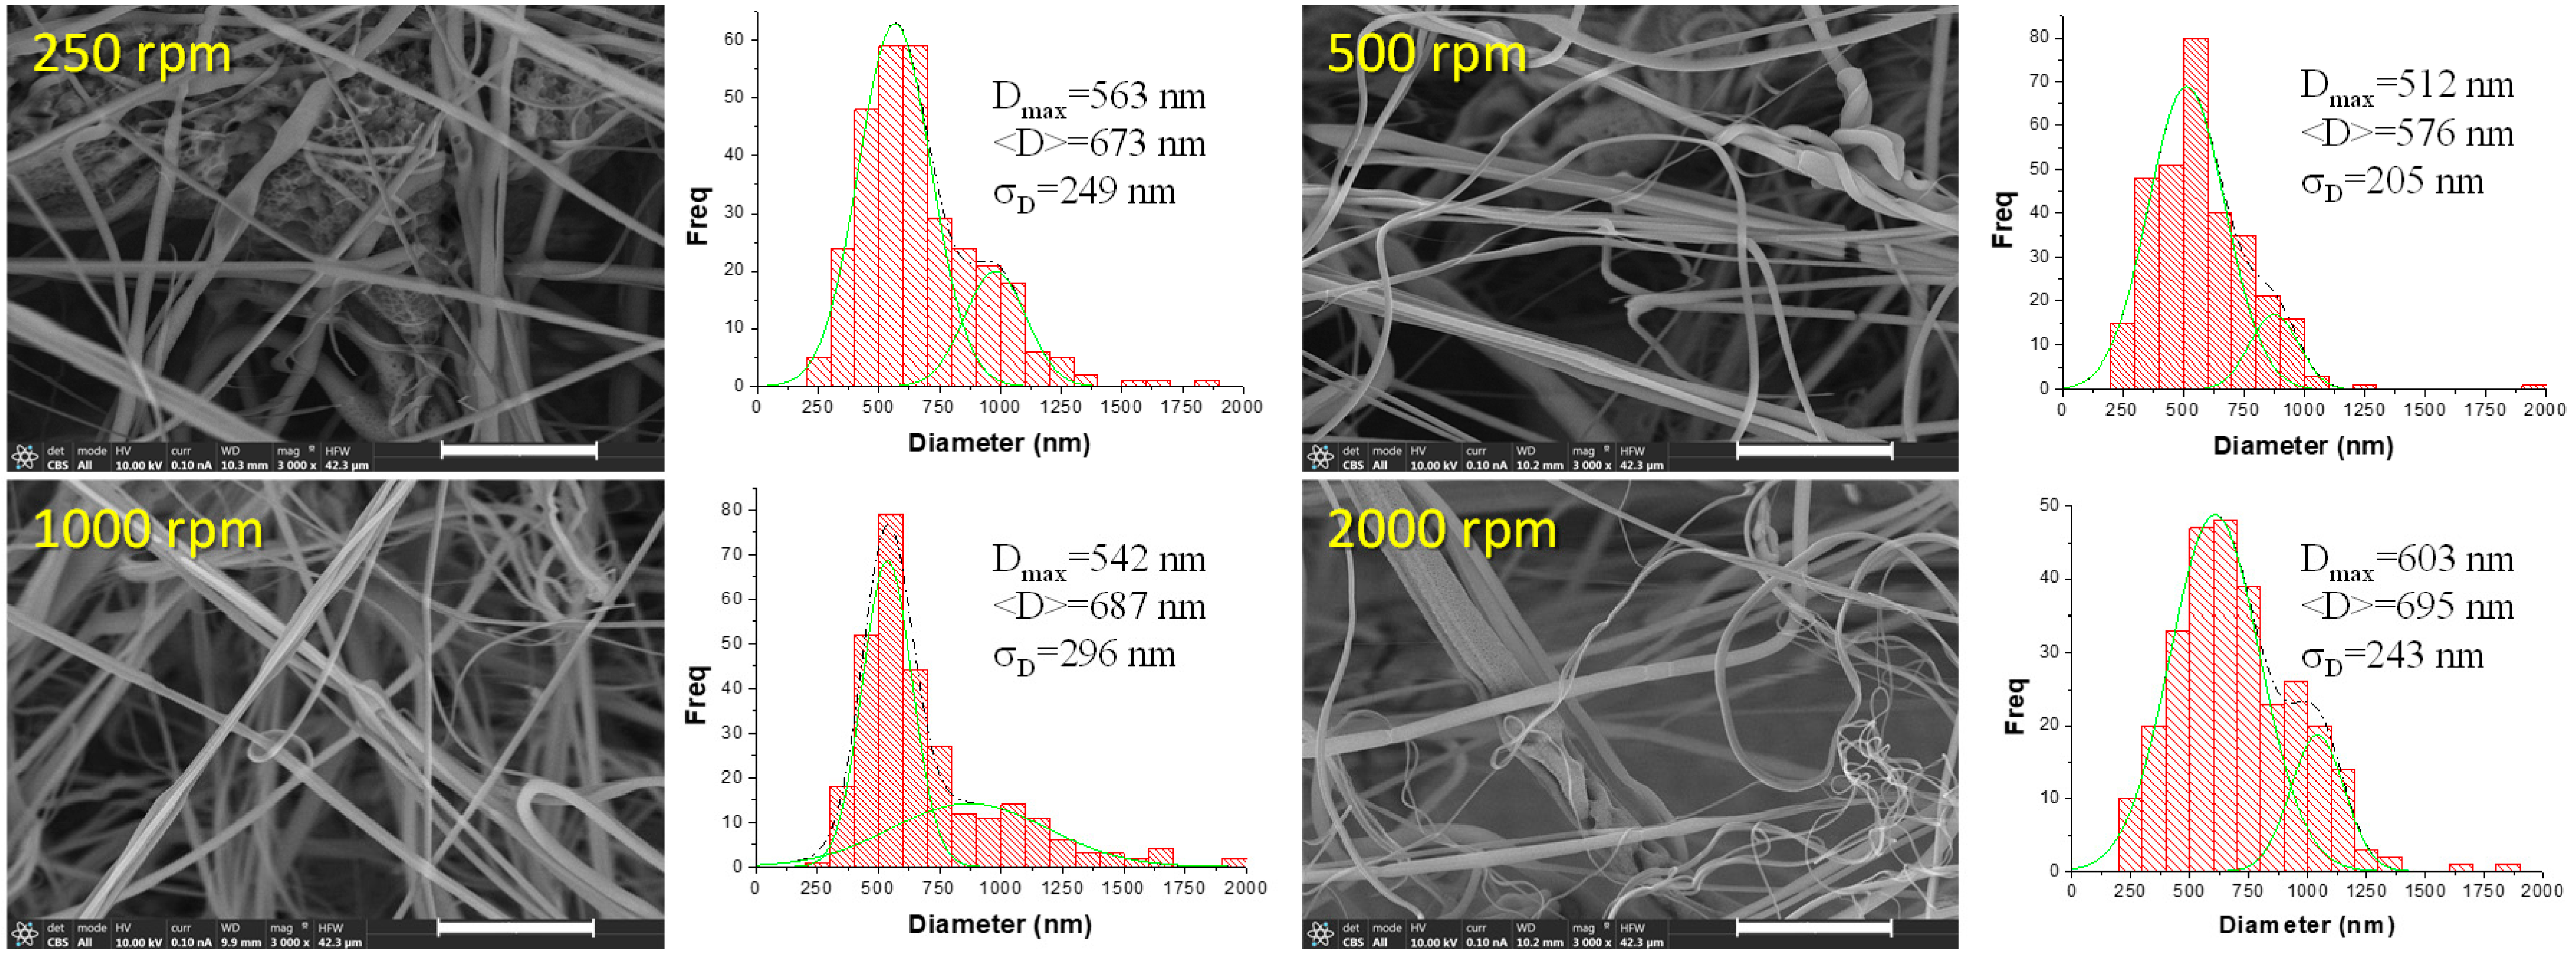
In the
Figure 4, FESEM images obtained at higher magnification for the PLA mats are shown together with distributions (bar histograms) of fiber sizes in terms of their diameters. In order to better visualize the diameter distributions, they were fitted by multi-Gaussian functions (green dashed lines). As can be seen, all the materials are constituted by submicrometric fibers with diameters ranging from 100 nm to 2000 nm. Although the size of the fibers is very similar regardless of the rotational speed of the collector used, there is a slight decrease in the diameters of fibers and in the width of the diameters distribution when the collector RS increases from 250 rpm to 1000 rpm. Then, at 2000 rpm, the average diameter and the width of the distribution increase. These observations can be confirmed by extracting several parameters from the diameter distributions such as the average of the distribution or the average diameter,
<D>, the diameter with maximum probability,
Dmax, and the standard deviation,
σD (
Table 2).
Although differences are small, a possible explanation of the results obtained can be the consideration of an extra fiber drawing because of longitudinal stress exerted by the rotating collector when the fiber is attached to it. In principle, it is expected to exert more stress on the fiber using higher rotational speed and that is what is observed, until 1000 rpm. However, in the case of 2000 rpm, the distribution of diameters is more heterogeneous (wider distribution) and, on average, the size of the fibers increases. One possible reason to explain this result can be the strong interaction existing between the air and the surface of the collector which can create uncontrolled currents of air. The formation of a kind of turbulences might avoid proper attachment of the fibers on the collector without being able to exert the corresponding stress considered above.
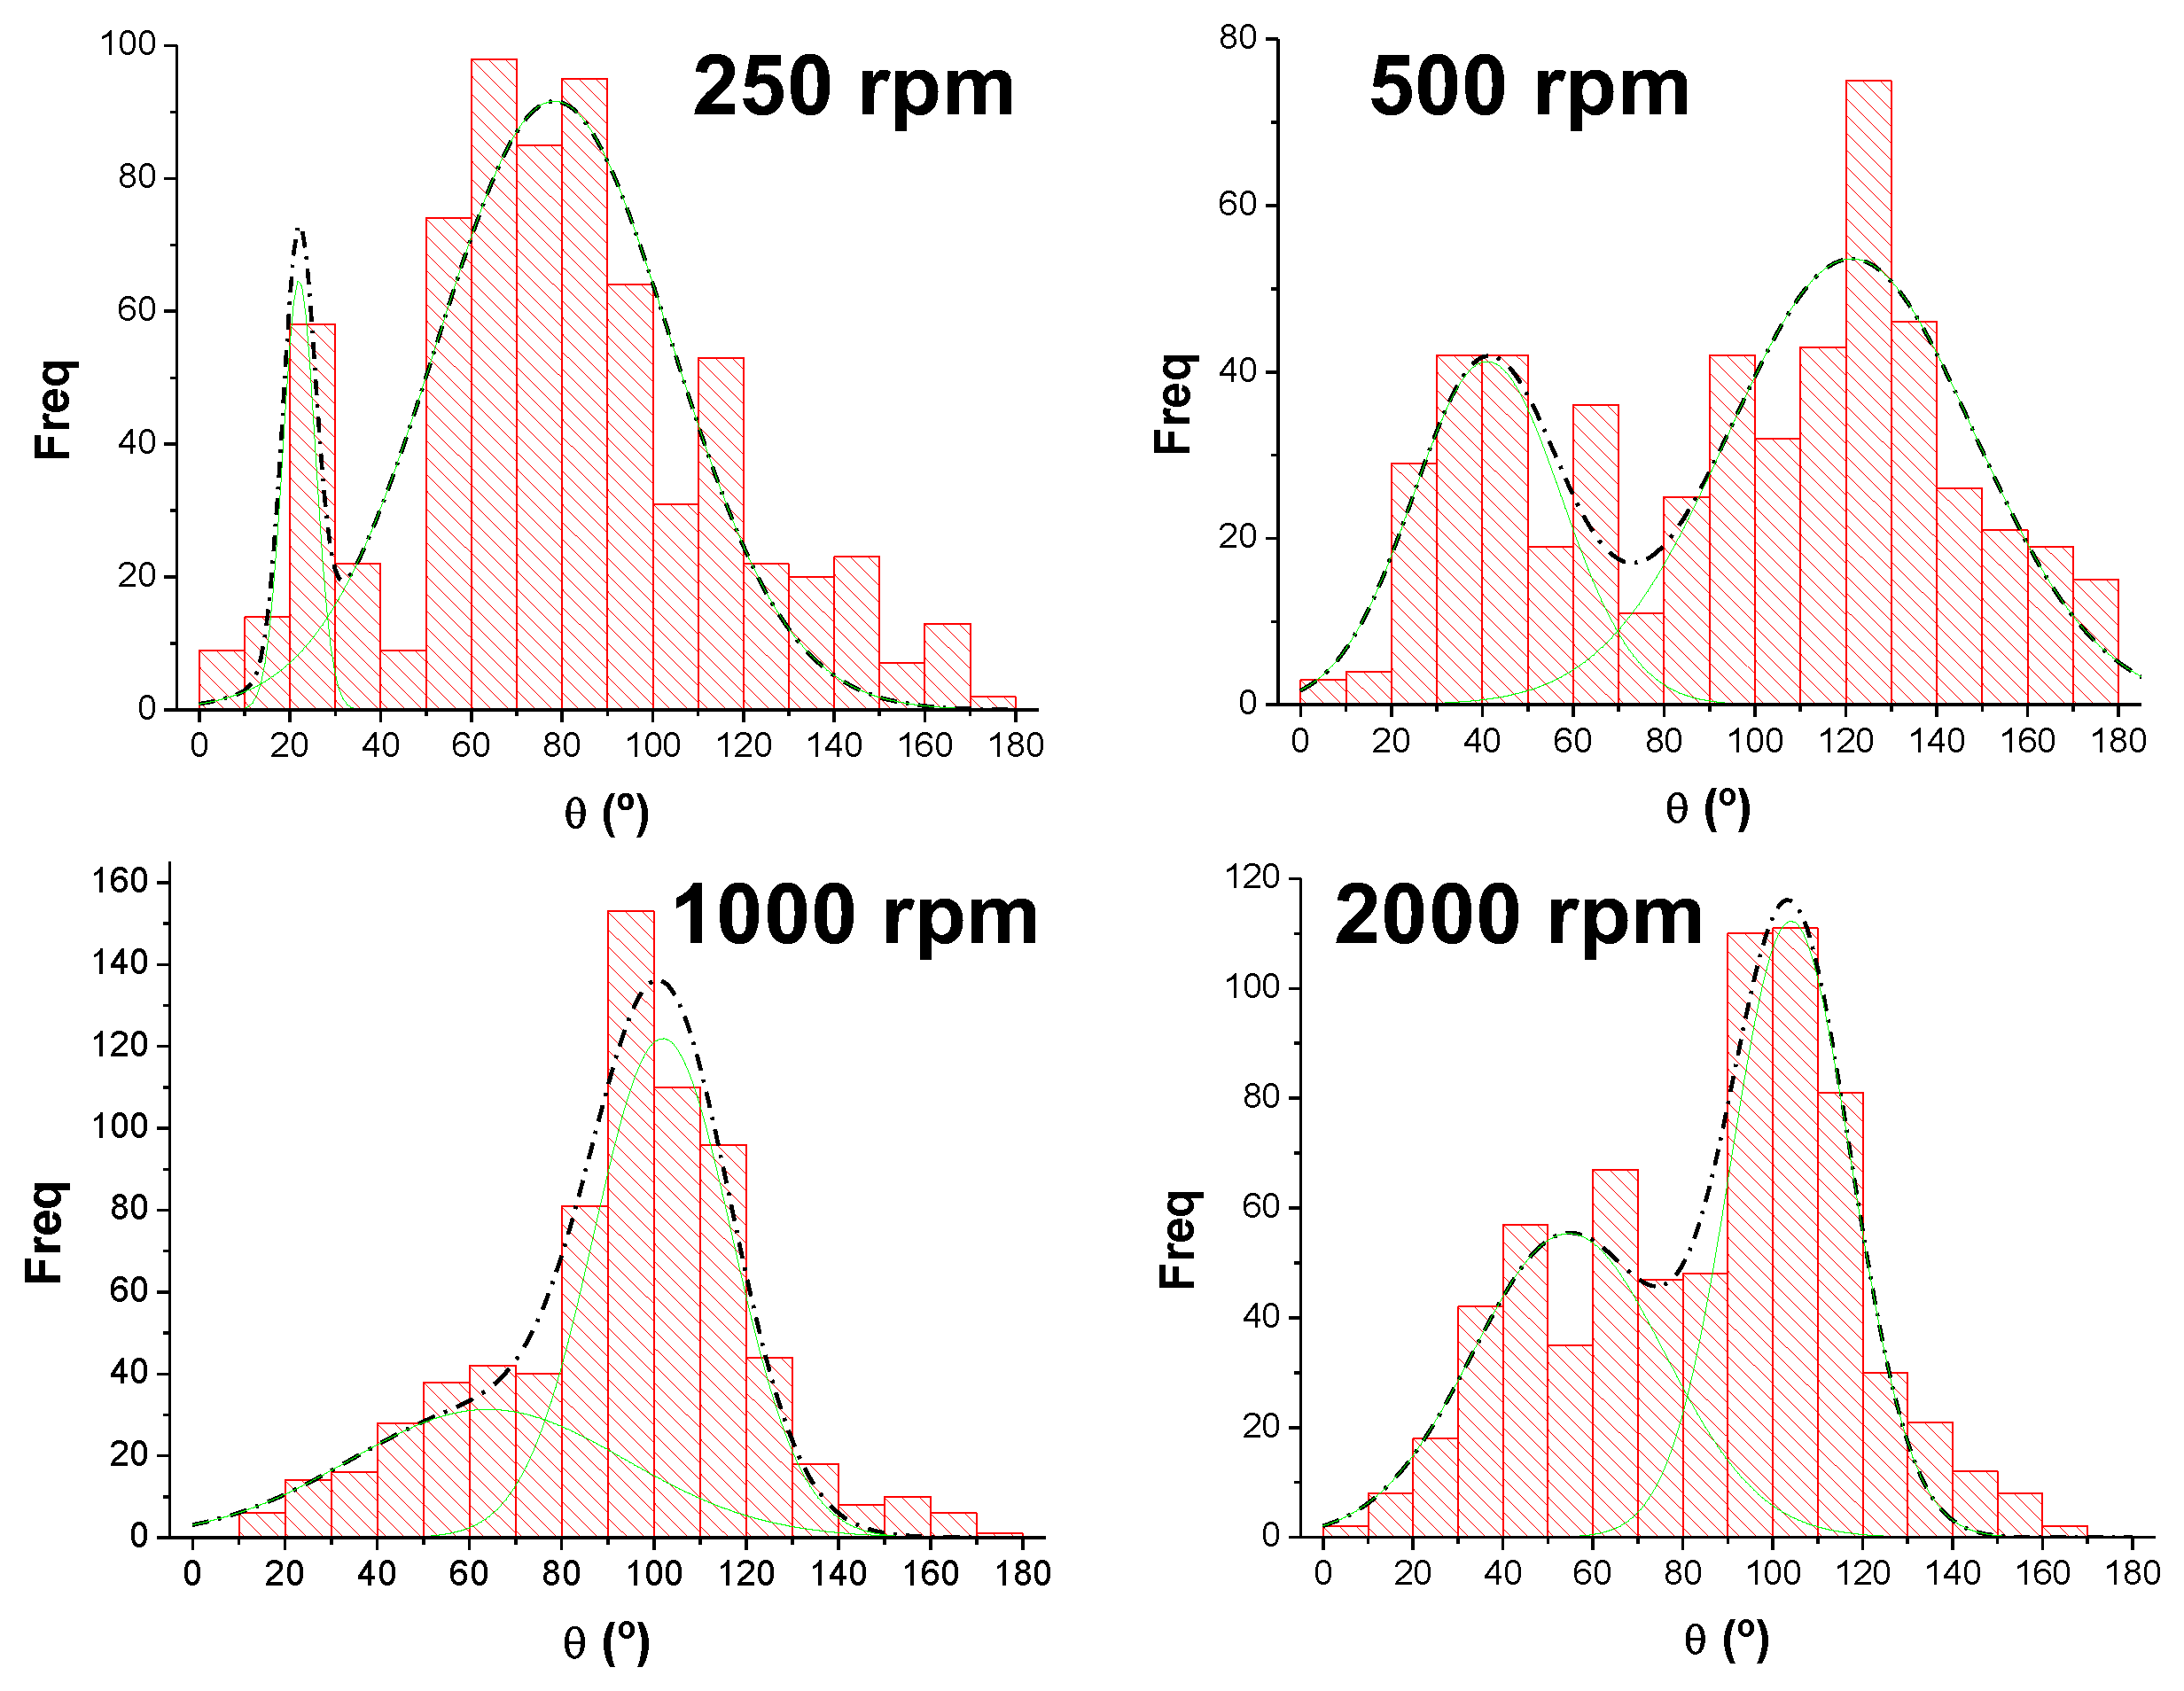
On the other hand, the orientation of the fibers was also analyzed with ImageJ. In general, distributions of angles corresponding to different orientations as those shown in
Figure 5 are obtained. As can be seen, these distributions were bimodal. These bimodal distributions can be explained by considering the way of obtaining the materials. When the SBS device is working, the nozzle is continuously moving following a perpendicular direction to that of the collector rotation. For this reason, when the nozzle is moving to one side, it is expected to have a preferred orientation of the fibers while, when it is moving to the other side it is expected to have another preferred orientation for them [
29]. Therefore, one would expect that the difference between two preferred orientations were lower as the higher rotational speed is used because each time the fibers collection should be more controlled by the collector rotation. Distributions shown in the
Figure 5 almost confirmed what was expected.
In general, it is observed that the higher the rotational speed the more oriented the fibers (each time the maxima of the two preferential orientations associated with the bimodal distribution are closer or less distinguished from each other). However, at 2000 rpm a wider distribution than the one corresponding to 1000 rpm is obtained. This result can be explained considering that too high rotational speed of the solid collector may cause air currents that may avoid proper collection of fibers, leading to more random deposition of fibers on the collector.
Another parameter highly related to the morphology is the porosity estimated in this work by the use of the Equation (2). In the last column of the
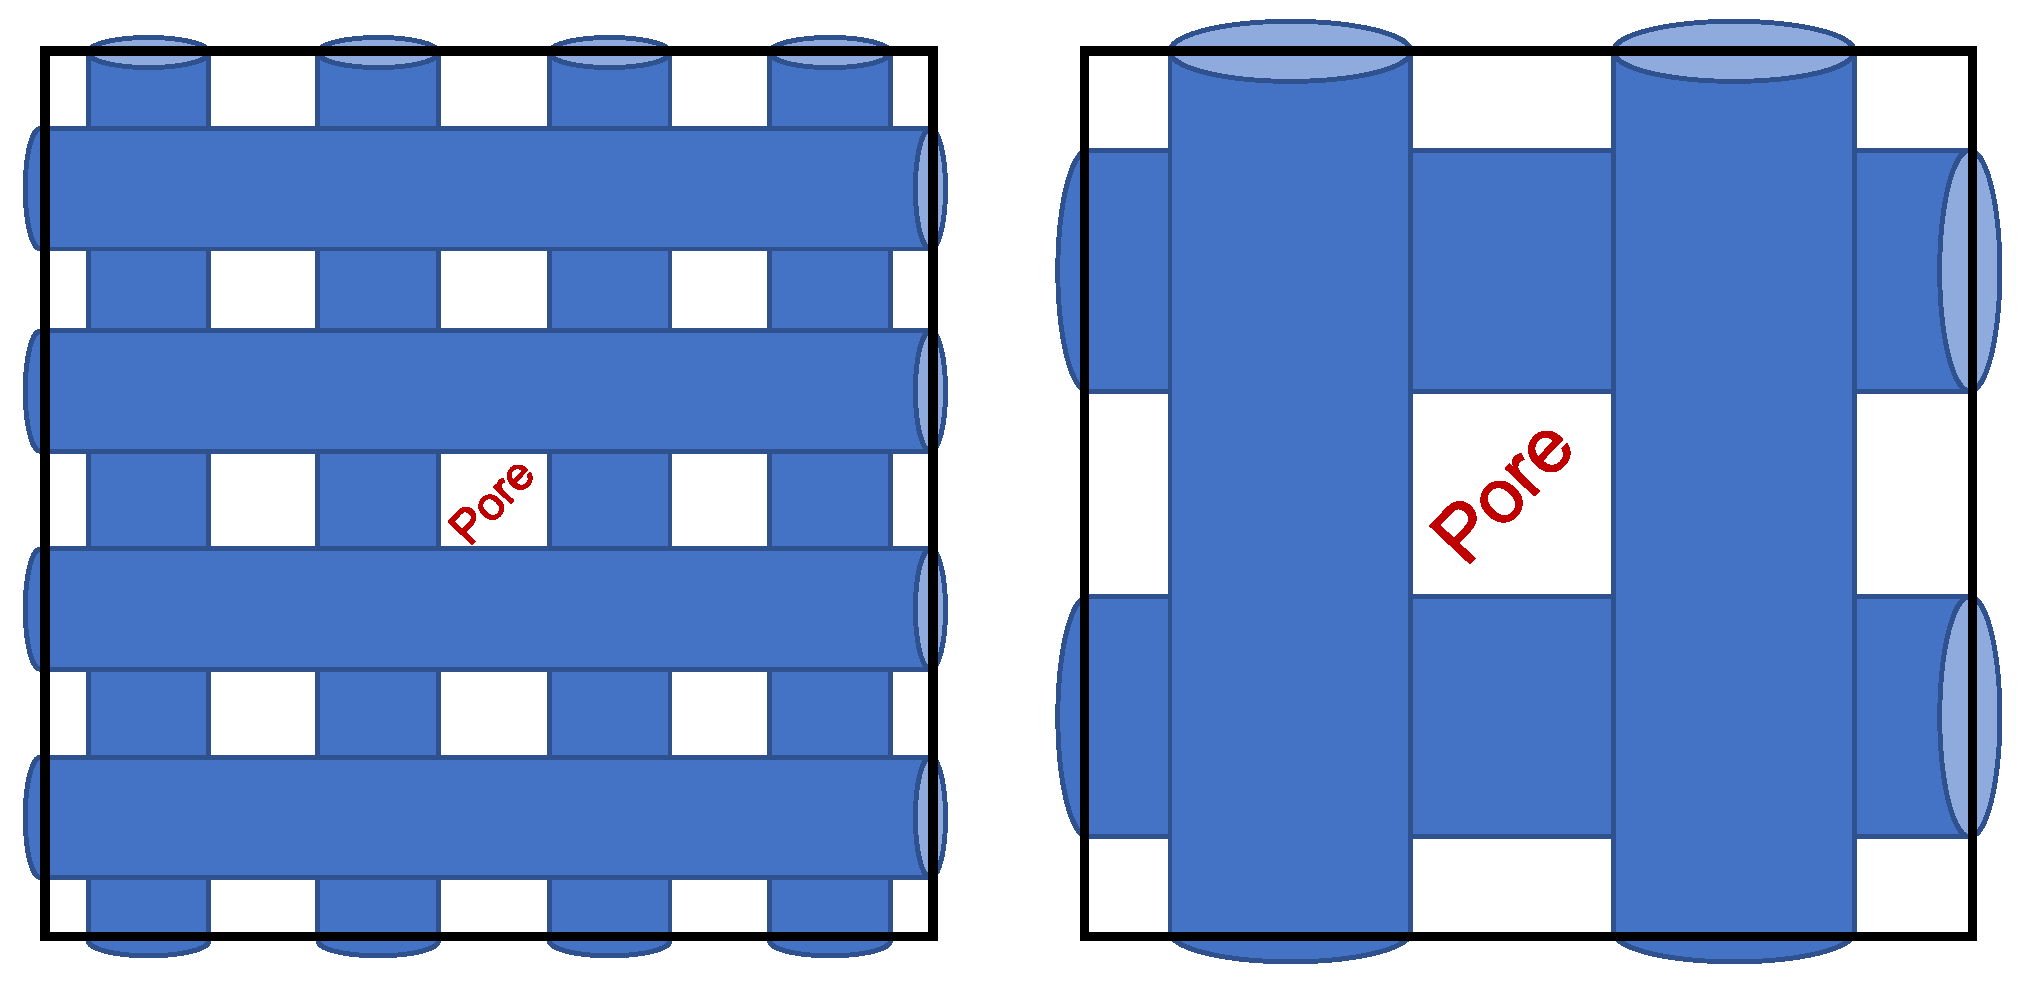
Table 2 the values of porosity obtained for the different materials under study are gathered. Although all the values are very close to each other it can be observed that there is a trend for which the porosity increases as the rotational speed of the collector increases. This result is again in accordance with the idea that the faster the rotation speed the more difficult the fiber attachment to the collector. Finally, if porosity is considered together with the general trend observed for the size of the fibers, it can be concluded that, at least from 500 rpm, the size of pores increases as the higher the rotational speed is. The
Figure 6 shows models which, visually demonstrate for the same amount of material constituted by fibers, how the thicker the fibers are the larger the pores if they are considered to be randomly distributed. These models consider 2D materials constituted by 2D fibers represented by rectangles.
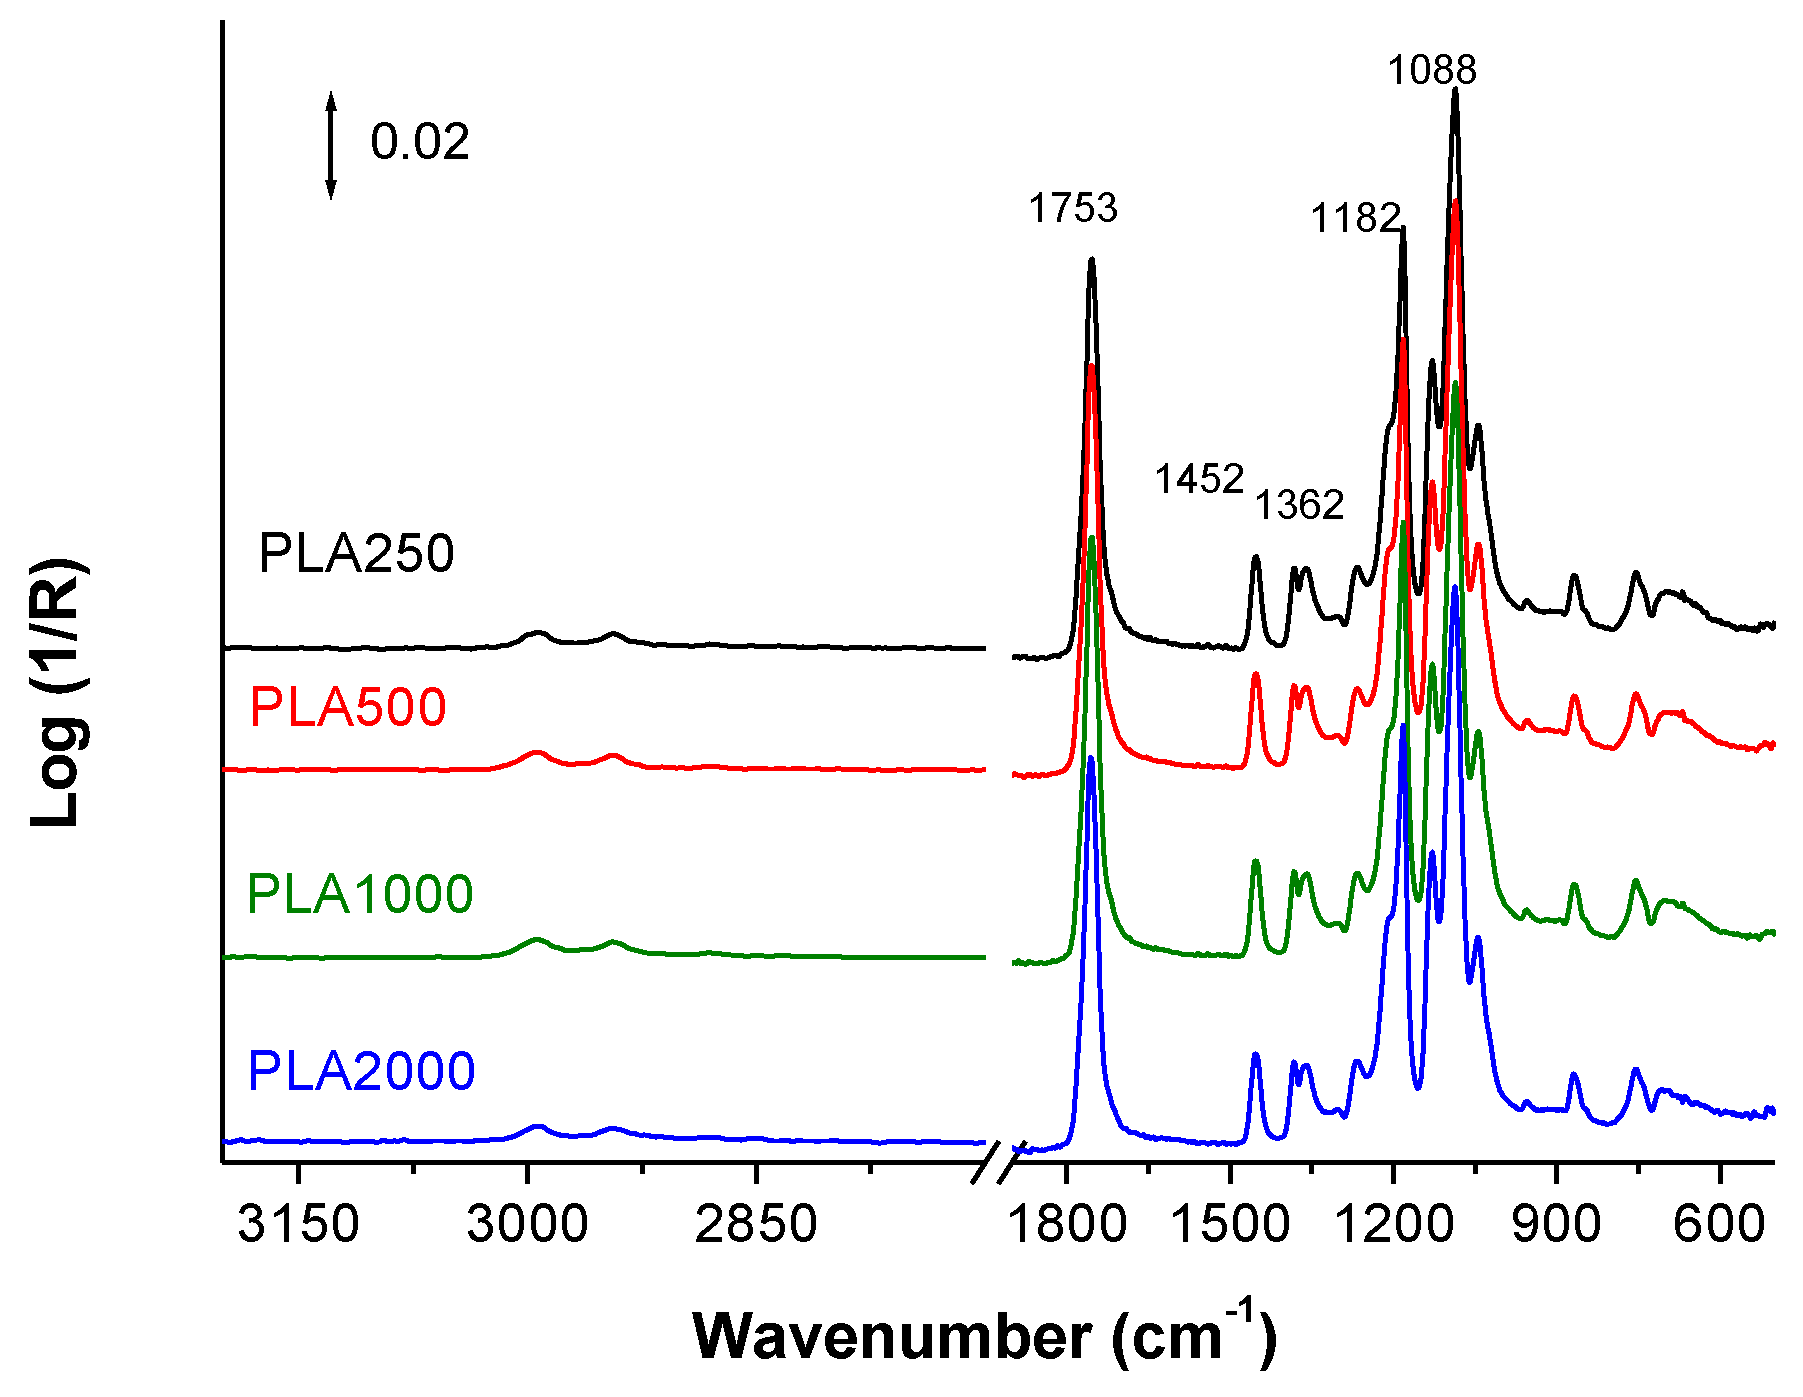
Regarding the structure, FTIR spectra of the prepared materials are shown in
Figure 7. Typical bands of PLA appear always in the same position: the absorption of carbonyl groups, C=O, at 1753 cm
−1, the absorption corresponding to bending of methyl groups –CH
3 (antisymmetric at 1452 cm
−1 and symmetric at 1361 cm
−1) the absorption corresponding to the stretching vibrations of C–O groups at 1188 cm
−1 (symmetric) and at 1088 cm
−1 (antisymmetric) [
30]. As can be seen, there is not any variation in the position of the absorption bands or in the relative contribution of them respect to the whole spectra of PLA. Therefore, the chemical characteristics of the surfaces should be the same and consequently performance in terms of, for example, wettability or adhesion of bacteria is not expected to change due differences of specific interactions but as a consequence of other causes such as for example, changes in the morphology.
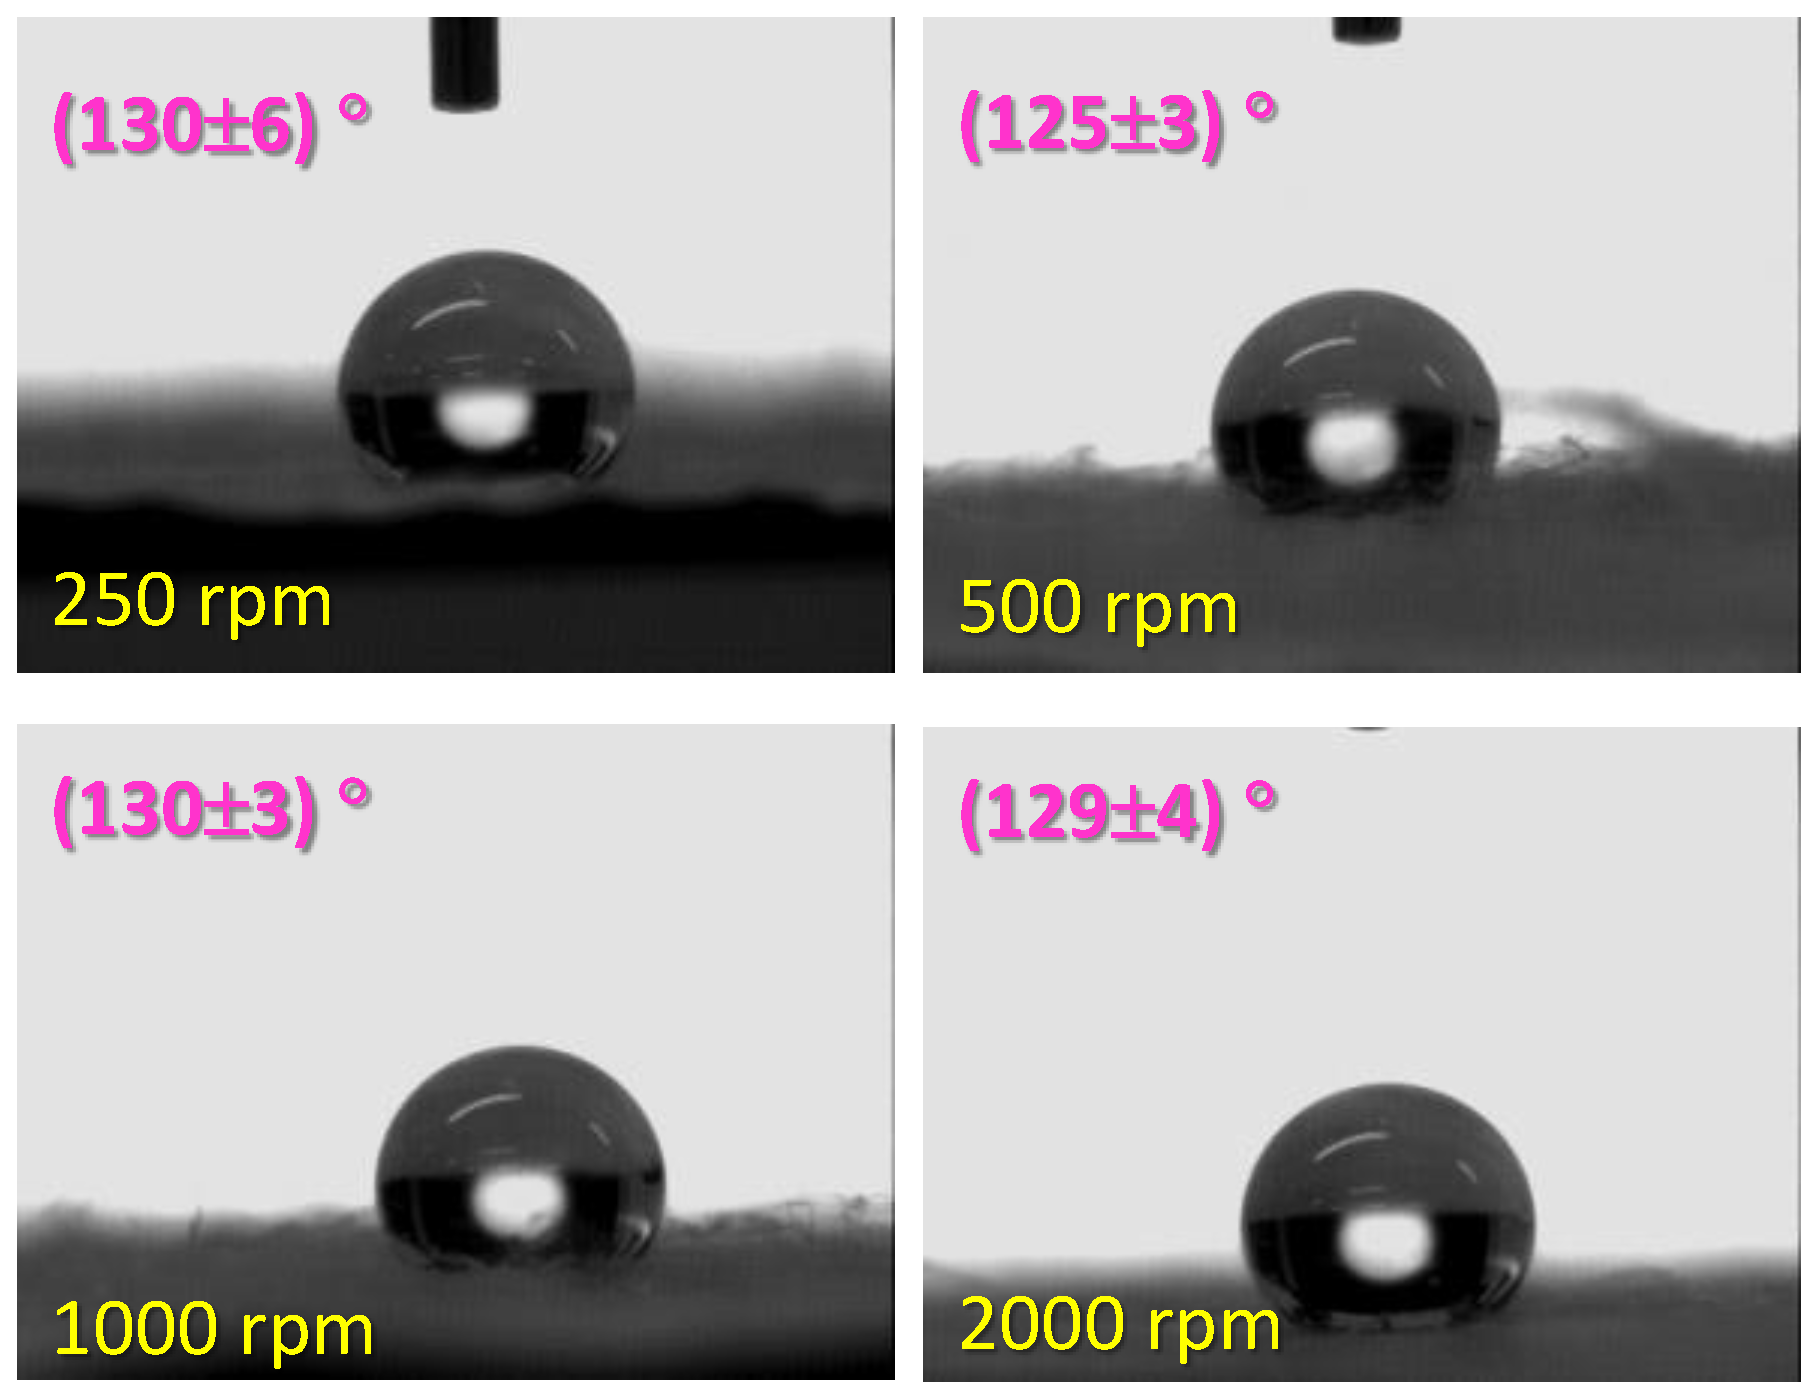
In order to study the wettability, water contact angles were measured. As can be seen in the
Figure 8, all materials presented the similar water contact angle within the range of 125–130°. These results point out that when PLA is prepared in the form of nonwoven mats it behaves quite more hydrophobic than when PLA is prepared in the form of flat solid films with water contact angles lower than 80° [
31,
32,
33]. This result can be explained considering that the higher the PLA surface available, the lower the water contact angle. On the other hand, if the error is not considered, it might be said that the sample collected at 500 rpm yielded the lowest contact angle that only can be correlated with the size of fibers and correspondingly with the size of pores. It seems therefore that, in the particular case of PLA, thinner fibers lead to lower water contact which can also be explained by considering that more of surface is available for the water to wet the material [
34]. Considering the two well-known models used to describe the wettability behavior of solid surfaces, Wenzel [
35], and Cassie-Baxter [
36], and the explanation given by J.E. Domínguez et al. [
34] it can be concluded that wettability behavior of the PLA system under consideration is better explained by the Cassie-Baxter approximation [
37], which states that the relation between the real contact angle formed on the rough surface,
θCB, and the contact angle formed on the smooth surface,
θ, is given by
where
φS is the fraction of solid surface in direct contact with the liquid (surface available to water) which increases with the lowering of the contact angle, in accordance with our results.
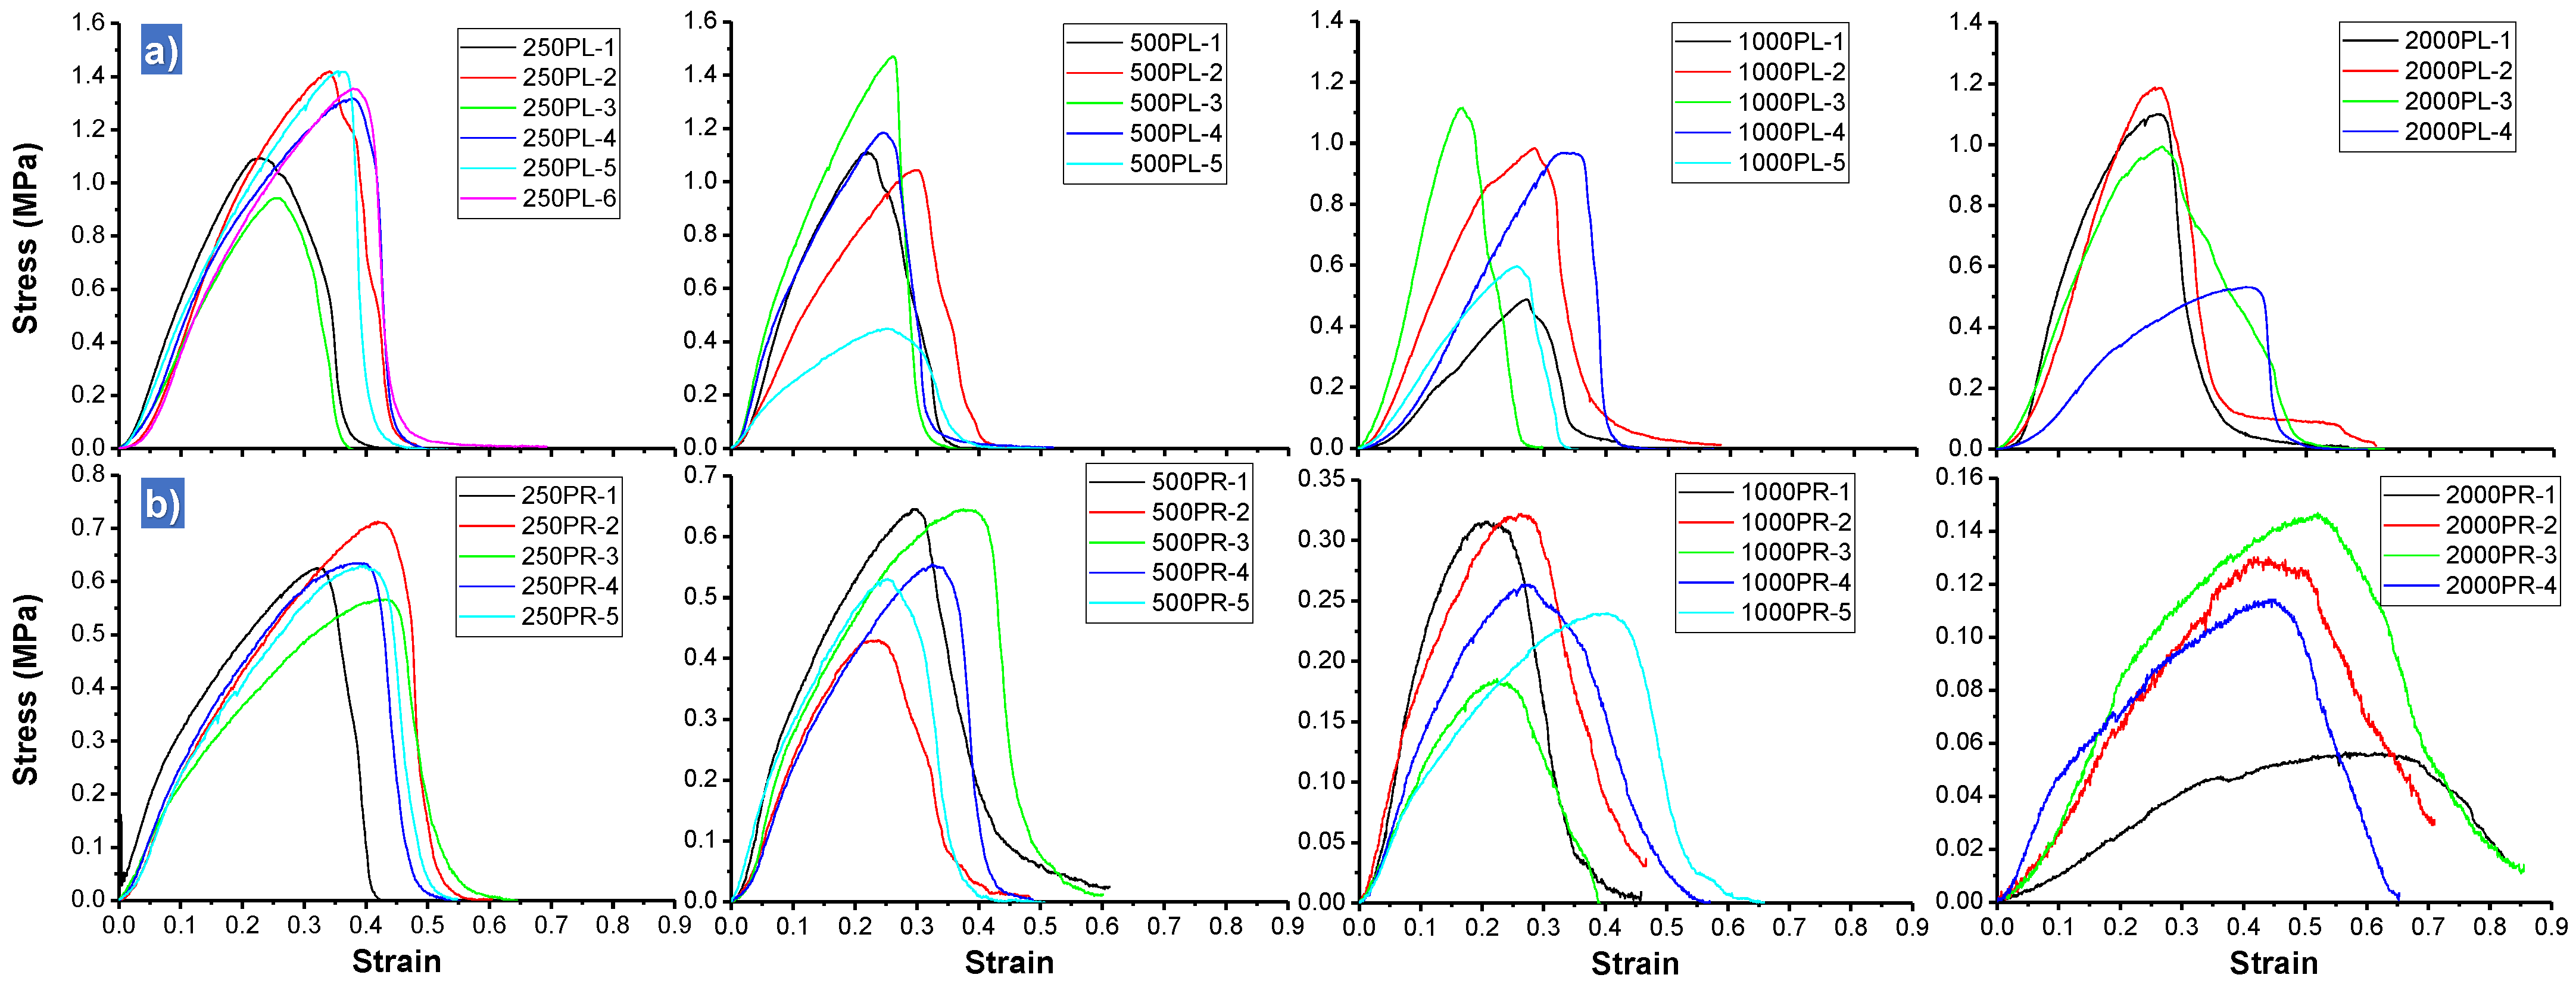
The mechanical behavior of the prepared materials was studied by tensile tests.
Figure 9a (parallel specimens, ‖) and
Figure 9b (perpendicular specimens, ⊥) show the stress-strain curves for all the specimens tested. In general, all the plots’ profiles are similar, where a sharp increase of strength can be found at low strains, then, maximum strength is smoothly reached and finally, during the failure of the material, a decrease in stress is observed without being abrupt but rather gradual. This later result seems to be similar to those found for fibrous materials and fiber reinforced composites [
38,
39]. This behavior can be explained considering that failure does not only occur as a consequence of bulk material failure but also by mechanical disentanglement process. This step of fibers disentanglement can occur sequentially if there is not a homogeneous transfer of mechanical loads as would be expected for this type of systems in which to a greater or lesser extent the fibers are entangled with each other.
From here, two variables are considered for the analysis of results; the first one is the rotational speed of the collector and, the second one, the direction for the specimen preparation for mechanical tests, parallel or perpendicular, respectively. Let us start with specimens whose long axis is coincident with the direction of the rotation of the collector (parallel, ‖). To carry out the analysis different mechanical parameters were chosen, maximum strength, σmax, Young’s modulus, E, resilience, Uy, toughness in terms of total energy absorbed along the tensile test, U, and width at half height, W.
In the
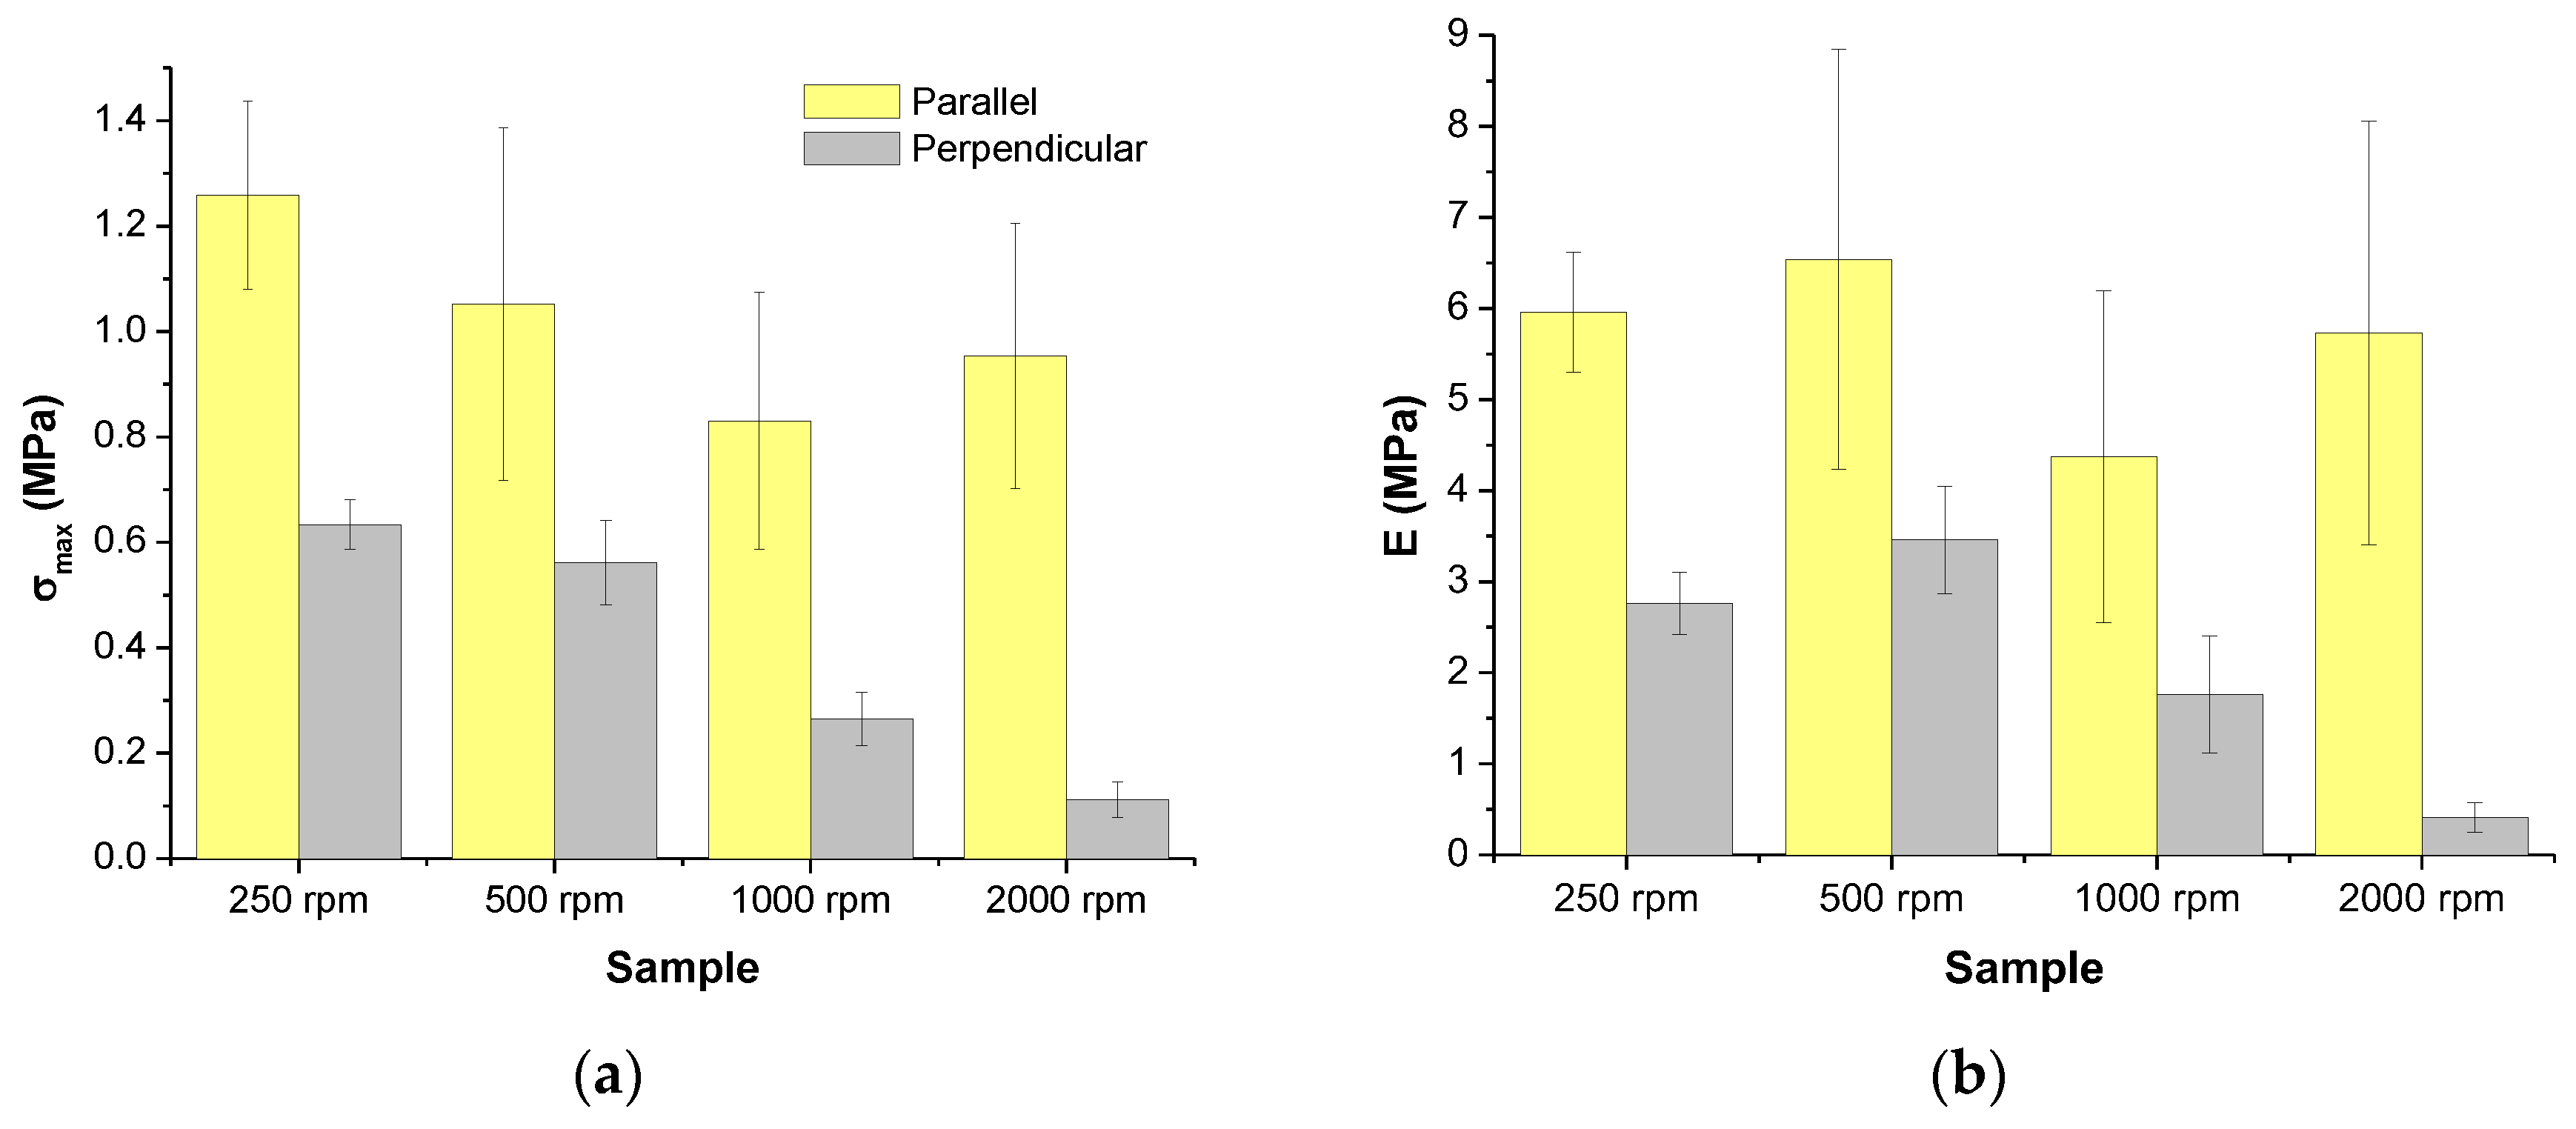
Figure 10, the tensile strength or maximum strength is represented as a function of rotational speed for both kinds of specimens, parallel and perpendicular. As can be seen, lower tensile strengths than 1.5 MPa were obtained which is quite lower than the one obtained for PLA, 50–60 MPa [
40,
41]. This result can be easily explained considering that the section used to calculate the stress is one arising from the dimensions of the specimens, therefore, the section was over-estimated since the materials prepared in this work are highly porous.
When comparing the type of specimen during mechanical tests, it is observed that for the specimens that have their long axis parallel to the direction of the collector rotation, the mechanical strength is higher. This result can be explained considering that the long axis of the fibers is preferentially oriented to the long axis of the specimens which should imply better transmission of mechanical loads since more points of interactions between the fibers are possible. On the other hand, for both kinds of specimens it is observed a general trend, the higher the rotational speed the lower the strength. Considering that structural changes were not observed (
Figure 7), only morphological variations must be the cause of this general behavior. In the present work, three morphological parameters were considered, size of the fibers, preferential orientation of fibers and porosity. As can be seen, when relating results shown in
Figure 10 with data gathered in
Table 2, only the porosity could be correlated with mechanical strength. When porosity increases, the mechanical strength decreases as expected. Considering that when the porosity increases, the real section that supports the loads is smaller; in other words, the section used to calculate the stress was overestimated.
From the elastic behavior of the specimens, the Young’s modulus is extracted and the mean values are represented in the
Figure 10. Again, it seems that due to the porosity lower modulus for PLA was obtained [
40,
41]. On the other hand, as in the case of the tensile strength, rigidity represented by the Young’s modulus is higher for the specimens with their long axis parallel to the direction of the rotation of the collector which can also be explained by the consideration of a better transmission of loads along longer fibers. However, when considering the rotational speed of the collector as the variable we cannot see any clear trend. These results can be explained considering there is not any relationship between morphology (size of the fibers, porosity, and preferential orientation of fibers) variations observed and the elastic modulus.
However, there exists the possibility that changes in modulus are not clearly observed because of the small variations in the parameters describing the morphology. In the case of the specimens cut in perpendicular direction to the rotation of the collector a slight trend can be observed (
Figure 10). It seems that the higher the preferential orientation, the lower the Young’s modulus.
For the specimens perpendicular it is expected to have shorter fibers (see the scheme represented in
Figure 11 where models with only one representative fiber are shown as a straight line with a certain length. Even though the specimens are made up of many equally-sized fibers, small changes in the orientation of these fibers will have a bigger impact on load transmission. This is because variations in the average lengths of the fibers will be greater for these small changes in orientation. This reason can be demonstrated by trigonometry defining the length decrease of fibers,
Lf −
Li. Here,
Li represents the initial length of the fiber in the specimen and
Lf represents the final length after changing the preferential angle of orientation. Considering that all specimens have the same dimensions (
Figure 11) the initial length of the fibers can be expressed by:
where
b is the side opposite and
θi is the initial angle associated to the fibers’ orientation (
Figure 11), therefore, the change in length would be:
Taking into account that the side opposite in the parallel specimen (b‖) is longer than the side opposite in the perpendicular specimen (b⊥), it can be said that the reduction in fiber length is less pronounced as they become more oriented in relation with the direction of collector rotation in the case of perpendicularly cut specimens. Consequently, a higher impact of orientation on modulus changes is expected for the perpendicular specimens. In perpendicular specimens, preferred orientation of fibers doesn’t favor the transmission of load. When fibers are more oriented in this direction lower modulus are expected, considering that the decrease in length is minimal. However, in the case of parallel specimens, the decrease of length might be significant enough to balance the positive contribution of the orientation respect to the transmission of loads.
Another interesting mechanical property is the resiliency represented by the parameter modulus of resiliency,
Uy, the energy absorbed by the material up to yield.
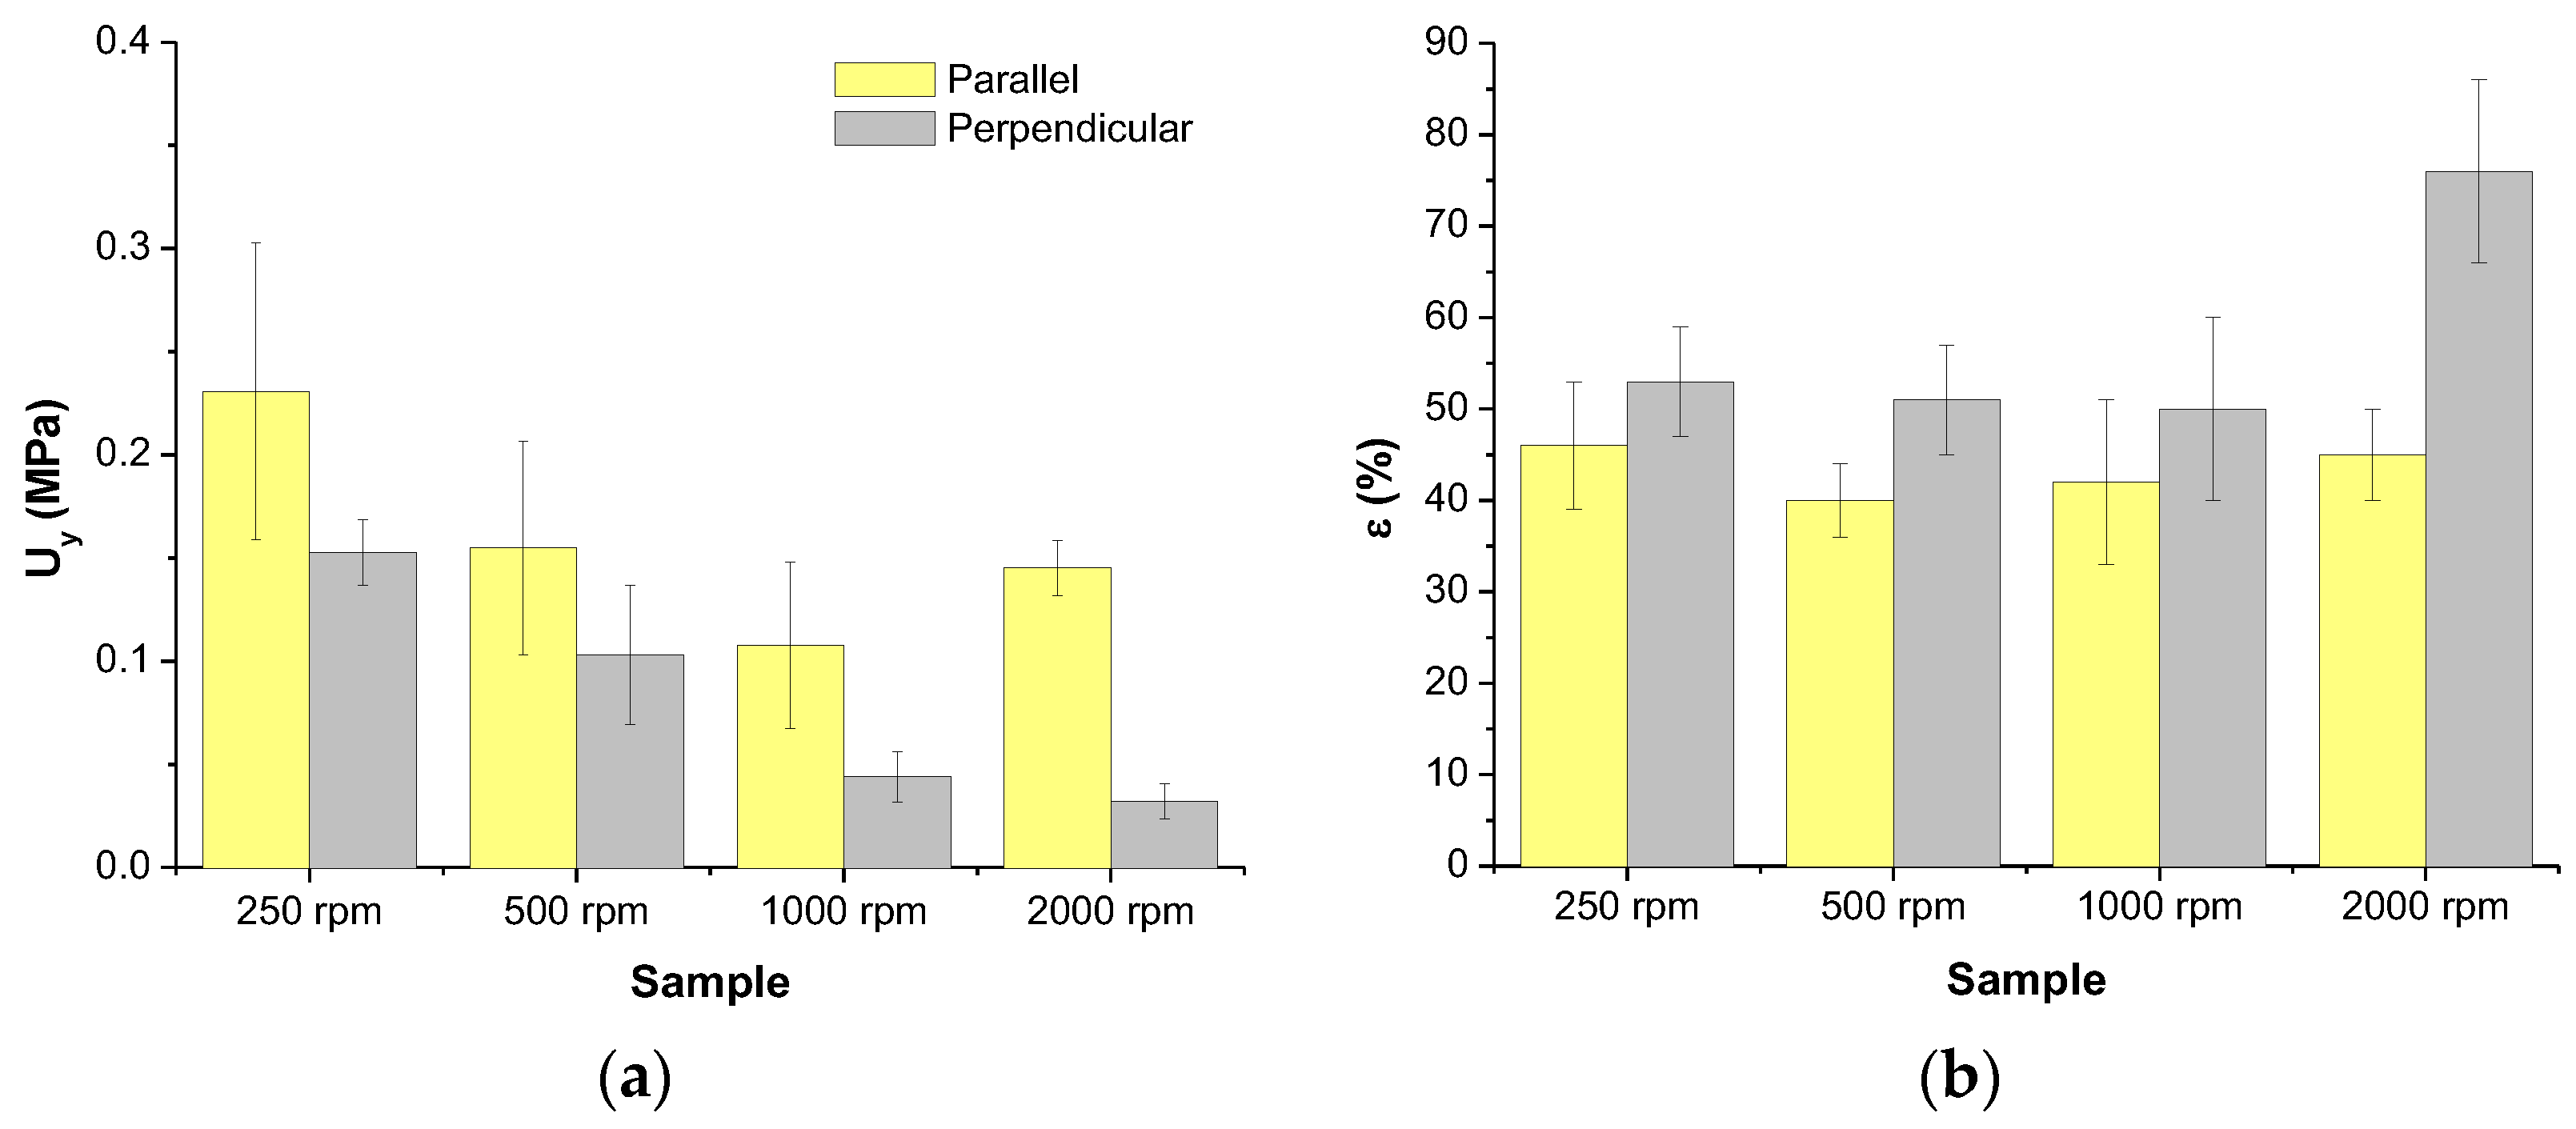
Figure 12 shows the values of
Uy of the materials under study. It is observed that the materials are elastically tougher when the tensile load is applied parallel to the direction of rotation of the collector. Besides, regardless of the orientation of the specimens, the higher the rotation speed of the collector the lower the resiliency. These results can be explained through the same reason used to explain the tensile strength; in fact, resiliency is mainly correlated with that parameter rather than the Young’s modulus.
Regarding the elongation at break,
ε, it can be observed in the
Figure 12 that, in general, it is larger when the load is applied perpendicularly to the direction of the collector rotation. This result can be explained considering that strain of the specimens should imply generation of more entanglements when fibers tend to be aligned with the direction of application of load. We could explain the mechanism of strain as constituted by two steps: (1) orientation of fibers and (2) slippering of fibers. Therefore, when perpendicular specimens are considered both steps should have an important contribution to the strain. However, when the load is applied in the same direction as that of the rotation of the collector, if the fibers are also mainly oriented to that direction, only the contribution of the second step (slippering of fibers) should be the predominant one, and less strain is expected. On the other hand, it can also be observed that the faster the rotation of the collector the higher the elongation at break, which might be related to the preferred orientation of fibers.
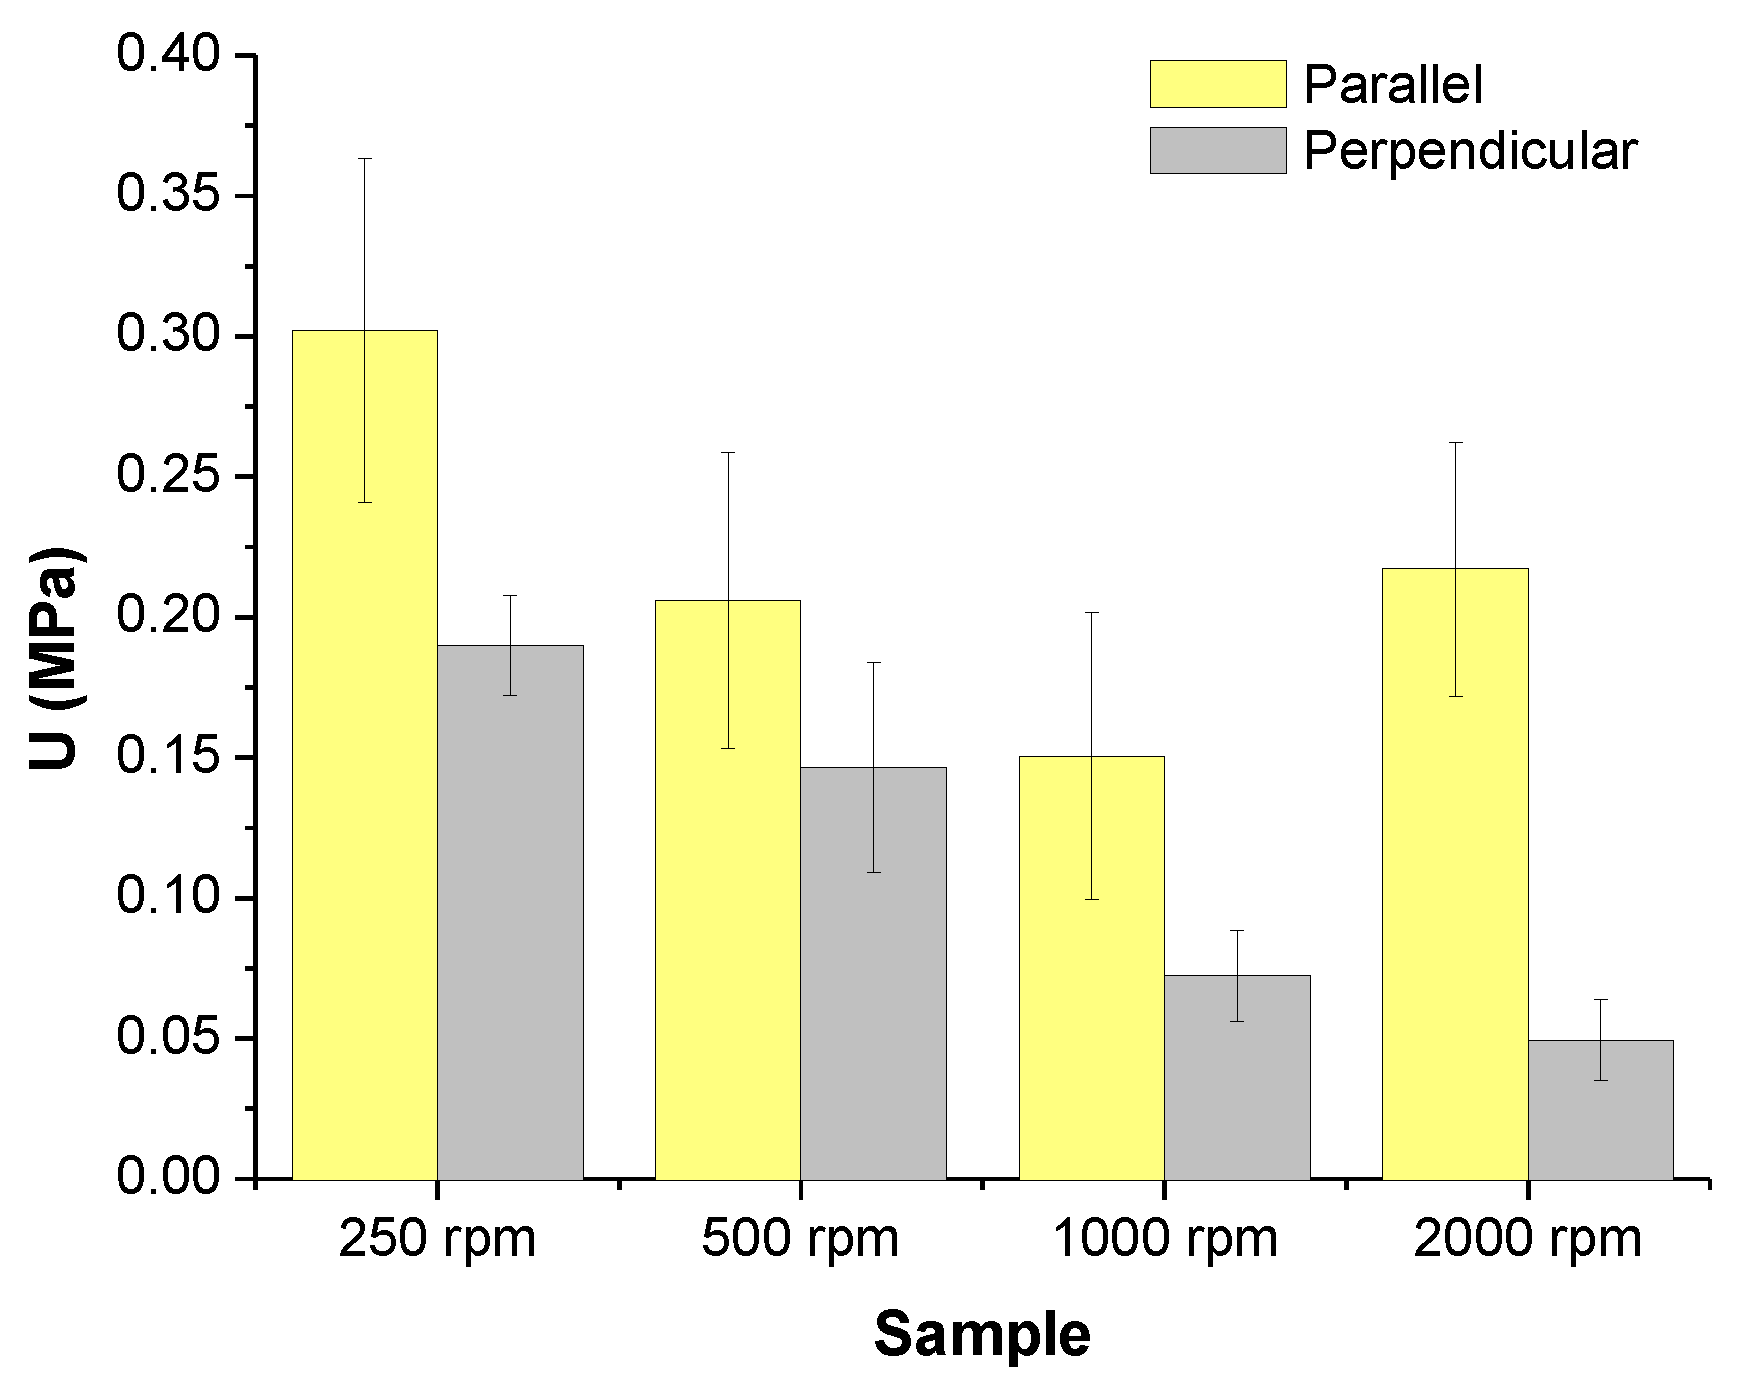
When considering the total energy,
U, absorbed by the materials along the whole tensile test (
Figure 13, toughness) the same trends as those obtained for the resiliency were obtained (
Figure 12). Although elongation at break should favor the toughness, for the materials under consideration the tensile strength is the important factor accounting for the toughness. Therefore, the same reasons given to explain the tensile strength can be used to justify the results obtained for the energy absorbed at break during the tensile test.
Finally, a study of the influence of the morphology on the adhesion and development of bacteria was carried out. A strain DH5-α of
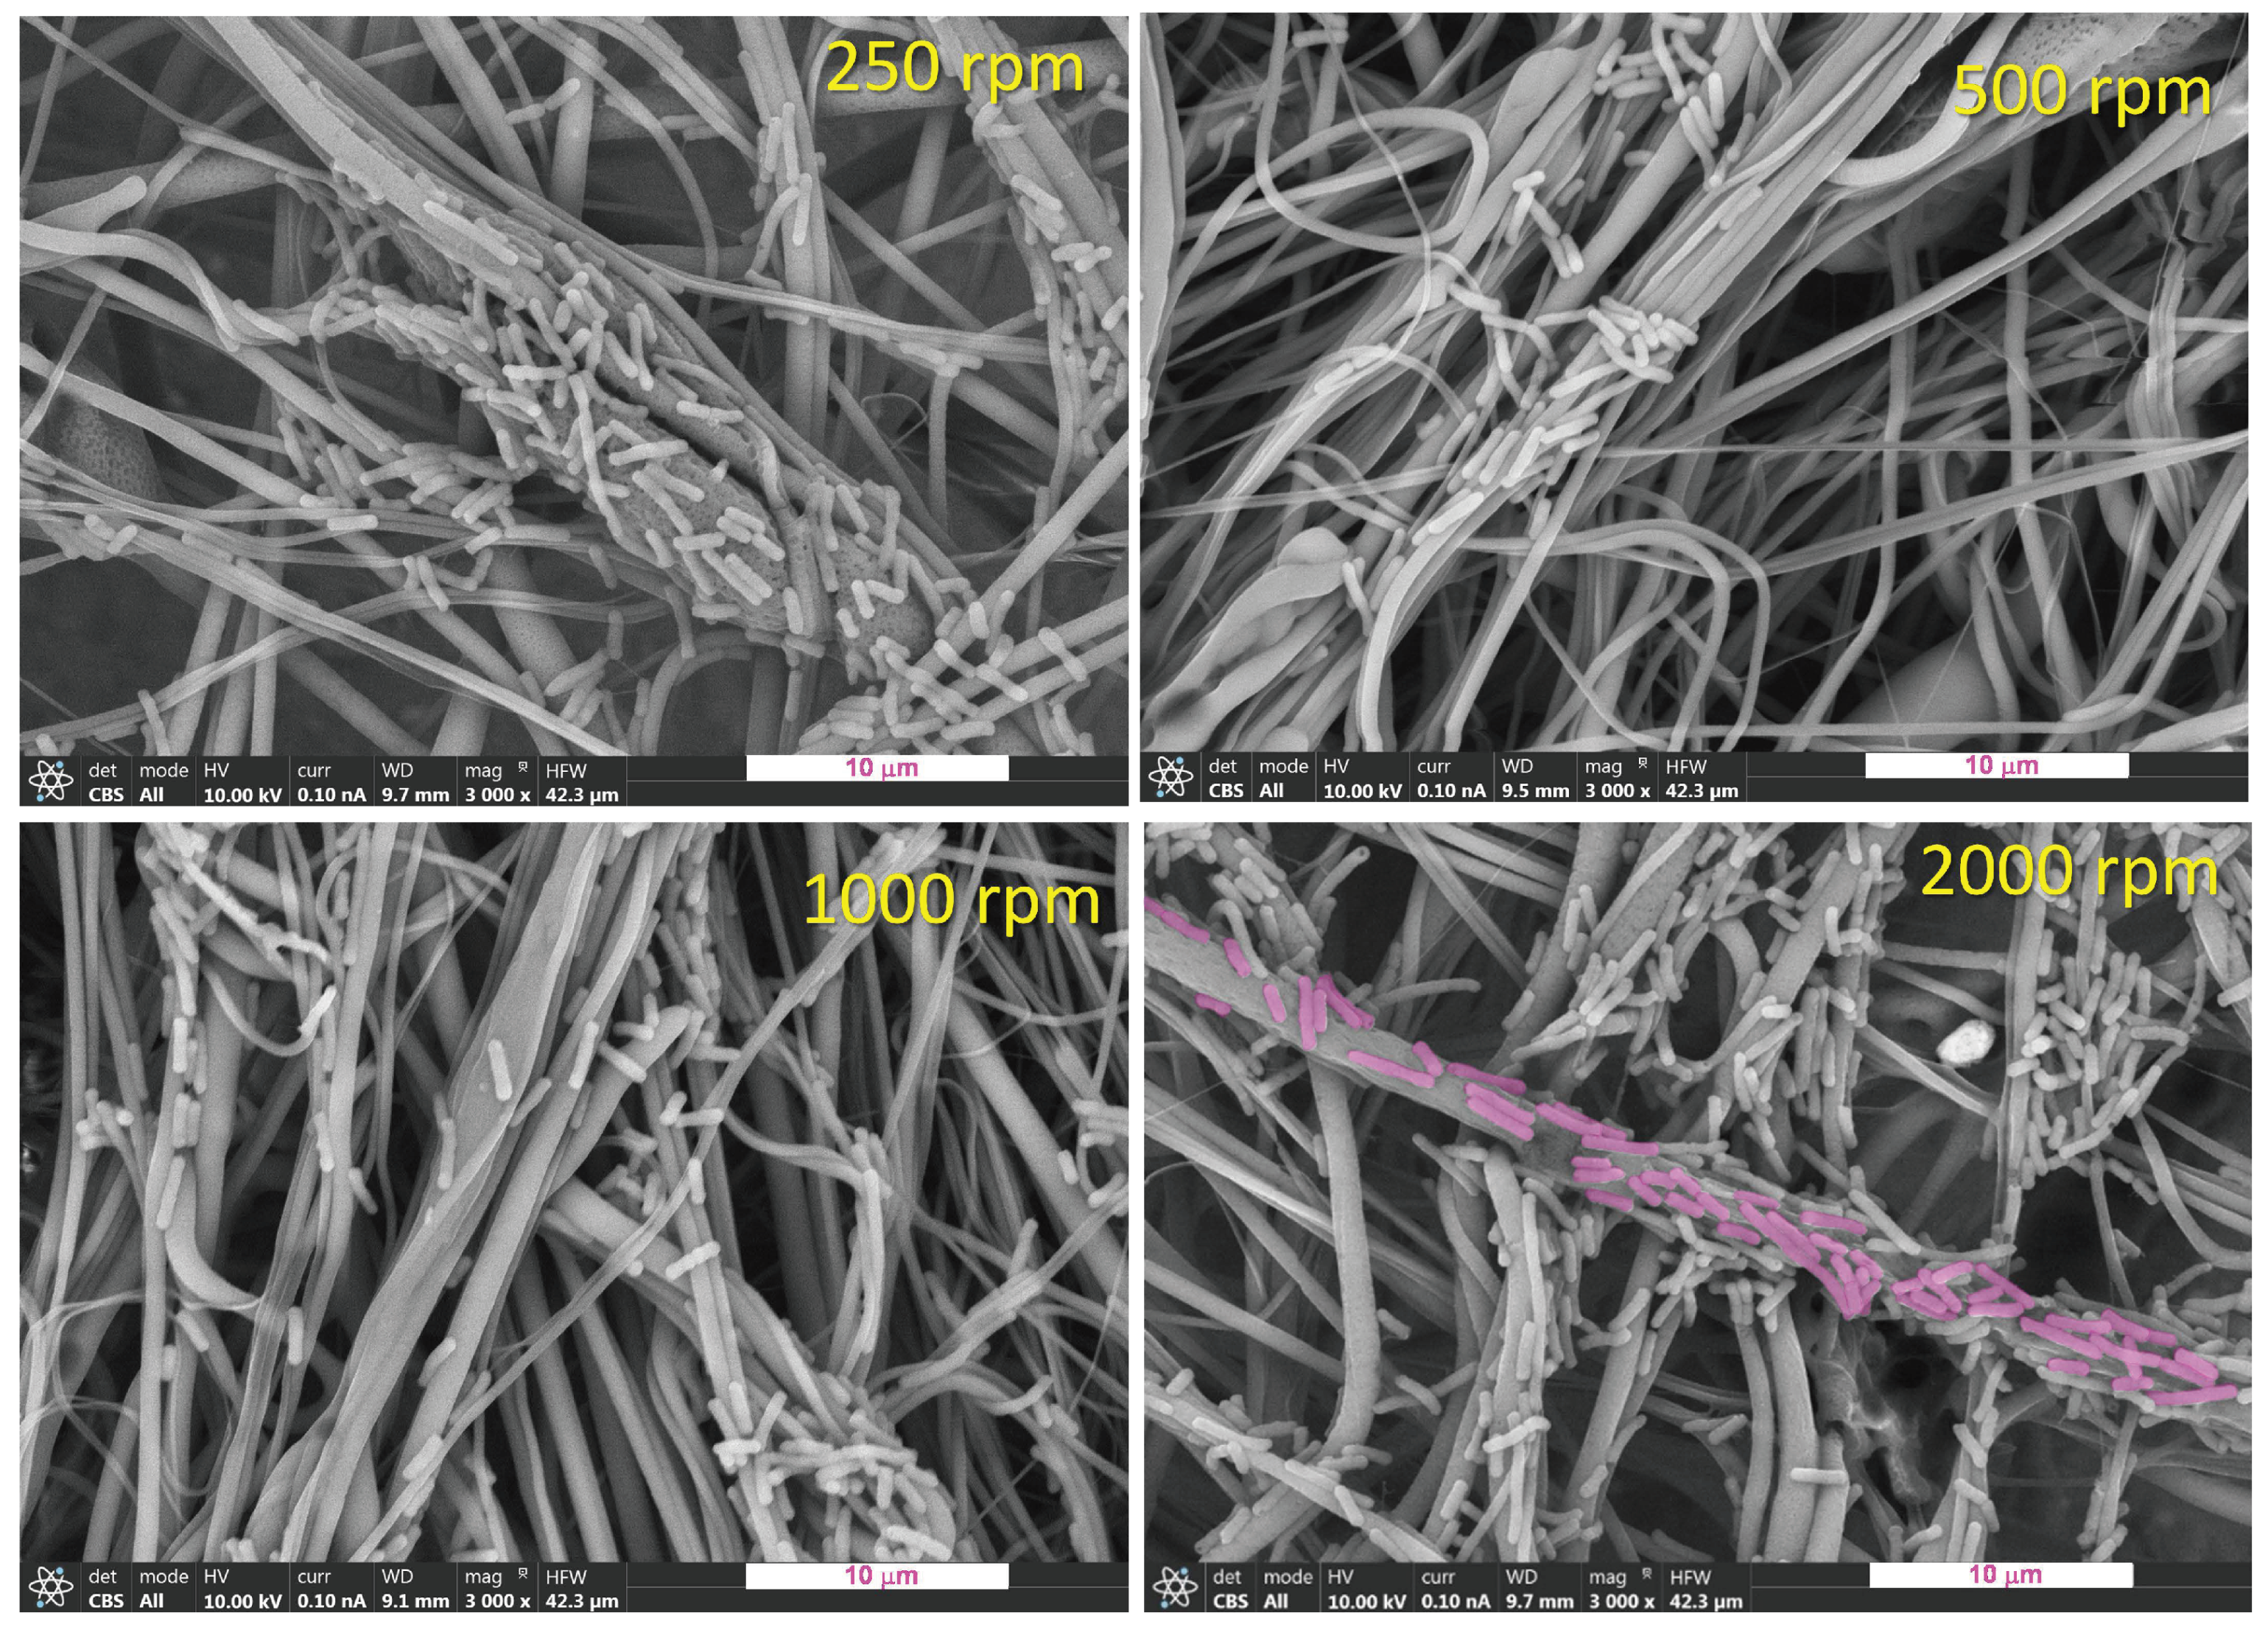
E. coli was cultured on the materials and after fixing them an inspection by SEM was carried out. As can be seen in the
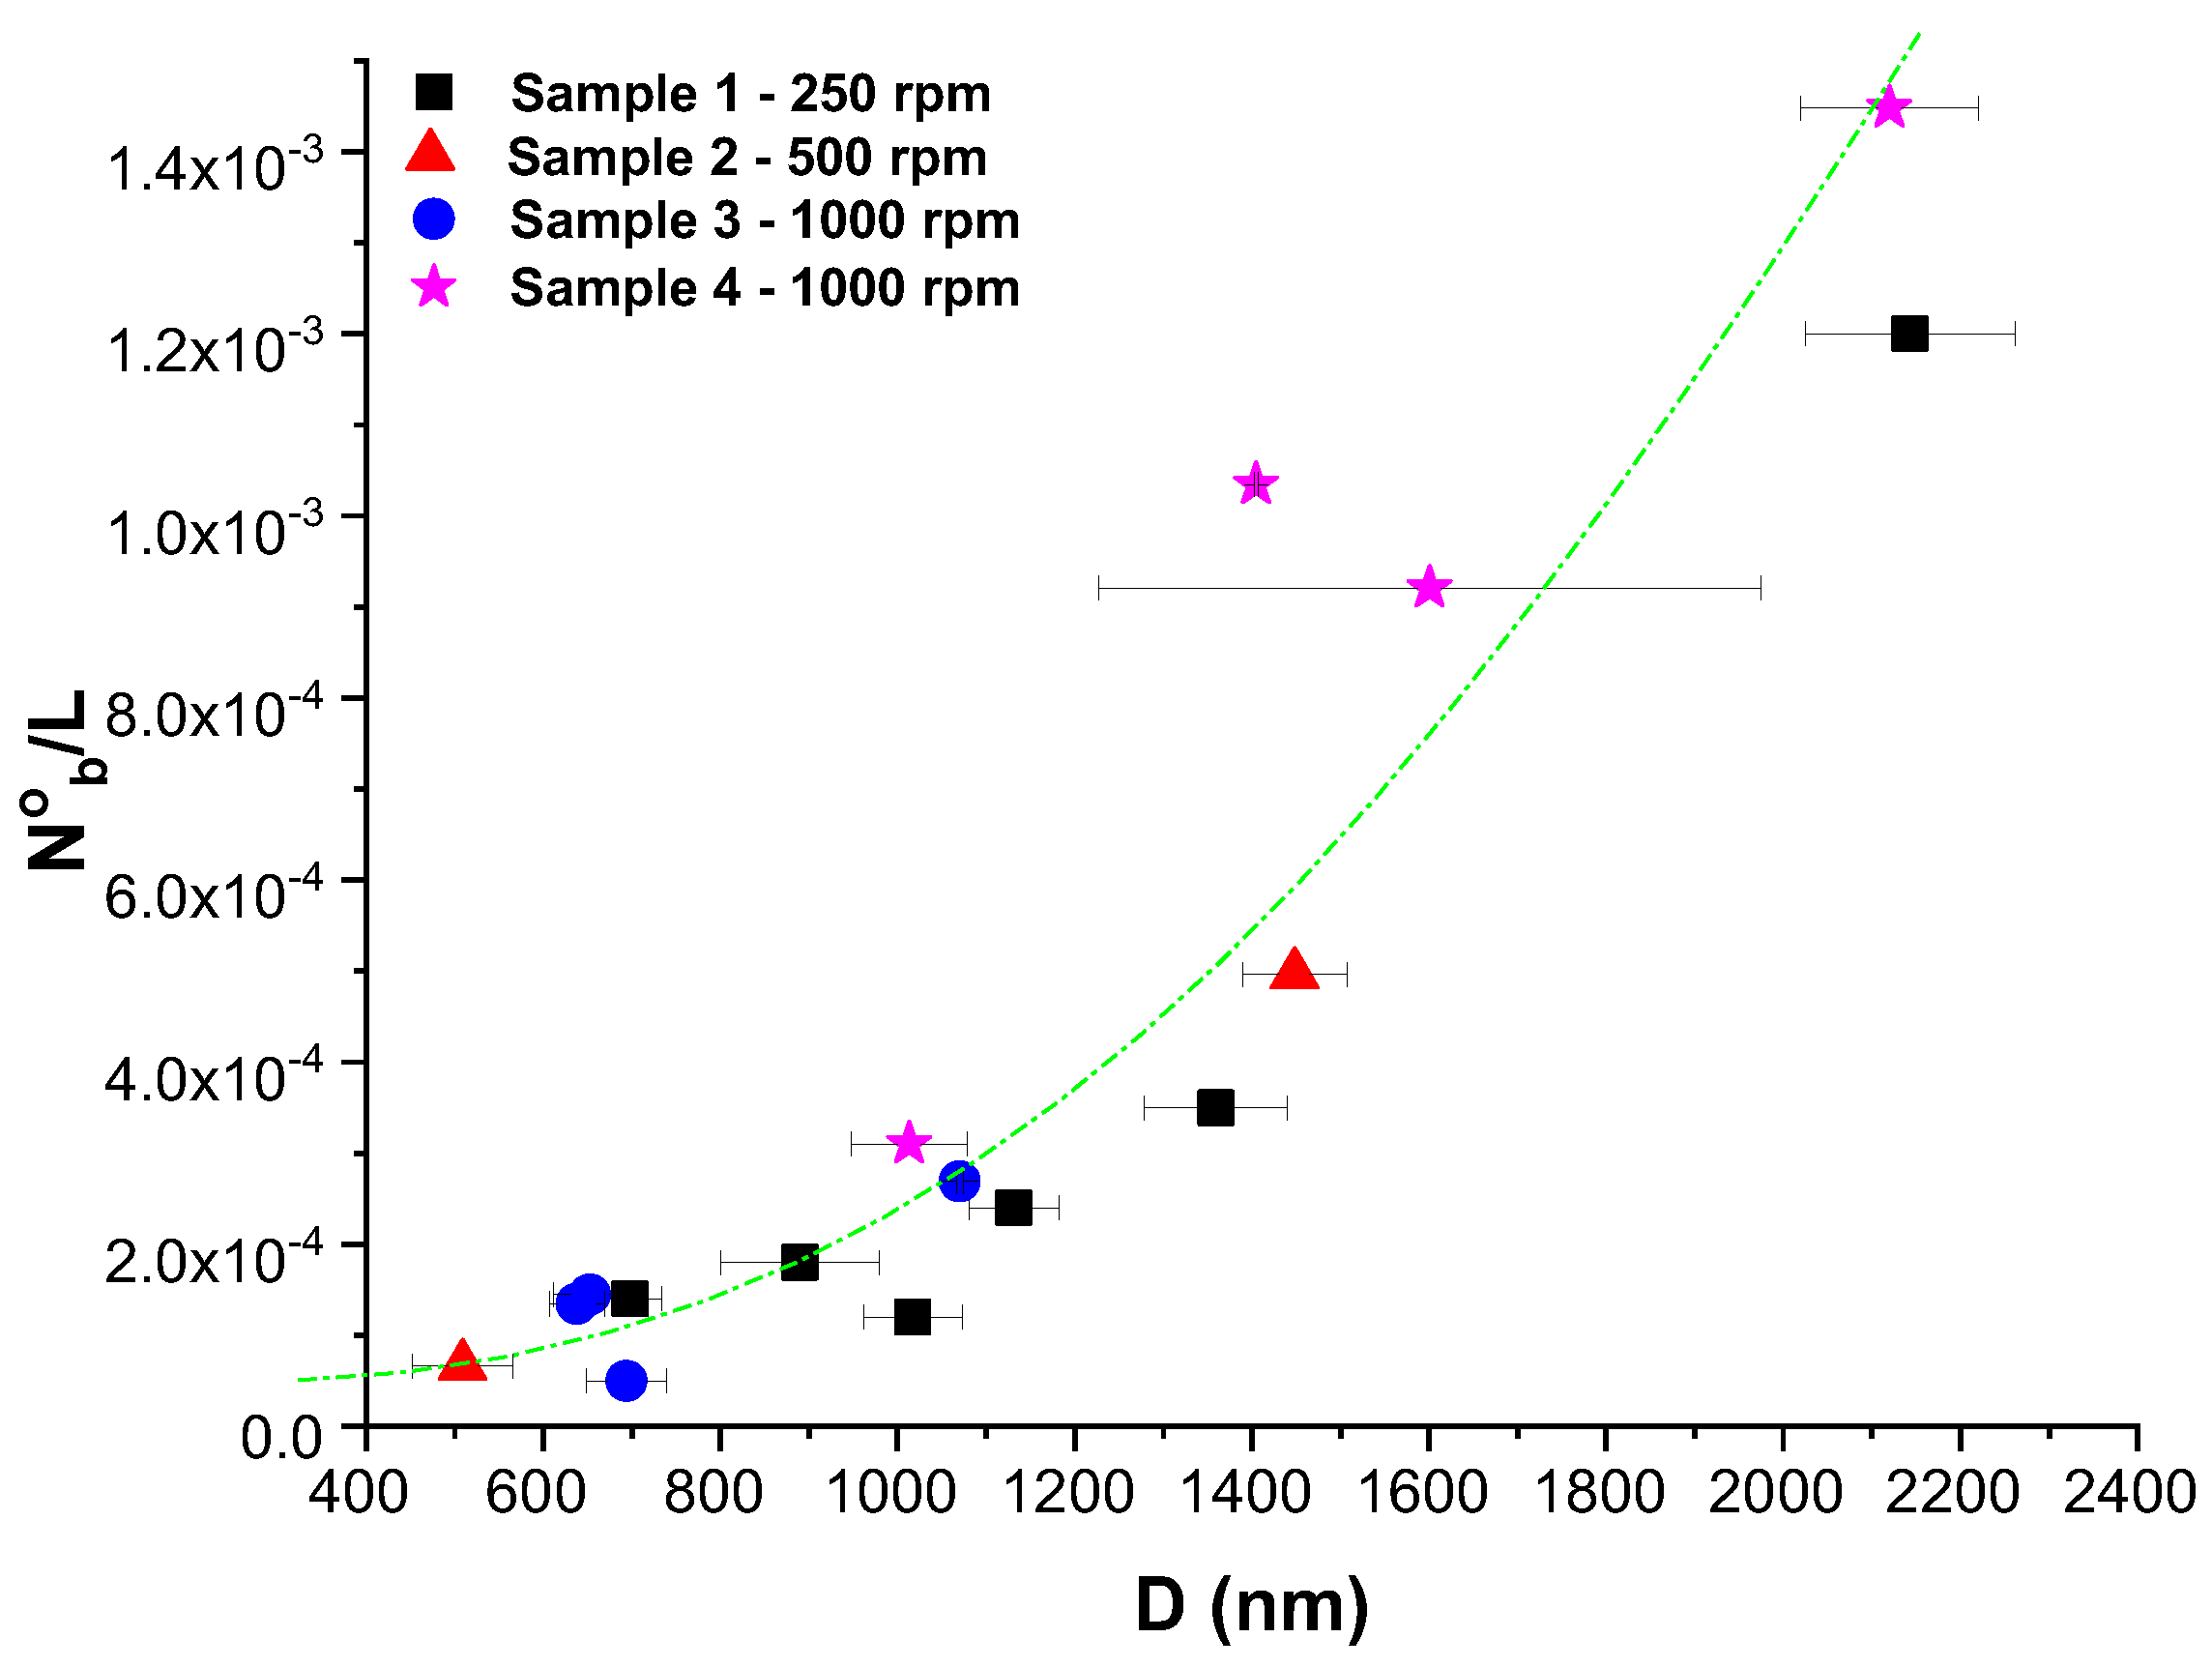
Figure 14, bacteria are directly attached to the fibers and, when a fiber is thick enough bacteria seems to follow the same orientation as the fiber. Besides, it seems that the thicker the fiber the more bacteria are attached. To see this better, bacteria were counted per unit of surface area and represented as a function of the average diameter of the fibers in particular sample (
Figure 15). As can be seen, there is a clear trend that confirms that the higher the diameter the higher the number of bacteria attached to the material. Therefore, one important conclusion is that in order to avoid bacteria proliferation, one factor is to control the size of the fibers trying them to be as thinner as possible.
On the other hand, as can be seen in
Figure 14, the size of pores or the empty space in between fibers is large enough as the tiny bacteria
E. coli can escape through them. Therefore, if the fibers do not offer surface enough as the bacteria to be properly attached there won’t be bacteria adhesion. Another different thing would be the possibility of other kind of cells to be adhered, which would depend on their sizes and their possibility to be attached to the material if they can lie on several fibers.
Another important issue to consider is the possibility of orienting cells preferentially by the preferred orientation of the microfeatures associated to a particular morphology. In this work, DH5-α
E. coli bacteria were chosen as model cells for this purpose. In the
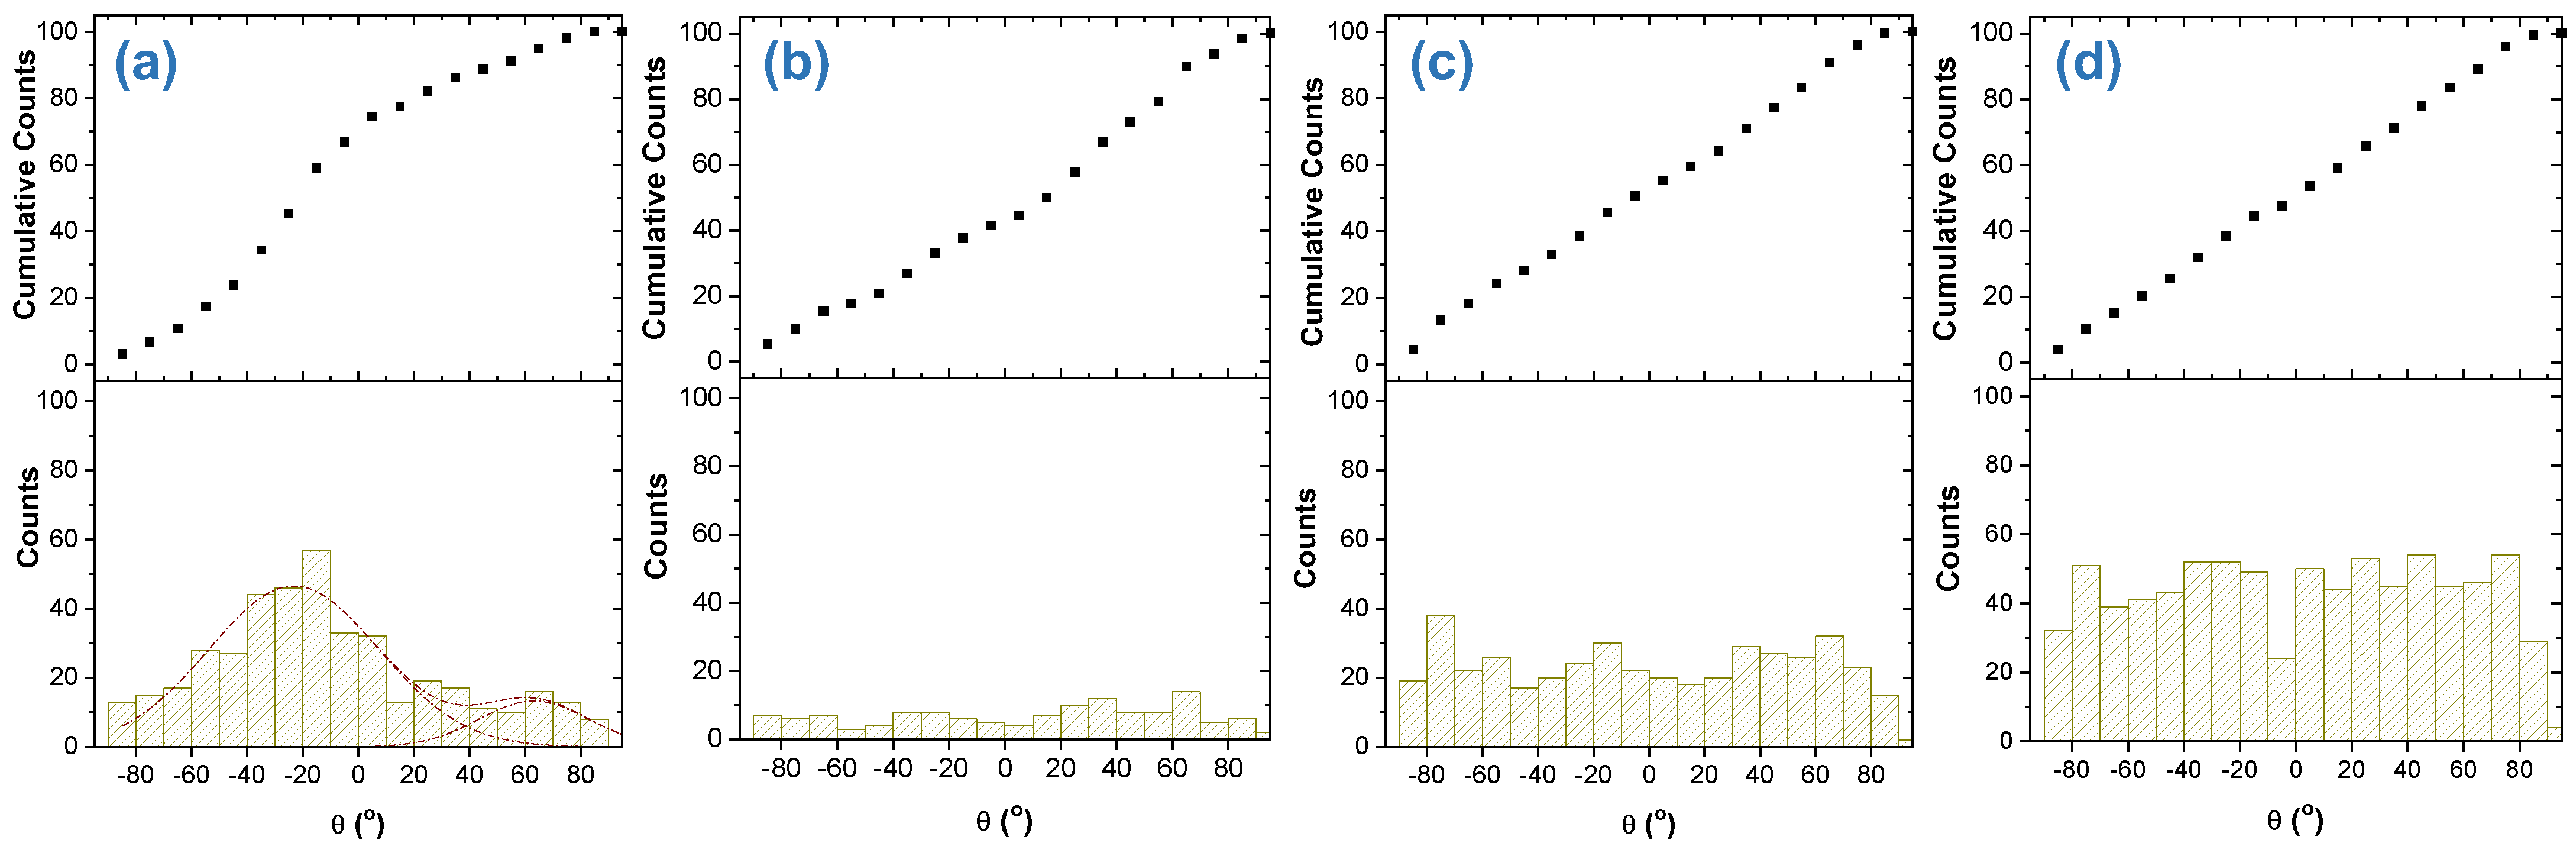
Figure 16 it can be clearly seen a preferential orientation of bacteria when they are attached to fibers that are thick enough. Therefore, in order to achieve a preferential orientation of cells, there must be first a preferred orientation of fibers and second, they must be thick enough. To see if there is any correlation between the preferential orientation of fibers in a sample with the orientation of bacteria in the
Figure 16 it is shown the distribution of orientations for the bacteria. As can be seen, there is only preferential orientation of bacteria for the material collected at 250 rpm. The reason for that is because analysis of bacteria adhered only could be done on a few fibers thick enough. For the rest of the materials, it could not be observed any preferred orientation of bacteria when only one fiber is considered and when it is thick enough.
