Abstract
The application of binary gas mixtures consisting of heptafluorobutyronitrile (C4F7N) and carbon dioxide (CO2) in AC GIS is currently attracting much attention. Therefore, the evaluation of the gas–solid interface charge distribution characteristics of epoxy resin is indispensable. Additionally, the phase-dependency of the charging behavior remains not fully understood. We simulated coaxial electrode structure in GIS and investigated the surface charge distribution on a down-scaled epoxy insulator. The influence of the truncated phase angle and duration of AC voltage on charge behavior were analyzed, and the charge transport mechanism under AC voltage was theoretically analyzed. The results showed that there was a noticeable negative charge speckle with the presence of the metal particle and the accumulated negative charge on the insulator surface far exceeded that of the positive charge. The maximum surface charge density and the amount of surface charge accumulated first increased and then decreased over time. It was found that the phase angle has a negligible influence on the surface charge distribution at the cut-off moment.
1. Introduction
Gas-insulated switchgear (GIS) is the critical infrastructure in power transformation systems, with its operational reliability directly impacting the safety of power supply [1,2]. As essential components, insulators play the role of electrical isolation and mechanical support [3]. Given the recurring occurrence of abnormal discharge faults along insulator surfaces in GIS operations, extensive investigations have been conducted, among which insulator flashover failures accounted for the vast majority [4,5]. It is agreed that under the influence of high-voltage (HV) electric field, free charges will be accumulated at the insulator–gas interface to form surface charge [6,7,8]. On the one hand, these charges will distort the surface electric field and induce partial discharge; on the other hand, they also act as seed charge for the development of surface discharge, facilitating the onset of the flashover [9].
Currently, research on the mechanism of charge accumulation under DC voltage and the influence of charge accumulation on surface flashover has been widely carried out. Under long-term DC electric field forces, the surface treatment of insulators, the optimization of insulator structure to improve electric field distribution, and the prevention of contaminant deposition can be employed to regulate surface charge and enhance insulation performance [10,11,12]. In comparison, there is relatively little research on the charge accumulation characteristics under AC voltage [13]. However, in recent years, there have been numerous unexplained sudden flashovers of AC GIS equipment in engineering, and its discharge inducement and mechanism are still uncertain [14]. P. Morshuis et al. studied the accumulated charge behavior on the surface of cylindrical insulators in SF6 gas under AC voltage. It showed that the charge on the insulator surface is mainly negative, but the charge accumulated is less than that under DC or impulse voltage [15]. S. Tenbohlen found that the charge distribution on the insulator surface under AC voltage was correlated with the voltage phase, and the charge near the electrode exhibited the same polarity as the voltage during the charging period [16]. However, research into the characteristics of surface charge accumulation remains incomplete, particularly under long-term operation with the presence of factors such as highly non-uniform electrical field and so on. In general, there is no consistent conclusion on the charging mechanism under AC voltage, and no effective suppression method can be proposed.
C4F7N is a newly popular insulation gas with a dielectric strength roughly double that of SF6 and a significantly low GWP of 2090 [17]. However, its high liquefaction temperature (−4.7 °C) necessitates blending with buffer gasses like CO2 to meet the minimum operating temperature requirement of the equipment [18]. The mixed gas exhibits favorable performance characteristics and is environmentally friendly, presenting itself as a viable candidate to supplant SF6 across various types of equipment. J. Wang et al. investigated the accumulated charge and flashover of the insulator surface in C4F7N/CO2 mixtures by applying DC superimposed impulse voltage. They observed that with a metal particle attached to the insulator, the surface potential would be significantly distorted, leading to flashover occurring along the attachment position [19]. D. Li et al. found that the accumulated surface charge presented a three-layer concentric circle shape in C4F7N/CO2 mixed gas under AC voltage by employing a needle-plate electrode, and the polarity of the inner circle was related to the cut-off phase [20]. Scholars have conducted relatively comprehensive investigations on the surface flashover characteristics of C4F7N/CO2 mixtures under various voltage shapes [21,22]. As for how the truncation phase of AC voltage affects the surface charge distribution of insulators, there is no corresponding research conclusion on this issue. Previously, when most scholars studied the surface charge accumulation characteristics of solid insulation under AC voltage, they only measured the final distribution of surface charge after the voltage was removed, and did not consider the effect of the phase of AC voltage on charge accumulation. Or because the phase of AC voltage cannot be accurately controlled when it is powered off, there are few relevant research conclusions.
This paper investigated the distribution of surface charge under 20 kV AC voltage in C4F7N/CO2 mixtures on the down-scaled disk epoxy insulator sample, and theoretically analyzed by simulation method. The charge accumulation effect was more obvious with the presence of a metal particle [23]. The results revealed the maximum surface charge density and the amount of surface charge accumulated first increased and then decreased over time. The phase angle was found to have a negligible influence on the surface charge distribution characteristics.
2. Experimental Setup and Methods
2.1. Insulator Sample and Electrode Structure
The arrangement of the insulator sample and electrodes is depicted in Figure 1. To facilitate the comparative analysis of subsequent experimental results, the test insulator was designed following the shape of the disk-shaped insulator suitable for 126 kV GIS, scaled down to 44% of the original size after equivalent field calculation [24]. The sample was manufactured by Taikai Group Co., Ltd., Tai’an, China, and was obtained by doping epoxy resin and Al2O3 at a mass ratio of 3:1. The central conductor and grounded electrode were arranged in a coaxial arrangement to simulate the electric field distribution on the insulator surface in GIS. A linear aluminum metal particle with a diameter of 0.5 mm and a length of 10 mm was affixed to the grounded electrode and was extended by 5 mm to suspend above the insulator. The boundary between the planar region (close to the grounded electrode) and the non-planar region (close to the HV electrode) was set at a distance of 37 mm from the center of the central conductor.
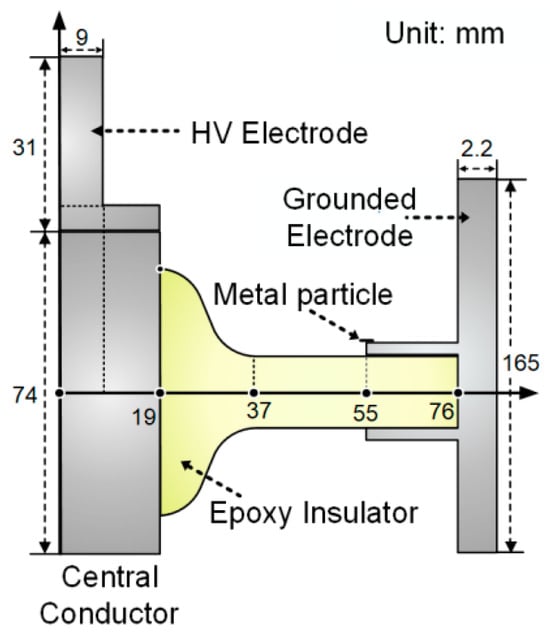
Figure 1.
Schematic diagram of the test insulator and coaxial electrode.
2.2. Experimental Circuit
The HVAC charging system shown in Figure 2 consists primarily of a phase-control circuit, a voltage regulator (250 V 10 kVA), a transformer (1:1000), a current-limiting resistor (6 MΩ), a chamber with an HV electrode, a voltage divider (1000:1), and a voltmeter and an oscilloscope. To realize the controllable switching of power frequency voltages, the phase-control circuit featuring a single-chip microcomputer (STC8H1K08, Hongjing Technology Co., Ltd. Shenzhen, China) was designed for this experiment. The circuit was controlled to cut-off the applied voltage at a specified phase angle (0° to 359°). The carried relay’s (SHV05-1A85-78D3K, Standex-Meder, Germany) operation time was less than 0.1 ms with an accuracy error of less than 0.5%. The voltage regulator and transformer were utilized to adjust the voltage, while the current-limiting resistor prevented equipment damage from excessive discharge current. The real-time monitoring of the charging voltage is facilitated by the voltage divider and oscilloscope.
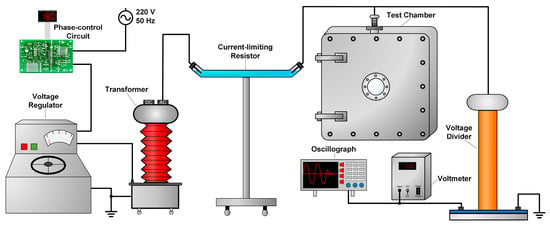
Figure 2.
Schematic diagram of the HVAC charging circuit.
2.3. Experimental Platform and Method
Figure 3 shows the charging and measurement device. The enclosed test chamber was utilized to regulate the internal gas pressure to 0.1 MPa, and was filled with a mixture of 10% C4F7N and 90% CO2. The insulator was positioned on a rotation motor and charged via the HV electrode. The insulator could rotate 360° under the control of the rotating motor. The Kelvin probe (3455ET, Trek, USA) was positioned on a mechanical frame and driven by a displacement motor for three-dimensional motion. By coordinating the rotation of the insulator and the radial movement of the probe along the insulator surface, the 648 prepositioned surface potential values can be obtained.
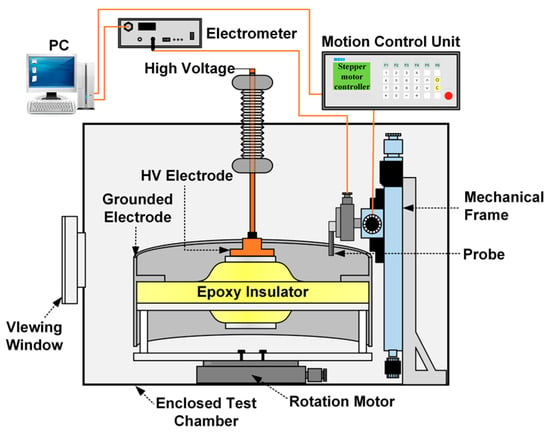
Figure 3.
Structure of charging and measurement system.
The AC voltage of 20 kV was applied to the central conductor. Four voltage durations of 2, 5, 30, and 60 min were chosen to investigate the change in accumulated charge. The surface potential of the insulator was measured after the voltage was cut-off at phase angles of 0°, 90°, and 180° respectively. The measured potential was converted into charge density by the inversion algorithm and the charge density distribution was obtained to reflect the accumulation characteristics of surface charge [25].
3. Experimental Results
3.1. Influence of Phase Angle on Surface Charge Distribution
The phase-control circuit described in Section 2.2 is utilized to cut the HV sinusoidal wave at different phase angles. Three specific angles are chosen: 0° corresponds to the negative zero-crossing moment of the voltage, 90° corresponds to the peak value of the positive voltage, and 180° corresponds to the positive zero-crossing moment of the voltage. The waveform of the voltage cut-off time is captured by the oscilloscope and depicted in the schematic diagram shown in Figure 4a, Figure 5a and Figure 6a. Following voltage cessation, the transformer coil induces oscillations in voltage amplitude, gradually reducing to zero. The angle where the waveform oscillation starts is marked by a red dotted line. The positions and corresponding values of maximum positive and negative charge densities are highlighted in the charge distribution diagram. Where the metal particle appears is depicted by a black short line at the top of the figure. The boundary between the planar and non-planar regions of the insulator surface is delineated by a dashed circle.
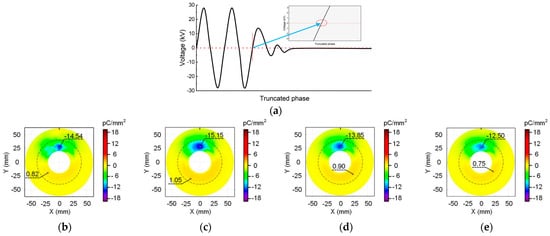
Figure 4.
Surface charge distribution at the cut-off phase angle of 0°: (a) waveform diagram; (b) 2 min; (c) 5 min; (d) 30 min; (e) 60 min.
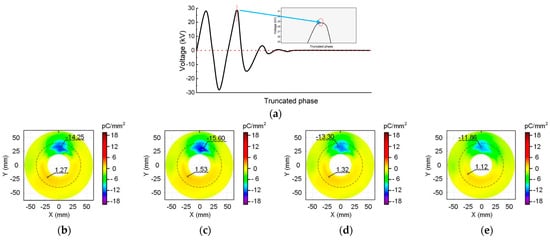
Figure 5.
Surface charge distribution at the cut-off phase angle of 90°: (a) waveform diagram; (b) 2 min; (c) 5 min; (d) 30 min; (e) 60 min.
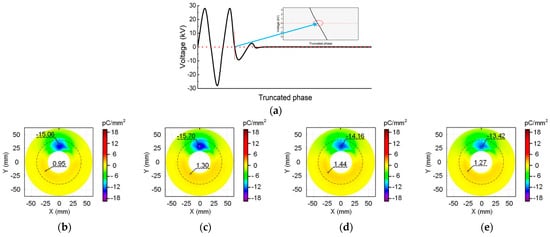
Figure 6.
Surface charge distribution at the cut-off phase angle of 180°: (a) waveform diagram; (b) 2 min; (c) 5 min; (d) 30 min; (e) 60 min.
Figure 4 shows the surface charge distribution at the cut-off phase angle of 0°. The negative charge speckle appears consistently in the non-planar region near the metal particle regardless of when the voltage is cut-off. Moreover, the position and shape of the speckle remain unchanged over time. Far away from the metal particles, a small amount of positive charge accumulates in the non-planar region. In other planar regions distant from the charge speckle, the charge density approaches zero. However, both the maximum charge density value and the size of the charge speckle area show an increasing trend within the initial 5 min of voltage application. When the voltage duration exceeds 30 min, the accumulated charge speckle on the insulator surface tends to dissipate.
The results in Figure 5 are derived from the cut-off phase angle of 90°. It can be seen that there is also a negative charge speckle towards the metal particle, and the distribution positions of the positive and negative charges are the same as that in Figure 4.
In addition, it shows that as the voltage duration increases, the maximum charge density value and charge speckle size first increases and then decreases. Figure 6 shows the surface charge accumulation at the cut-off angle of 180°. The observations are similar to Figure 4 and Figure 5, revealing the presence of a negative charge speckle opposite the metal particle. Moreover, as the charging time increases, the shape of the charge speckle and the position of positive and negative charges remain unchanged. Furthermore, the changes in the maximum positive and negative charge densities and the charge speckle area are consistent with the previous results.
When comparing Figure 4, Figure 5 and Figure 6 for the same duration of applied voltage, the insulator surface charge distribution characteristics at different cut-off phase angles exhibit general similarity, showing no discernible pattern with the change in angle. Numerically, there is no regularity in the difference in maximum positive and negative charge densities among the three cut-off phase angles at the same voltage application time. Furthermore, the interference of minor variables such as temperature, humidity, and measurement error on this difference cannot be ignored. These results indicate that the phase angle of the voltage cut-off moment has a negligible effect on the surface charge accumulation feature when applying AC voltage to the insulator.
3.2. Influence of Phase Angle on Charge Quantity
Figure 7 displays the absolute values of the total positive and negative charges on the insulator surface across different cut-off phase angles and durations of HV application. Each color represents four columns corresponding to the charge quantity of 2, 5, 30, and 60 min of voltage application. It is evident that with the increasing voltage duration, the total charge density exhibits a trend in initially increasing and subsequently decreasing. As can be seen, in the presence of the metal particle at the grounded electrode, the accumulated total negative charge on the insulator surface significantly exceeds the positive charge. Notably, whether concerning the positive or negative charge, the total quantity accumulated on the insulator surface does not markedly alter with the variation in the cut-off phase angle.
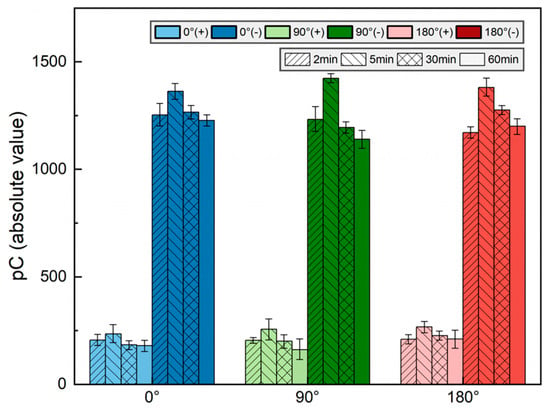
Figure 7.
Total measured charges on the surface of insulators.
4. Discussion
4.1. Simulation Results
A two-dimensional model based on the geometric parameters outlined in Figure 1 was established. The charge accumulation characteristics on the gas–solid interface were analyzed through the COMSOL Multiphysics 6.2 software. Figure 8 presents the simulation results of electric field strength and field lines within the insulator and the mixed gas under the peak of 20 kV AC voltage. It shows that a high electric field strength appears at the tip of the metal particle, reaching a maximum of 4.79 × 10⁶ V/m. The initial discharge field strength of the binary gas mixture is as follows [26]:
where Ebd is the initial discharge field strength of the binary gas mixture, pa and pb are the partial pressure of components a and b of the gas mixture, and Ea and Eb are the initial discharge field strength of a and b. The maximum local electric field strength exceeds the calculated value of 4.58 × 10⁶ V/m, which facilitates corona discharge.
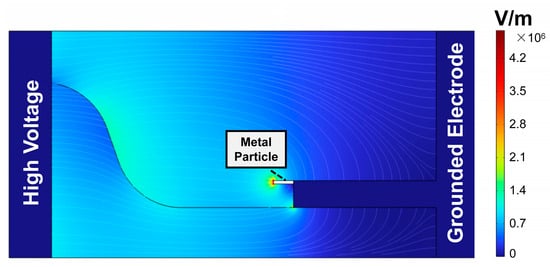
Figure 8.
Simulation of the electric field.
The generated positive ions and electrons will move in a directed manner under the effect of the electric field. The non-planar region exhibits a strong normal electric field, mainly directed by the metal particle towards the insulator. However, in the planar region, the tangential electric fields predominate.
According to current research, charges accumulate on the surface of insulators through three transmission modes [27]: conduction on the solid side of the insulator, conduction on the gas side, and conduction on the surface of the insulator. The accumulation process of surface charge can be regarded as the competition between the three conductions.
4.1.1. Solid Side Conduction
The solid side current density of the insulator is the sum of displacement current and convection current:
where JV is the normal current density in the insulator, D is electric flux density, γv is the volume conductivity of 2 × 10⁻¹⁶ S/m of the epoxy insulator, and Ebn represents normal electric field strength on the solid side.
4.1.2. Gas Side Conduction
This model considers the effects of microscopic mechanisms such as generation, diffusion, migration, and the recombination of charged particles in insulating gasses. The current density on the gas side consists of displacement current and conduction current is as follows:
where JG is the normal current density in the gas, Egn is the normal electric field strength in gas, μ+ and μ− express the mobility of positive/negative ions, D+ and D− represent the ions’ diffusion coefficient, and n+ and n− represent the carrier density of the ions.
where nip expresses ion pair generation rate and R is the recombination coefficient, corresponding to the value of 2.2 × 10⁻⁶ cm3/s.
where Tg is gas temperature and Kb is the Boltzmann constant.
4.1.3. Surface Conduction
The surface current density of insulators can be expressed by the surface conductivity and tangential electric field:
The temporal change in the surface charge density σ can be described as follows:
where JS is surface current density, Et is the tangential electric field strength, and γs is the epoxy insulator surface conductivity of 1.2 × 10⁻¹⁸ s.
In the simulation, the cut-off phase angle is 0° after applying the AC voltage of 50 Hz with an amplitude of 20 kV for 2 min. On this basis, additional 1/4 and 1/2 cycle voltages were applied, corresponding to 90° and 180° cut-off phase angles, respectively. The results are depicted as the surface charge density distribution shown in Figure 9a, with the solid black line outlining the insulator. As can be seen, the most significant charge accumulation occurs near a radial length of 30 mm corresponding to the largest normal electric field strength on the insulator surface. The difference in charge density due to different phase angles in this region can reach 0.14 pC/mm2. However, due to the greater variance in the results from the measurement error and small changes in gas composition, temperature, etc., the difference between the measured values is much higher under the same conditions. As can be seen from Figure 9b, the difference in the surface charge density of the insulator due to the phase is up to 2.08 pC/mm2. Therefore, the influence of phase angle at the AC voltage cut-off moment on the measurement of insulator surface charge density can be disregarded.
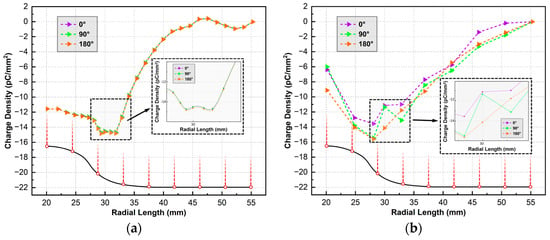
Figure 9.
Surface charge density under different turn-off phase angles: (a) simulation result; (b) experimental result.
Figure 10 depicts the potential distribution under the action of the insulator surface charge after the 2 min application of 20 kV AC voltage. It reveals that in the non-planar region opposite the metal particle, the maximum potential can reach −3.49 × 10³ V. This phenomenon arises from the substantial accumulation of negative charge in this region.
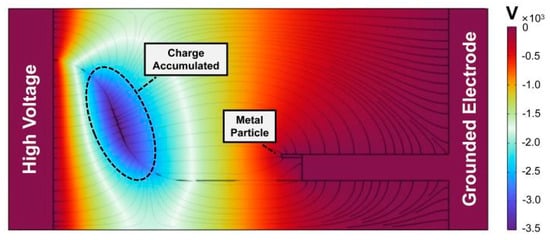
Figure 10.
Simulation of the surface charge accumulation.
4.2. Analysis of Charge Distribution
When there is a gas side discharge source, the charge accumulation on the insulator surface is shown in Figure 11. The charge transport of AC voltage at positive and negative polarity is distinguished. Because of the high electric field intensity near the tips of the metal particle, the partial discharge (mark ①) is easily induced, thereby promoting gas ionization to produce a large number of charged particles [28]. These positive ions and electrons migrate toward the insulator surface or grounded electrode under the influence of electric field force. Due to the strong electronegativity of C4F7N gas, free electrons are easily adsorbed on their outer electron orbitals to form negative ions [29], as depicted by ②. The charged particles migrate in different directions under the influence of the electric field force according to their polarity, as marked by ③. In the process of motion, some ions recombine to form gas molecules, while some ions diffuse along the direction of non-electric field lines (④), and some are attached to the insulator surface and trapped to form surface charges. Furthermore, the polarity of charge injected from electrodes is correlated with the AC voltage.
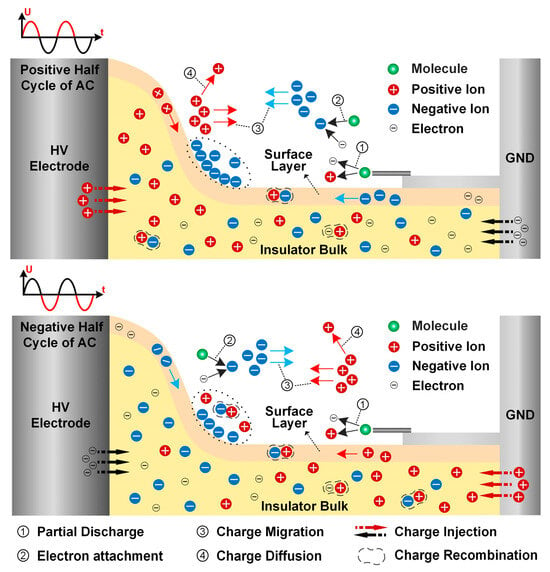
Figure 11.
Mechanism diagram of applied AC voltage on surface charge accumulation.
In the positive half-cycle of the AC voltage, electrons and negative ions on the gas side and positive ions on the solid side migrate toward the insulator surface under the influence of the electric field, especially the non-planar region. With the relatively few charged particles in the insulator bulk and positive ions injected from the HV electrode, the dominant position in surface charge accumulation is occupied by the negative charge on the gas side. Due to the low mass of electrons generated by partial discharge, they swiftly accelerate toward the insulator driven by the electric field. The majority of these electrons will be adsorbed onto C4F7N molecules, forming negative ions that either deposit on the insulator surface or remain within the gas. During the negative half-cycle, positive ions resulting from partial discharge migrate toward the insulator surface. However, due to their greater mass and slower movement compared to electrons, many positive ions recombine with the negative ions remaining in the gas. Only a few positive ions manage to reach the insulator surface before the voltage reverses again. Consequently, after multiple voltage cycles, a substantial accumulation of negative charge is observed in the non-planar region. Conversely, the plane region exhibits negligible charge accumulation due to the weak normal component of the surface electric field.
As the voltage duration increases, the charge accumulation pattern changes. This phenomenon may be caused by the short-term intense discharge at the initial stage of applied HV; as time progresses, the discharge enters a stable stage [30]. Furthermore, the accumulated surface charge also has approached stability. As a significant number of negative charges accumulate on the non-planar region of the surface, the electric field induced by these charges can inhibit negative particles from approaching the insulator surface. The accumulated charge in this area will decrease in the following cycles. Consequently, as the inhibitory effect weakens, charge accumulation increases again over several cycles. Therefore, in the later stages of applying AC voltage, the surface charge on the insulator remains in dynamic balance, with relatively minor differences in its dynamic changes.
5. Conclusions
This work focuses on the effect of cut-off phase angles and AC voltage duration on the surface charge accumulation in the C4F7N/CO2 mix gas with the presence of a metal particle. The findings are summarized as follows:
- For the insulator, the change in magnitude of the surface charge caused by the phase angle calculated theoretically can reach 0.14 pC/mm2. However, the maximum difference in values measured by experiments is 2.08 pC/mm2. It can be seen that measurement errors combined with other small changes in variables can lead to much greater measurement differences in experiments. The effect of the cut-off phase angle on the surface charge measurement is only secondary. Therefore, in the subsequent experiments, the control of the phase angle at AC voltage cut-off moment can be disregarded.
- After applying HVAC of 2, 5, 30, and 60 min, the characteristics of the charge distribution are almost unchanged. The negative charge speckle tends to gather first and then dissipate. In each group of experimental results, the total charge quantity and maximum charge density showed a growth trend in the initial 5 min and then decreased to a dynamic balance subsequently.
- Under the AC voltage of 20 kV, there are both positive and negative charges accumulated on the insulator. When the metal particle existed in the grounded electrode, the total amount of negative charge on the surface of the insulator will far exceed that of positive charge, and its value can reach 5.54–7.08 times that of the positive charge.
Author Contributions
Conceptualization, S.L. and Y.G.; methodology, S.L. and Y.G.; software, S.L. and P.H.; validation, S.L., Y.G. and D.L.; investigation, S.L.; resources, Y.G.; data curation, S.L.; writing—original draft preparation, S.L.; writing—review and editing, Y.G.; visualization, S.L.; supervision, Y.G. and B.D.; project administration, Y.G.; funding acquisition, Y.G. All authors have read and agreed to the published version of the manuscript.
Funding
This research was funded by National Nature Science Foundation of China (NSFC52077151), the Key Laboratory of Engineering Dielectrics and its Application, Ministry of Education (KFM202203), and State Key Laboratory of Electrical Insulation and Power Equipment (EIPE23208).
Institutional Review Board Statement
Not applicable.
Data Availability Statement
The original contributions presented in the study are included in the article, further inquiries can be directed to the corresponding author.
Conflicts of Interest
The authors declare no conflicts of interest.
References
- Zhao, C.H.; Tang, Z.G.; Zhang, L.E.; Wu, D.G.; Xia, H.; Li, H.Y.; Pan, K. Entire Process of Surface Discharge of GIS Disc-Spacers under Constant AC Voltage. High Volt. 2020, 5, 591–597. [Google Scholar] [CrossRef]
- Pearson, J.S.; Farish, O.; Hampton, B.F.; Judd, M.D.; Templeton, D.; Pryor, B.W.; Welch, I.M. Partial Discharge Diagnostics for Gas Insulated Substations. IEEE Trans. Dielectr. Electr. Insul. 1995, 2, 893–905. [Google Scholar] [CrossRef]
- Gao, Y.; Zhao, H.C.; Yuan, X.C.; Wang, H. Numerical Simulation of Surface Charge Inhibition Performance on Epoxy Insulator under DC Voltage by Flexible Coating Strategy. High Volt. 2022, 7, 553–563. [Google Scholar] [CrossRef]
- Xing, Y.Q.; Wang, Z.W.; Liu, L.; Xu, Y.; Yang, Y.; Liu, S.; Zhou, F.S.; He, S.; Li, C.A.Y. Defects and Failure Types of Solid Insulation in Gas-Insulated Switchgear: In Situ Study and Case Analysis. High Volt. 2022, 7, 158–164. [Google Scholar] [CrossRef]
- Qi, B.; Li, C.R.; Hao, Z.; Geng, B.B.; Xu, D.G.; Liu, S.Y.; Deng, C. Surface Discharge Initiated by Immobilized Metallic Particles Attached to Gas Insulated Substation Insulators: Process and Features. IEEE Trans. Dielectr. Electr. Insul. 2011, 18, 792–800. [Google Scholar] [CrossRef]
- Li, C.Y.; Lin, C.J.; Zhang, B.; Li, Q.; Liu, W.D.; Hu, J.; He, J.L. Understanding surface charge accumulation and surface flashover on spacers in compressed gas insulation. IEEE Trans. Dielectr. Electr. Insul. 2018, 25, 1152–1166. [Google Scholar] [CrossRef]
- Sudarshan, T.S.; Dougal, R.A. Mechanisms of Surface Flashover along Solid Dielectrics in Compressed Gases: A Review. IEEE Trans. Electr. Insul. 1986, EI-21, 727–746. [Google Scholar] [CrossRef]
- Liang, Z.D.; Lin, C.J.; Liang, F.W.; Zhuang, W.J.; Xu, Y.J.; Tang, L.L.; Zeng, Y.L.; Hu, J.; Zhang, B.; Li, C.Y.; et al. Designing HVDC GIS/GIL Spacer to Suppress Charge Accumulation. High Volt. 2022, 7, 645–651. [Google Scholar] [CrossRef]
- Hama, H.; Hikosaka, T.; Okabe, S.; Okubo, H. Cross-Equipment Study on Charging Phenomena of Solid Insulators in High Voltage Equipment. IEEE Trans. Dielectr. Electr. Insul. 2007, 14, 508–519. [Google Scholar] [CrossRef]
- Li, C.; Lin, C.; Chen, G.; Tu, Y.; Zhou, Y.; Li, Q.; Zhang, B.; He, J. Field-Dependent Charging Phenomenon of HVDC Spacers Based on Dominant Charge Behaviors. Appl. Phys. Lett. 2019, 114, 202904. [Google Scholar] [CrossRef]
- Luo, Y.; Mao, S.Y.; Tang, J.; Pan, Z.J.; Pan, C. Shape Optimisation of Basin Insulator for DC Gas Insulated Switchgear/Gas Insulated Transmission Lines Based on Artificial Bee Colony Algorithm. High Volt. 2024, 9, 275–286. [Google Scholar] [CrossRef]
- Kumara, S.; Alam, S.; Hoque, I.R.; Serdyuk, Y.V.; Gubanski, S.M. DC Flashover Characteristics of a Polymeric Insulator in Presence of Surface Charges. IEEE Trans. Dielectr. Electr. Insul. 2012, 19, 1084–1090. [Google Scholar] [CrossRef]
- Zhang, G.X.; Li, D.Y.; Wang, T.Y. Progress in Researching Charge Accumulation and Discharge Characteristics at Gas-Solid Interface under AC Voltage. Trans. China Electrotech. Soc. 2022, 37, 3876–3887. [Google Scholar]
- Li, D.Y.; Zhang, G.X.; Wang, T.Y.; Hou, Y.C.; Zhang, B.Y. Surface Charge Measurement under AC Voltage Using Active Electrostatic Probe and Controllable Phase Truncation Scheme. IEEE Trans. Dielectr. Electr. Insul. 2020, 27, 684–691. [Google Scholar] [CrossRef]
- Jing, T.; Morshuis, P.H.F.; Kreuger, F.H. AC Stress-Introduced Static Charging with Rough Electrode Finishes. In Proceedings of the International Conference on Properties & Applications of Dielectric Materials, Seoul, Republic of Korea, 25–30 May 1997. [Google Scholar]
- Tenbohlen, S. and Schröder, G. The Influence of Surface Charge on Lightning Impulse Breakdown of Spacers in SF6. IEEE Trans. Dielectr. Electr. Insul. 2000, 7, 241–246. [Google Scholar] [CrossRef]
- Ye, F.C.; Zhang, X.X.; Li, Y.; Wan, Q.Q.; Bauchire, J.M.; Hong, D.P.; Xiao, S.; Tang, J. Arc Decomposition Behaviour of C4F7N/Air Gas Mixture and Biosafety Evaluation of Its By-Products. High Volt. 2022, 7, 856–865. [Google Scholar] [CrossRef]
- Meng, Y.; Li, Z.C.; Xue, H.R.; Ding, W.D.; Deng, Z.C.; Liu, W. Surface Flashover Characteristics of the 252 kV Conical Insulator in C4F7N/CO2 Gas Mixture. IEEE Trans. Dielectr. Electr. Insul. 2023, 30, 717–725. [Google Scholar] [CrossRef]
- Wang, J.; Wang, J.R.; Hu, Q.; Chang, Y.N.; Liu, H.; Liang, R.X. Mechanism Analysis of Particle-Triggered Flashover in Different Gas Dielectrics under DC Superposition Lightning Impulse Voltage. IEEE Access 2020, 8, 182888–182897. [Google Scholar] [CrossRef]
- Li, D.Y.; Zhang, G.X.; Wang, T.Y.; Hou, Y.C. Charge Accumulation Characteristic on Polymer Insulator Surface under AC Voltage in Air and C4F7N/CO2 Mixtures. High Volt. 2020, 5, 160–165. [Google Scholar] [CrossRef]
- Xiao, S.; Wang, Y.F.; Ren, C.H.; Xia, H.R.; Zhao, Y.; Qin, J.Z.; Zhang, X.X.; Luo, Y.; Li, Y. Assessment on Gas-Polyethylene Terephthalate Solid Interface Partial Discharge Properties of C4F7N/CO2 Gas Mixture for Eco-Friendly Gas Insulating Transformer. High Volt. 2024, 9, 35–45. [Google Scholar] [CrossRef]
- Li, Y.; Zhang, X.X.; Zhang, J.; Fu, M.L.; Zhuo, R.; Luo, Y.; Chen, D.C.; Xiao, S. Experimental Study on the Partial Discharge and AC Breakdown Properties of C4F7N/CO2 Mixture. High Volt. 2019, 4, 12–17. [Google Scholar] [CrossRef]
- Li, S.; Lu, D.; Gao, Y.; Wang, W.; Du, B. Surface Charge Accumulation on Epoxy Insulator with Metal Particle in C4F7N/CO2 under AC Voltage. In Proceedings of the 2023 IEEE 4th International Conference on Electrical Materials and Power Equipment (ICEMPE), Shanghai, China, 7–10 May 2023. [Google Scholar]
- Gao, Y.; Lu, D.; Wang, W.Q.; Zhao, H.C.; Han, T.; Du, B.X. Surface Charge Accumulation of Zoning-Coating GIS Insulator in Different Gas Atmospheres. IEEE Trans. Plasma Sci. 2024, 52, 222–229. [Google Scholar] [CrossRef]
- Pan, Z.; Tang, J.; Hu, B.; Pan, C.; Luo, Y.; Mao, S. Inversion algorithm for surface charge distribution on insulator in shift-invariant system based on constrained least square filter. IEEE Trans. Instrum. Meas. 2021, 70, 1–12. [Google Scholar] [CrossRef]
- Park, C.; Graber, L.; Cheetham, P.; Al-Taie, A.; Telikapalli, S.; Pamidi, S. Versatile Paschen’s Model for the Dielectric Strength Estimation of Binary and Ternary Gas Mixtures. IEEE Trans. Dielectr. Electr. Insul. 2019, 26, 1569–1576. [Google Scholar] [CrossRef]
- Winter, A.; Kindersberger, J. Stationary Resistive Field Distribution along Epoxy Resin Insulators in Air under DC Voltage. IEEE Trans. Dielectr. Electr. Insul. 2012, 19, 1732–1739. [Google Scholar] [CrossRef]
- Murooka, Y.; Takada, T.; Hidaka, K. Nanosecond Surface Discharge and Charge Density Evaluation Part I: Review and Experiments. IEEE Electr. Insul. Mag. 2001, 17, 6–16. [Google Scholar] [CrossRef]
- Wang, W.; Yan, X.; Liu, B.; Bian, Y. Investigation of Arc Dynamic Behavior Change Induced by Various Parameter Configurations for C4F7N/CO2 Gas Mixture. Energies 2024, 17, 3485. [Google Scholar] [CrossRef]
- Li, X.; Liu, W.D.; Xu, Y.; Ding, D.W. Partial Discharge and Movement Characteristics of Micron-Sized Metal Particles on Insulator Surface in Gas-Insulated Switchgear with Long-Time AC Stress. IEEE Trans. Dielectr. Electr. Insul. 2021, 28, 2152–2160. [Google Scholar] [CrossRef]
Disclaimer/Publisher’s Note: The statements, opinions and data contained in all publications are solely those of the individual author(s) and contributor(s) and not of MDPI and/or the editor(s). MDPI and/or the editor(s) disclaim responsibility for any injury to people or property resulting from any ideas, methods, instructions or products referred to in the content. |
© 2024 by the authors. Licensee MDPI, Basel, Switzerland. This article is an open access article distributed under the terms and conditions of the Creative Commons Attribution (CC BY) license (https://creativecommons.org/licenses/by/4.0/).