Abstract
A highly sensitive ammonia-gas sensor based on a tungsten trioxide and polypyrrole (WO3/PPy) nanocomposite synthesized using pulsed-laser deposition (PLD) and matrix-assisted pulsed-laser evaporation (MAPLE) is presented in this study. The WO3/PPy nanocomposite is prepared through a layer-by-layer alternate deposition of the PPy thin layer on the WO3 mesoporous layer. Extensive characterization using X-ray diffraction, FTIR and Raman spectroscopy, scanning electron microscopy, atomic force microscopy, and water contact angle are carried out on the as-prepared layers. The gas-sensing properties of the WO3/PPy nanocomposite layers are systematically investigated upon exposure to ammonia gas. The results demonstrate that the WO3/PPy nanocomposite sensor exhibits a lower detection limit, higher response, faster response/recovery time, and exceptional repeatability compared to the pure PPy and WO3 counterparts. The significant improvement in gas-sensing properties observed in the WO3/PPy nanocomposite layer can be attributed to the distinctive interactions occurring at the p–n heterojunction established between the n-type WO3 and p-type PPy. Additionally, the enhanced surface area of the WO3/PPy nanocomposite, achieved through the PLD and MAPLE synthesis techniques, contributes to its exceptional gas-sensing performance.
1. Introduction
Nowadays, there is a growing interest in low-cost, high-performance environmental pollution monitoring devices, particularly sensors. Daily emissions of toxic gases from both natural and human-made sources pose significant environmental and health risks, contributing to climatic disturbances and respiratory ailments. Small amounts (parts per million (ppm)) of toxic gases can be detected with different types of sensors (resistive [1], capacitive [2], and surface acoustic wave [3]).
The active materials in most sensors on the market are based on metal oxide semiconductors, such as SnO2, ZnO, or WO3 [4]. Tungsten oxide in particular is recognized for its versatility in detecting both oxidizing and reducing gases, especially in ammonia sensing. Thus, numerous methods, i.e., hydrothermal synthesis of nanoflakes [5], microwave-assisted hydrothermal synthesis for obtaining nanoparticles [6], electrospinning for nanofibers [7], or pulsed-laser deposition (PLD) [8] have been employed to prepare WO3 with different shapes, resulting in sensitive gas sensors with notable responses to NH3, NO2, acetone, and ethanol.
However, the main issue with metal oxide semiconductor-based sensors is their high operating-temperature requirement (often in the range of 200 to 500 °C) to operate effectively. This elevated temperature is necessary to facilitate the chemical reactions involved in gas-sensing processes, such as the adsorption and desorption of gas molecules on the sensor surface. Therefore, efforts are being made to develop sensors that operate at lower temperatures without compromising sensitivity and selectivity. This involves exploring alternative materials, modifying surface properties, and employing advanced fabrication techniques to enhance the sensor’s performance at room temperature or moderately elevated temperatures.
Polymers (such as polyaniline (PANI), polypyrrole (PPy), polythiophene, and poly(3,4-ethylenedioxythiophene)) have been extensively explored as sensing materials owing to their advantages of low operating temperature, cost effectiveness, and flexibility. However, the drawback of these polymers lies in their inherent limitations of poor stability and long response time [9,10]. To address these challenges, there is great interest in the development of hybrid inorganic–organic composite materials as thin layers which can pose enhanced physical and chemical properties due to their complementary behaviours [11,12]. Polymer composite-based ammonia sensors operating at room temperature have been the subject of numerous research studies. For instance, sensing membranes employing PANI have been fabricated, for example, PANI–halloysite nanotubes [13], CeO2 NP@PANI hydrogel nanohybrids [14], PANI–carbon nanotubes [15], or PANI–MXene [16], exhibiting substantial response at various concentrations of NH3 at room temperature. Another polymer of interest for ammonia detection is polypyrrole due to its relatively high electrical conductivity among conducting polymers, environmental stability, and chemically inert behaviour. Also, PPy generally has good mechanical strength, which is advantageous in situations where the sensor may experience mechanical stress or deformation (flexible sensors) [17]. Sensitive layers of PPy in different configurations (thin films, nanofibres, nanowire array, and nanotubes) have been obtained by different methods (chemical polymerization, Langmuir–Blodgett, vapour-phase polymerization, electro-polymerization, etc.) and tested, showing good responses to ammonia different concentrations at room temperature [18].
Recently, WO3-PPy composites have gained attention due to their chemical stability, enhanced sensitivity and selectivity to toxic gas (NO2, H2S, acetone, triethylamine) [19,20,21,22,23], and lower operating temperatures. Compared to some other sensing materials, tungsten oxide and polypyrrole have the advantage of being cost effective. This can be important for the widespread deployment of sensors in various industrial or environmental monitoring situations.
In this work, we will demonstrate resistive gas sensors with nanocomposites based on conductive polymers and metal oxide semiconductors as active materials, with a specific focus on achieving optimal performance at room temperature. In particular, we focus on applying laser-based methods for the synthesis of nanocomposites of PPy and WO3. Although there are numerous publications which demonstrate the fabrication of gas sensors with PPy and WO3 nanocomposites [24], there are still many challenges to overcome, such as the low adherence of the materials to the substrate, tuning of the energy barrier at the electrode–active material interface for easy charge transport, etc. Thus, we use laser methods, i.e., pulsed-laser deposition (PLD) [25] and matrix-assisted pulsed-laser evaporation (MAPLE) [26] to process different types of materials, both organic and inorganic, into layers with controlled thickness, structure, and topography onto metallic electrodes.
Our work aims to contribute to the advancement of gas sensors by showcasing the efficacy of resistive gas sensors based on PPy and WO3 nanocomposites synthesized through PLD and MAPLE. Ultimately, this work provides a pathway towards reliable, room-temperature-operable gas-sensing devices with enhanced sensitivity.
2. Materials and Methods
2.1. Materials
Sensitive composite layers based on tungsten oxide (WO3) and polypyrrole (PPy) polymer are prepared both on Si (100) substrates from Neyco (Vanves, France) (for postcharacterization measurements, i.e., infrared spectroscopy) as well as on substrates prepatterned with metallic interdigital electrodes (DRP-G-IDEAU10 from Metrohm DropSens, Oviedo (Asturias) Spain), using PLD and MAPLE techniques.
A WO3 ceramic target (99.9% purity) (Kurt J. Lesker Company GmbH, Dresden, Germany) is employed for the pulsed-laser deposition (PLD) experiments. Solutions of polypyrrole polymer (Merck, Darmstadt, Germany) suspended in N-Methyl-2-pyrrolidone (NMP) (Honeywell Specialty Chemicals Seelze GmbH, Seelze, Germany) at a concentration of 1% are used for the preparation of the matrix-assisted pulsed-laser evaporation (MAPLE) targets.
2.2. Preparation of the Sensing Layers
A schematic illustration showing the preparation of the PPy/WO3 nanocomposite by PLD and MAPLE is depicted in Figure 1. In addition, single layers of WO3 and PPy are applied onto metallic electrodes by PLD and MAPLE, respectively. The active layer is applied on top of the interdigitated electrode area, using a mask to protect the two thick electrodes (1 mm) used for electric connections.
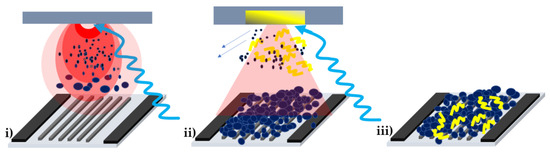
Figure 1.
Sketch of the sensor fabrication: (i) mesoporous WO3 by PLD on interdigital electrodes; (ii) deposition of PPy layer by MAPLE on top of the WO3 mesoporous layer. The arrows indicate that the solvent molecules are pumped away from the deposition chamber, while the polymer material is deposited onto the WO3 layer; (iii) a WO3/PPy nanocomposite layer deposited onto the interdigital electrodes of a gas sensor.
PLD is used for obtaining mesoporous WO3 layers onto which a thin layer of PPy is applied via MAPLE. Additional details about the setups and the method can be found in [8,27]. Briefly, the PLD experimental setup consists of a YAG:Nd pulsed laser (Quantel, France) (266 nm wavelength, repetition rate of 10 Hz, 7 ns pulse duration) and an in-house designed reactive chamber connected to vacuum pumps. The distance between the target and the substrate is fixed at 1 cm, and the laser fluence is set at 4.5 J/cm2. The WO3 target is ablated with 40,000 laser pulses. During WO3-layer deposition, in order to avoid any damage, the target is rotated, and the laser beam scans its surface with the help of an opto-mechanical system. The experiments take place at atmospheric pressure (1000 mbar air), a pressure that leads to a mesoporous architecture of the WO3 layer.
The MAPLE experimental system consists of a YAG:Nd pulsed laser (Continuum, Corbas, France) (266 nm wavelength, repetition rate of 10 Hz, 5–7 ns pulse duration) and a commercially available MAPLE reactive chamber from Neocera (Beltsville, MD, USA). To keep the target frozen during deposition, a system containing copper pipes connected to the target holder allows a continuous flow of liquid nitrogen from an external vessel. All MAPLE experiments are carried out in a vacuum (working pressure of 5 × 10⁻⁵ mbar). The distance from the target to the substrate is set at 3.8 cm. The laser fluence is 0.258 J/cm2.
2.3. X-ray Diffraction (XRD) Characterization
The crystallographic characteristics of the sensitive layers and target materials are investigated by X-ray diffraction (XRD). The XRD spectra are acquired with a PANalytical X’Pert MPD diffractometer with Cu-kα radiation in Bragg–Brentano θ-2theta geometry. The XRD measurements are carried out in the 10–60 2theta interval, with a step size of 0.02 and an acquisition time of 10 s/step. Data processing is performed using HighScore Plus software 5.1 and PDF-4+ Database.
2.4. Infrared (IR) Spectra
Chemical investigations of the as-deposited thin films are carried out by using the Fourier transform infrared spectrometer (FTIR) Jasco (Tokio, Japan) 6300 Type-A in transmission mode, in the 500–4000 cm−1 range, and at a resolution of 4 cm−1. The obtained spectra are processed by using Spectra Manager v.2 package software. For this measurement type, the thin films are deposited on FTIR-dedicated thin polished Si substrates (Neyco Company Supplier, Vanves, France). Silica gel is placed inside the spectrometer in order to reduce the atmospheric water vapours during FTIR measurements.
2.5. Raman Spectra
Raman spectroscopy is carried out using a DXR Raman Microscope (Thermo Fischer Scientific, Waltham, MA, USA) with a laser line of 532 nm as the excitation source. The spectra are obtained following 10 scans, with 20 s exposure time. The Raman spectra are collected over the 200–2000 cm−1 range at room temperature.
2.6. Water Contact-Angle Measurements
Water contact-angle measurements are carried out employing the sessile drop method with a KSV CAM101 microscope (KSV Instruments Ltd., Helsinki, Finland) equipped with a video camera. The contact-angle measurements are conducted by dispersing water droplets with a volume of 2.5 ± 0.5 µL. For each sample, contact-angle measurements are taken at five distinct points, and the reported contact angle is the average of these measurements.
2.7. SEM and AFM Measurements
We explore the surface morphology of the samples by scanning electron microscopy (SEM). Our analyses are carried out using the Scios 2 DualBeam, an advanced ultra-high-resolution analytical focused ion beam scanning electron microscope FIB-SEM system (Thermo Fisher Scientific Inc., Hillsboro, OR, USA), at voltages up to 30 kV.
The AFM images are acquired using an XE100 microscope (Park System, Suwon, Republic of Korea). The scanning of the surfaces was carried out with an OMLC-AC160-TS tip from Olympus (Tokyo, Japan), in noncontact mode at ambient conditions. Multiple regions and dimensions (40 × 40 µm2 and 5 × 5 µm2) are investigated to obtain data on the surface root-mean-square roughness (Rq) of the as-deposited layers.
2.8. Gas-Sensing Measurements
The ammonia-gas-sensing properties of the PPY and WO3/PPy sensors are investigated at room temperature (22 ± 1 °C), while the sensing properties of WO3 are evaluated at 100 ± 1 °C. The laser-fabricated sensors are inserted into a custom-built testing chamber containing a gas inlet and outlet. The electrodes of the sensor devices are connected to a Keithley 2450 SourceMeter (Keithley Instruments, Cleveland, OH, USA) which is operated in continuous mode. Two mass-flow controllers (MFCs, Alicat Scientific (Tucson, AZ, USA)) are used to deliver a mixture of various concentrations of NH3 in a carrier gas (N2) to the testing chamber with a total flow rate of 1 L/min (Figure S1). Various concentrations of ammonia gas in a range of 10–50 ppm are tested. An Alicat Scientific MC-10SLPM-D/5M MFC is used to control the N2 carrier gas flow rate, while an Alicat Scientific MC-10SCCM-D/5M MFC is used for controlling the NH3 flow rates. Flow rates are remotely controlled by connecting the MFCs to a laptop via a 6′ USB-MD8-232 double-ended 8-pin mini-DIN to USB serial cable (Alicat Scientific) and using Flow Vision 2.0 SC software (Alicat Scientific; available free of charge online) to change the flow rates. The humidity is measured using a hygrometer placed near the exhaust gas. Fifteen sensors (5 sensors for each of the PPy, WO3, and WO3/PPy sensing layers) were fabricated and tested. The response S is used to evaluate the sensor performance, i.e., S = (Rg − Ra)/Ra × 100% [28]. Here, Ra and Rg are the resistance of the sensor under dry nitrogen gas and the given concentration of ammonia, respectively. The response/recovery time is calculated as the time taken for the sensor to reach 90% of the total resistance change from its initial resistance.
3. Results and Discussion
3.1. XRD Spectra of WO3, PPY, and WO3/PPY Sensing Layers
The X-ray diffraction patterns of the active layers, together with the WO3 target and the PPy powder, are presented in Figure 2a. The presence of multiple diffraction peaks in the WO3 target spectra indicates the polycrystalline nature of the material, characteristic of the crystal structure of monoclinic WO3 (JCPDS file:043-1035 [29]). The WO3 layer obtained by PLD (red pattern in Figure 2a) shows similar characteristics to the original WO3 (PLD Target). No diffraction peaks are visible in the PPy powder spectra, and the narrow peak observed at 2theta = 33.100° is a reflection of the silicon substrate [30]. The addition of PPy on top of WO3 (WO3/PPy, Figure 2a) by MAPLE makes the (002), (020), and (200) individual lattice planes not easily distinguishable, but the main aspect of the diffraction pattern is maintained. The presence of PPy may reduce the visibility or intensity of diffraction peaks by preventing the X-rays from interacting effectively with the underlying WO3 [31].
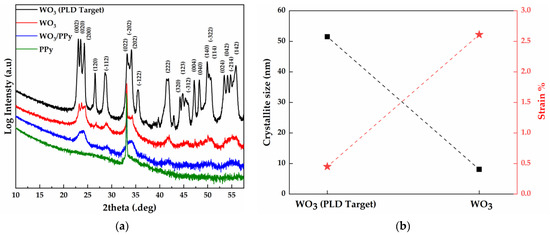
Figure 2.
X-ray diffraction result of the active layers (a) XRD pattern of the WO3 target, WO3 thin layer, PPy thin layer, and WO3/PPy nanocomposite layers deposited by PLD and MAPLE; (b) crystallite size and strain of the WO3 target material and WO3 particles obtained by PLD. The data are obtained from the Sherrer Equation in HighScore Plus software.
The crystallite size and strain of the WO3 particles from both the WO3–PPy nanocomposite layer and the WO3 PLD target are presented in Figure 2b. The data plotted for both crystallite size and strain represents average values calculated from all visible diffraction peaks. However, for the WO3–PPy sensitive layer, the values of crystallite size and strain could not be extracted due to the limited distinguishability between the (002), (020), and (200) individual lattice planes. Nevertheless, it is reasonable to assume that the addition of PPy by MAPLE (a low-energy process) did not alter the crystalline characteristics of the WO3 particles made by PLD. Consequently, the values of crystallite size and strain obtained for WO3 are considered representative of the WO3/PPy sensitive layer as well.
The WO3 PLD target has a characteristic crystallite size of approximately 50 nm and a value of 0.45% strain. After PLD deposition, the WO3 particles have an average crystallite size of ~8 nm. This decrease in crystallite size is linked to the mechanism of WO3 particle generation by PLD. When the plasma plume is rapidly cooled at high pressure (1 bar of synthetic air) the vaporized atoms and molecules undergo nucleation, a process where these species collide, combine, and form clusters or nuclei that further grow into particles (with smaller crystallite size) through coalescence and aggregation processes [32,33]. Moreover, the reduction in crystallite size is accompanied by a notable increase in strain from 0.45% (PLD Target) to ~2.6% for the WO3 particles. This trend has been reported previously in [34], where ZnO, TiO2, SnO2, and MoO3 highly porous layers were fabricated by PLD in air, at atmospheric pressure, in an experiment similar to ours.
Moreover, according to previous studies, the shape and size of metal oxide nanocrystallites are of particular interest, as they provide energetically distinct adsorption sites for analytes on different crystal facets. Notably, our XRD studies reveal a nanocrystallite size of around 8 nm, aligning with the literature findings that suggest such dimensions are favourable for improving sensor performance, i.e., for WO3 nanoparticles with diameters of 25 nm; the sensitivity values towards 10 ppm NO2 and 200 ppm NO at 573 K are three to four times as large as those for D > 33 nm [35].
3.2. IR and Raman Spectra of WO3/PPy Active Layers in Resistive Gas Sensors
The as-deposited layers are measured via FTIR and Raman spectroscopy in order to investigate possible chemical changes that might occur due to laser processing. The FTIR bands visible in the WO3/PPy spectra shown in Figure 3a are in good agreement with those reported in the literature for polypyrrole and tungsten oxide [36,37]. The bands between 550–580 cm−1 occur due to W-O vibration, followed by the vibrations of νW=O around 950 cm−1, and W-O-W around 810 cm−1. In addition, the band at 1196 cm−1 is due to the C–N stretching vibrations, while those at 1294 cm−1 and 1049 cm−1 are due to the = C–H in-plane vibrations. Furthermore, the bands at 1554 cm−1 and 1474 cm−1 are attributed to the fundamental vibrations of the polypyrrole ring. The FTIR results exhibit a successful combination of both PPy and WO3.
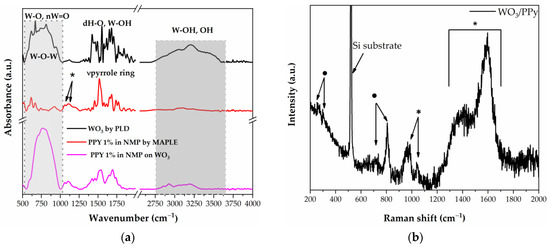
Figure 3.
(a) FTIR spectra of WO3, PPy, and WO3/PPy nanocomposite as deposited by PLD and MAPLE. (b) Raman spectra of WO3/PPy nanocomposite. In the Raman spectra, the peaks marked with the symbol (*) are assigned to PPy polymer, whilst the peaks marked with (·) are assigned to WO3.
The Raman spectra of PPy/WO3 are shown in Figure 3b. The spectra of the nanocomposite material show the characteristic peaks of both PPy (see also Figure S2) and WO3 (see also Figure S2), which indicates that no chemical damage occurs as a result of laser processing. In the spectrum of PPy, the peaks at 1552 cm−1 and 1340 cm−1 arise from the π-conjugated structure and ring stretching mode of the polymer backbone, respectively. The peak at 1037 cm−1 can be ascribed to the C–H in-plane deformation, and the two peaks at 925 cm−1 and 960 cm−1 correspond to ring deformation of the quinoid polaronic and bipolaronic structure, respectively [38]. Moreover, the ν(O–W–O) stretching mode of m-WO3 (at 807 cm−1 and 717 cm−1) and the δ(O–W) bending mode (273 cm−1 and 326 cm−1) can be attributed to a monoclinic γ-WO3 phase and are in good agreement with the XRD analysis [39]. These results are also consistent with the FTIR results.
3.3. Water-Contact-Angle Measurements of WO3, PPY, and WO3/PPy Sensing Layers
Contact-angle (CA) measurements are widely used for the assessment of the surface’s wettability, and the CAs measured on the different surfaces, i.e., WO3 by PLD, PPy by MAPLE, and the WO3/PPy nanocomposite are shown in Figure 4. The measured values are reported in Table S1. In designing a gas sensor, the choice of surface wettability, together with the active surface morphology and chemistry, as well as the overall sensor configuration play critical roles in determining the sensor’s performance.
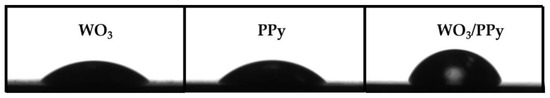
Figure 4.
Contact-angle images for WO3, PPy, and WO3PPy sensing layers. The corresponding contact-angle average values for WO3, PPy, and WO3/PPy are 43.15°, 47.45°, and 64.92° respectively.
Both the WO3 and PPy surfaces, as deposited by PLD and MAPLE, are hydrophilic, with CA of 43.15° and 47.45°. The surface of the WO3/PPy nanocomposite presents an increased CA, of around 65°, which shows that the surface is moderately hydrophilic. The increase in CA for the WO3/PPy layer can be elucidated by the distinctive topological features of the surface. The formation of mesopores results in a hydrophilic surface, and, in turn, the PPy layer fills the voids and intricacies of the WO3’s “fluffy” structure, imparting a moderately hydrophilic character to the interfaces. Our further studies will focus on designing hydrophobic and/or superhydrophobic surfaces and studying the response of the WO3/PPy nanocomposite towards ammonia. This is in particular advantageous, as ammonia is a polar molecule, and it tends to interact more favourably with hydrophobic surfaces due to the absence of water molecules on the surface. Additionally, hydrophobic surfaces repel water molecules which has the advantage of reducing interference from ambient humidity.
3.4. SEM and AFM Measurements of WO3, PPY, and WO3/PPy Sensing Layers
The SEM images of Ppy, WO3, and WO3/PPy nanocomposites are shown in Figure 5. As can be seen from the SEM images, the layers present different micro–nano structures depending on the experimental processing conditions. In particular, the WO3 layer exhibits a uniform and continuous morphology (as shown in Figure 5a). The film presents a distinctive mesoporous appearance and texture, with numerous interconnected pores or voids, forming an intricate network (see the SEM in the cross section in Figure 5b). Throughout the surface, there are irregularities resembling “fluffy clouds” with varying densities and heights. The thickness of the WO3 layers as deposited by PLD is in the 8 µm range. The size of these mesopores may vary, and some regions might display larger, well-defined pores, while others may have a more diffuse and interconnected network of smaller pores. This enhanced porosity is expected to contribute to a more favourable response, attributed to increased diffusion rates and greater gas-sorption capabilities.
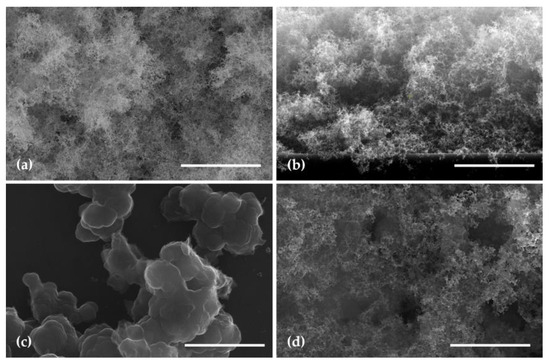
Figure 5.
SEM images of a WO3 layer (a) top view; (b) cross section; (c) top view of a PPy layer; (d) top view of a WO3/PPy layer. The scale bar in all images is 3 µm.
Furthermore, the PPy layer deposited by MAPLE (20 nm thickness) reveals a textured surface with a granular appearance (Figure 5c). The granules, which make up the thin layer, vary in size and are densely packed, creating a three-dimensional topography. The granular structure of the PPy thin layer is indicative of the polymer’s inherently semicrystalline nature [40].
The SEM image shown in Figure 5d, i.e., the surface of the WO3/PPy nanocomposite layer, where PPy is applied on top of the mesoporous WO3 surface, exhibits significant porosity. The SEM image reveals that the PPy layer fills in the voids and intricacies of the WO3 “fluffy” structure. In areas where the tungsten oxide layer is denser, the PPy layer creates localized variations in the composite structure. The polymer layer may also penetrate into the pores of the tungsten oxide, creating a composite structure with enhanced interfacial interactions. The nanocomposite surface, as depicted in the SEM image, showcases the synergistic combination of the fluffy tungsten oxide layer and the PPy coating.
In addition, the AFM images shown in Figure 6 depict the surfaces of the PPy layer (Figure 6a), and of the WO3/PPy nanocomposite, respectively (Figure 6b). Due to the mesoporous structure of the WO3 layer as deposited by PLD, it was not possible to obtain reliable measurements. The WO3/PPy nanocomposite surface presents a heterogeneous topography, capturing the features of both the mesoporous tungsten oxide layer and the PPy coating (Figure 6b).
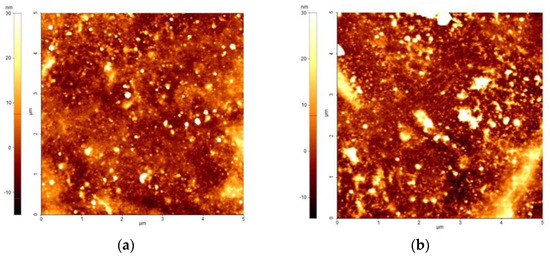
Figure 6.
AFM images of the (a) PPy layer as deposited by MAPLE; (b) the WO3/PPy nanocomposite layer.
3.5. Gas Measurements of WO3, PPY, and WO3/PPy Sensing Layers
Tungsten oxide (WO3) is an n-type semiconductor with a broad band-gap energy (2.6−3.25 eV) known to possess excellent sensitivity towards a large number of gases at high temperatures [8]. In contrast, PPy is a polymer which exhibits p-type semiconductor characteristics, demonstrating a positive charge-carrier nature and the ability to accept electrons, making it an essential material in electronic and sensor applications. It is well-known that the synergistic effect of two sensing materials in nanocomposite always supports improved gas-sensing characteristics. Therefore, given the surface chemistry, structure, morphology, and topography of the WO3 sensing layers (i.e., mesoporous) combined with the PPy thin film (nanostructured), we evaluated the resistive response of the single and nanocomposite layers towards various concentrations of ammonia at temperatures close to room temperature (22 ± 1 °C).
The PPy and WO3 sensor responses toward 50 ppm of ammonia are shown in Figure 7. In both cases, the sensors are exposed for 3 min to 50 ppm NH3, and then, dry N2 is introduced into the testing chamber. In the case of PPy active material (tested at 22 ± 1 °C), upon exposure to 50 ppm of NH3, the response of the sensor increases monotonically; when the ammonia-gas stream is stopped and nitrogen is introduced in the testing chamber, the sensor has a slower decrease upon removal of the NH3, of 15 min. The recovery of the sensor is not very fast, which might be partially related to the difficulty in the desorption of low NH3 concentrations. The PPy sensor shows an expected p-type semiconductor response upon exposure to a reducing gas (NH3), which is in accordance with previous reports [41,42].
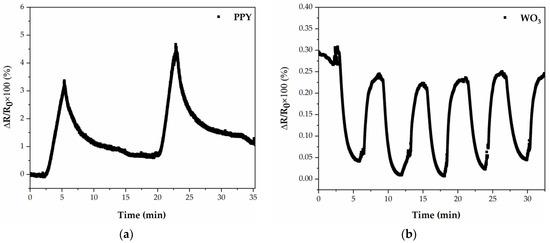
Figure 7.
(a) Time-dependent response obtained at 22 ± 1 °C of a gas sensor with PPy active layer deposited by MAPLE; (b) Time-dependent response obtained at 100 ± 1 °C of a gas sensor with WO3 active layer deposited by PLD.
In contrast to the PPy sensors fabricated by MAPLE, the sensors based on WO3 by PLD exhibit no room temperature response to NH3. Therefore, we have investigated their response at 100 ± 1 °C. In the case of WO3 active material, tested at 100 ± 1 °C, the sensor response decreases abruptly (the response time is 80 s) and then gradually approaches a steady state upon exposure to NH3. After purging with dry N2, the sensor recovers its baseline in 70 s. This is expected for a n-type semiconductor upon exposure to ammonia [8]. This is due to the fact that ammonia molecules tend to donate electrons to the WO3 surface, leading to an increase in the concentration of free electrons and, consequently, enhancing the electrical conductivity of the WO3 semiconductor. The repeatability of the WO3 sensor measured toward five exposure–recovery cycles of NH3/N2 gas under the same conditions at 100 ± 1 °C is also demonstrated in Figure 7b. The result shows that the WO3 sensor has good repeatability at 100 ± 1 °C.
Further on, we went on to explore the sensing properties of the WO3/PPy towards NH3. Prior to evaluating the WO3/PPy sensor response to ammonia, we evaluate the baseline resistance in time (i.e., for more than 30 h of continuous measurement), at 22 ± 1 °C, in a dry N2 atmosphere, and find that it is in the range 1–2 kΩ (see Figure 8a). Moreover, the baseline demonstrates an approximately linear trend, as indicated by the high R-square value of 0.95.
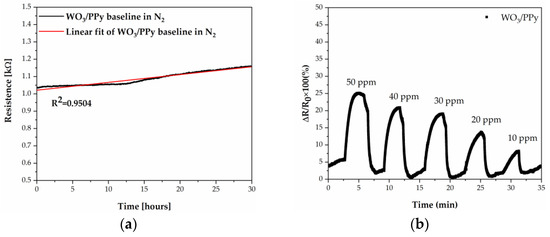
Figure 8.
(a) Evolution of the WO3/PPy nanocomposite sensor baseline in time; (b) Time-dependent response obtained at 22 ± 1 °C of a gas sensor with a WO3/PPy active layer deposited by PLD/MAPLE.
The NH3 sensing properties of the sensors based on the WO3/PPy nanocomposite toward different concentrations of NH3 (10–50 ppm of NH3) recorded at 22 ± 1 °C are shown in Figure 8b. The sensor response increases fast (the response time is 50 s, i.e., 40% faster than for WO3 at 100 °C), gradually approaches a steady state upon exposure to NH3, and recovers its initial baseline in 70 s (similar to the WO3 tested at 100 °C). The WO3/PPy nanocomposite sensors have an enhanced response to NH3 compared to its constituent materials, which we believe to be due to the synergistic effects, i.e., increased surface area, including film thickness and porosity, metal oxide–polypyrrole ratio, p–n heterojunction formation, and specific gas interactions inherent to the hybrid nanocomposite material. While factors such as film thickness and porosity contribute to sensitivity and response time [43,44], the interplay between metal oxide and polypyrrole in determining these characteristics requires further exploration in our future studies.
The responses of the WO3/PPy show a clear linear relationship with the increase of NH3 concentration, as can be seen in Figure 9a. This robust correlation underscores the sensitivity of the sensor and its reliable detection capabilities across varying concentrations of ammonia.
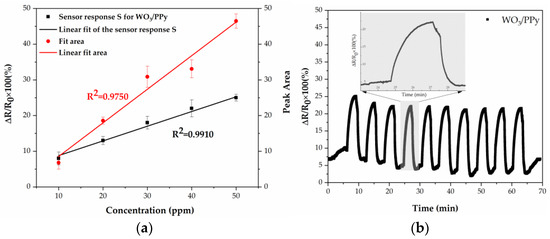
Figure 9.
(a) Concentration-response and concentration-peak area relationships of the WO3/PPy nanocomposite layer. (b) Repeatability of the WO3/PPy nanocomposite sensor when exposed to 10 consecutive cycles of ammonia (30 ppm). Inset: magnification of one of the sensor-response peaks.
Moreover, the repeatability of the WO3/PPy gas sensor’s measurements, when exposed to the same concentration of ammonia for a few cycles, has significant importance in gas sensing, as it characterizes the sensor’s capability to consistently yield the same results when subjected to identical conditions repeatedly. This aspect is crucial in assessing the overall reliability of the sensor as well as its suitability for real-world applications. In the present study, the WO3/PPy nanocomposite, synthesized using laser-based methods, undergoes thorough evaluation across 10 consecutive cycles, as depicted in Figure 10b. The findings demonstrate remarkably stable fluctuation values when exposed to 30 ppm NH3 for successive cycles, with smooth transitions between nitrogen and ammonia gas. Thus, the WO3/PPy sensor maintains its performance without significant degradation, contributing to long-term reliability.
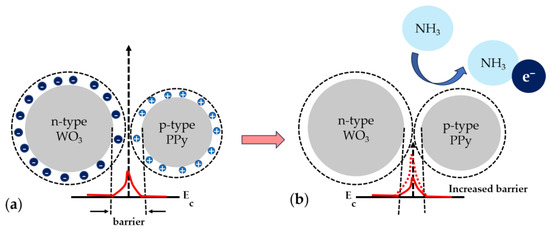
Figure 10.
Gas-sensing mechanism for the WO3/PPy nanocomposite (a) in air and (b) when exposed to NH3. Ec denotes the energy of the conduction band.
The investigations presented in the paper demonstrate that the WO3/PPy sensor has better sensing performance, i.e., high response magnitude and repeatability towards 10–50 ppm concentrations of NH3 than the sensors based on PPy or WO3 alone. Further on, we focus on trying to provide a sensing mechanism responsible for this enhanced functionality. PPy alone is a p-type semiconductor, with holes in the majority of charge carriers. In contrast, WO3 is an n-type semiconductor, with electrons as the majority carriers, that does not show an electrical response to NH3 at room temperature. Thus, the combination of p-type and n-type behaviour in the WO3/PPy nanocomposite gives rise to the formation of p–n heterojunctions. This sensing mechanism has been observed previously in [45,46,47] for polyaniline-SnO2 nanocomposites, PPy-ZnO, or PPY-SnO2 nanocomposites, etc., where a greater number of p–n heterojunctions correspond to higher sensor efficiency in the composites. Similarly, in our work, if we apply the principle of p–n junction formation, we can say that the electron flow from n-WO3 to p–PPy saturates the holes until equilibrium is reached, elevating the Fermi level and equalizing it in both the n and p regions. Additionally, there is a minor electron flow in the reverse direction, i.e., from PPy to WO3. This mutual interaction results in charge separation, generating p–n heterojunctions in the PPY–WO3 nanocomposite. The p–n heterojunctions formed in the PPY-WO3 system could enhance the depletion-barrier height, consequently improving the sensor response, as observed previously, in similar systems [45,46,47,48]. The gas-sensing mechanism of the laser-processed sensing layers is shown in Figure 10. Although we can state that sensing layers fabricated by PLD and MAPLE can be suitable sensing layers in resistor sensors able to detect ammonia gas in the atmosphere at room temperature, additional studies are needed in order to obtain a deep understanding of the enhanced response of the nanocomposites. In addition, our future studies will also focus on the selectivity of the nanocomposite sensors.
Finally, in Table 1, a few performance characteristics of the WO3/PPy nanocomposite sensors developed in this work are presented in comparison with reports from the literature.

Table 1.
Performance comparison of the WO3, PPy, and WO3/PPy nanocomposite sensor developed in this work with reports in the literature.
4. Conclusions
Laser-based methods have been applied to synthesize tungsten oxide–polypyrrole nanocomposites. Following the XRD analysis, the WO3/PPy nanocomposite was assumed to retain WO3 crystalline characteristics. FTIR and Raman spectra of WO3/PPy were examined. FTIR bands confirmed a successful combination of PPy and WO3. Raman spectra exhibited characteristic peaks of both PPy and WO3, indicating no chemical damage from laser processing. Contact-angle measurements were performed to assess surface wettability. WO3 and PPy surfaces were hydrophilic, while the WO3/PPy nanocomposite surface showed moderate hydrophobicity, which is advantageous for designing ammonia-gas sensors. SEM and AFM images revealed the micro–nano structures of WO3, PPy, and WO3/PPy layers. WO3 exhibited a mesoporous appearance with intricate networks. PPy showed a granular structure, indicating its semicrystalline nature, while the WO3/PPy nanocomposite combined the features of both materials. The gas-sensing characteristics were evaluated for PPy, WO3, and WO3/PPy sensors toward ammonia gas. PPy demonstrated a p-type semiconductor response, while WO3 showed an n-type semiconductor response at 100 ± 1 °C. The WO3/PPy nanocomposite exhibited enhanced response and repeatability compared to individual components. The sensor showed a linear relationship with increasing ammonia concentration, emphasizing its sensitivity and reliable detection capabilities across cycles.
In summary, the study demonstrated the successful synthesis and characterization of WO3/PPy nanocomposites, showcasing their potential for efficient gas-sensing applications, particularly in detecting ammonia.
Supplementary Materials
The following supporting information can be downloaded at: https://www.mdpi.com/article/10.3390/polym16010079/s1, Figure S1: Sketch of the sensor testing setup. MFC = mass-flow controller; SLM = standard litre per minute; SCCM = standard cubic centimetre per minute. Figure S2: (a) Raman spectra of WO3 sensing layer obtained by PLD. (b) Raman spectra of a PPy sensing layer obtained by MAPLE. Table S1: Contact-angle measurements carried out on the active layers obtained by laser methods.
Author Contributions
Conceptualization, M.F.; methodology, M.F., A.I.B., V.M., A.F.B., S.B., S.D. and A.P.-P.; validation, M.F. and A.P.-P.; formal analysis, A.I.B., V.M., A.F.B., M.F., S.B., S.D. and A.P.-P.; investigation, V.M., A.I.B., S.B., A.F.B., A.P.-P. and M.F.; resources, M.F.; data curation, M.F., A.I.B., V.M., A.F.B., S.B., S.D. and A.P.-P.; writing—original draft preparation, A.P.-P., A.I.B., V.M. and M.F.; writing—review and editing, A.P.-P. and M.F.; visualization, A.I.B., V.M., A.F.B., M.F., S.B., S.D. and A.P.-P.; supervision, M.F.; project administration, M.F.; funding acquisition, M.F. All authors have read and agreed to the published version of the manuscript.
Funding
This work was supported by a grant from the Ministry of Research, Innovation, and Digitization, CNCS–UEFISCDI, project number PN-III-P1-1.1-TE-2021-0219 (CO-POLYSENS), within PNCDI III.
Institutional Review Board Statement
Not applicable.
Data Availability Statement
The data used to support the findings of this study are available from the corresponding author upon request.
Conflicts of Interest
The authors declare no conflict of interest.
References
- Palla-Papavlu, A.; Vizireanu, S.; Filipescu, M.; Lippert, T. High-Sensitivity Ammonia Sensors with Carbon Nanowall Active Material via Laser-Induced Transfer. Nanomaterials 2022, 12, 2830. [Google Scholar] [CrossRef] [PubMed]
- Paul, J.; Philip, J. Development of an ammonia gas sensor employing an inter-digital capacitive structure coated with Mn0.5Zn0.5Fe2O4 nano-composite. Mater. Today Proc. 2022, 49, 1331–1336. [Google Scholar] [CrossRef]
- Palla-Papavlu, A.; Voicu, S.I.; Dinescu, M. Sensitive Materials and Coating Technologies for Surface Acoustic Wave Sensors. Chemosensors 2021, 9, 105. [Google Scholar] [CrossRef]
- Raju, P.; Li, Q. Review—Semiconductor Materials and Devices for Gas Sensors. J. Electrochem. Soc. 2022, 169, 057518. [Google Scholar] [CrossRef]
- Büyükköse, S. Highly selective and sensitive WO3 nanoflakes based ammonia sensor. Mater. Sci. Semicond. Process. 2020, 110, 104969. [Google Scholar] [CrossRef]
- Punetha, D.; Pandey, S.K. Enhancement and Optimization in Sensing Characteristics of Ammonia Gas Sensor Based on Light Assisted Nanostructured WO3 Thin Film. IEEE Sens. J. 2020, 20, 14617–14623. [Google Scholar] [CrossRef]
- Leng, J.; Xu, X.; Lv, N.; Fan, H.; Zhang, T. Synthesis and gas-sensing characteristics of WO3 nanofibers via electrospinning. J. Colloid Interface Sci. 2011, 356, 54–57. [Google Scholar] [CrossRef]
- Palla-Papavlu, A.; Filipescu, M.; Schneider, C.W.; Antohe, S.; Ossi, P.M.; Radnóczi, G.; Dinescu, M.; Wokaun, A.; Lippert, T. Direct laser deposition of nanostructured tungsten oxide for sensing applications. J. Phys. D Appl. Phys. 2016, 49, 205101. [Google Scholar] [CrossRef]
- Janata, J.; Josowicz, M. Conducting polymers in electronic chemical sensors. Nat. Mater. 2003, 2, 19–24. [Google Scholar] [CrossRef]
- Wong, Y.C.; Ang, B.C.; Haseeb, A.S.M.A.; Baharuddin, A.A.; Wong, Y.H. Review—Conducting Polymers as Chemiresistive Gas Sensing Materials: A Review. J. Electrochem. Soc. 2019, 167, 037503. [Google Scholar] [CrossRef]
- Tanguy, N.R.; Thompson, M.; Yan, N. A review on advances in application of polyaniline for ammonia detection. Sens. Actuators B Chem. 2018, 257, 1044–1064. [Google Scholar] [CrossRef]
- Das, M.; Roy, S. Polypyrrole and associated hybrid nanocomposites as chemiresistive gas sensors: A comprehensive review. Mater. Sci. Semicond. Process. 2021, 121, 105332. [Google Scholar] [CrossRef]
- Duan, X.; Duan, Z.; Zhang, Y.; Liu, B.; Li, X.; Zhao, Q.; Yuan, Z.; Jiang, Y.; Tai, H. Enhanced NH3 sensing performance of polyaniline via a facile morphology modification strategy. Sens. Actuators B Chem. 2022, 369, 132302. [Google Scholar] [CrossRef]
- Wang, L.; Huang, H.; Xiao, S.; Cai, D.; Liu, Y.; Liu, B.; Wang, D.; Wang, C.; Li, H.; Wang, Y.; et al. Enhanced Sensitivity and Stability of Room-Temperature NH3 Sensors Using Core–Shell CeO2 Nanoparticles@Cross-linked PANI with p–n Heterojunctions. ACS Appl. Mater. Interfaces 2014, 6, 14131–14140. [Google Scholar] [CrossRef] [PubMed]
- Sun, S.; Xu, Y.; Maimaitiyiming, X. 3D printed carbon nanotube/polyaniline/gelatin flexible NH3, stress, strain, temperature multifunctional sensor. React. Funct. Polym. 2023, 190, 105625. [Google Scholar] [CrossRef]
- Wang, X.; Zhang, D.; Zhang, H.; Gong, L.; Yang, Y.; Zhao, W.; Yu, S.; Yin, Y.; Sun, D. In situ polymerized polyaniline/MXene (V2C) as building blocks of supercapacitor and ammonia sensor self-powered by electromagnetic-triboelectric hybrid generator. Nano Energy 2021, 88, 106242. [Google Scholar] [CrossRef]
- Le, T.-H.; Kim, Y.; Yoon, H. Electrical and Electrochemical Properties of Conducting Polymers. Polymers 2017, 9, 150. [Google Scholar] [CrossRef] [PubMed]
- Verma, A.; Gupta, R.; Verma, A.S.; Kumar, T. A review of composite conducting polymer-based sensors for detection of industrial waste gases. Sens. Actuators Rep. 2023, 5, 100143. [Google Scholar] [CrossRef]
- Mane, A.T.; Navale, S.T.; Sen, S.; Aswal, D.K.; Gupta, S.K.; Patil, V.B. Nitrogen dioxide (NO2) sensing performance of p-polypyrrole/n-tungsten oxide hybrid nanocomposites at room temperature. Org. Electron. 2015, 16, 195–204. [Google Scholar] [CrossRef]
- Geng, L.; Huang, X.; Zhao, Y.; Li, P.; Wang, S.; Zhang, S.; Wu, S. H2S sensitivity study of polypyrrole/WO3 materials. Solid State Electron. 2006, 50, 723–726. [Google Scholar] [CrossRef]
- Alizadeh, N.; Amiri, M.; Mohammadpour, F.; Norouzi, P. Detection of acetone in the human breath as diabetes biomarker based on PPy/WO3 nanocomposite sensor by FFT continuous cyclic voltammetry method. Electroanalysis 2023, 35, e202300114. [Google Scholar] [CrossRef]
- Sun, J.; Shu, X.; Tian, Y.; Tong, Z.; Bai, S.; Luo, R.; Li, D.; Chen, A. Preparation of polypyrrole@WO3 hybrids with p-n heterojunction and sensing performance to triethylamine at room temperature. Sens. Actuators B Chem. 2017, 238, 510–517. [Google Scholar] [CrossRef]
- Albaris, H.; Karuppasamy, G. Investigation of NH3 gas sensing behavior of intercalated PPy–GO–WO3 hybrid nanocomposite at room temperature. Mater. Sci. Eng. B 2020, 257, 114558. [Google Scholar] [CrossRef]
- Husain, A.; Shariq, M.U. Polypyrrole nanocomposites as promising gas/vapour sensing materials: Past, present and future prospects. Sens. Actuators A Phys. 2023, 359, 114504. [Google Scholar] [CrossRef]
- Shepelin, N.A.; Tehrani, Z.P.; Ohannessian, N.; Schneider, C.W.; Pergolesi, D.; Lippert, T. A practical guide to pulsed laser deposition. Chem. Soc. Rev. 2023, 52, 2294–2321. [Google Scholar] [CrossRef] [PubMed]
- Stiff-Roberts, A.D.; Ge, W. Organic/hybrid thin films deposited by matrix-assisted pulsed laser evaporation (MAPLE). App. Phys. Rev. 2017, 4, 41303. [Google Scholar] [CrossRef]
- Craciun, C.; Andrei, F.; Bonciu, A.; Brajnicov, S.; Tozar, T.; Filipescu, M.; Palla-Papavlu, A.; Dinescu, M. Nitrites Detection with Sensors Processed via Matrix-Assisted Pulsed Laser Evaporation. Nanomaterials 2022, 12, 1138. [Google Scholar] [CrossRef]
- Zhang, D.; Wu, Z.; Zong, X.; Zhang, Y. Fabrication of polypyrrole/Zn2SnO4 nanofilm for ultra-highly sensitive ammonia sensing application. Sens. Actuators B Chem. 2018, 274, 575–586. [Google Scholar] [CrossRef]
- Grier, D.; McCarthy, G. ICDD Grant-in-Aid; North Dakota State University: Fargo, ND, USA, 1991. [Google Scholar]
- Araiza, J.d.J.; Álvarez-Fraga, L.; Gago, R.; Sánchez, O. Surface Morphology and Optical Properties of Hafnium Oxide Thin Films Produced by Magnetron Sputtering. Materials 2023, 16, 5331. [Google Scholar] [CrossRef]
- Gupta, R.; Pancholi, K.; De Sa, R.; Murray, D.; Huo, D.; Droubi, G.; White, M.; Njuguna, J. Effect of Oleic Acid Coating of Iron Oxide Nanoparticles on Properties of Magnetic Polyamide-6 Nanocomposite. JOM 2019, 71, 3119–3128. [Google Scholar] [CrossRef]
- Theerthagiri, J.; Karuppasamy, K.; Lee, S.J.; Shwetharani, R.; Kim, H.-S.; Pasha, S.K.K.; Ashokkumar, M.; Choi, M.Y. Fundamentals and comprehensive insights on pulsed laser synthesis of advanced materials for diverse photo- and electrocatalytic applications. Light Sci. Appl. 2022, 11, 250. [Google Scholar] [CrossRef] [PubMed]
- Nikov, R.G.; Dikovska, A.O.; Nedyalkov, N.N.; Atanasov, P.A.; Atanasova, G.; Hirsch, D.; Rauschenbach, B. ZnO nanostructures produced by pulsed laser deposition in open air. Appl. Phys. A 2017, 123, 657. [Google Scholar] [CrossRef]
- Atanasova, G.; Dikovska, A.O.; Dilova, T.; Georgieva, B.; Avdeev, G.V.; Stefanov, P.; Nedyalkov, N.N. Metal-oxide nanostructures produced by PLD in open air for gas sensor applications. Appl. Surf. Sci. 2019, 470, 861–869. [Google Scholar] [CrossRef]
- Lu, F.; Liu, Y.; Dong, M.; Wang, X. Nanosized tin oxide as the novel material with simultaneous detection towards CO, H2 and CH4. Sens. Actuators B Chem. 2000, 66, 225–227. [Google Scholar] [CrossRef]
- Lei, J.; Martin, C.R. Infrared investigations of pristine polypyrrole—Is the polymer called polypyrrole really poly(pyrrole-co-hydroxypyrrole)? Synth. Met. 1992, 48, 331–336. [Google Scholar] [CrossRef]
- Taylor, T.A.; Patterson, H.H. Spectroscopic Properties of WO3 Thin Films: Polarized FT-IR/ATR, X-ray Diffraction, and Electronic Absorption. Appl. Spectrosc. 1994, 48, 674–677. [Google Scholar] [CrossRef]
- Fan, X.; Yang, Z.; He, N. Hierarchical nanostructured polypyrrole/graphene composites as supercapacitor electrode. RSC Adv. 2015, 5, 15096–15102. [Google Scholar] [CrossRef]
- Daniel, M.F.; Desbat, B.; Lassegues, J.C.; Gerand, B.; Figlarz, M. Infrared and Raman study of WO3 tungsten trioxides and WO3, xH2O tungsten trioxide tydrates. J. Solid State Chem. 1987, 67, 235–247. [Google Scholar] [CrossRef]
- Chen, Z.; Tao, Q.; Zhao, X.; Tu, Y.; Yang, X. Semi-Crystalline Polypyrrole with Enhanced Electrochemical Properties Enabled by Air–Water Interface Confined Polymerization. Macromol. Chem. Phys. 2022, 223, 2200026. [Google Scholar] [CrossRef]
- Šetka, M.; Drbohlavová, J.; Hubálek, J. Nanostructured Polypyrrole-Based Ammonia and Volatile Organic Compound Sensors. Sensors 2017, 17, 562. [Google Scholar] [CrossRef]
- Ly, A.; Luo, Y.; Cavaillès, G.; Olivier, M.-G.; Debliquy, M.; Lahem, D. Ammonia Sensor Based on Vapor Phase Polymerized Polypyrrole. Chemosensors 2020, 8, 38. [Google Scholar] [CrossRef]
- Sakai, G.; Matsunaga, N.; Shimanoe, K.; Yamazoe, N. Theory of gas-diffusion controlled sensitivity for thin film semiconductor gas sensor. Sens. Actuators B Chem. 2001, 80, 125–131. [Google Scholar] [CrossRef]
- Matsunaga, N.; Sakai, G.; Shimanoe, K.; Yamazoe, N. Formulation of gas diffusion dynamics for thin film semiconductor gas sensor based on simple reaction–diffusion equation. Sens. Actuators B Chem. 2003, 96, 226–233. [Google Scholar] [CrossRef]
- Li, Y.; Jiao, M.; Yang, M. In-situ grown nanostructured ZnO via a green approach and gas sensing properties of polypyrrole/ZnO nanohybrids. Sens. Actuators B Chem. 2017, 238, 596–604. [Google Scholar] [CrossRef]
- Li, Y.; Ban, H.; Yang, M. Highly sensitive NH3 gas sensors based on novel polypyrrole-coated SnO2 nanosheet nanocomposites. Sens. Actuators B Chem. 2016, 224, 449–457. [Google Scholar] [CrossRef]
- Tai, H.; Jiang, Y.; Xie, G.; Yu, J. Preparation, Characterization and Comparative NH3-sensing Characteristic Studies of PANI/inorganic Oxides Nanocomposite Thin Films. J. Mater. Sci. Technol. 2010, 26, 605–613. [Google Scholar] [CrossRef]
- Zhang, J.; Wang, S.; Xu, M.; Wang, Y.; Xia, H.; Zhang, S.; Guo, X.; Wu, S. Polypyrrole-Coated SnO2 Hollow Spheres and Their Application for Ammonia Sensor. J. Phys. Chem. C 2009, 113, 1662–1665. [Google Scholar] [CrossRef]
- Yavarinasab, A.; Janfaza, S.; Tahmooressi, H.; Ghazi, M.; Tasnim, N.; Hoorfar, M. A selective polypyrrole-based sub-ppm impedimetric sensor for the detection of dissolved hydrogen sulfide and ammonia in a mixture. J. Hazard. Mater. 2021, 416, 125892. [Google Scholar] [CrossRef]
- Jain, A.; Nabeel, A.N.; Bhagwat, S.; Kumar, R.; Sharma, S.; Kozak, D.; Hunjet, A.; Kumar, A.; Singh, R. Fabrication of polypyrrole gas sensor for detection of NH3 using an oxidizing agent and pyrrole combinations: Studies and characterizations. Heliyon 2023, 9, e17611. [Google Scholar] [CrossRef]
- Chougule, M.A.; Pawar, S.G.; Patil, S.L.; Raut, B.T.; Godse, P.R.; Sen, S.; Patil, V.B. Polypyrrole Thin Film: Room Temperature Ammonia Gas Sensor. IEEE Sens. J. 2011, 11, 2137–2141. [Google Scholar] [CrossRef]
- Su, P.-G.; Lee, C.-T.; Chou, C.-Y. Flexible NH3 sensors fabricated by in situ self-assembly of polypyrrole. Talanta 2009, 80, 763–769. [Google Scholar] [CrossRef] [PubMed]
- Nguyen, K.V.; Trung, B.H.; Tuan, C.V.; Sai, C.D.; Vu, T.D.; Trung, T.; Thai, G.H.; Giang, H.T.; Hien, H.T. Ammonia gas-sensing behavior of uniform nanostructured PPy film prepared by simple-straightforward in situ chemical vapor oxidation. Open Phys. 2023, 21, 20220232. [Google Scholar] [CrossRef]
- Wang, C.-Y.; Zhang, X.; Rong, Q.; Hou, N.-N.; Yu, H.-Q. Ammonia sensing by closely packed WO3 microspheres with oxygen vacancies. Chemosphere 2018, 204, 202–209. [Google Scholar] [CrossRef] [PubMed]
Disclaimer/Publisher’s Note: The statements, opinions and data contained in all publications are solely those of the individual author(s) and contributor(s) and not of MDPI and/or the editor(s). MDPI and/or the editor(s) disclaim responsibility for any injury to people or property resulting from any ideas, methods, instructions or products referred to in the content. |
© 2023 by the authors. Licensee MDPI, Basel, Switzerland. This article is an open access article distributed under the terms and conditions of the Creative Commons Attribution (CC BY) license (https://creativecommons.org/licenses/by/4.0/).