

Experimental and Numerical Investigation of Compressive Membrane Action in GFRP-Reinforced Concrete Slabs


Abstract
1. Introduction
- It can reduce the amount of reinforcement used in deck slabs [19,20,30,31,37]. Northern Ireland bridge design specifications [38] and Highways England design code CD 360 [39] recommend much lower reinforcement percentages (0.3%) than the traditionally required amount of steel for slabs that benefit from CMA.
- The designer can focus on the serviceability limit state requirements as the ultimate limit state is governed by CMA-induced concrete crushing failure. Therefore, for GFRP-reinforced slabs, explicit design for failure criteria is not necessary.
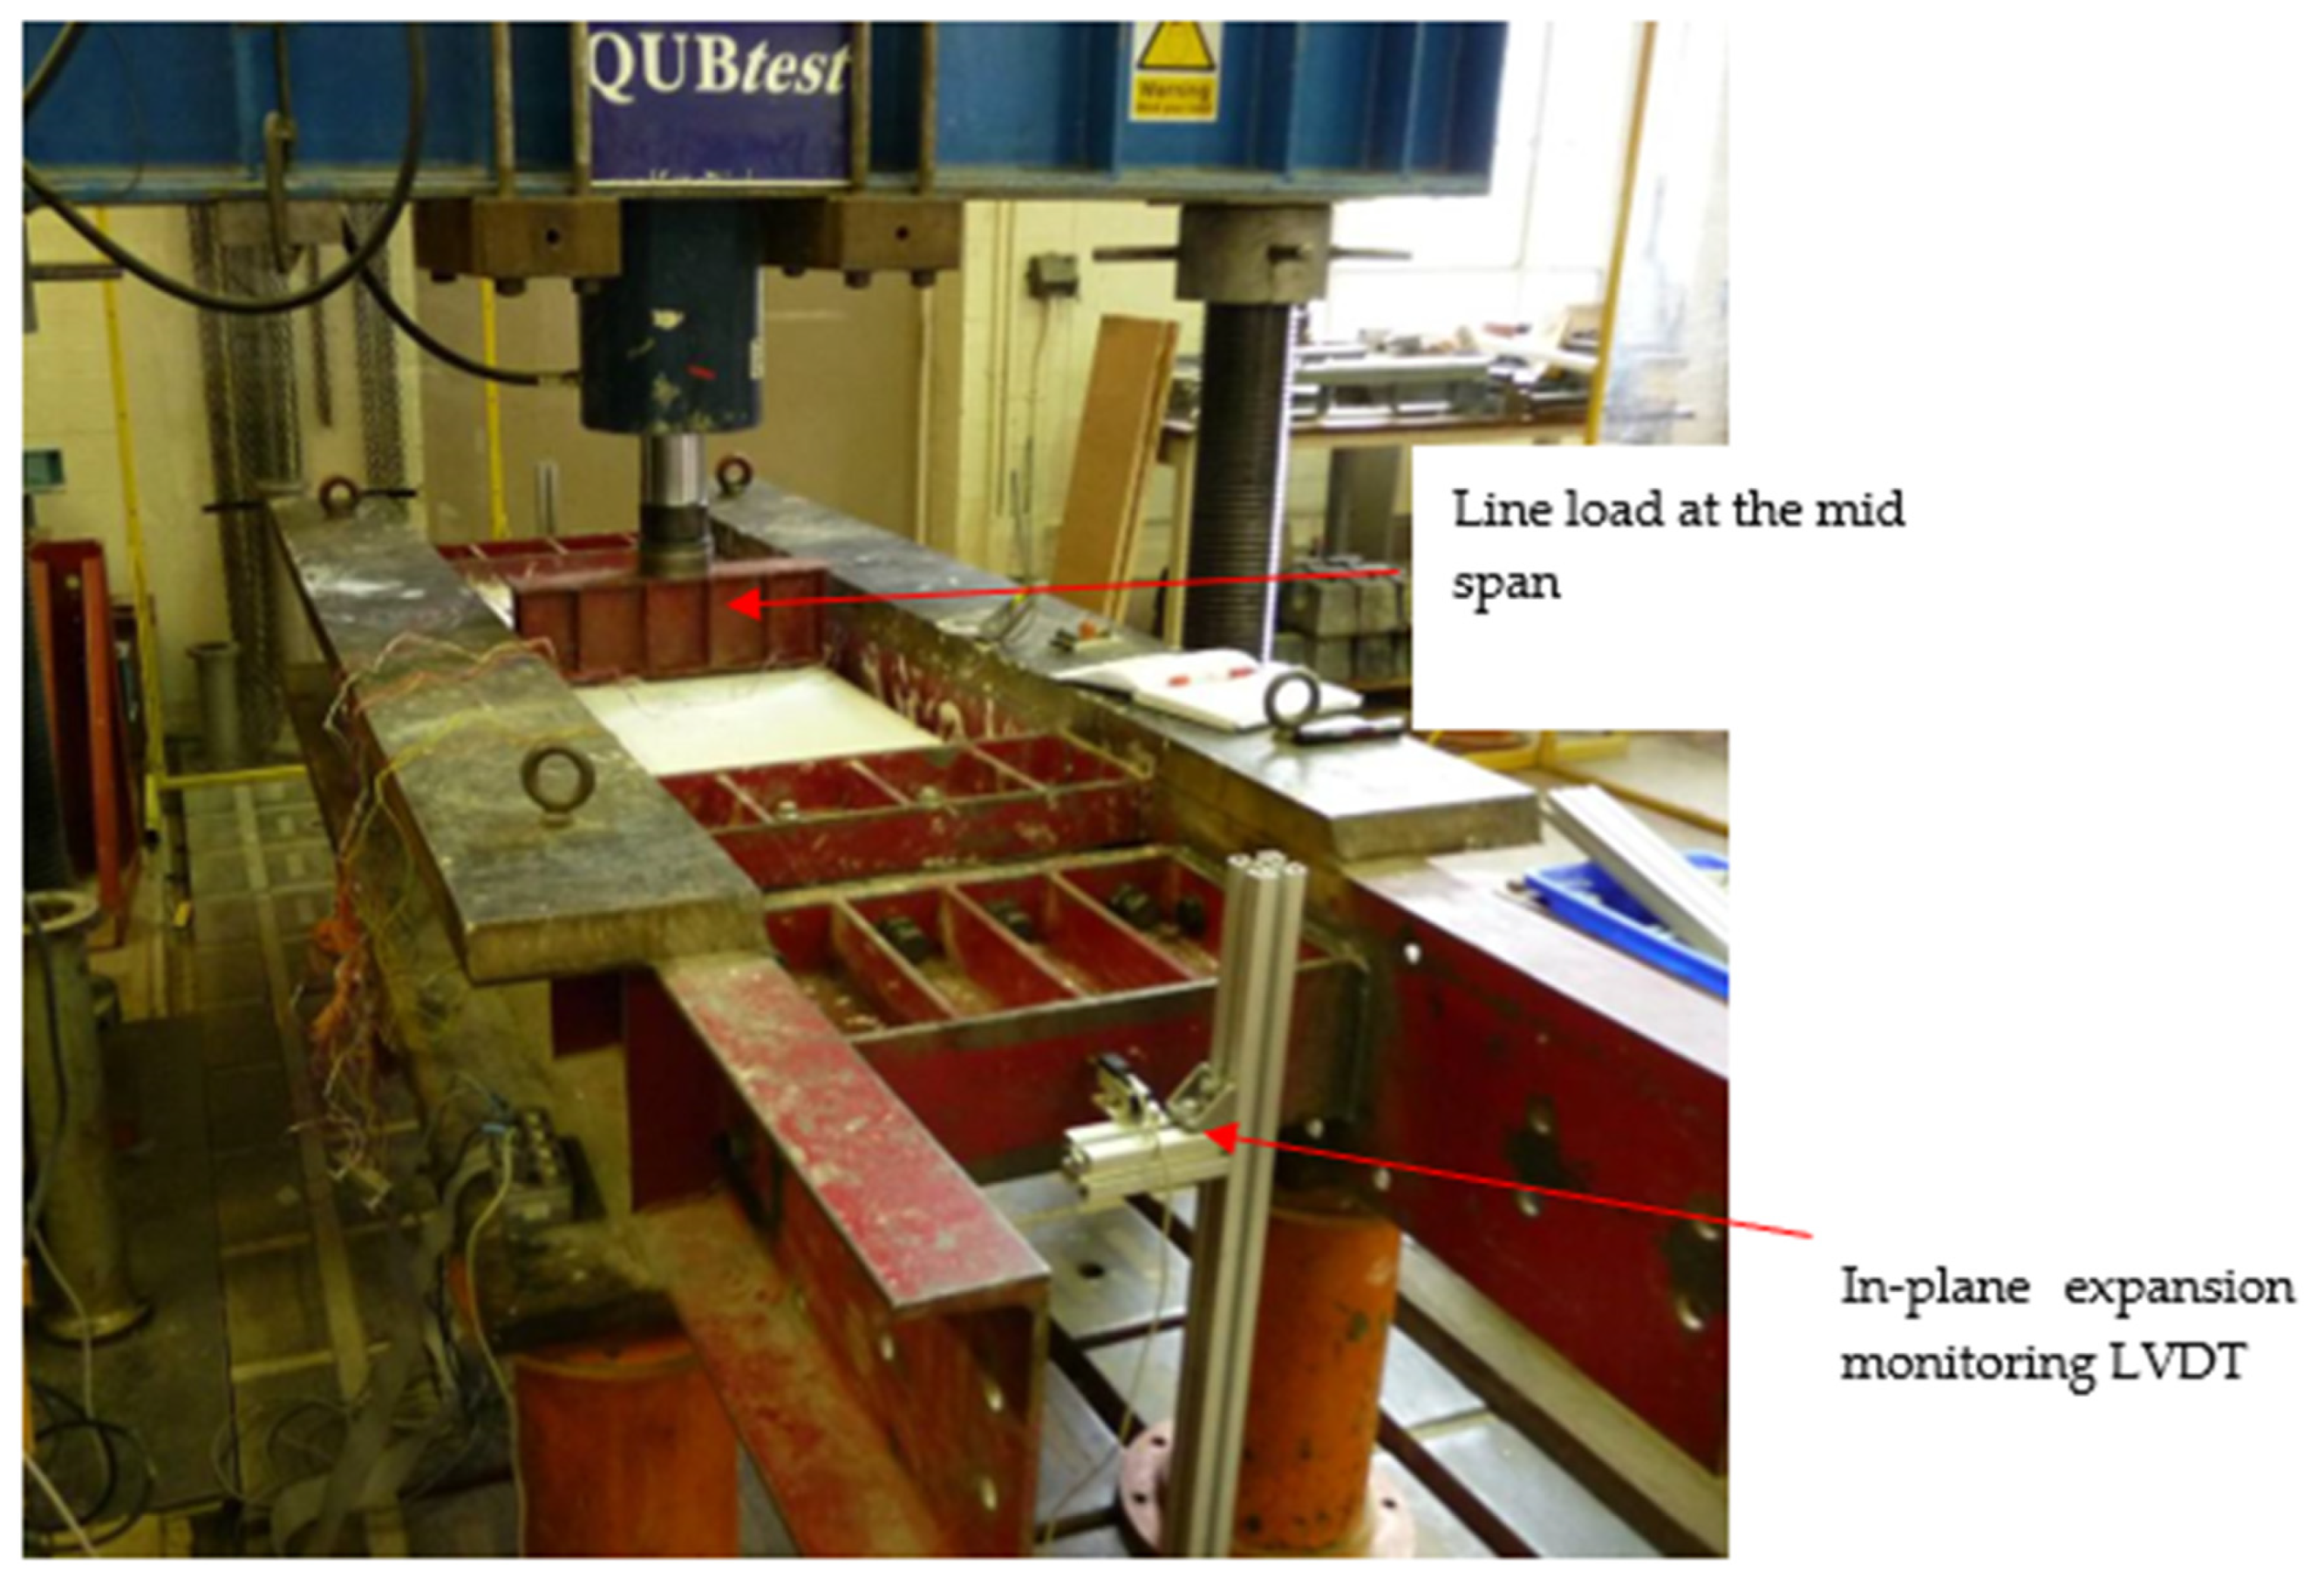
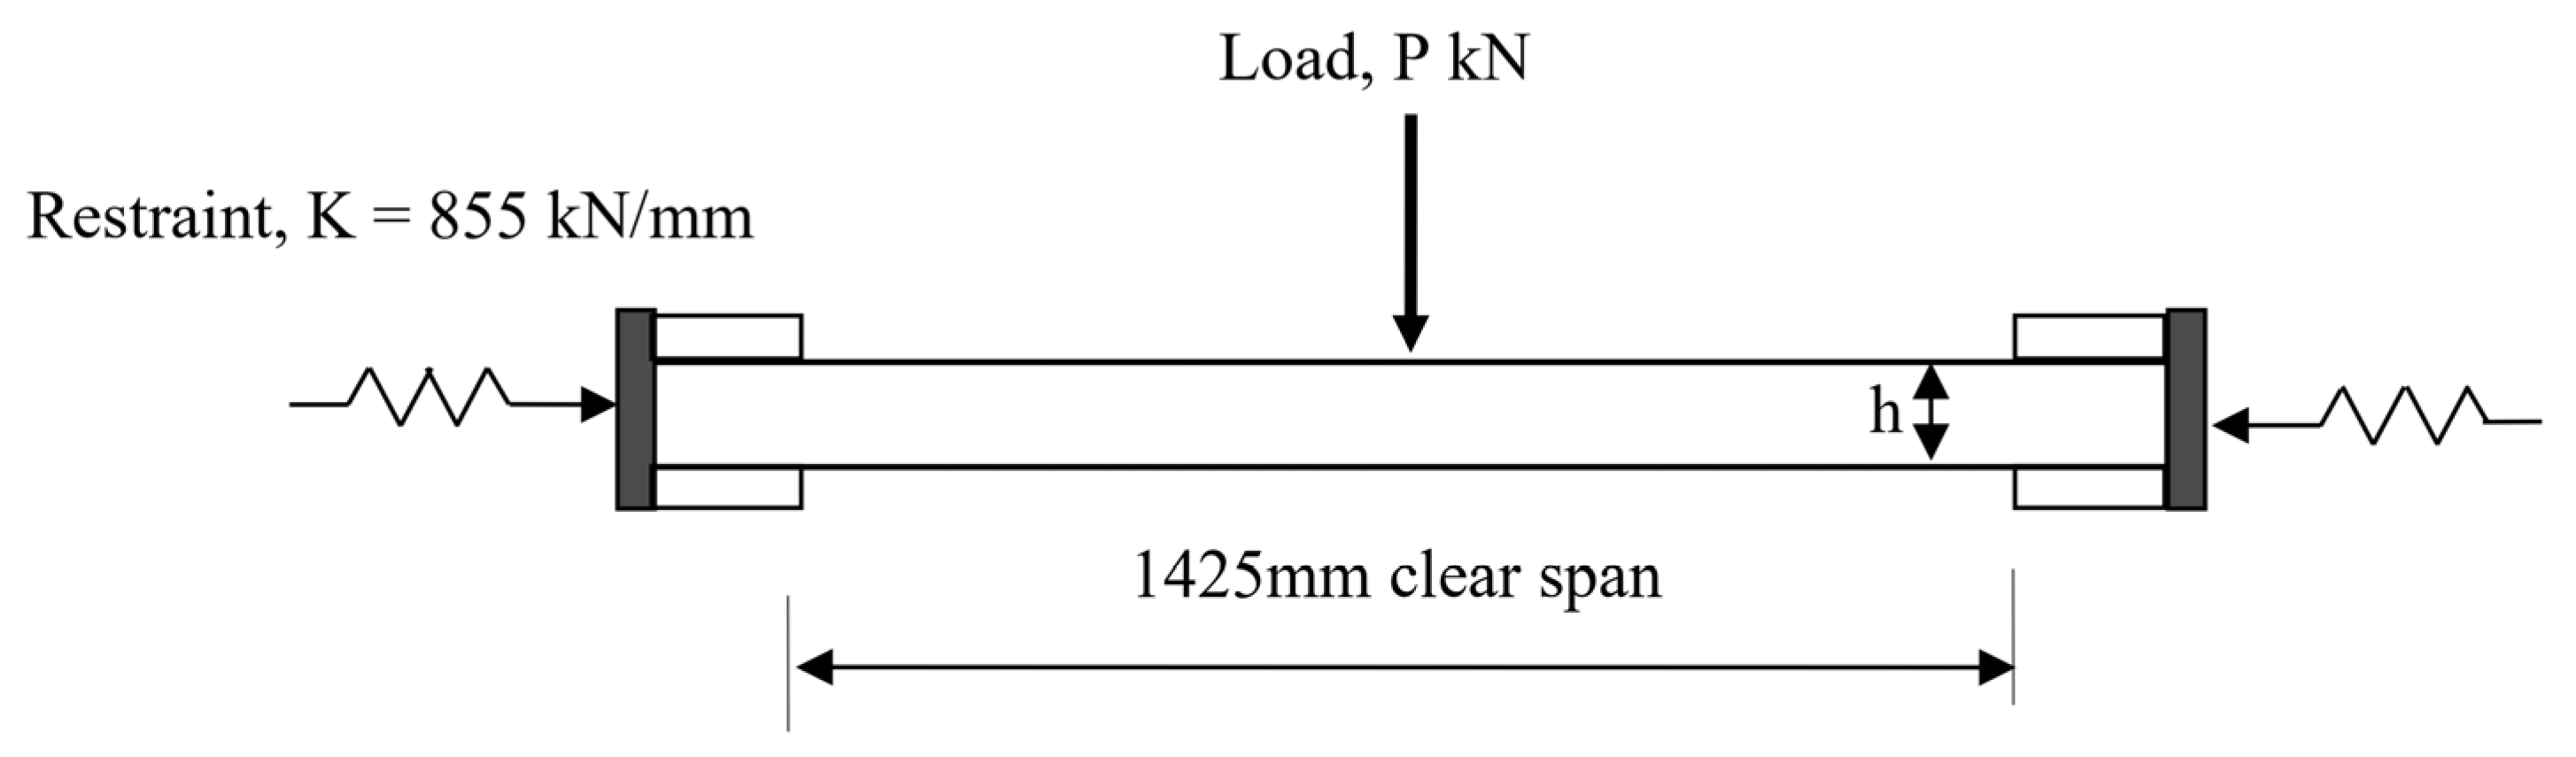
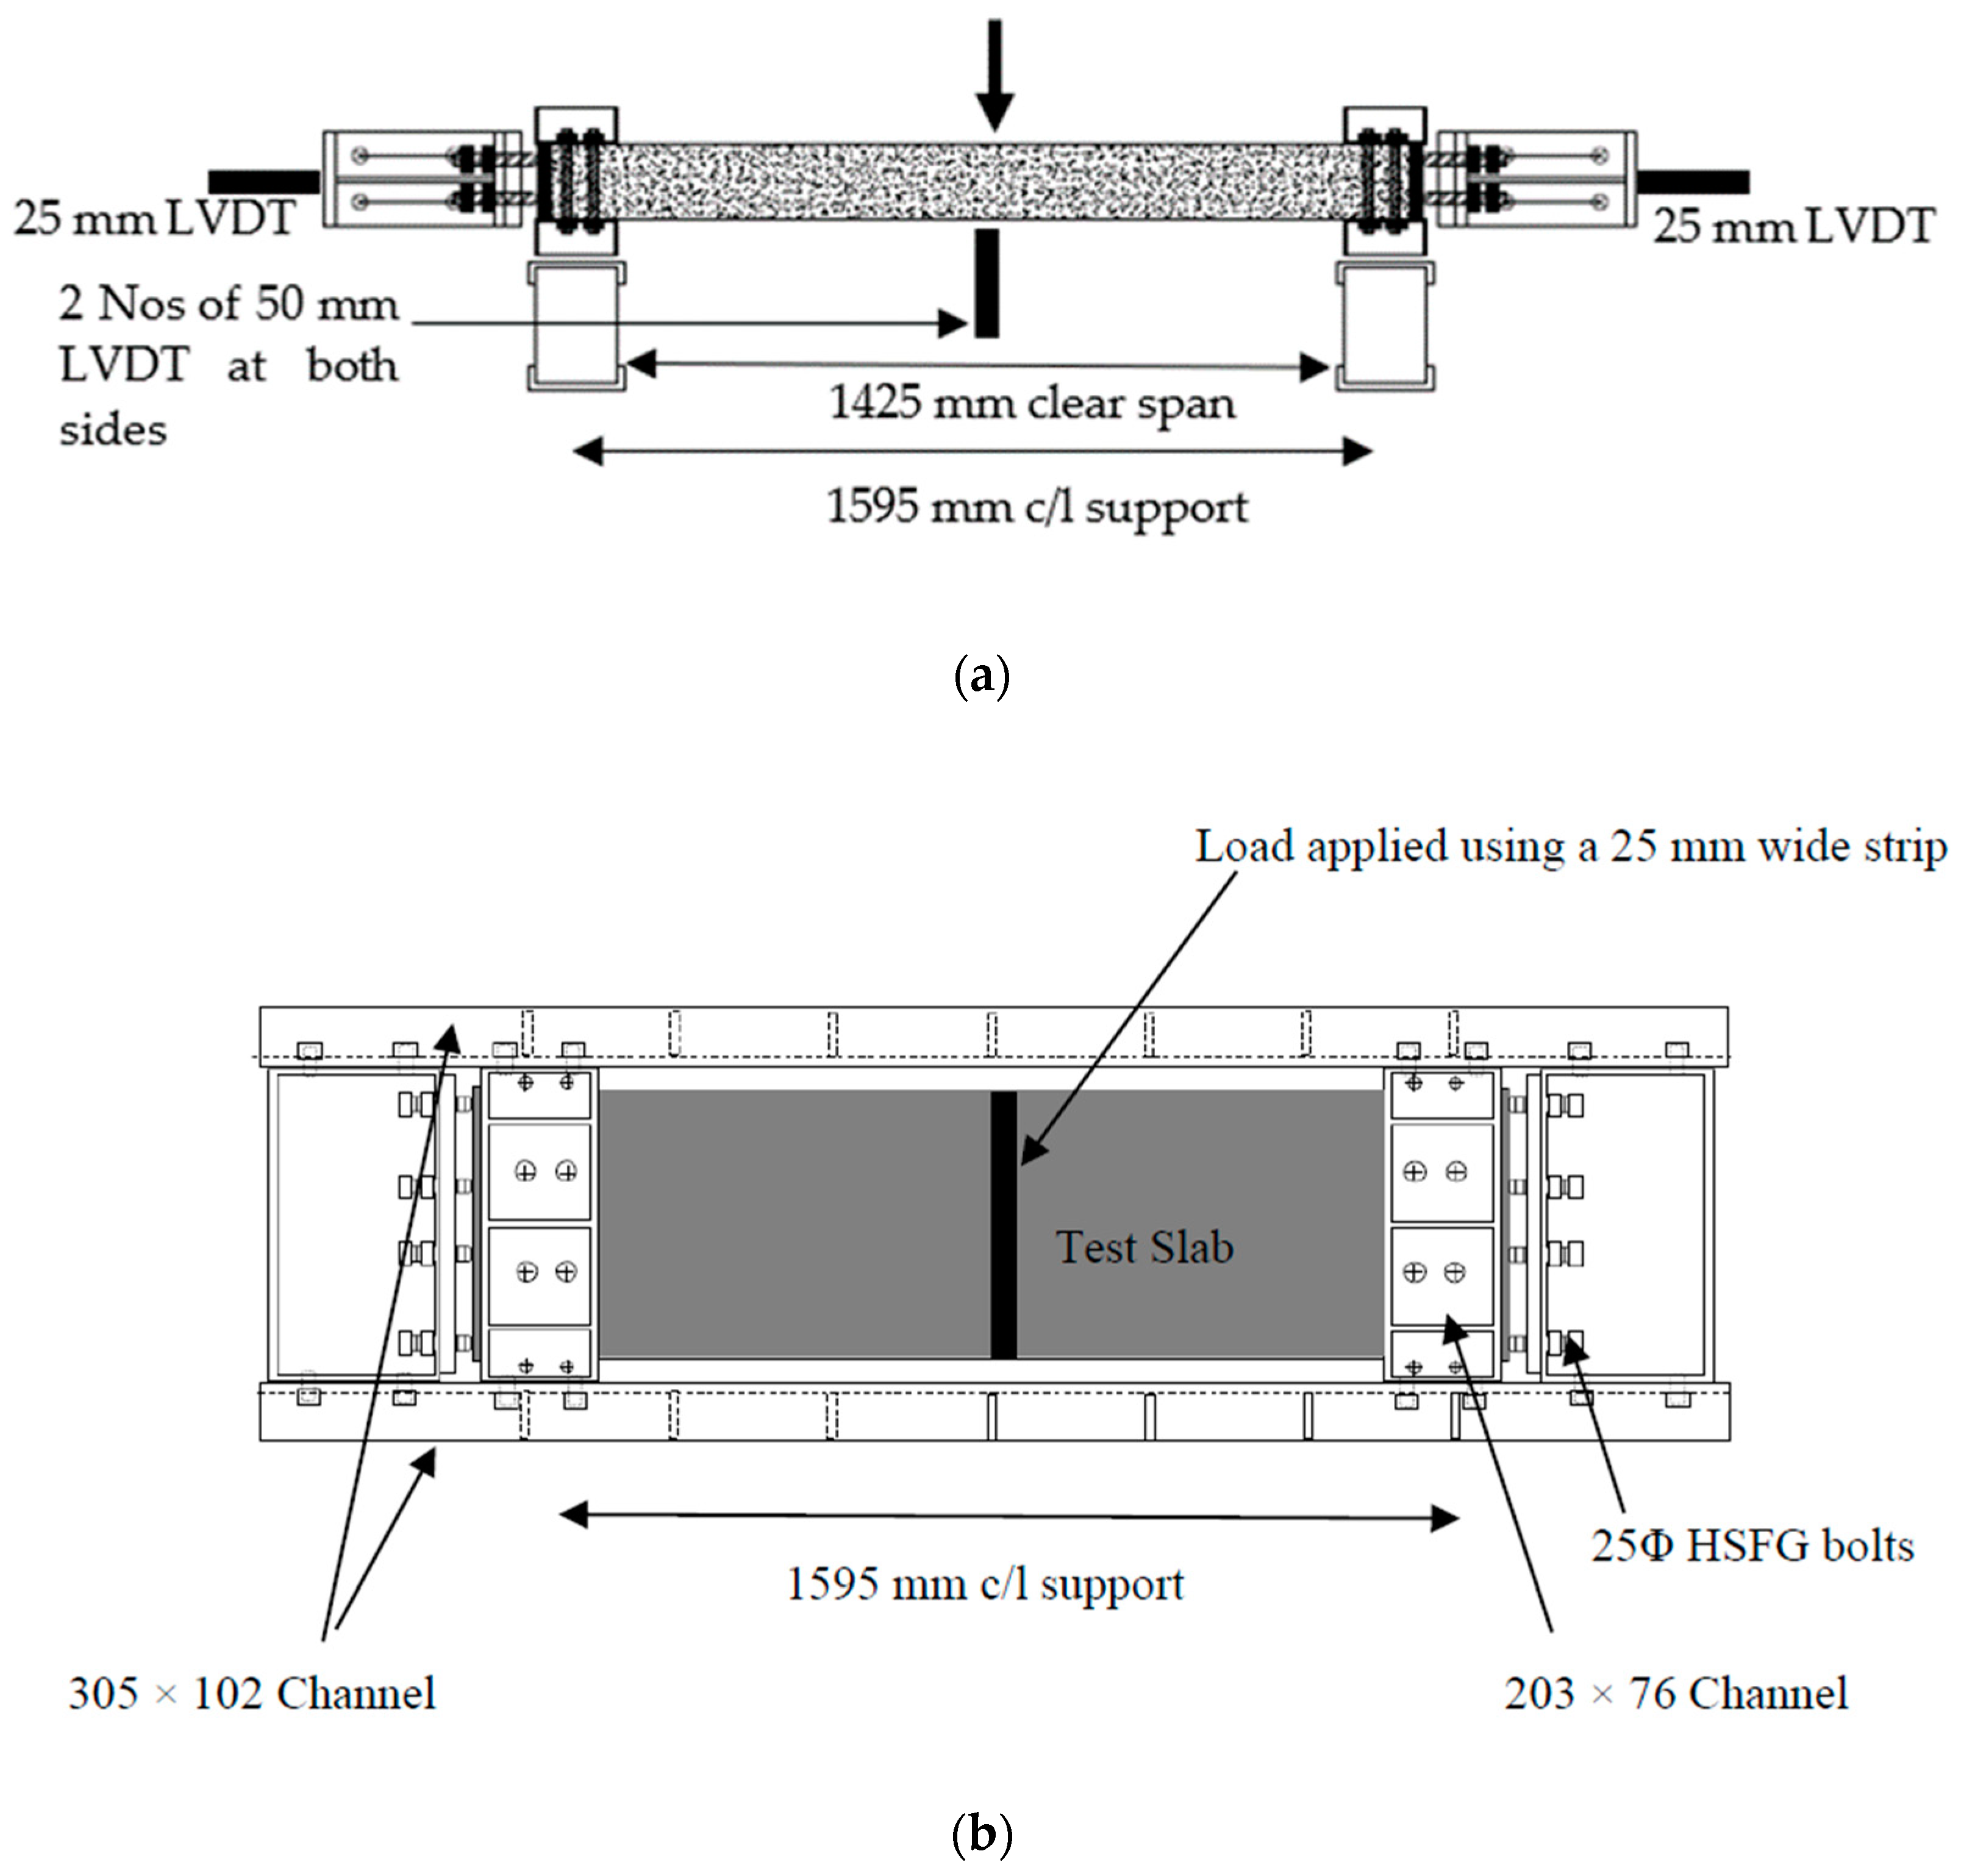
2. Experimental Investigation
Instrumentation and Testing
3. Results
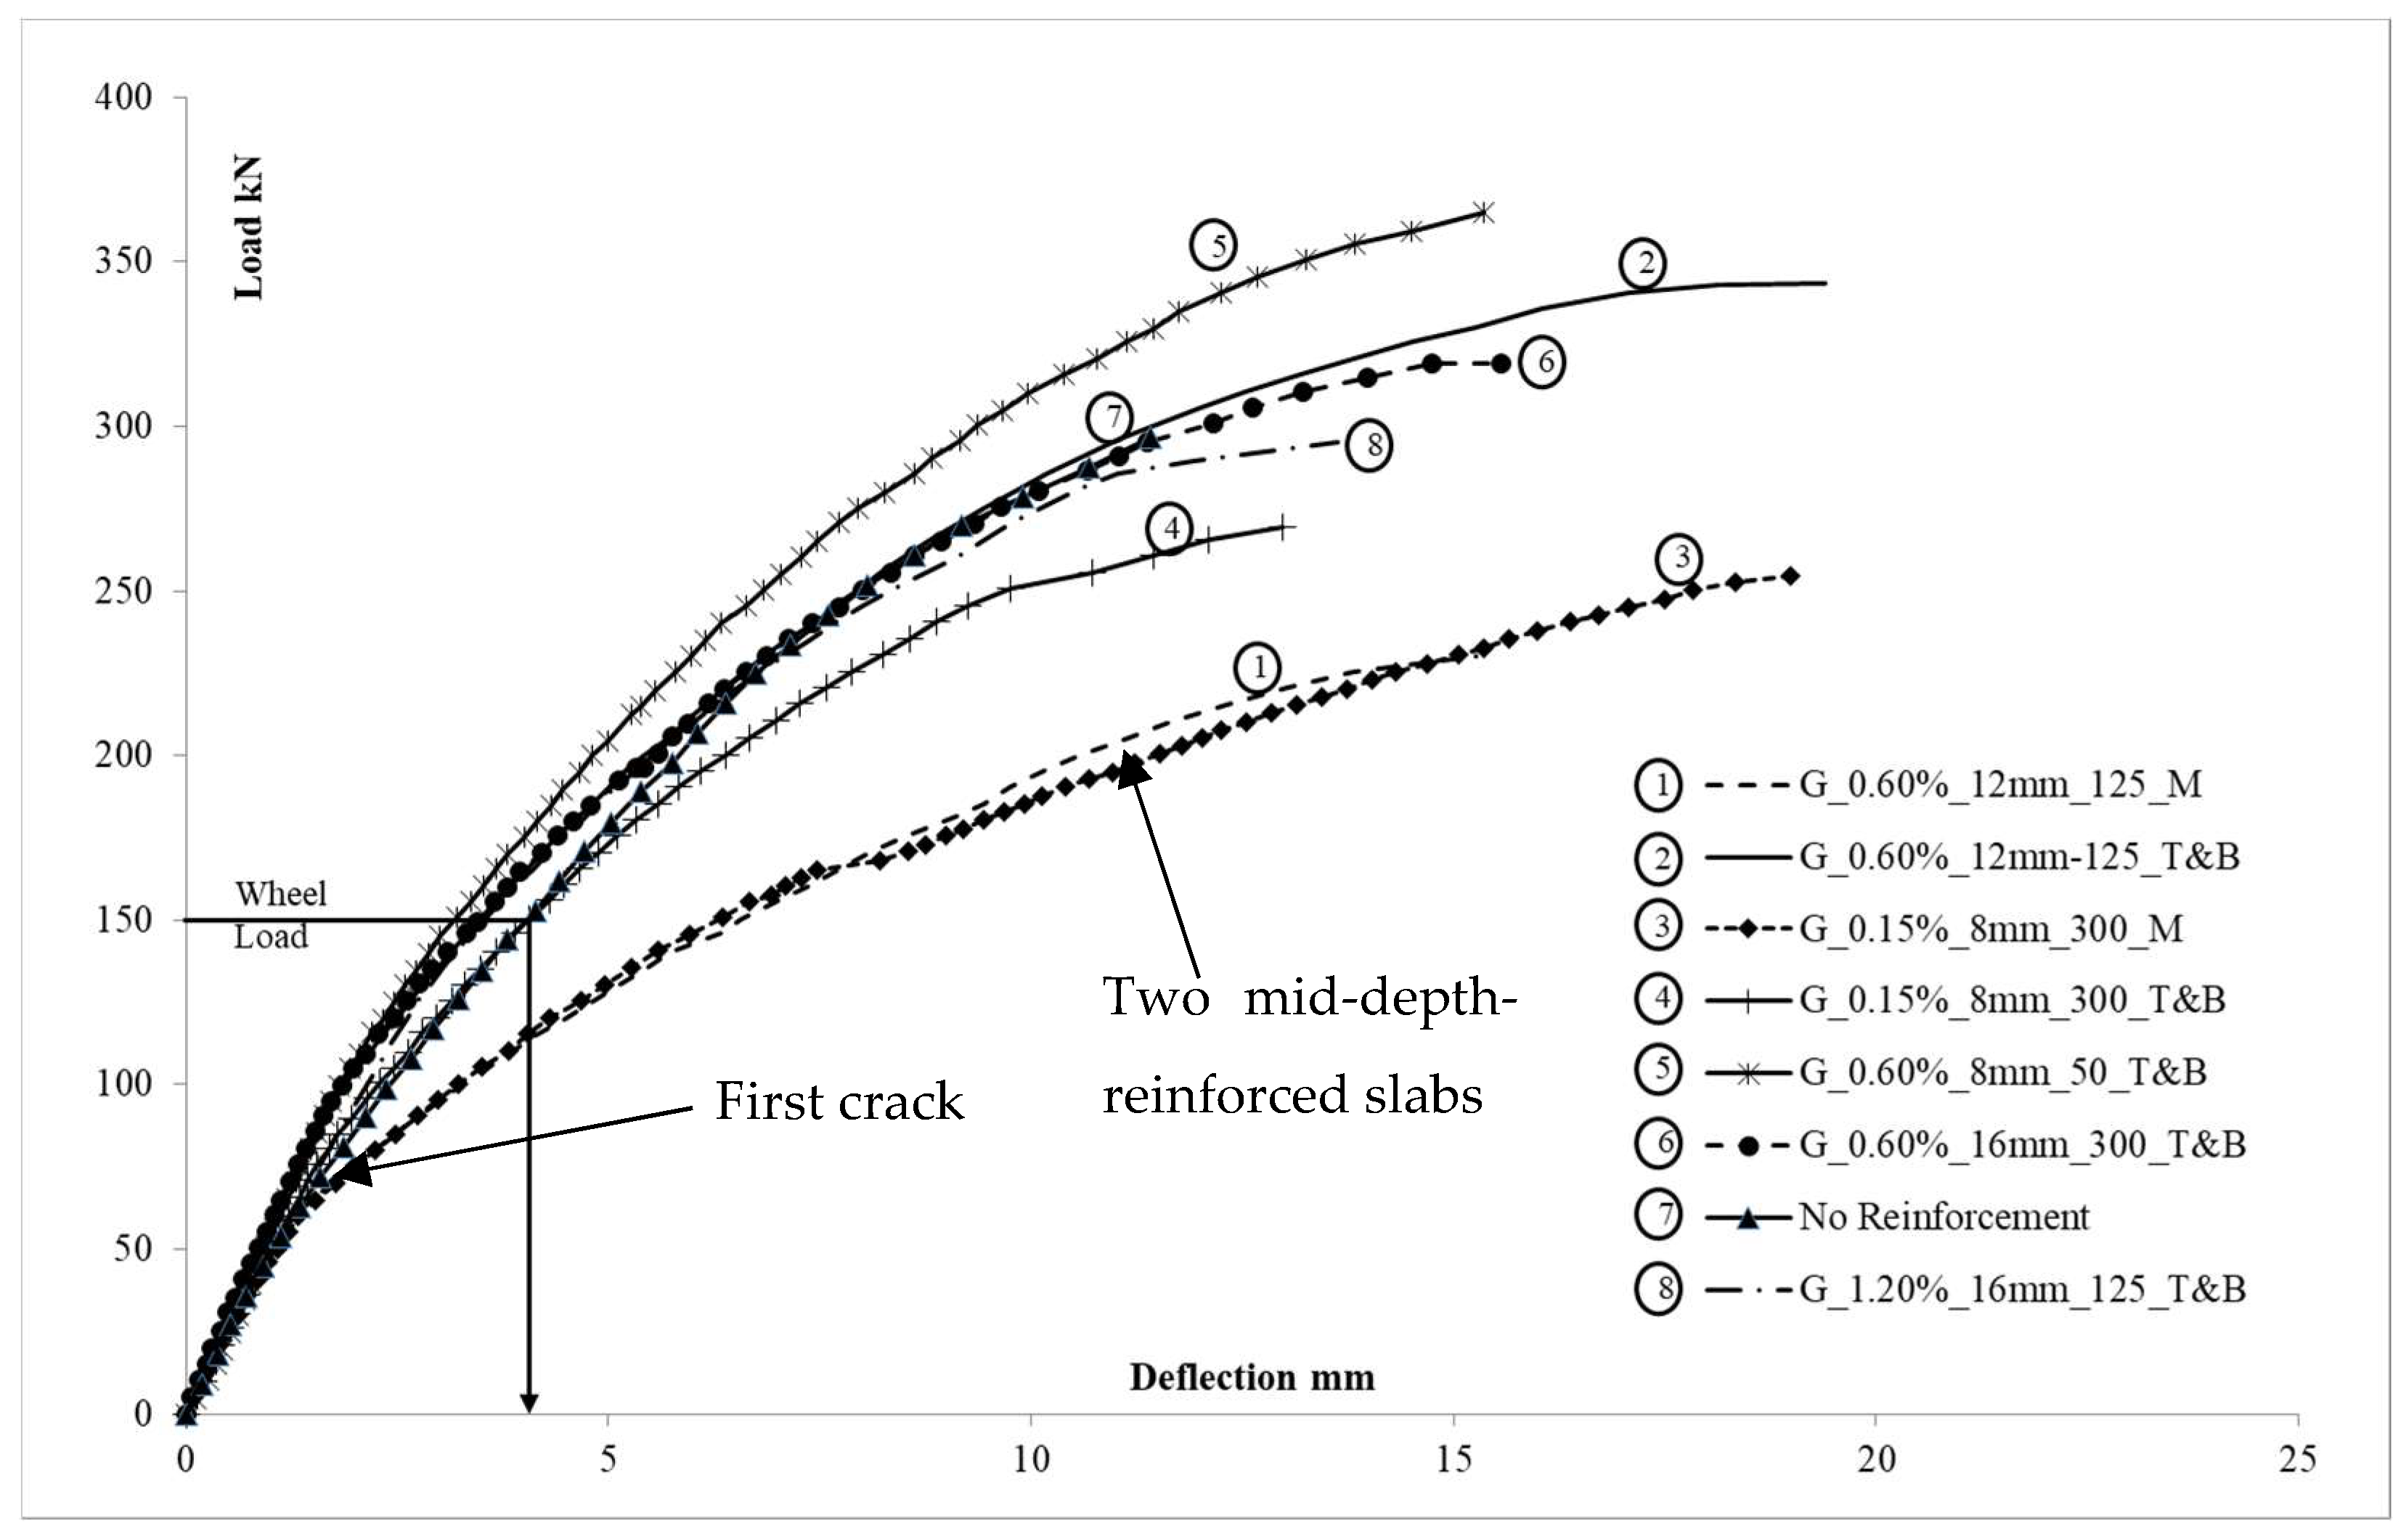
3.1. Deflection
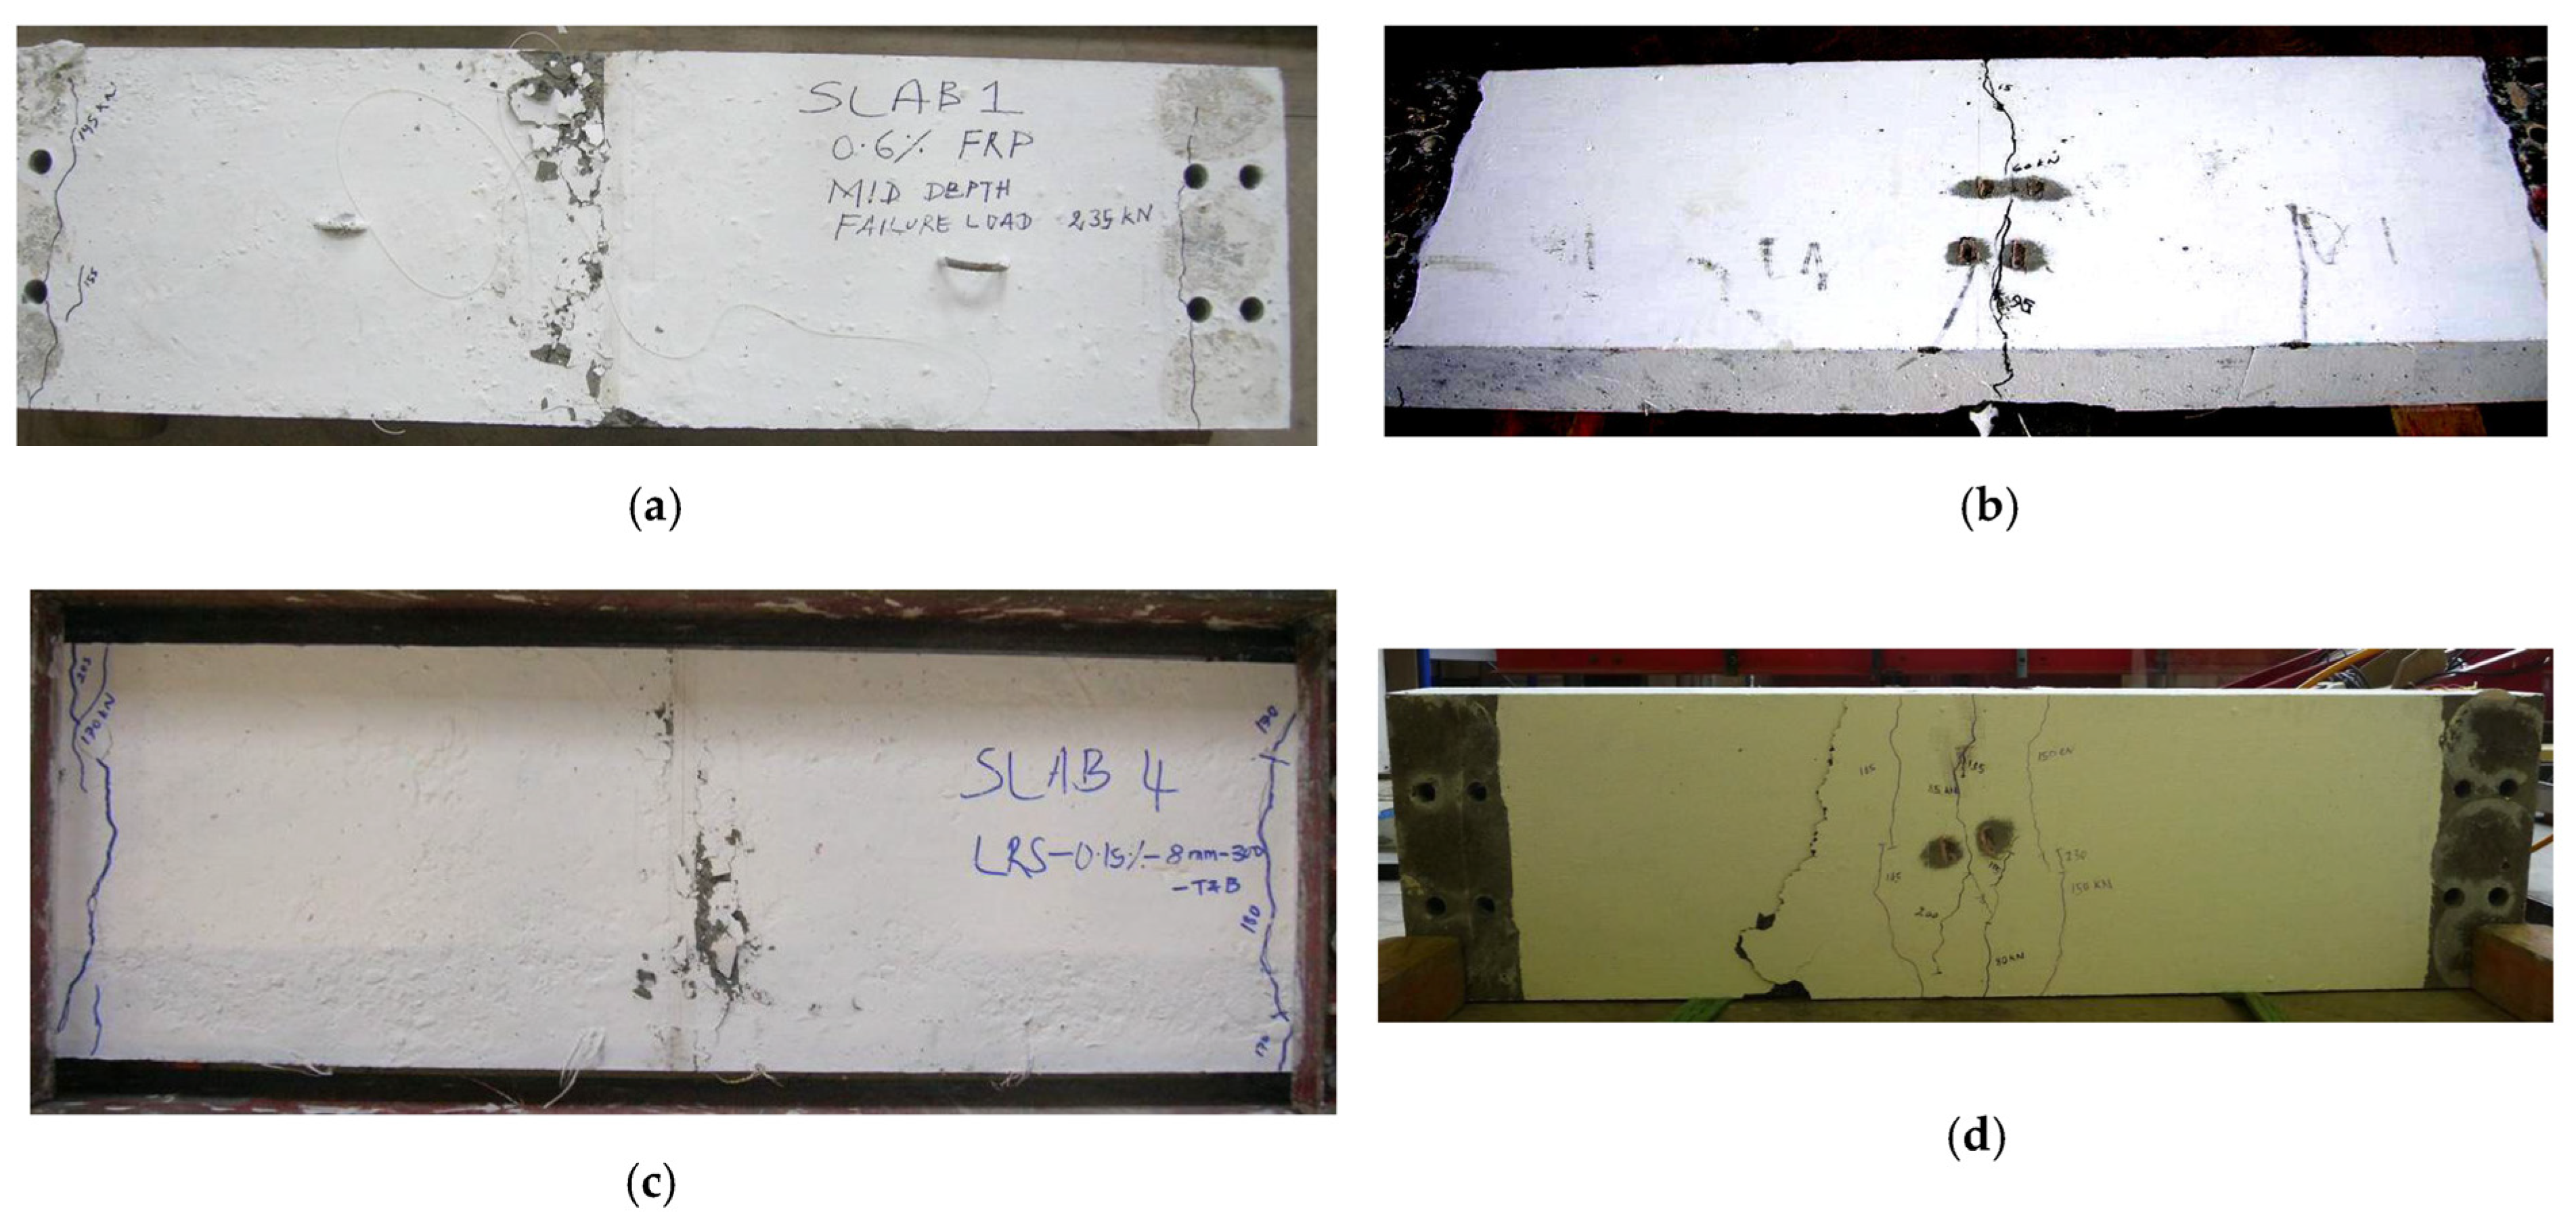
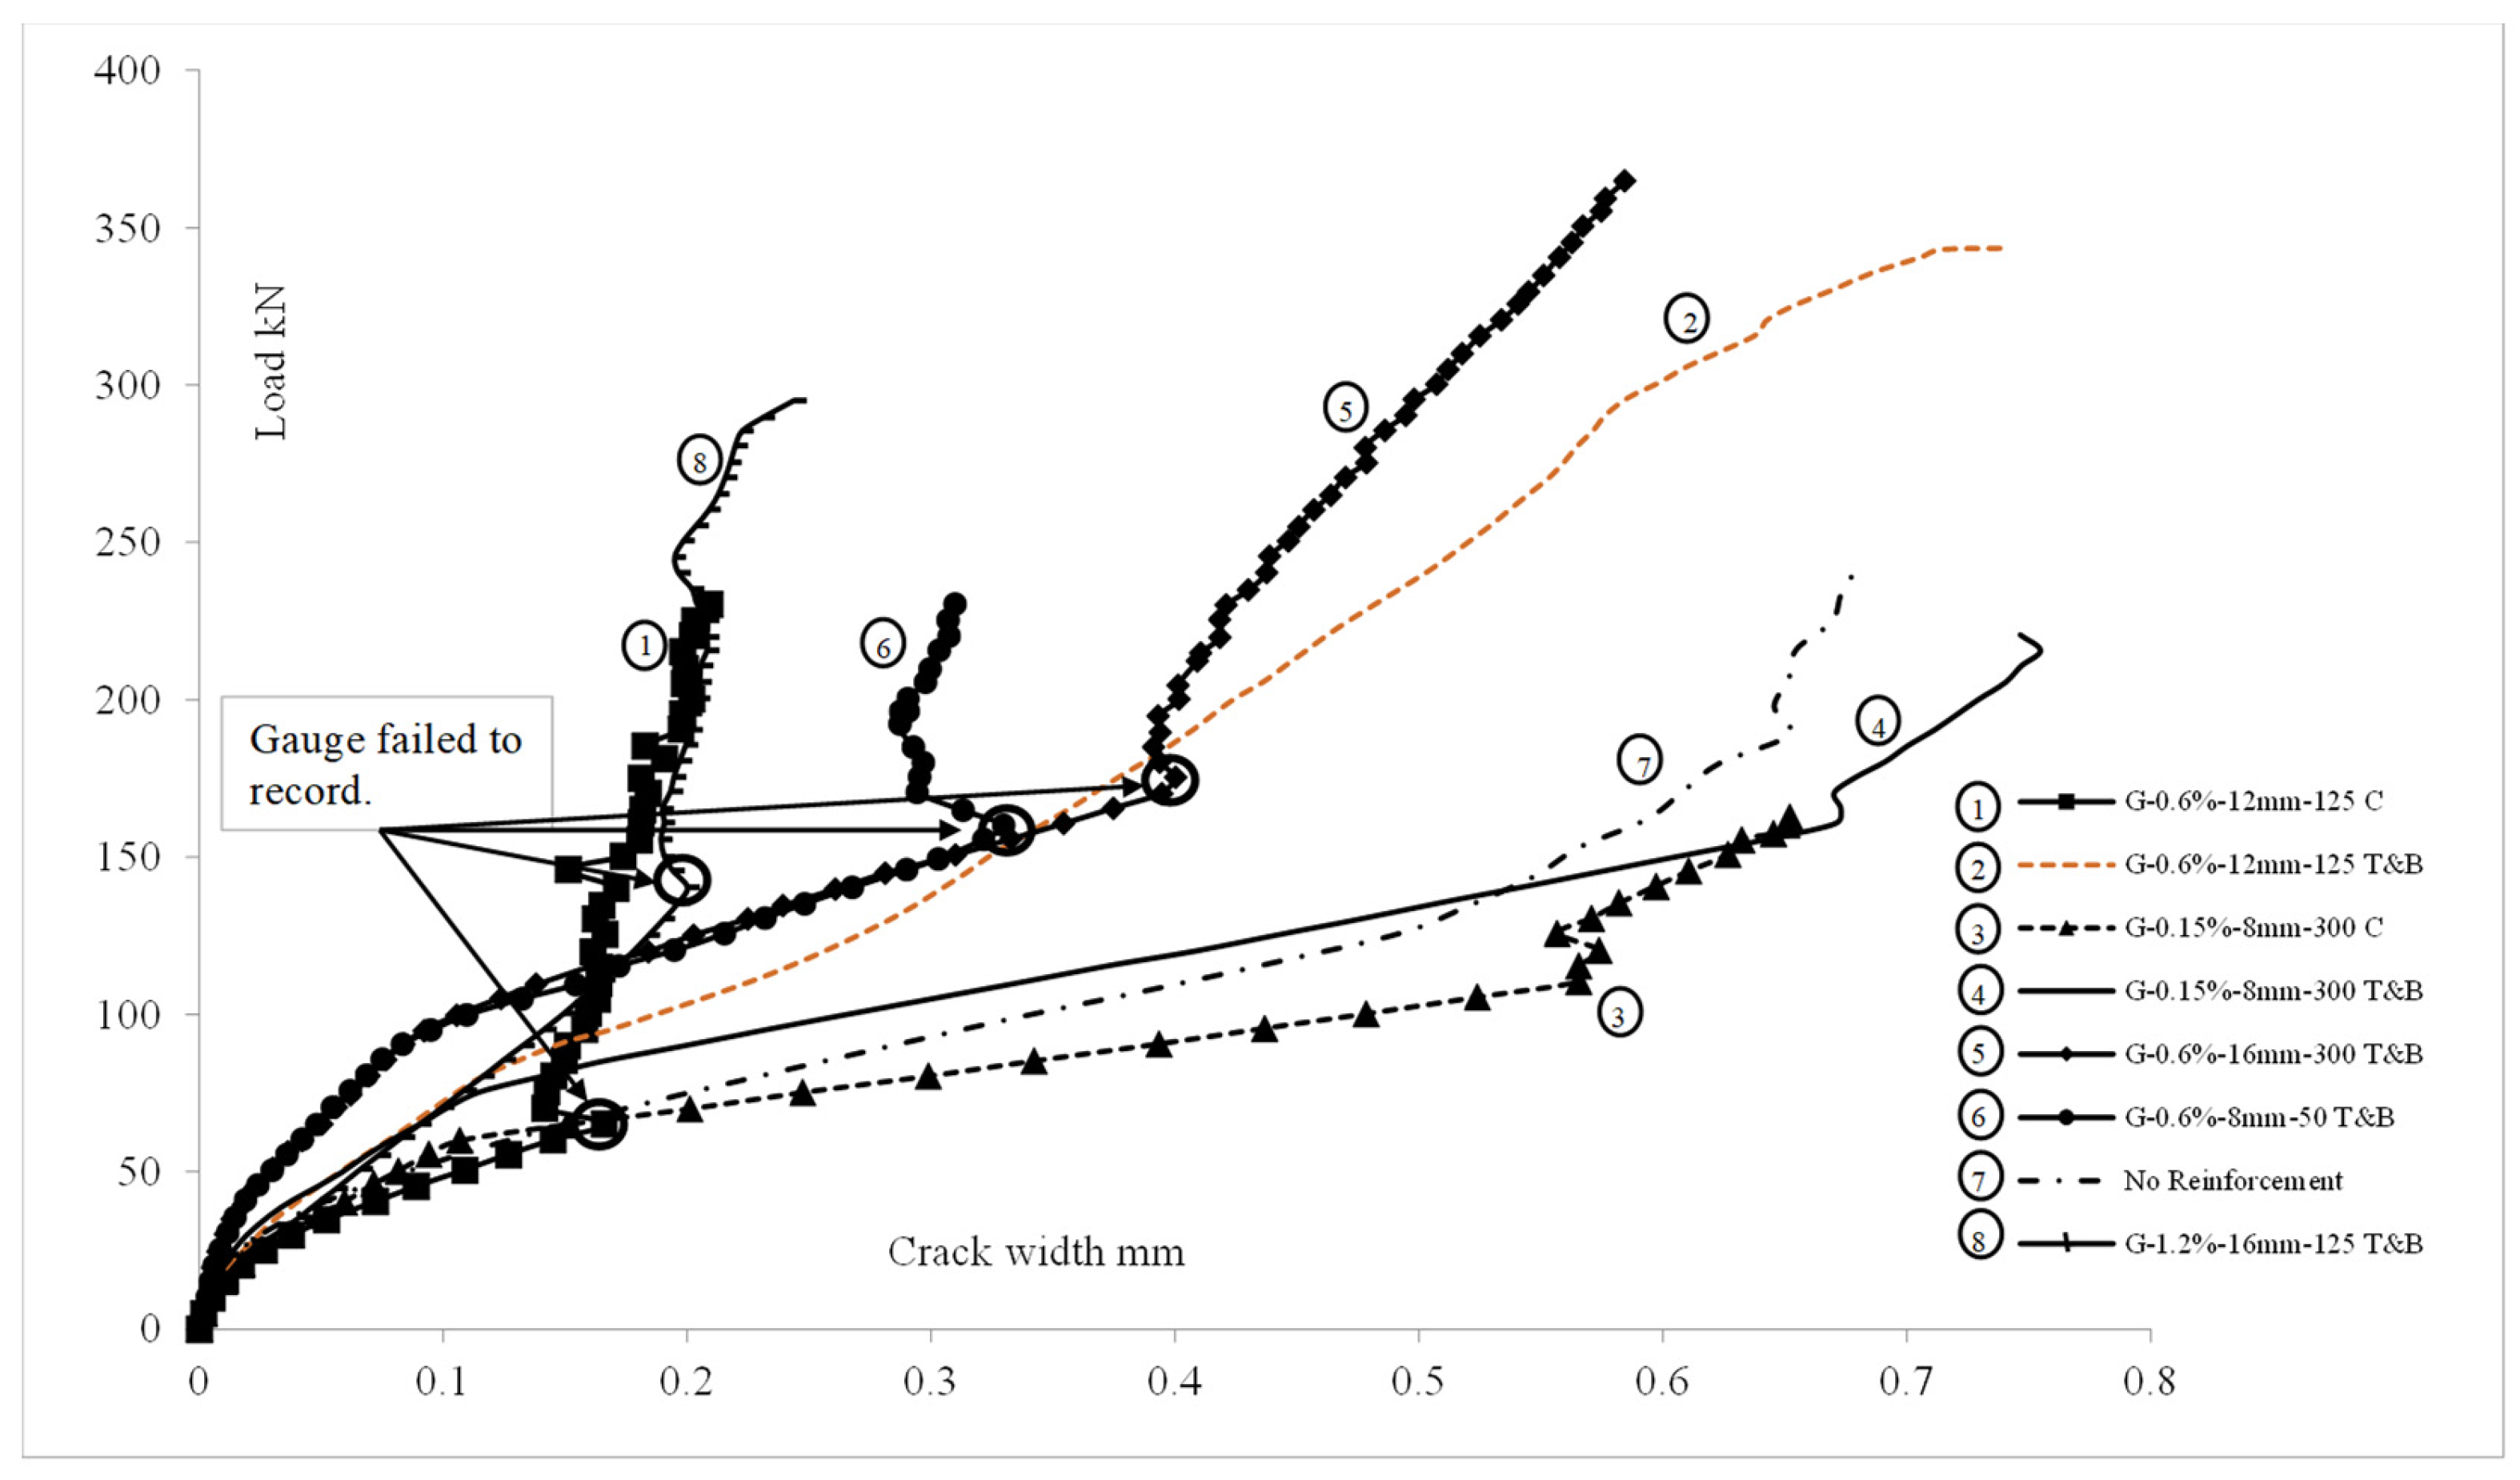
3.2. Crack Pattern and Crack Width
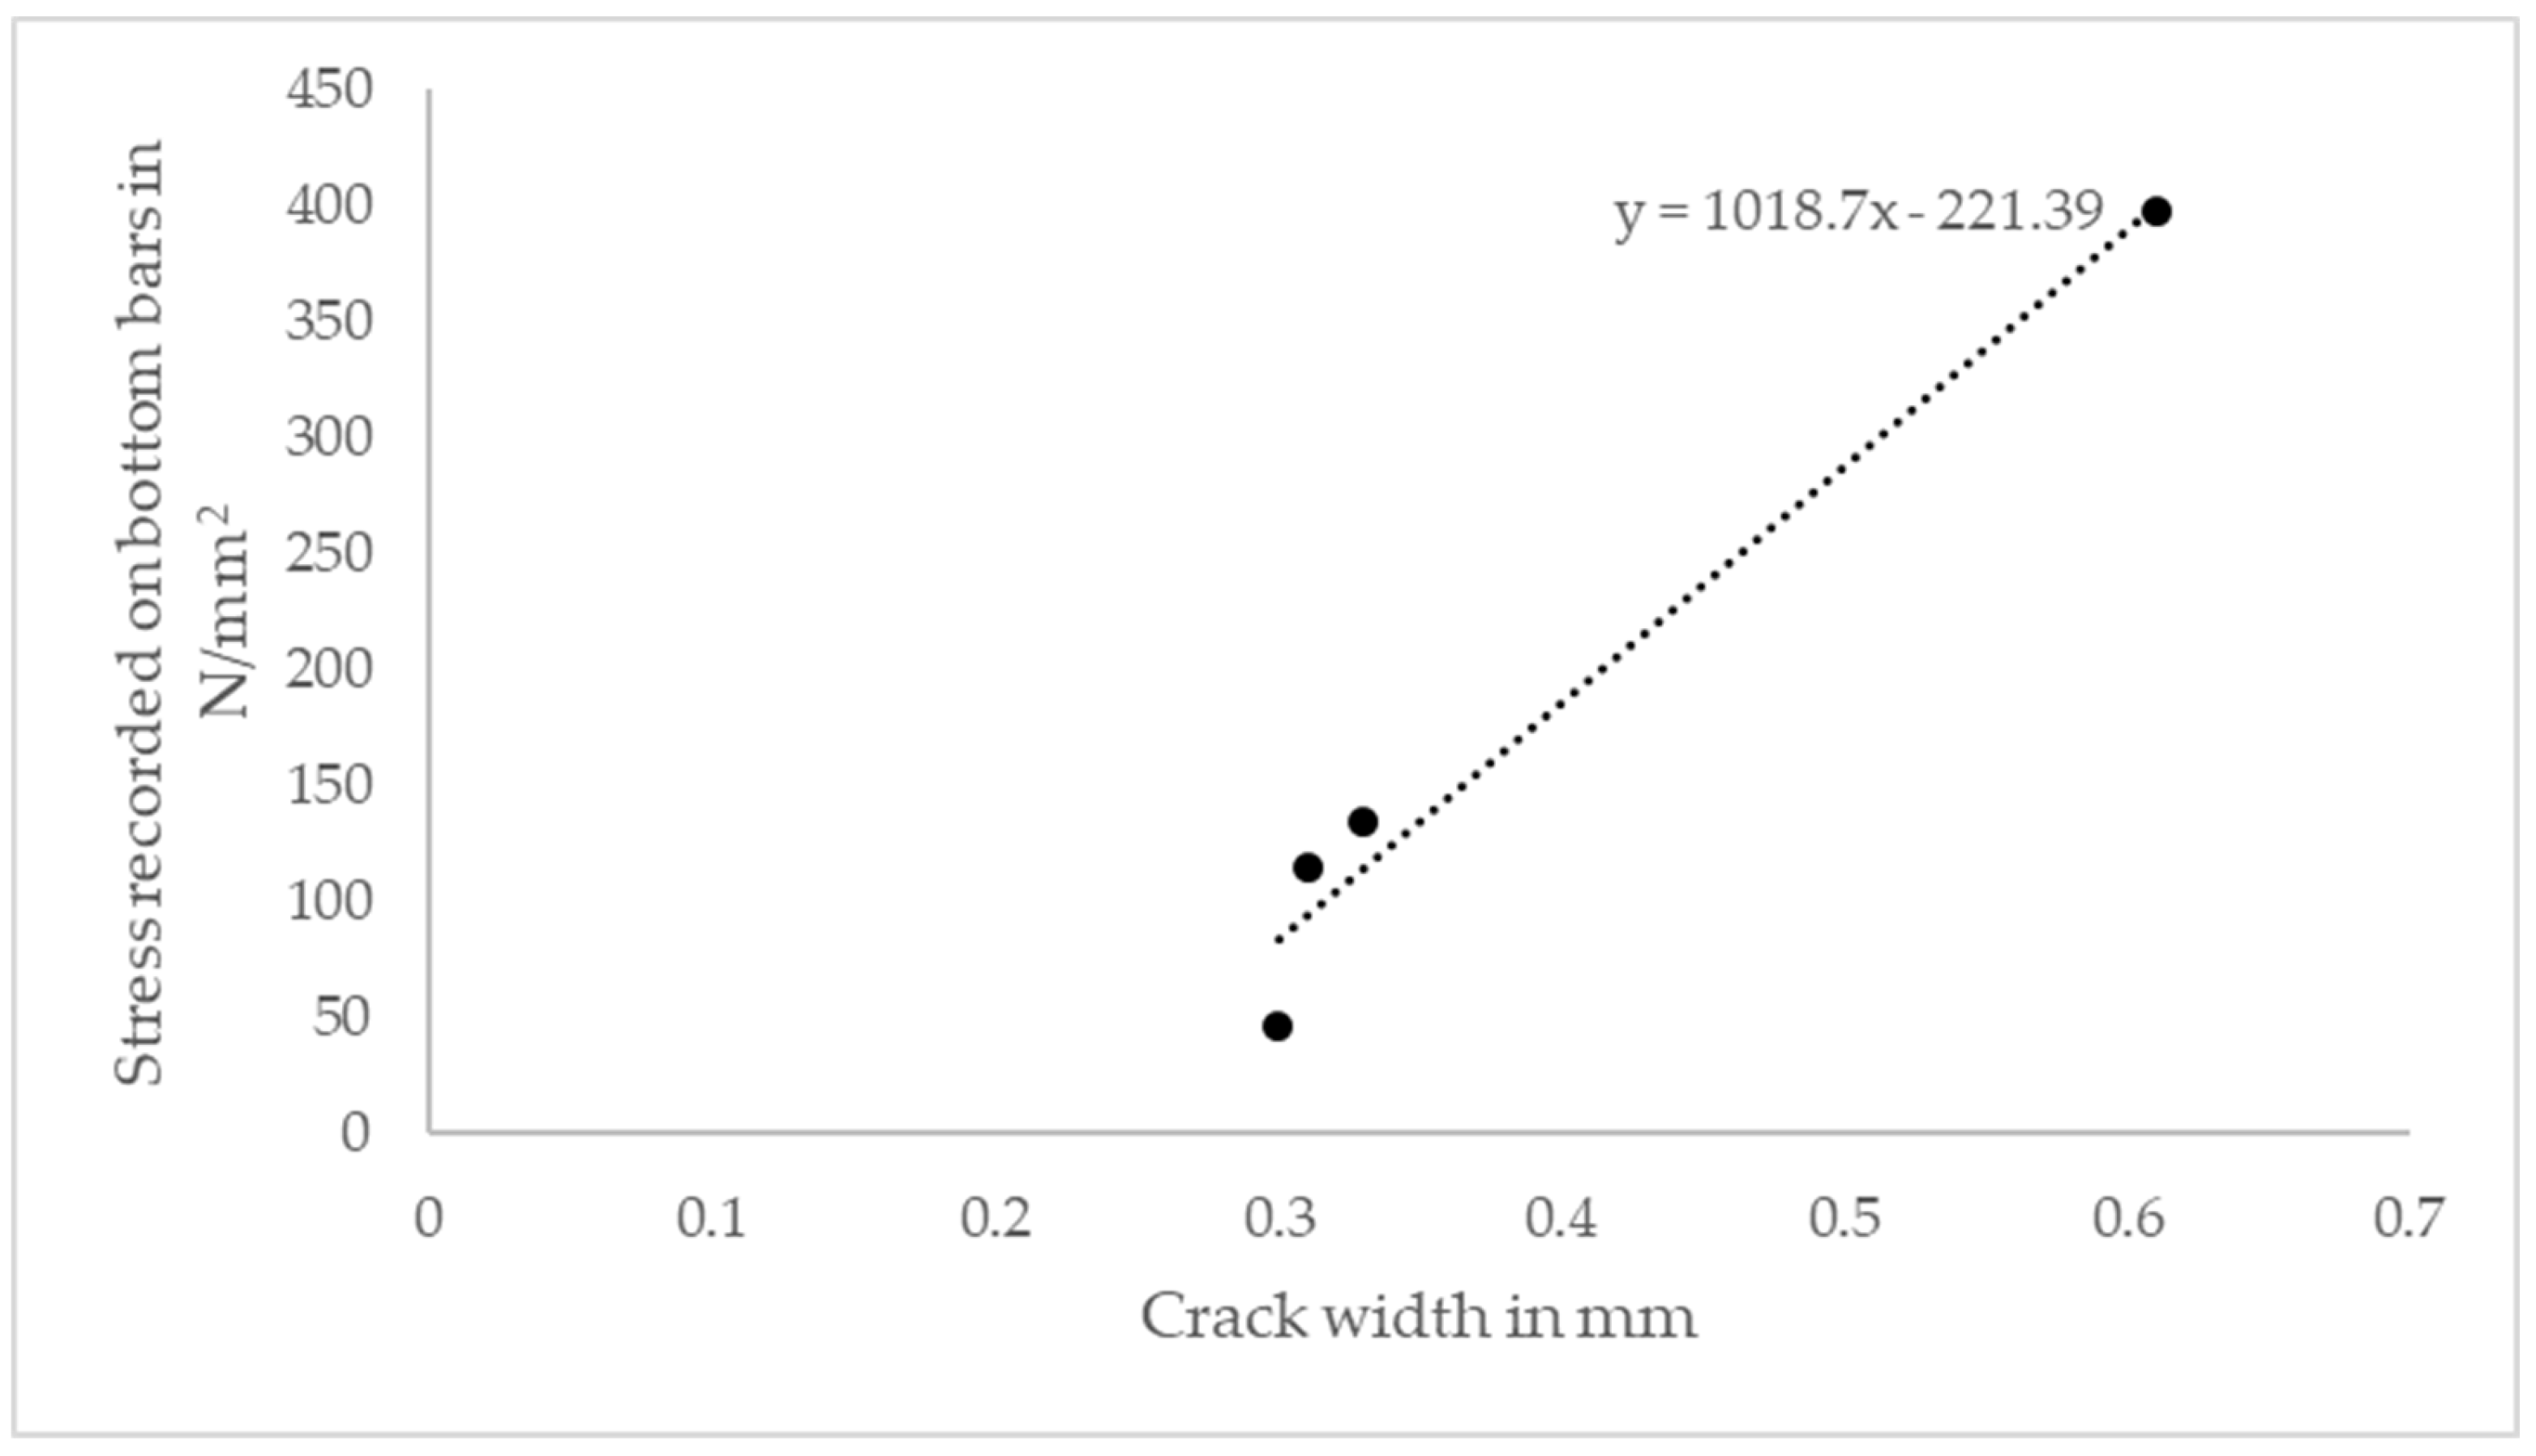
3.3. Stress Recorded on GFRP Bars Using ERS Gaugge
3.4. Failure Load and Failure Criteria
4. Nonlinear Finite Element Analysis
4.1. Modelling Approach
4.1.1. Material Models
4.1.2. Numerical Discretization
4.1.3. Solution Method
4.1.4. Convergence Criteria
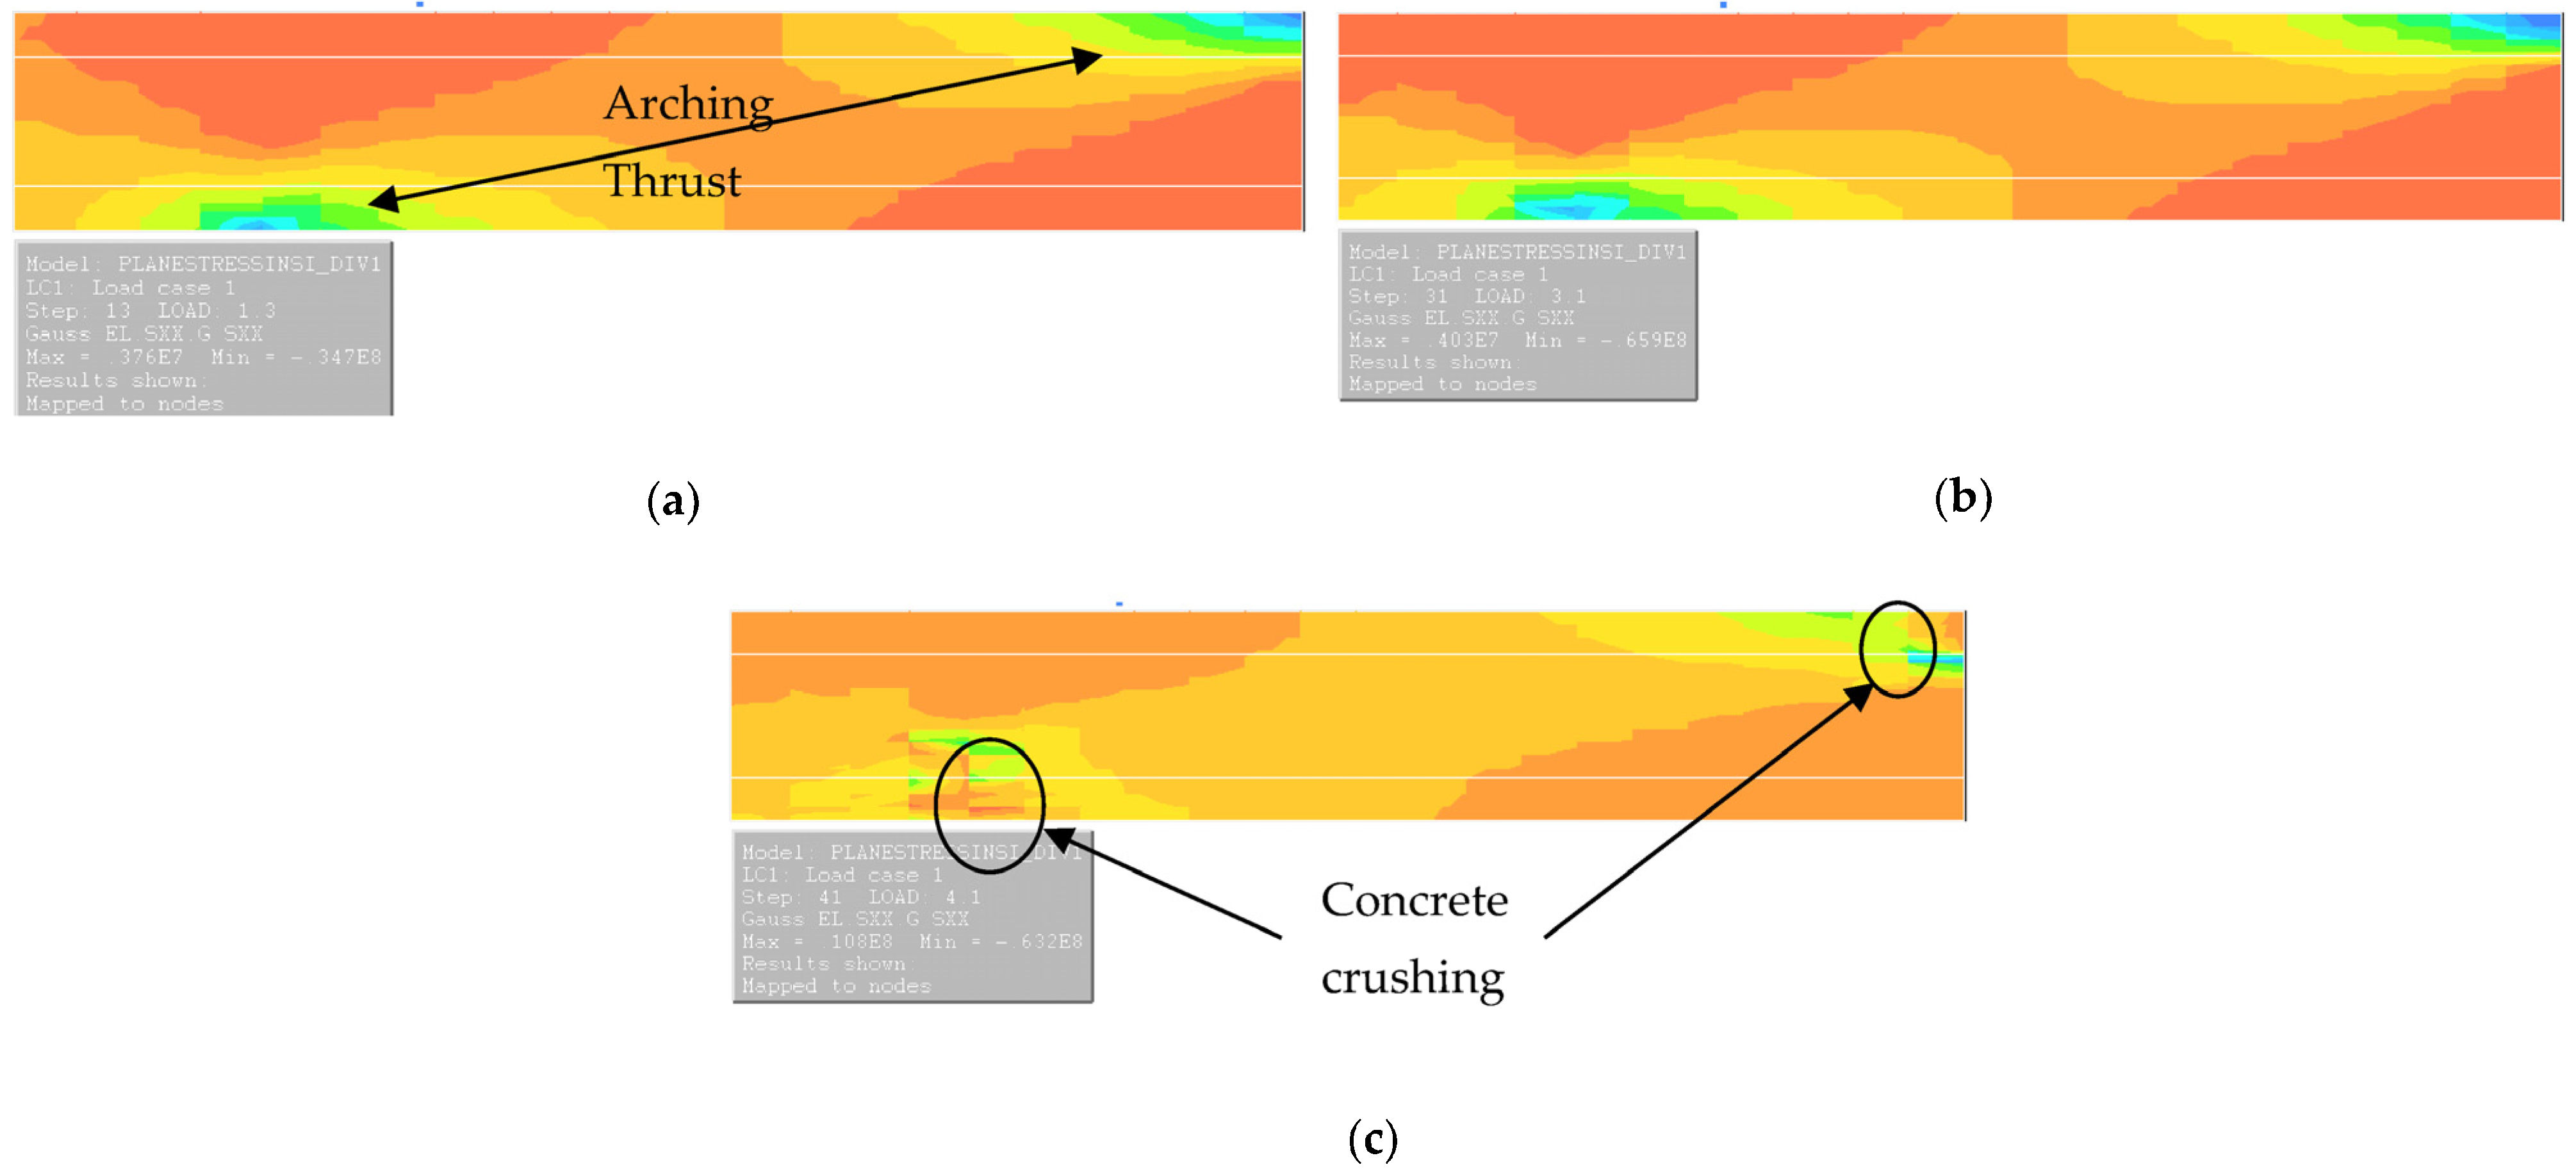
4.2. Nonlinear Finite Element Analysis Results
5. Discussion
6. Conclusions
- (1)
- As has been seen in steel-reinforced concrete in-plane restrained slabs, GFRP-reinforced in-plane restrained slabs also demonstrate the influence of compressive membrane action at the service and ultimate limit state. The strength capacities shown by in-plane restrained GFRP-reinforced and unreinforced slabs above the flexural strengths predicted by design codes. All the test slabs show strength far more than the required wheel load of 150 kN including unreinforced slab. The failure load was 80–100% higher than the flexural strengths predicted by Eurocode and ACI 440.1R. The increased failure load of restrained slabs and the strength of unreinforced slab can be attributed to the compressive membrane action which is not considered in many design codes to determine strength of in-plane restrained reinforced concrete slabs.
- (2)
- The unreinforced slab was tested and compared to demonstrate the real strength of in-plane restrained slabs. The comparison between unreinforced restrained slab and GFRP-reinforced restrained slabs shows that the strength can almost exclusively be achieved through arching action. This shows the influence of compressive membrane action in restrained slabs and the necessity to adopt arching action for consideration while designing in-plane restrained GFRP-reinforced concrete slabs.
- (3)
- GFRP-reinforced in-plane restrained slabs that satisfy the conditions for compressive membrane action as described in CD 360 [38], acceptably satisfy the service and ultimate load state requirements when reinforced with two layers of 0.6% GFRP reinforcement or higher.
- (4)
- Although the unreinforced slab, the slabs reinforced with a single mid depth reinforcement and two layer 0.15% GFRP reinforcement show strength excess of a wheel load, they fail to satisfy serviceability requirements at maximum wheel load of 150kN. These deficits to satisfy serviceability criteria shall be attributed to the lower amount of reinforcement and the position of reinforcement.
- (5)
- NLFEA carried out on tested slabs and numerical analysis of data obtained from the literature clearly indicate the ability of nonlinear finite element models to predict the behavior of restrained slabs and the influence of compressive membrane action. Therefore, it is appropriate to adopt necessary modifications in design codes to incorporate the benefits of compressive membrane action that can significantly benefit GFRP/FRP-reinforced in-plane restrained slabs.
7. Recommendation for Future Work
Author Contributions
Funding
Institutional Review Board Statement
Data Availability Statement
Acknowledgments
Conflicts of Interest
References
- Truong, Q.C.; El Soueidy, C.-P.; Li, Y.; Bastidas-Arteaga, E. Probability-Based Maintenance Modeling and Planning for Reinforced Concrete Assets Subjected to Chloride Ingress. J. Build. Eng. 2022, 54, 104675. [Google Scholar] [CrossRef]
- Chung, D.D.L. Corrosion Control of Steel-Reinforced Concrete. J. Mater. Eng. Perform. 2000, 9, 585–588. [Google Scholar] [CrossRef]
- Clarke, J.L. Fibre-Reinforced Plastic Reinforcement for Concrete; Current Practice Sheet No. 114; Concrete Bridge Development Group: London, UK, 1999. [Google Scholar]
- Keesler, R.J.; Powers, R.G. Corrosion of Epoxy Coated Rebars-Keys Segmental Bridge-Monroe County; Materials Office, Corrosion Research Laboratories, Florida Department of Transportation: Gainesville, FL, USA, 1998.
- Burgoyne, C. Fibre Reinforced Polymers–Strengths, Weaknesses, Opportunities and Threats. In Proceedings of the 9th International Symposium on Fibre Reinforced Polymer Reinforcement for Concrete Structures, Sydney, Australia, 13–15 July 2009. [Google Scholar]
- Bedard, C. Composite Reinforcing Bars: Assessing Their Use in Construction. Concr. Int. 1992, 14, 55–59. [Google Scholar]
- ACI. Guide for the Design and Construction of Structural Concrete Reinforced with FRP Bars; American Concrete Institute: Farmington Hill, MI, USA, 2015; ISBN 978-1-942727-10-1. [Google Scholar]
- Institution of Structural Engineers. Interim Guidance on the Design of Reinforced Concrete Structures Using Fibre Composite Reinforcement; Institution of Structural Engineers: London, UK, 1999; p. 116. [Google Scholar]
- Canadian Standards Association. Canadian Highway Bridge Design Code (CAN/CSA-S6-06); Canadian Standards Association: Toronto, ON, Canada, 2006. [Google Scholar]
- Benmokrane, B.; Chaallal, O.; Masmoudi, R. Glass Fibre Reinforced Plastic (GFRP) Rebars for Concrete Structures. Constr. Build. Mater. 1995, 9, 353–364. [Google Scholar] [CrossRef]
- Theriault, M.; Benmokrane, B. Theoretical and Experimental Investigation on Crack Width, Deflection and Deformability of Concrete Beams Reinforced with FRP Rebars. In Proceedings of the Annual Conference—Canadian Society for Civil Engineering, Sherbrooke, QC, Canada, 27–30 May 1997; Volume 6. [Google Scholar]
- Alsayed, S.H.; Al-Salloum, Y.A.; Almusallam, T.H. Performance of Glass Fiber Reinforced Plastic Bars as a Reinforcing Material for Concrete Structures. Compos. Part B Eng. 2000, 31, 555–567. [Google Scholar] [CrossRef]
- Michaluk, C.R.; Rizkalla, S.H.; Tadros, G.; Benmokrane, B. Flexural Behavior of One-Way Concrete Slabs Reinforced by Fiber Reinforced Plastic Reinforcements. ACI Struct. J. 1998, 95, 353–365. [Google Scholar] [CrossRef]
- Hassan, T.; Abdelrahman, A.; Tadros, G.; Rizkalla, S. Fibre Reinforced Polymer Reinforcing Bars for Bridge Decks. Can. J. Civ. Eng. 2000, 27, 839–849. [Google Scholar] [CrossRef]
- El-Salakawy, E.; Benmokrane, B. Serviceability of Concrete Bridge Deck Slabs Reinforced with Fiber-Reinforced Polymer Composite Bars. ACI Struct. J. 2004, 101, 727–736. [Google Scholar]
- Zhang, B.; Masmoudi, R.; Benmokrane, B. Behaviour of One-Way Concrete Slabs Reinforced with CFRP Grid Reinforcements. Constr. Build. Mater. 2004, 18, 625–635. [Google Scholar] [CrossRef]
- Benmokrane, B.; El-Salakawy, E.; Cherrak, Z.; Wiseman, A. Fibre Reinforced Polymer Composite Bars for the Structural Concrete Slabs of a Public Works and Government Services Canada Parking Garage. Can. J. Civ. Eng. 2004, 31, 732–748. [Google Scholar] [CrossRef]
- Park, R. Ultimate Strength of Rectangular Concrete Slabs Under Short-Term Uniform Loading with Edges Restrained Agains Lateral Movement. Proc. Inst. Civ. Eng. 1964, 28, 125–150. [Google Scholar] [CrossRef]
- Hewitt, B.E.; Batchelor, B.d.V. Punching Shear Strength of Restrained Slabs. ASCE J Struct Div 1975, 101, 1837–1853. [Google Scholar] [CrossRef]
- Taylor, S.E.; Rankin, G.I.B.; Cleland, D.J. Real Strength of High-Performance Concrete Bridge Deck Slabs. Proc. Inst. Civ. Eng.-Bridge Eng. 2003, 156, 81–90. [Google Scholar] [CrossRef]
- Tong, P.Y.; Batchelor, B.d.V. Compressive Membrane Enhancement in Two-Way Bridge Slabs. ACI Spec. Publ. 1971, 30, 271–286. [Google Scholar] [CrossRef]
- Taylor, S.; Rankin, G.I.B.; Cleland, D.J. Guide to Compressive Membrane Action in Concrete Bridge Decks; Concrete Bridge Development Group: Camberley, UK, 2002; Volume 3, p. 46. [Google Scholar]
- Collings, D.; Sagaseta, J. A Review of Arching and Compressive Membrane Action in Concrete Bridges. Proc. Inst. Civ. Eng.-Bridge Eng. 2015, 169, 271–284. [Google Scholar] [CrossRef]
- Rankin, G.I.B. Punching Failure and Compressive Membrane Action in Reinforced Concrete Slabs. Ph.D. Thesis, Queen’s University of Belfast, Belfast, UK, 1982; p. 334. [Google Scholar]
- Keyvani, L.; Sasani, M.; Mirzaei, Y. Compressive Membrane Action in Progressive Collapse Resistance of RC Flat Plates. Eng. Struct. 2014, 59, 554–564. [Google Scholar] [CrossRef]
- Belletti, B.; Walraven, J.C.; Trapani, F. Evaluation of Compressive Membrane Action Effects on Punching Shear Resistance of Reinforced Concrete Slabs. Eng. Struct. 2015, 95, 25–39. [Google Scholar] [CrossRef]
- Lahlouh, E.H.; Waldron, P. Membrane Action in One-Way Slab Strips. Proc. Inst. Civ. Eng.-Struct. Build. 2007, 94, 419–428. [Google Scholar] [CrossRef]
- Brotchie, J.F.; Holley, M.J. Membrane Action in Slabs. ACI Publ. 1971, 30, 345–377. [Google Scholar] [CrossRef]
- Vecchio, F.J.; Tang, K. Membrane Action in Reinforced Concrete Slabs. Can. J. Civ. Eng. 2010, 17, 686–697. [Google Scholar] [CrossRef]
- Zheng, Y.; Robinson, D.; Taylor, S.; Cleland, D. Finite Element Investigation of the Structural Behaviour of Deck Slabs in Composite Bridges. Eng. Struct. 2009, 31, 1762–1776. [Google Scholar] [CrossRef]
- Kirkpatrick, J.; Rankin, G.I.; Long, A. Strength Evaluation of M-Beam Bridge Deck Slabs. Struct. Eng. 1984, 62, 60–68. [Google Scholar]
- Rankin, G.I.B.; Long, A.E. Arching Action Strength Enhancement in Later Ally-Restrained Slab Strips. Proc. Inst. Civ. Eng.-Struct. Build. 2007, 122, 461–467. [Google Scholar] [CrossRef]
- Zheng, Y.; Robinson, D.; Taylor, S.; Cleland, D. Non-Linear Finite-Element Analysis of Punching Capacities of Steel–Concrete Bridge Deck Slabs. Proc. Inst. Civ. Eng.-Struct. Build. 2012, 165, 255–269. [Google Scholar] [CrossRef]
- Tharmarajah, G.; Taylor, S.E.; Cleland, D.J.; Robinson, D. Corrosion-Resistant FRP Reinforcement for Bridge Deck Slabs. Proc. Inst. Civ. Eng.-Bridge Eng. 2015, 168, 208–217. [Google Scholar] [CrossRef]
- Tharmarajah, G.; Taylor, S.E.; Cleland, D.J.; Robinson, D.J. Behaviour of FRP Reinforced Restrained Slabs. In Proceedings of the Advanced Composites in Construction 2011, ACIC 2011—Proceedings of the 5th International Conference, Coventry, UK, 6–8 September 2011. [Google Scholar]
- Ruddle, M. Arching Action and the Ultimate Capacity of Reinforced Concrete Beams; Queen’s University Belfast: Belfast, Northern Ireland, 1990. [Google Scholar]
- Bakht, B.; Schaefer, J. Steel-Free Bridge Decks: A Canadian Innovation. In World Highways/Routes du Monde; Route One Publishing Limited: Dartford, UK, 1997. [Google Scholar]
- DENI (Department of the Environment Northern Ireland). Design of M-Beam Bridge Decks, Amendment No. 3 to the Bridge Design Code; Northern Ireland Roads Service Headquarters: Belfast, UK, 1986; p. 11.
- Highways England. CD 360: Use of Compressive Membrane Action in Bridge Decks. In Design Manual for Roads and Bridges; UKHA: Birmingham, UK, 2020; Volume 3. [Google Scholar]
- CAN/CSA-S806; Design and Construction of Building Structures with Fibre-Reinforced Polymers. Canadian Standards Association: Toronto, ON, Canada, 2012.
- Taylor, S. Compressive Membrane Action in High Strength Concrete Bridge Deck Slabs; Queen’s University: Belfast, Northern Ireland, 2000. [Google Scholar]
- British Standard Institution BS EN 12390-3:2019; Testing Hardened Concrete—Part 3: Compressive Strength of Test Specimens. British Standards Institution: London, UK, 2019.
- BSI BS EN 1992-1-1; Eurocode 2: Design of Concrete Structures–Part 1-1: General Rules and Rules for Buildings. British Standards Institution: London, UK, 2004.
- ASTM D3916-08; Standard Test Method for Tensile Properties of Pultruded Glass-Fiber-Reinforced Plastic Rod. ASTM American Society of Testing Materials: West Conshohocken, PA, USA, 2016.
- Castro, P.F.; Carino, N.J. Tensile and Nondestructive Testing of FRP Bars. J. Compos. Constr. 1998, 2, 17–27. [Google Scholar] [CrossRef]
- Taylor, S.E.; Mullin, B. Arching Action in FRP Reinforced Concrete Slabs. Constr. Build. Mater. 2006, 20, 71–80. [Google Scholar] [CrossRef]
- BSI BS EN 1991-2; Eurocode 1: Actions on Structures—Part 2: Traffic Loads on Bridges. British Standards Institution: London, UK, 2003.
- ACI Committee 318. ACI 318-19; Building Code Requirements for Structural Concrete Commentary on Building Code Requirements for Structural Concrete. American Concrete Institute: Farmington Hill, MI, USA, 2019.
- Uomoto, T. Recommendation for Design and Construction of Concrete Structures Using Continuous Fiber Reinforcing Materials; Machida, A., Ed.; Japan Society of Civil Engineers: Tokyo, Japan, 1997; pp. 1–325. [Google Scholar]
- Noël, M.; Soudki, K. Estimation of the Crack Width and Deformation of FRP-Reinforced Concrete Flexural Members with and without Transverse Shear Reinforcement. Eng. Struct. 2014, 59, 393–398. [Google Scholar] [CrossRef]
- Diana User’s Manual. Available online: https://manuals.dianafea.com/d106/Diana.html (accessed on 4 December 2022).
- Thorenfeldt, E.; Tomaszewicz, A.; Jensen, J. Mechanical Properties of High-Strength Concrete and Application in Design. In Proceedings of the Symposium on Utilization of High Strength Concrete, Stavanger, Norway, 15–18 June 1987. [Google Scholar]
- Saatci, S.; Vecchio, F.J. Nonlinear Finite Element Modeling of Reinforced Concrete Structures under Impact Loads. Struct. J. 2009, 106, 717–725. [Google Scholar] [CrossRef]
- Duchaine, F.; Champliaud, H. Structured Mesh Generation by Kriging with Local Refinement with a New Elliptic Scheme. Eng. Comput. 2007, 23, 61–69. [Google Scholar] [CrossRef]
- Bakht, B.; Mufti, A.A. Five Steel-Free Bridge Deck Slabs in Canada. Struct. Eng. Int. 1998, 8, 196–200. [Google Scholar] [CrossRef]
- AASHTO (American Association of State Highway and Transport Officials). LRFD Bridge Design Specifications: Ch. 9, Bridge Deck Systems, 7th ed.; Aashto: Washington, DC, USA, 2007. [Google Scholar]


| Test Slabs | Effective Depth (Rebar Spacing) | Reinforcement (%) | Compressive Strength, († fck,cube N/mm2) | Tensile Strength (N/mm2) |
|---|---|---|---|---|
| G-0.6%-12 mm-125_M | 75 mm (125 mm) | 0.60 | 64.7 | 3.70 |
| G-0.6%-12 mm-125_T&B | 119 mm (125 mm) | 0.60 | 68.1 | 3.44 |
| G-0.15%-8 mm-300_M | 75 mm (300 mm) | 0.15 | 69.5 | 2.52 |
| G-0.15%-8 mm-300_T&B | 121 mm (300 mm) | 0.15 | 66.7 | 4.05 |
| G-0.6%-16 mm-300_T&B | 117 mm (300 mm) | 0.60 | 65.7 | 3.68 |
| G-0.6%-8 mm-50_T&B | 121 mm (50 mm) | 0.60 | 60.4 | 3.96 |
| No reinforcement | No reinforcement | 0.00 | 72.6 | 3.97 |
| G-1.2%-16 mm-125_T&B | 117 mm (125 mm) | 1.20 | 66.3 | 3.87 |
| Slab | Concrete Strength fck,cube (N/mm2) | Deflection @150kN (mm) | Ratio of Span to Deflection at Service Level | Deflection at FAILURE (mm) | Crack Width @ 65kN in (mm) | Crack Width @ 150kN (mm) | Stress on GFRP Bar @ 150 kN (N/mm2) |
|---|---|---|---|---|---|---|---|
| G-0.6%-12 mm-125_M | 64.7 | 6.57 (43%) * | 217 | 15.27 | 0.17 | - | 220.2 |
| G-0.6%-12 mm-125_T&B | 68.1 | 3.49 (18%) | 408 > 250 $ | 19.40 | 0.09 | 0.33 | 134.3 |
| G-0.15%-8 mm-300_M | 69.5 | 6.34 (33%) | 225 | 18.98 | 0.15 | - | 184.3 |
| G-0.15%-8 mm-300_T&B | 66.7 | 4.06 (31%) | 351 > 250 | 12.97 | 0.09 | 0.61 | 397.5 |
| G-0.6%-16 mm-300_T&B | 65.7 | 3.20 (21%) | 445 > 250 | 15.35 | 0.05 | 0.31 | 114.8 |
| G-0.6%-8 mm-50_T&B | 60.4 | 3.45 (22%) | 413 > 250 | 15.56 | 0.05 | 0.30 | 46.9 |
| No reinforcement | 72.6 | 4.05 (36%) | 352 > 250 | 11.41 | 0.14 | 0.57 | - |
| G-1.2%-16 mm-125_T&B | 66.3 | 3.52 (26%) | 405 > 250 | 13.62 | 0.09 | - | 262.0 |
| Slab Model | Reinforcement Percentage (%) | Balanced Reinforcement % Based on ACI 440.1R | Failure Load Predicted by ACI 440.1R (kN) | Failure Load PT kN | Expected Failure Mode | Actual Failure Mode |
|---|---|---|---|---|---|---|
| G-0.6%-12 mm-125_M | 0.60 | 1.85 | 119.4 | 235.0 | GFRP rupture | Concrete crushing |
| G-0.6%-12 mm-125_T&B | 0.60 | 1.88 | 190.1 | 343.5 | GFRP rupture | Concrete crushing |
| G-0.15%-8 mm-300_M | 0.15 | 1.91 | 26.7 | 254.8 | GFRP rupture | Concrete crushing/ |
| G-0.15%-8 mm-300_T&B | 0.15 | 1.91 | 42.8 | 269.0 | GFRP rupture | GFRP rupture Concrete crushing |
| G-0.6%-16 mm-300_T&B | 0.60 | 1.88 | 166.2 | 364.9 | GFRP rupture | Concrete crushing |
| G-0.6%-8 mm-50_T&B | 0.60 | 1.79 | 171.3 | 319.2 | GFRP rupture | Concrete crushing |
| No reinforcement | 0.00 | 2.00 | 0.0 | 296.7 | GFRP rupture | Concrete crushing |
| G-1.2%-16 mm-125_T&B | 1.20 | 1.90 | 331.4 | 295.1 | GFRP rupture | Concrete crushing |
| Model Type | Element Type | Mesh Size | Material Models | Solution Method | Loading Type |
|---|---|---|---|---|---|
| Plane Stress | Eight-node quadrilateral isoparametric plane stress element CQ16M | 40 mm × 10 mm | Total Strain Fixed Crack model using Threnfeldt compression criteria for concrete | Newton—Raphson | Displacement control at the mid span |
| Slabs | Compressive Strength of Concrete (N/mm2) | Experimental Failure Load (PT) | Failure Load by NLFEA (PFEA) | PT/PFEA |
|---|---|---|---|---|
| G-0.6%-12 mm-125_M | 64.7 | 235.0 kN | 217.0 kN | 1.08 |
| G-0.6%-12 mm-125_T&B | 68.1 | 343. 5 kN | 289.3 kN | 1.19 |
| G-0.15%-8 mm-300_M | 69.5 | 254.8 kN | 213.8 kN | 1.19 |
| G-0.15%-8 mm-300_T&B | 66.7 | 269.0 kN | 232.6 kN | 1.16 |
| G-0.6%-16 mm-300 | 65.7 | 364.9 kN | 280.3 kN | 1.30 |
| G-0.6%-8 mm-50 | 60.4 | 319.2 kN | 268.0 kN | 1.19 |
| No reinforcement | 72.6 | 296.7 kN | 219.7 kN | 1.35 |
| G-1.2%-16 mm-125_T&B | 66.3 | 295.1 kN | 302.2 kN | 0.98 |
| Author | L (mm) × h (mm) × d (mm) | fck,cube (N/mm2) | % As | Pb | PFEM | PT | PT/PFEM | |
|---|---|---|---|---|---|---|---|---|
| 1 | Christiansen [54] | 1829 × 76.2 × 66.7 | 34.3 | 0.623 | 8.43 | 13.52 | 11.48 | 0.85 |
| 2 | 1524 × 76.2 × 66.7 | 32.3 | 0.623 | 10.07 | 15.48 | 14.44 | 0.93 | |
| 3 | 1524 × 88.9 × 79.4 | 28.3 | 0.623 | 12.02 | 19.69 | 18.02 | 0.92 | |
| 4 | 1524 × 88.9 × 79.4 | 39.1 | 0.623 | 12.22 | 23.80 | 19.76 | 0.83 | |
| RB10 | Roberts [55] | 1463 × 51 × 42.6 | 50.4 | 0.556 | 6.39 | 19.20 | 18.72 | 0.98 |
| RB11 | 24.7 | 0.556 | 6.25 | 13.20 | 11.86 | 0.90 | ||
| RB12 | 32.8 | 0.741 | 8.33 | 16.80 | 16.22 | 0.97 | ||
| RB13 | 30.2 | 0.741 | 8.30 | 16.40 | 13.14 | 0.80 | ||
| RB14 | 49.7 | 0.926 | 8.45 | 18.80 | 18.50 | 0.98 | ||
| RB15 | 24.1 | 0.926 | 10.10 | 14.80 | 13.96 | 0.94 | ||
| RB17 | 53.3 | 0.578 | 10.51 | 18.80 | 16.88 | 0.90 | ||
| RB24 | 51.8 | 0.371 | 4.29 | 19.20 | 18.52 | 0.96 | ||
| RB25 | 26.3 | 0.371 | 4.24 | 12.00 | 14.16 | 1.18 | ||
| H-100 | Lahlouh and Waldron [26] | 2500 × 150 × 121 | 71.8 | 0.540 | 81.20 | 84.00 | 84.70 | 1.01 |
| H-200 | 78.7 | 0.540 | 81.70 | 108.00 | 109.70 | 1.02 | ||
| H-300 | 64.4 | 0.540 | 80.50 | 120.00 | 143.10 | 1.19 | ||
| 1 | Taylor et al. [19] | 1425 × 150 × 104 | 31.2 | 0.680 | 91.5 | 141.7 | 136 | 0.96 |
| 2 | 40.8 | 0.680 | 93.4 | 157.8 | 145 | 0.92 | ||
| 3 | 64.5 | 0.680 | 94.7 | 206.5 | 175 | 0.85 | ||
| 4 | 82.2 | 0.680 | 94.7 | 239.9 | 187 | 0.78 | ||
| 5 | 101.1 | 0.680 | 94.7 | 271.3 | 192 | 0.71 | ||
| 9 | 89.3 | 0.680 | 94.7 | 276.7 | 252 | 0.91 | ||
| 10 | 1425 × 150 × 0 | 90.5 | 0.000 | 00.0 | 210.0 | 200 | 0.95 | |
| 11 | 1425 × 150 × 75 | 96.8 | 0.680 | 68.3 | 229.1 | 223 | 0.97 | |
| 14 | 1425 × 150 × 104 | 39.5 | 0.680 | 93.3 | 165.2 | 195 | 1.18 | |
| 15 | 1425 × 150 × 104 | 60.9 | 0.680 | 94.7 | 213.6 | 211 | 0.99 | |
| S-40-LR | Taylor and Mullin [45] | 1425 × 150 × 75 | 41.0 | 0.5 | 69.2 | 135.3 | 130 | 0.96 |
| S-70-LR | 85.0 | 0.5 | 72.8 | 225.8 | 210 | 0.93 | ||
| G-40-LR | 38.6 | 0.5 | 65.7 | 131.2 | 145 | 1.11 | ||
| G-70-LR | 67.9 | 0.5 | 68.6 | 185.8 | 200 | 1.07 |
Disclaimer/Publisher’s Note: The statements, opinions and data contained in all publications are solely those of the individual author(s) and contributor(s) and not of MDPI and/or the editor(s). MDPI and/or the editor(s) disclaim responsibility for any injury to people or property resulting from any ideas, methods, instructions or products referred to in the content. |
© 2023 by the authors. Licensee MDPI, Basel, Switzerland. This article is an open access article distributed under the terms and conditions of the Creative Commons Attribution (CC BY) license (https://creativecommons.org/licenses/by/4.0/).
Share and Cite
Tharmarajah, G.; Taylor, S.; Robinson, D. Experimental and Numerical Investigation of Compressive Membrane Action in GFRP-Reinforced Concrete Slabs. Polymers 2023, 15, 1230. https://doi.org/10.3390/polym15051230
Tharmarajah G, Taylor S, Robinson D. Experimental and Numerical Investigation of Compressive Membrane Action in GFRP-Reinforced Concrete Slabs. Polymers. 2023; 15(5):1230. https://doi.org/10.3390/polym15051230
Chicago/Turabian StyleTharmarajah, Gobithas, Su Taylor, and Desmond Robinson. 2023. "Experimental and Numerical Investigation of Compressive Membrane Action in GFRP-Reinforced Concrete Slabs" Polymers 15, no. 5: 1230. https://doi.org/10.3390/polym15051230
APA StyleTharmarajah, G., Taylor, S., & Robinson, D. (2023). Experimental and Numerical Investigation of Compressive Membrane Action in GFRP-Reinforced Concrete Slabs. Polymers, 15(5), 1230. https://doi.org/10.3390/polym15051230