Article

Relaxation Model of the Relations between the Elastic Modulus and Thermal Expansivity of Thermosetting Polymers and FRPs

1
Department of Building Construction and Structures, South Ural State University, 454080 Chelyabinsk, Russia
2
Department of Town Planning, Engineering Systems, and Networks, South Ural State University, 454080 Chelyabinsk, Russia
*
Authors to whom correspondence should be addressed.
Polymers 2023, 15(3), 699; https://doi.org/10.3390/polym15030699
Submission received: 29 December 2022 / Revised: 22 January 2023 / Accepted: 24 January 2023 / Published: 30 January 2023
(This article belongs to the Section Smart and Functional Polymers)

Abstract

:
This research was completed in the development of studies devoted to relations between the elastic modulus (MoE) and thermal expansivity (CTe) of different materials. This study, based on experimental data, confirmed the models of the relations between MoE and CTe under normal and heating temperatures for thermosetting epoxy polymers and glass-fiber FRPs in two variants (unfilled and filled by mineral additives), after the usual glassing and prolonged thermal conditioning (thermo-relaxation). The experiment was based on dilatometric and elastic deformation testing. Two models of MoE/CTe were tested: Barker’s model and our authors relaxation model (MoE = f(CTe)), which is based on previous modelling of the non-linearity of the physical properties of polymers’ supramolecular structures. The result show that the models’ constants depend on composition; Barker’s model is applicable only to polymers with satisfying agreement degrees in the range 10–20%; our model is applicable to polymers and FRPs with satisfying agreement degrees in the range of 6–18%.

1. Introduction

Fiber-reinforced plastics are popular and effective modern materials with preferential properties, such as low weight and high strength (especially tensile), excellent corrosion resistance, fatigue resistance, and creep resistance. However, in the case of thermosetting polymers and composites under heating, these properties change sharply and dramatically even under temperatures greater than 50 °C. The prediction of elastic properties of various composite structures, including polymers, under normal and heating temperatures is critical in the design of structures, especially those subjected to transient thermomechanical actions. In structures such as gas and smoke chimneys and pipes for hot liquid transportation, different FRP joints in volume structures heating at temperatures higher than 40–50 °C influence the simultaneous non-linear changing of the modulus of elasticity (MoE) and the coefficient of thermal expansion (CTe). Thermal expansion (TE) and elasticity are the main properties that determine the deformability of the composite and the significant factors of polymers and FRP thermal stresses developing in real structures during exploitation [1,2,3,4,5,6]. Thus, the adequate relation between thermal expansibility and elasticity of materials fuels the decisions of many design tasks. The basic parameter of thermal expansivity is the CTE, and the basic parameter of elasticity is the MoE. Several studies have demonstrated the approximation of relations between MoE and CTE for different materials, including metals, minerals, glasses, polymers, and plastics. The most famous research in this area is the study of R.E. Barker Jr [7].
In Barker’s study, a common study into TE-MoE relation was completed with the following results [7]:
  • The groups of absolutely different materials with approximated TE-MoE relation were determined, and glassed materials, including polymers and FRP, were in this number.
  • The approximated CTE (∝)-MoE (E) relation under normal temperature was suggested with the following formula:
E 2 = 150 dyn cm 2 × 0 K 2 .
3.
A theoretical energy model of the TE-MoE relation is proposed. The theory is based on the determination of bonds’ harmonical/unharmonical vibration frequencies. The main sequence rule was described by the following function with factors of heat capacity (C) and temperature (T):
C p C v = 2 E T T
Analyzing these scientific results and taking into account the properties of polymers and FRPs, the following developing questions appear:
  • What is the accuracy of the approximated CTE-MoE relation for thermosetting polymers and FRPs? Research data includes a wide variety of approximations.
  • Is the approximated CTE-MoE relation dependent on temperature? The fact relation (1) between CTE and MoE does not depend on temperature, but the Barker’s theory model (2) has the temperature factor.
  • Could the CTE-MoE relation model be realized based on the physical properties of the polymer’s supramolecular structure? The energy model is very difficult to apply to the application and practical prediction of composites’ elasticity or expansion.
Few studies are concerned with the relationship between the thermal expansivity and elasticity of polymers and plastics. Most of them discover this problem in the research area of stress relaxation under thermal heating [8,9,10,11,12].
Thermal expansion is typical of glassed polymers and materials characterized by CTE, but much research points to the relationship between CTE and heating temperature. Experimental studies of the polymers’ CTE temperature dependence (including epoxy polymers) presented that the temperature expansion depends significantly on not only the temperature range [13,14,15,16,17,18,19], but also on the rate of temperature change [20]. The presence of static stresses during cyclic tests (heating–cooling) is also noted, which leads to a hysteresis effect on the relationship curve between the deformations and temperature.
In most cases, these phenomena described by the polymer molecule’s confirmation mechanisms resulted in 3D molecule replacement and distribution changes that influenced CTE [21,22,23,24]. Therefore, this confirmation mechanism results in simultaneous CTE and MoE non-linear changing due to stress relaxation and expansivity compensation. According to research on the elasticity of thermosetting polymers under heating, the non-linear decrease in elasticity is a result of the following processes:
  • Polymer molecules thermo-expanding with their morphology and pack changes [25,26].
  • Increased flexibility and torsion of inter-molecular bonds under heating [27,28].
Thus, the relation between CTE and MoE can be realized as the MoE function of CTE factor: MoE = f(CTE), where elasticity is due to thermal expansion.
Our previous modeling of polymers’ and FRPs’ supramolecular structures [29,30] determined non-linear models of MoE and CTE of polymers and FRPs under heating. The modeling of one-phase supramolecular structure included the spiral as the main element: polymer molecule analogue with non-linear expanding. However, the dilatometric experiment and one-phase model demonstrated an opposite agreement: the spiral model provides a non-linear decrease in CTe, the experiment demonstrated the non-linear decrease in CTe under heating [30]. Only the two-phase model where the spirals are shell joints between rigid and dense crystallized polymer domains agreed with real polymers’ and FRPs’ thermal expansion. The models discover non-linearity as a consequence of the conglomerate character of two-phase supramolecular structures where the domains (phase 1) are dense and rigid centers of polymerization and the spiral shell (phase 2) in the inter-transition zone (ITZ) is a softer joint of peripherical non-dense polymer molecules [30]. The domain works as elastic element with linear properties. The spiral works as a shifting element with the non-linear properties, providing the overall structure properties non-linearity. It determines thermal expansion compensation and stress relaxation during heating, as these properties change after the prolonged heating and thermo-relaxation. Due to that, our model is named as a relaxation supramolecular polymer and FRP model.
The relaxation model is the last development of our conglomerate supramolecular models of polymers and FRPs that agree with real elastic and thermal deformations under heating. Due to the included relaxation mechanism, the idea appeared that supramolecular thermal expansion and stress relaxation mechanisms are related. Thermal expansion influences the compensation of deformation in ITZ, leading to stress relaxation and MoE decreasing. Additionally, this is the way to the function MoE = f(CTe). It requires the development of the model, designing it under the tensile stress–strain condition.
Modeling the thermal expansion of polymer composites and hybrids is more complex and has to take into account the influence of all components on summary results of stress and expansion. It is important that the non-linearity of the MoE and CTE of polymers and FRPs under heating continues before achieving the glass transition temperature (Tg). After Tg, polymers lose their elasticity and CTE has a linear temperature dependence. So, the Tg is the breaking point of thermosetting polymers’ and FRPs’ deformability models.
All this consideration led to the research aim to develop the model of the relation between the MoE and CTE of thermosetting polymers and PRPs on the basis of the supramolecular structures’ parameters. Accordingly, the following scientific tasks were formulated:
  • To repeat the one-party samples’ experimental research of the MoE and CTE of thermosetted and thermo-relaxed filled and unfilled polymers and FRPs under heating including Tg to determine the accuracy of the approximated CTE-MoE relation.
  • To determinate the approximated CTE-MoE relations’ dependence on temperature and their universality limits.
  • To realize the supramolecular relaxation model in tensile stress–strain condition as a function MoE = f(CTE) of the CTE-MoE relation of thermosetting polymers and FRPs, using previous experience in the supramolecular modeling of composite elasticity and TE.

2. Materials and Methods

2.1. Materials

The materials used in this study were glassed polymers made of epoxy, phenolic, epoxy-phenolic resins, and fiberglass plastics made of epoxy and epoxy-phenolic resins and structural glass fabrics EZ-200 and T-23 (Table 1). In this study, new samples of compositions, repeated (1, 2) and non-repeated from previous studies, were used, allowing for the simultaneous MoE and CTe testing of the same series’ samples.
Epoxy binder (EP) for fiberglass plastic was created based on epoxy resin KER 828 (South Korea), which is an analog of the Russian resin ED-20, isomethyltetrahydrophthalic anhydride (ISOMTHFA) was used as a hardener, 2,4,6-tris-(dimethylaminomethyl)-phenol, produced under the brand name Alkophen, was used as a curing gas pedal. The weight ratio of the ES components is as follows: KER 828-52.5 %, IZOMTGFA-44.5 %, Alcophene-3 %. The components described below were used to produce the binders:
  • Epoxy resin KER 828 with the following main characteristics: epoxy group content (EGC) 5308 mmol/kg, epoxide equivalent weight (EEW) 188.5 g/eq, viscosity at 25 °C 12.7 Pa.s, HCl 116 mg/kg, and total chlorine 1011 mg/kg. Manufacturer: KUMHO P&B Chemicals, Gwangju, South Korea.
  • Hardener for epoxy resin methyl tetrahydrophthalic anhydride with the following main characteristics: viscosity at 25 °C 63 Pa.s, anhydride content 42.4%, volatile fraction content 0.55%, and free acid 0.1%. Manufacturer: ASAMBLY Chemicals company Ltd., Nanjing, China.
  • Alkofen (epoxy resin curing accelerator) with the following main characteristics: viscosity at 25 °C 150 Pa.s, molecular formula C15H27N3O, molecular weight 265, and amine value 600 mg KOH/g. Manufacturer: Epital JSC, Moscow, Russian Federation.
The components were mixed in the above proportions at room temperature of about 25 °C. Mixing to a homogeneous consistency was carried out mechanically with an electric drill with a mixing attachment.
Composites were produced by the introduction of glass fiber and mineral additives.
Glass fabric T-23 was produced in accordance with Russian standard GOST 19170-2001 and has the following characteristics:
-
Thickness, 0.27 + 0.01/−0.02 mm;
-
Surface density, 260 + 25/−25 g/m2;
-
Number of yarns per 1 cm of fabric on the basis 12 ± 1;
-
Number of yarns per 1 cm of fabric on the weft 8 ± 1;
-
Weave—plain;
-
Oiling agent—aminosilane.
The dry fly ash was chosen as a mineral additive, providing the glass structure with all materials used in Barker’s (the most effective for glassed materials) and our own models testing. A mineral additive was the dry fly ash (FA) from Refta electric station with square surface 4500 cm2/g; the dominating oxides are SiO2 (>70%), Al2O3 (>12%), Na2O+K2O (>6%). The fly ash proportion (Table 1) was determined by the technological optimum that provided the filling of glass fiber in the FRP shells’ filament winding formation.
Samples of fiberglass plastic and composites were produced in the form of plates of 15 × 15 cm. Cut sheets of glass fabric EZ-200 were calcined at 300 °C to remove the paraffin oiling agent immediately before impregnation with the binder. Glass fabric T-23 was not calcined. In total, the samples had 10 layers of glass fabric laid according to the scheme 0/90 (base/weft).
Glass-reinforced plastic and composite specimens were cured at 120 °C for 20 min in silicone molds while being loaded through Teflon-coated metal plates at a pressure of about 0.22 kPa. The cured specimens were then kept at 150 °C for 12 h. After that, beam samples were cut from the plates in the direction of the main axes of orthotropy, which were considered in this work.

2.2. Methods

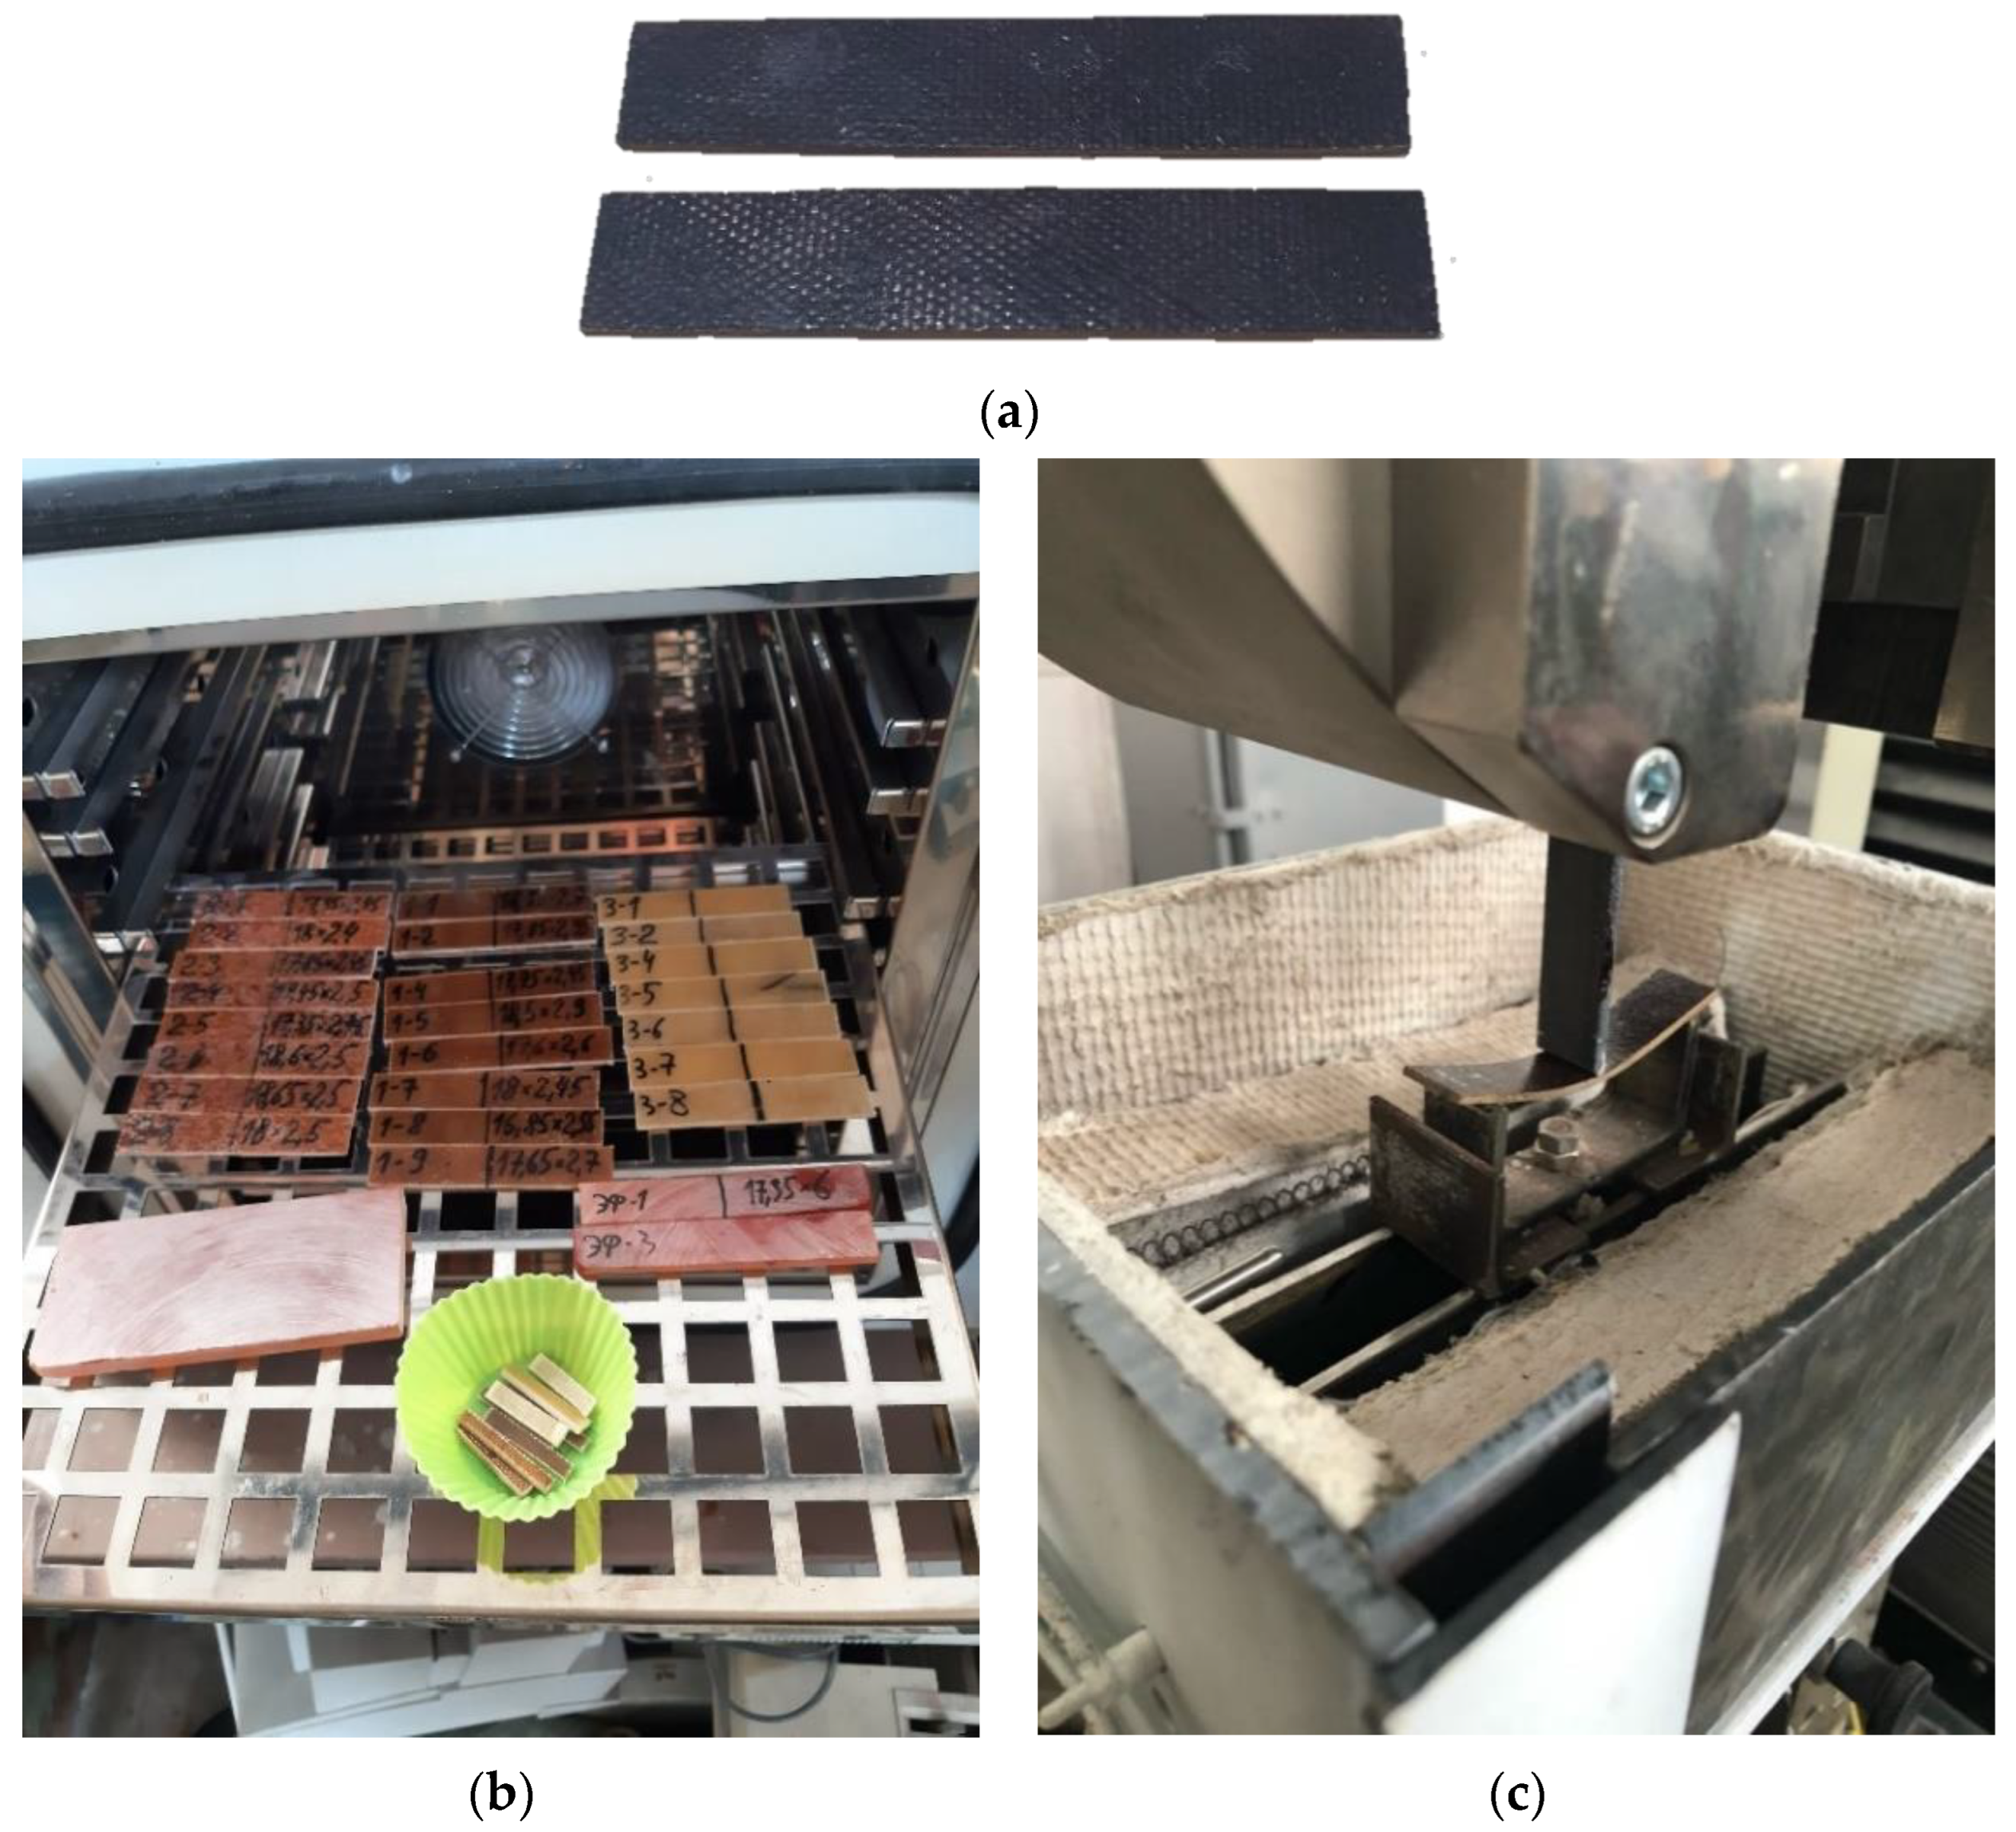
2.2.1. Long Heat Treatment (Thermal Aging)

After curing, some of the fiberglass samples were exposed to prolonged exposure at elevated temperatures, while the control series was stored under normal conditions. The long-term curing (hereinafter referred to simply as “curing”) of the samples at elevated temperatures was performed according to the following program: 168 h (one week) at 160 °C, 168 h at 190 °C, 168 h at 220 °C. After the heat treatment, the samples were cooled at a rate of about 1 °C per minute to 50 °C, removed from the laboratory oven, weighed, and then weighed and tested for three-point bending at temperatures from 25 to 180 °C.
The long heat treatment has a wide application background, because it reflects the real chimneys’ and pipes’ shells under exploiting heating (under 60–300°C depending on the mission) MoE and CTe change, which leads to a non-linear change in the structure’s deformability during the long exploiting heating. Consideration of this non-linearity can provide an improvement in the design of FRP structures.

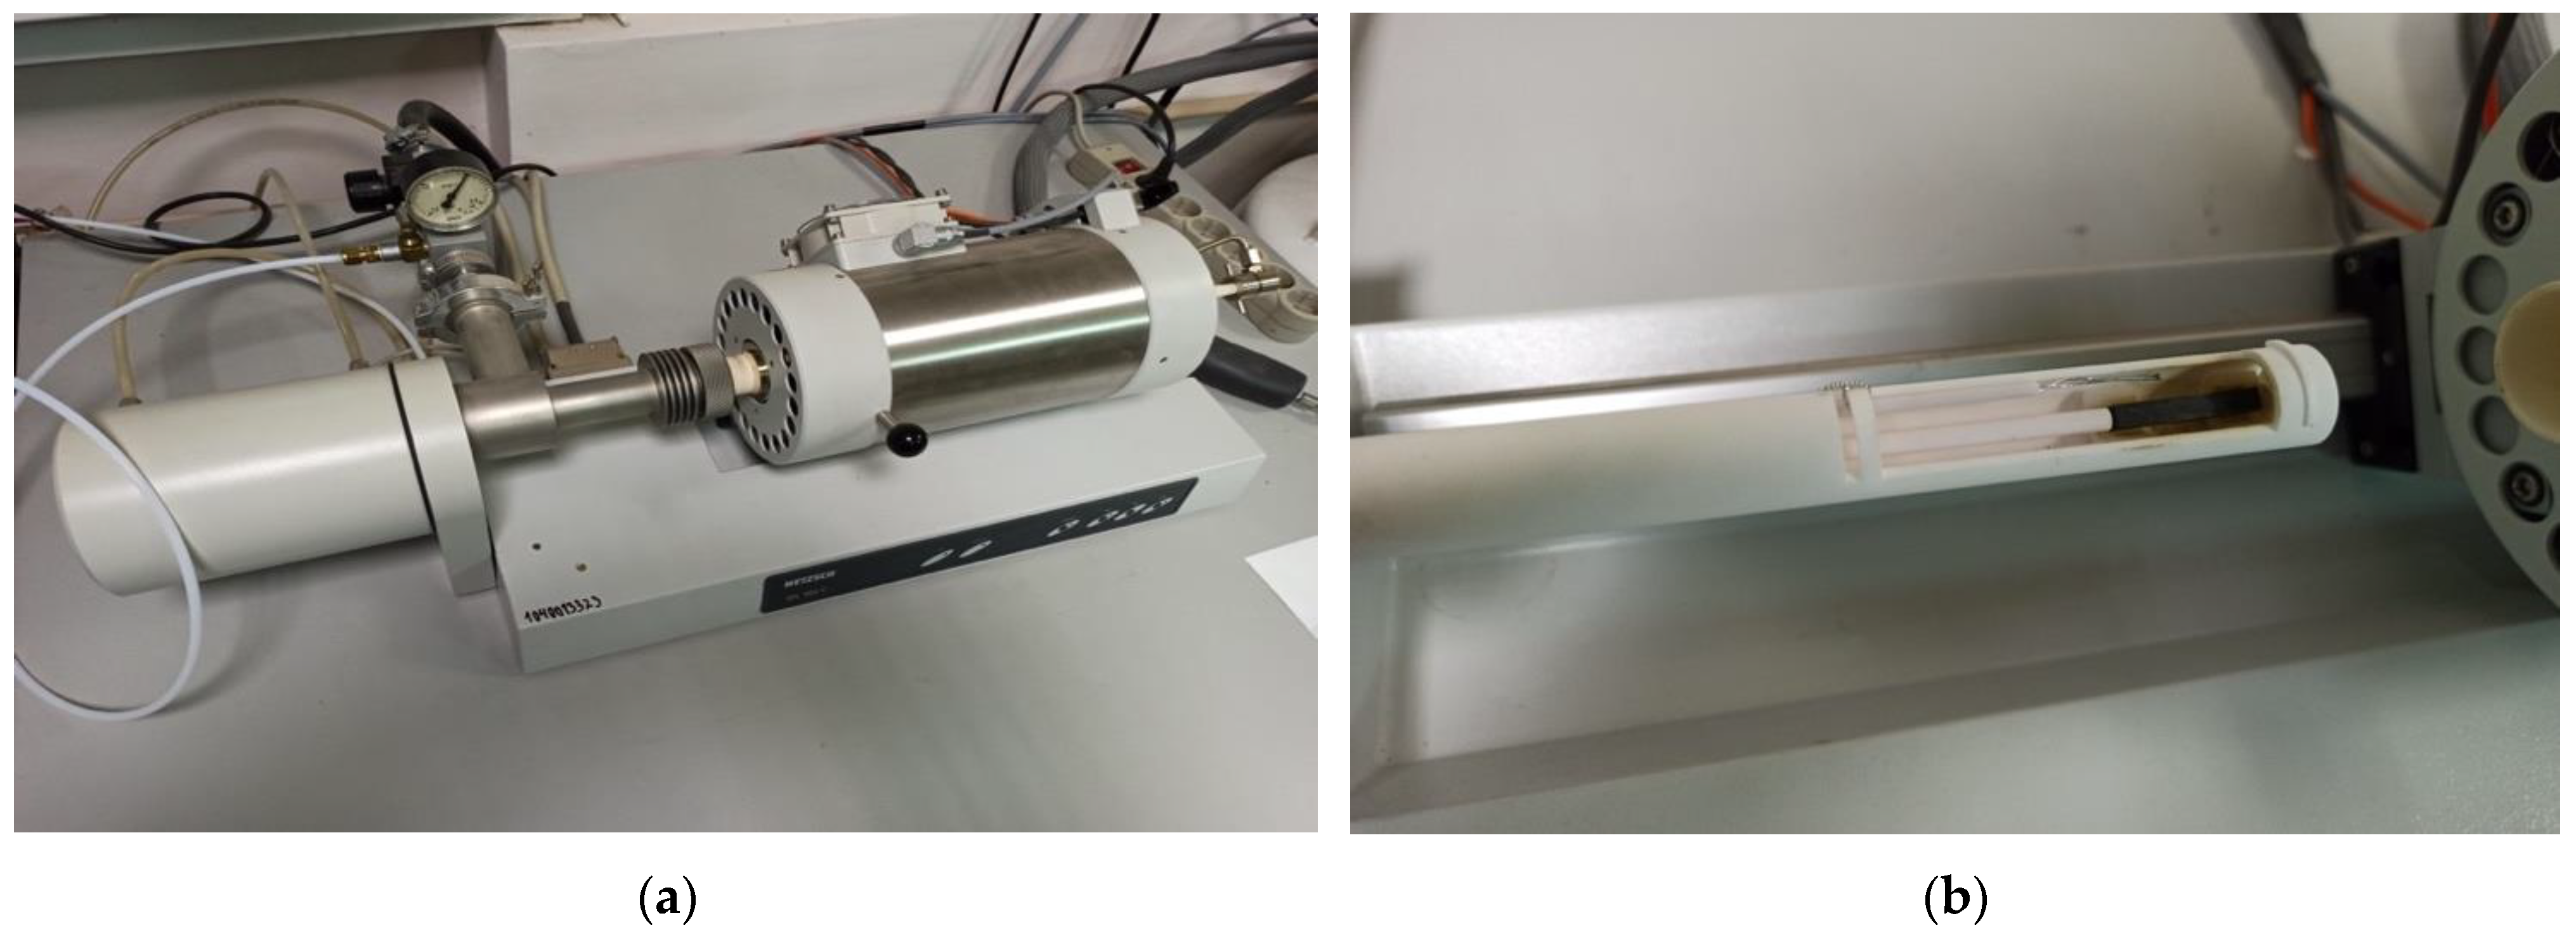
2.2.2. Dilatometric Investigation

Dilatometric investigations of the polymer and FRP samples were carried out with dilatometer Netzsch DIL 402 C (Figure 1). Investigation determined the CTE of solid materials analogically to previous research [28], using new series of samples allowed tests of the elasticity and TE for the same series.
Netzsch DIL 402 C technical characteristics:
-
Temperature range: 20–1500 °C;
-
Colding and heating intensity: 0.01 °C/min–50 K/min (5 K/min in experiment);
-
Etalon: Al2O3;
-
Linear range: 500 mcm;
-
Sample length l: max. 28 mm;
-
Sample diameter: max. 12 mm;
-
Expanding Δl accuracy: 0.125 nm;
-
Atmosphere: inertial dynamic argon with gas flowing controller.
At Figure 1, the samples’ installation in the dilatometer’s camera is shown. After the installation, the heating and thermal deformations of samples were controlled, thermal expanding automatically was calculated as a relation d l l under heating temperature, resulting in “temperature-relative deformation” curves presented in the experimental part.

2.2.3. Investigation of Elasticity Modulus under Heating

Polymer samples were tested for three-point bending on a Tinius Olsen h100ku test machine (Switzerland) in a specially made small-sized chamber that provides heating and maintains the temperature up to 300 °C. Three-point bending tests were carried out according to the Russian standard GOST R 56810-2015. The bending test is preferable in comparison with the tensile test for determining the modulus of elasticity at elevated temperatures due to a number of reasons. During the tensile test, the ends of the sample are in a pinched state in the clamps of the testing machine. Therefore, when heated, temperature stresses appear, which are difficult to separate from the applied mechanical stresses, occurred in the sample, in the determined modulus of elasticity. During the bending test, the sample can extend more freely when heated, because its ends are affected only by friction against the supports, so temperature stresses should not in this case introduce a significant error in the result of determining the modulus of elasticity.
According to the passport data, the load measurement accuracy of the Tinius Olsen h100ku machine is ±0.5% in the range from 0.2 to 100% of the allowable load of the installed force sensor (100 kN). The crosshead has a resolution of 0.001 mm with an accuracy of 0.01 mm. To eliminate the influence of machine stickiness, the displacement of the specimen center point under load was also controlled by a mechanical watch-type indicator mounted under the specimen. The difference in displacement readings on the crosshead and the dial indicator did not exceed 2%. The specimens were tested at a span of 70 mm (Figure 2).

3. Results

3.1. Experiment Results

On the basis of dilatometric and MoE under heating tests of the glassed thermosetting polymers, filled composites, and FRP samples, the thermal expanding and MoE curves dependent on heating temperature (to 200 °C) were calculated and presented in Figure 3, Figure 4, Figure 5 and Figure 6. The dependences include the clear epoxy (EP), filled epoxy composite (EP+FA), FRP (EP+T23), and filled epoxy FRP variants (EP+T23+FA) before and after thermo-relaxation (TR). Testing of MoE and CTe included only new samples of one series, providing the experiment with clearance and adequateness of the modelling of MoE/CTe relations.
These results have repeated and confirmed previous research [29,30] and basic conclusions:
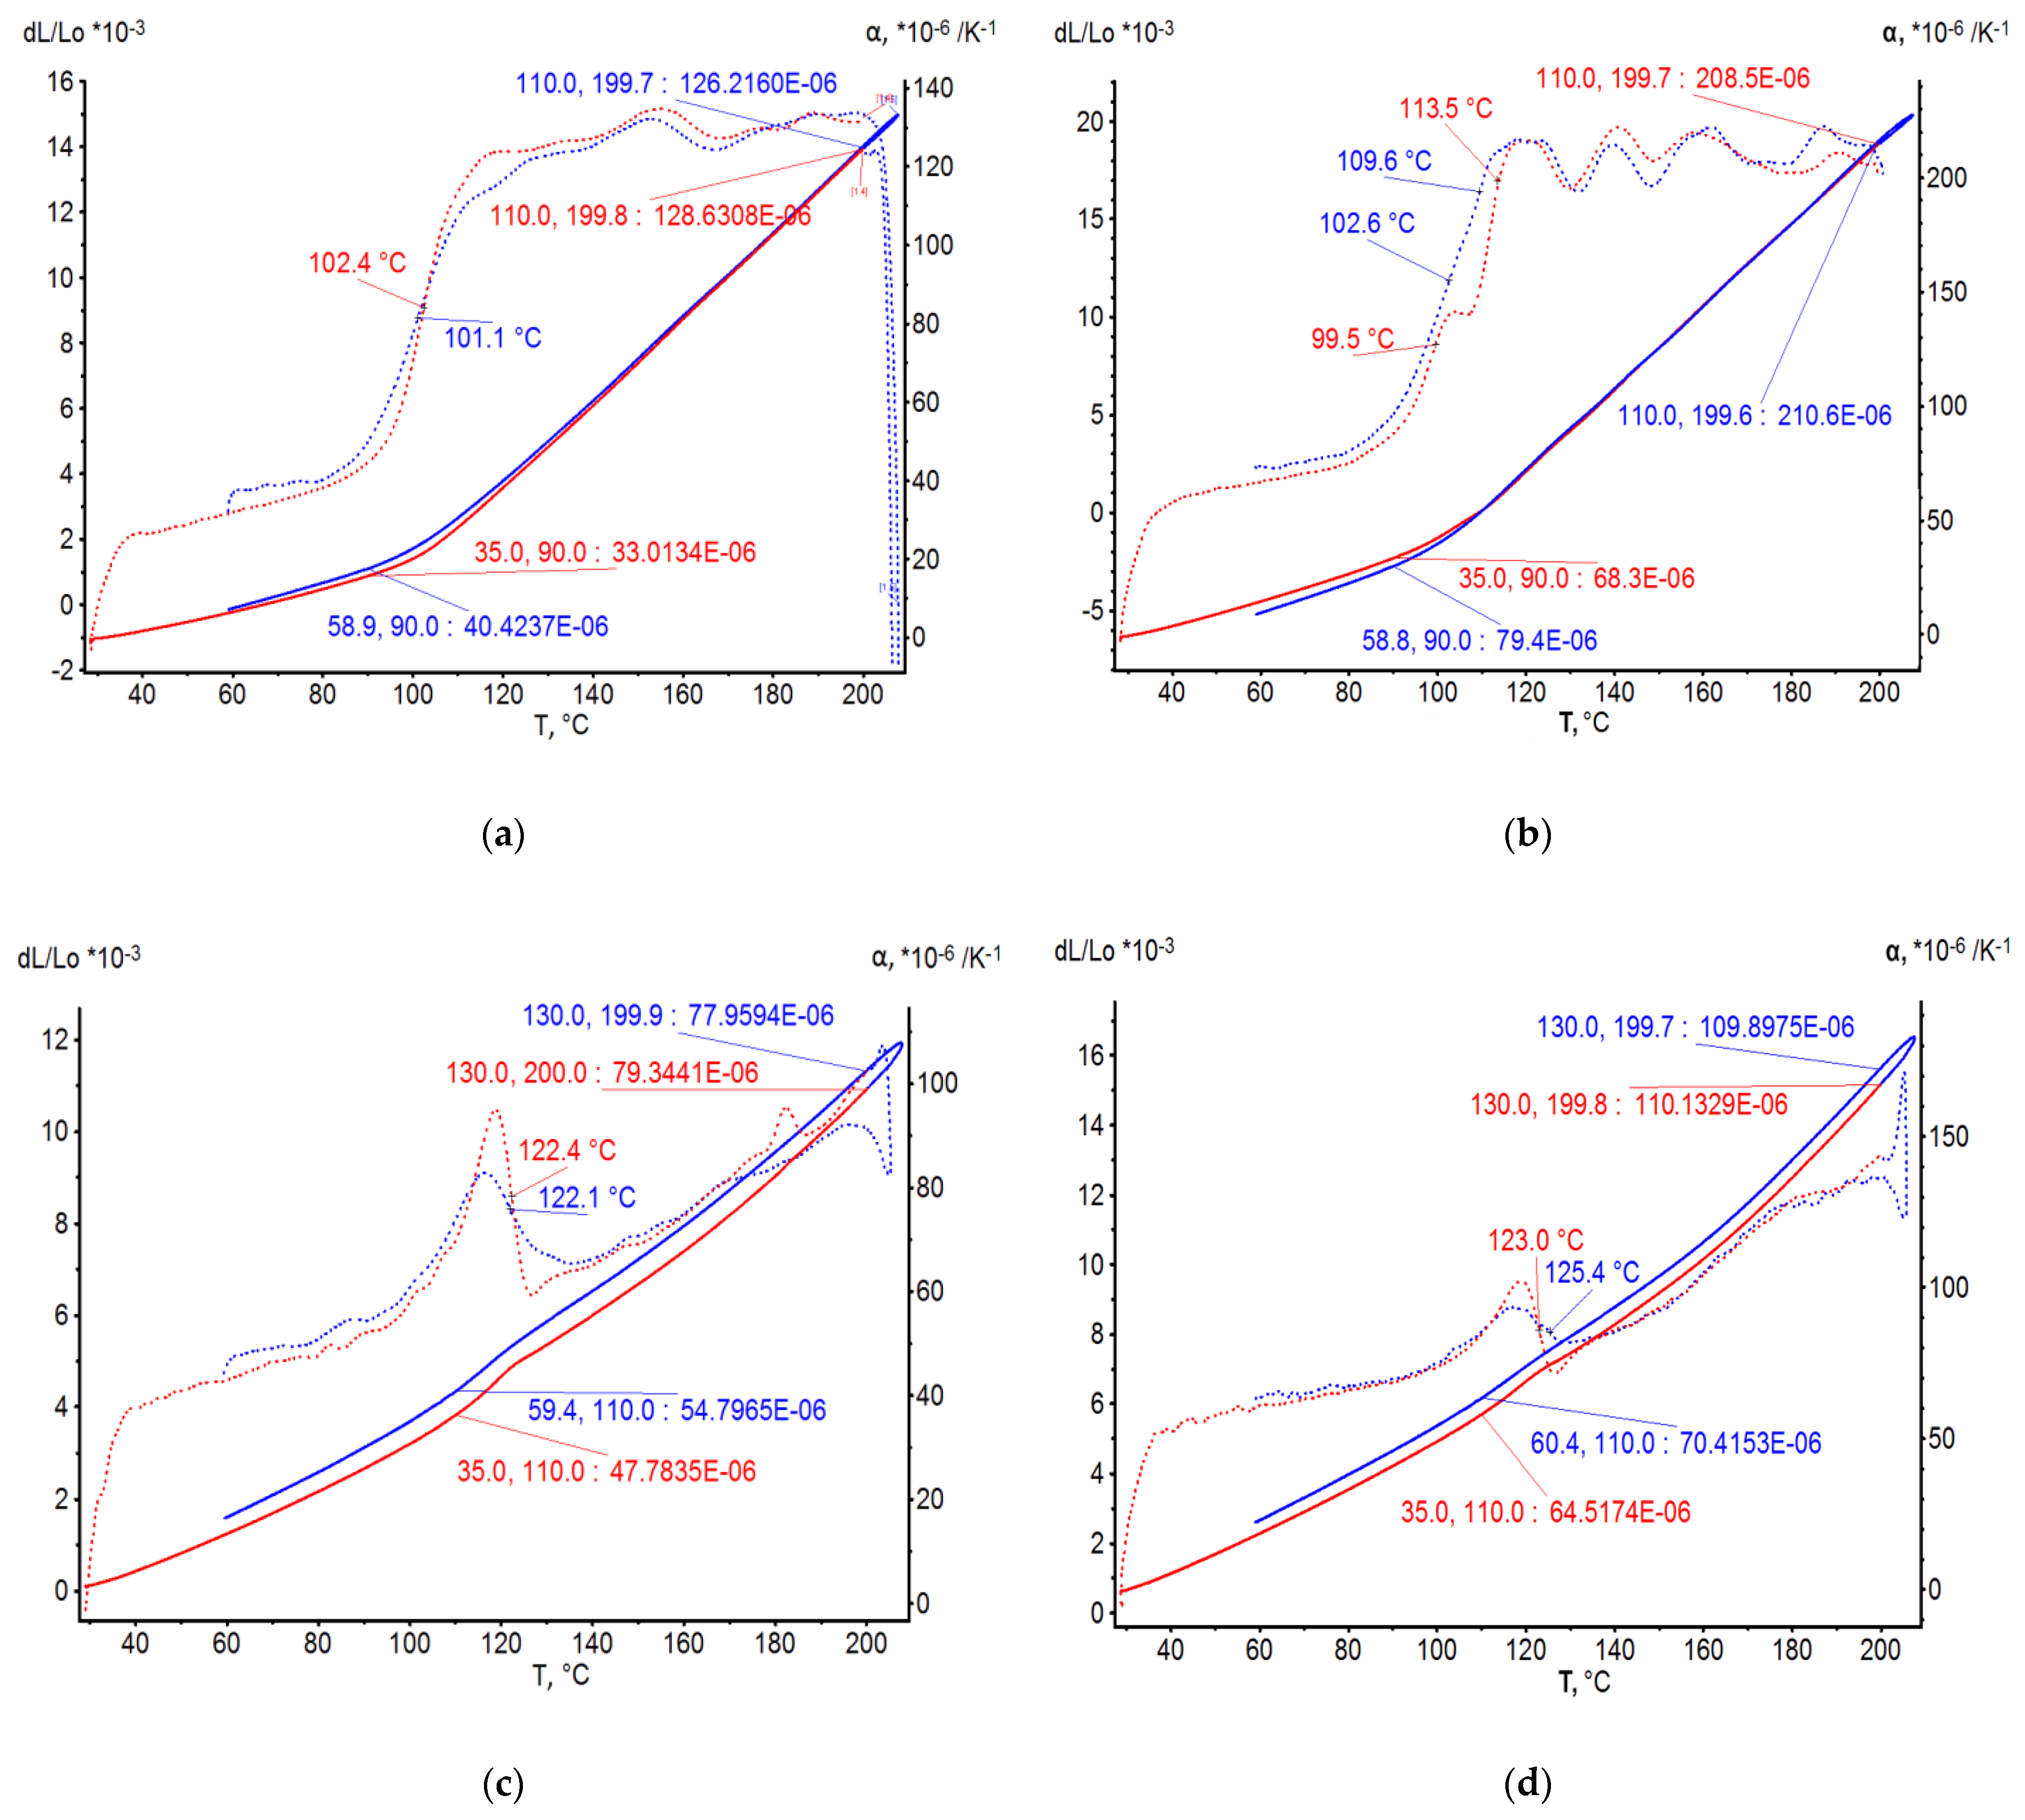
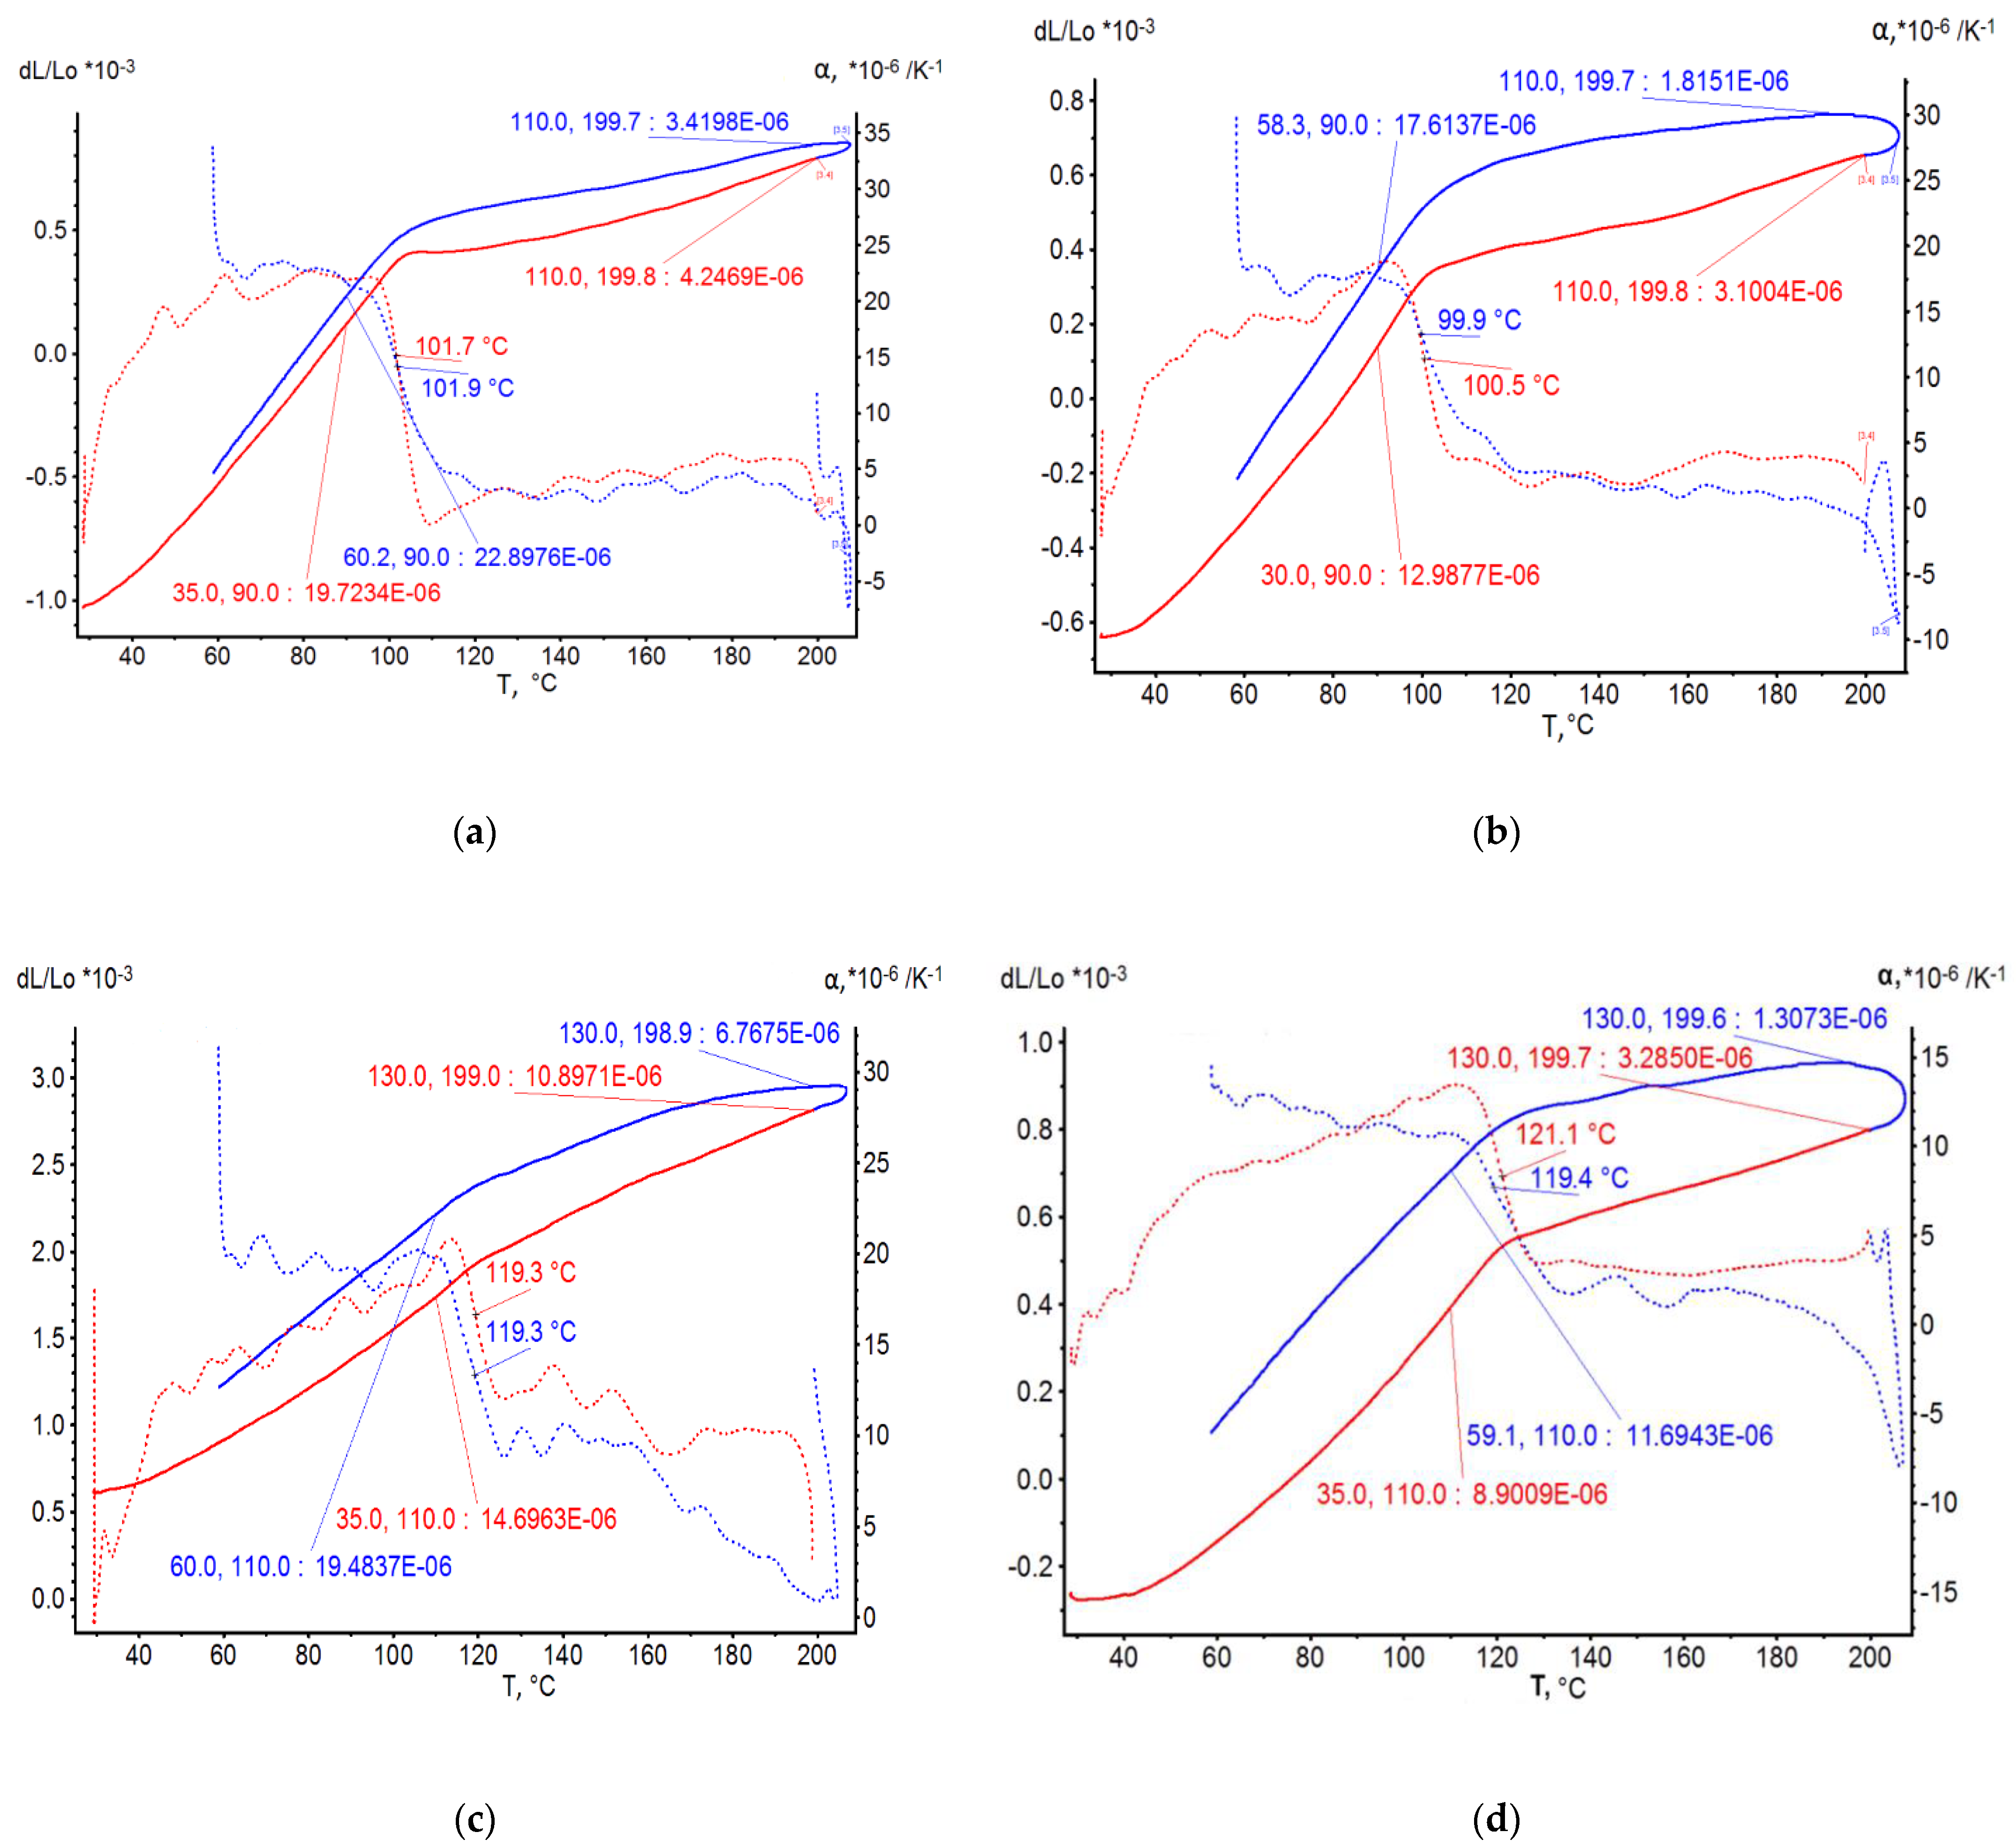
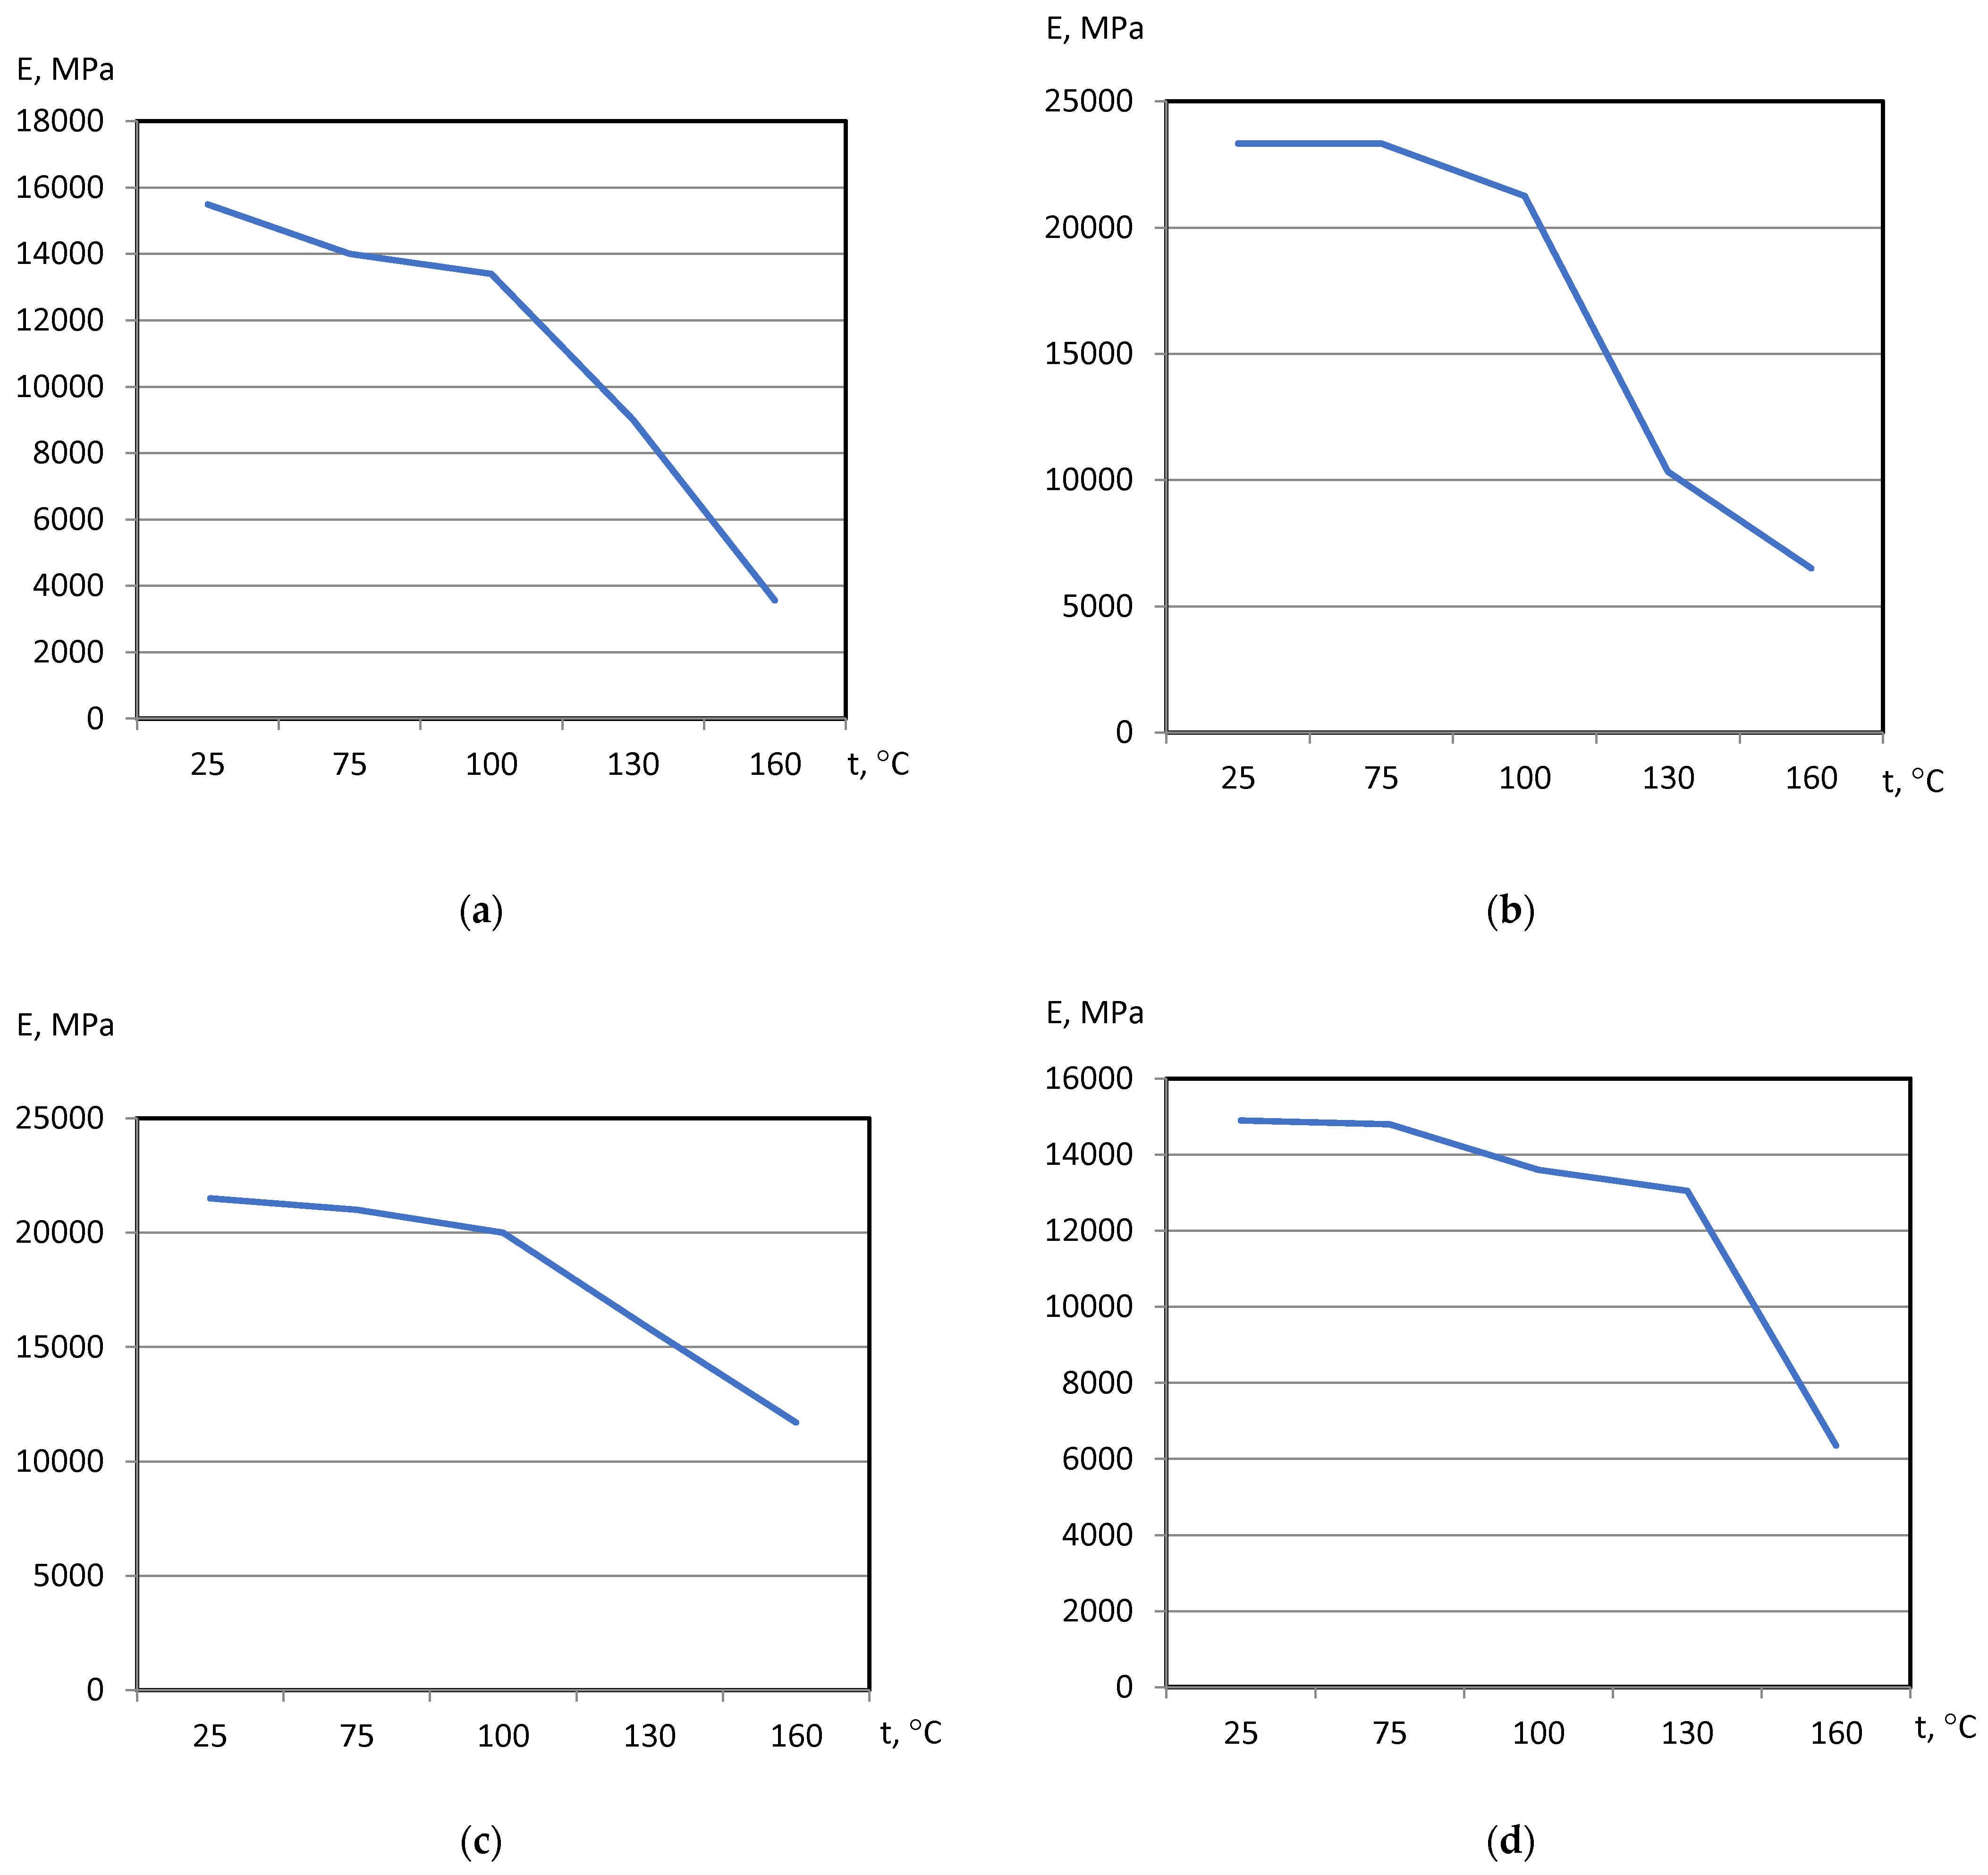
  • The polymers’ glassing temperature Tg can be determined, using a dilatation method, by the breaking point of the thermal expansion (TE) curve where non-linear TE with increase in CTE becomes linear with constant CTE.
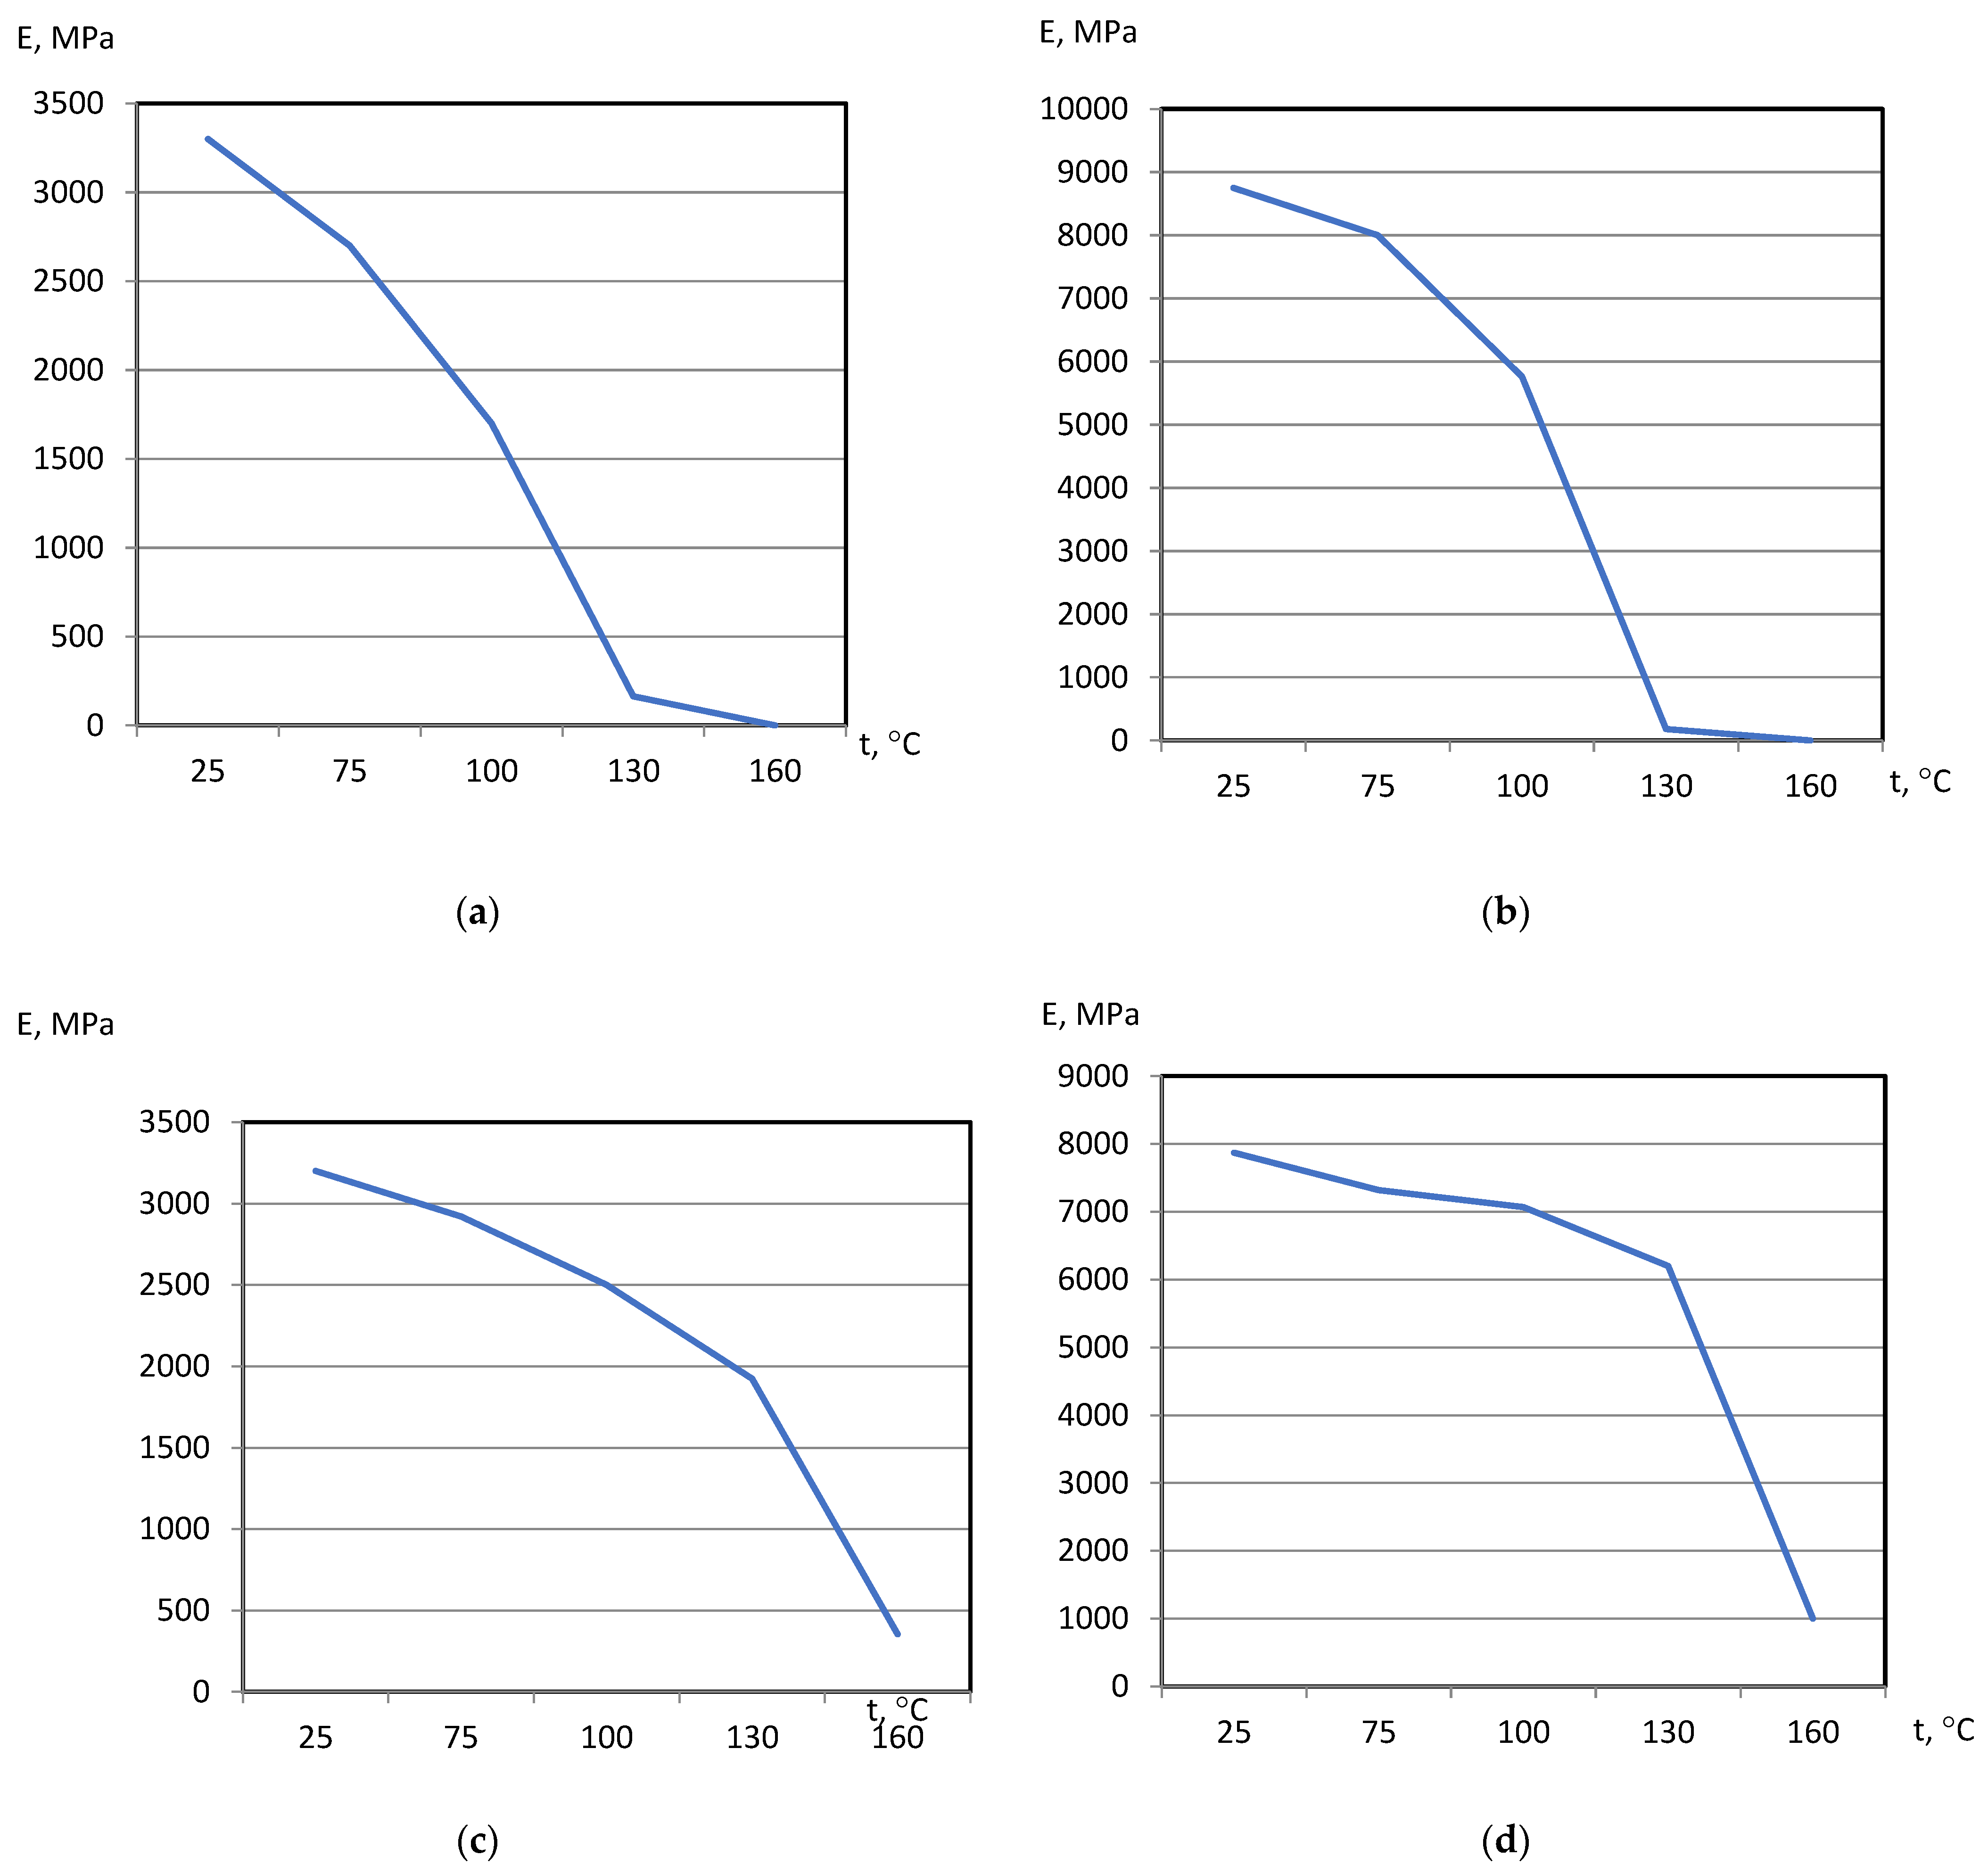
  • Under heating, after Tg, polymers lose their elasticity absolutely. The thermo-relaxed polymers, filled polymers, and FRPs, after Tg, lose elasticity sharply but can keep it, depending on the conditions, until relatively high temperatures (160–200 °C).
  • The long heat treatment (thermo-relaxation (TR)) significantly changes all the properties of polymers and polymer composites: the Tg grows to 30–40%, the TE decreases, the temperature of the coworking of components in composites and their elasticity keeps growing several times. After the long heat treatment, MoE at normal temperature recovers, but 3–5% less than before heating; however, MoE under repeating heating grows at high temperatures several times.
  • The TE curves have an inversive character in relation with MoE under heating curves. Generally, growth of CTe correlates with MoE decrease.

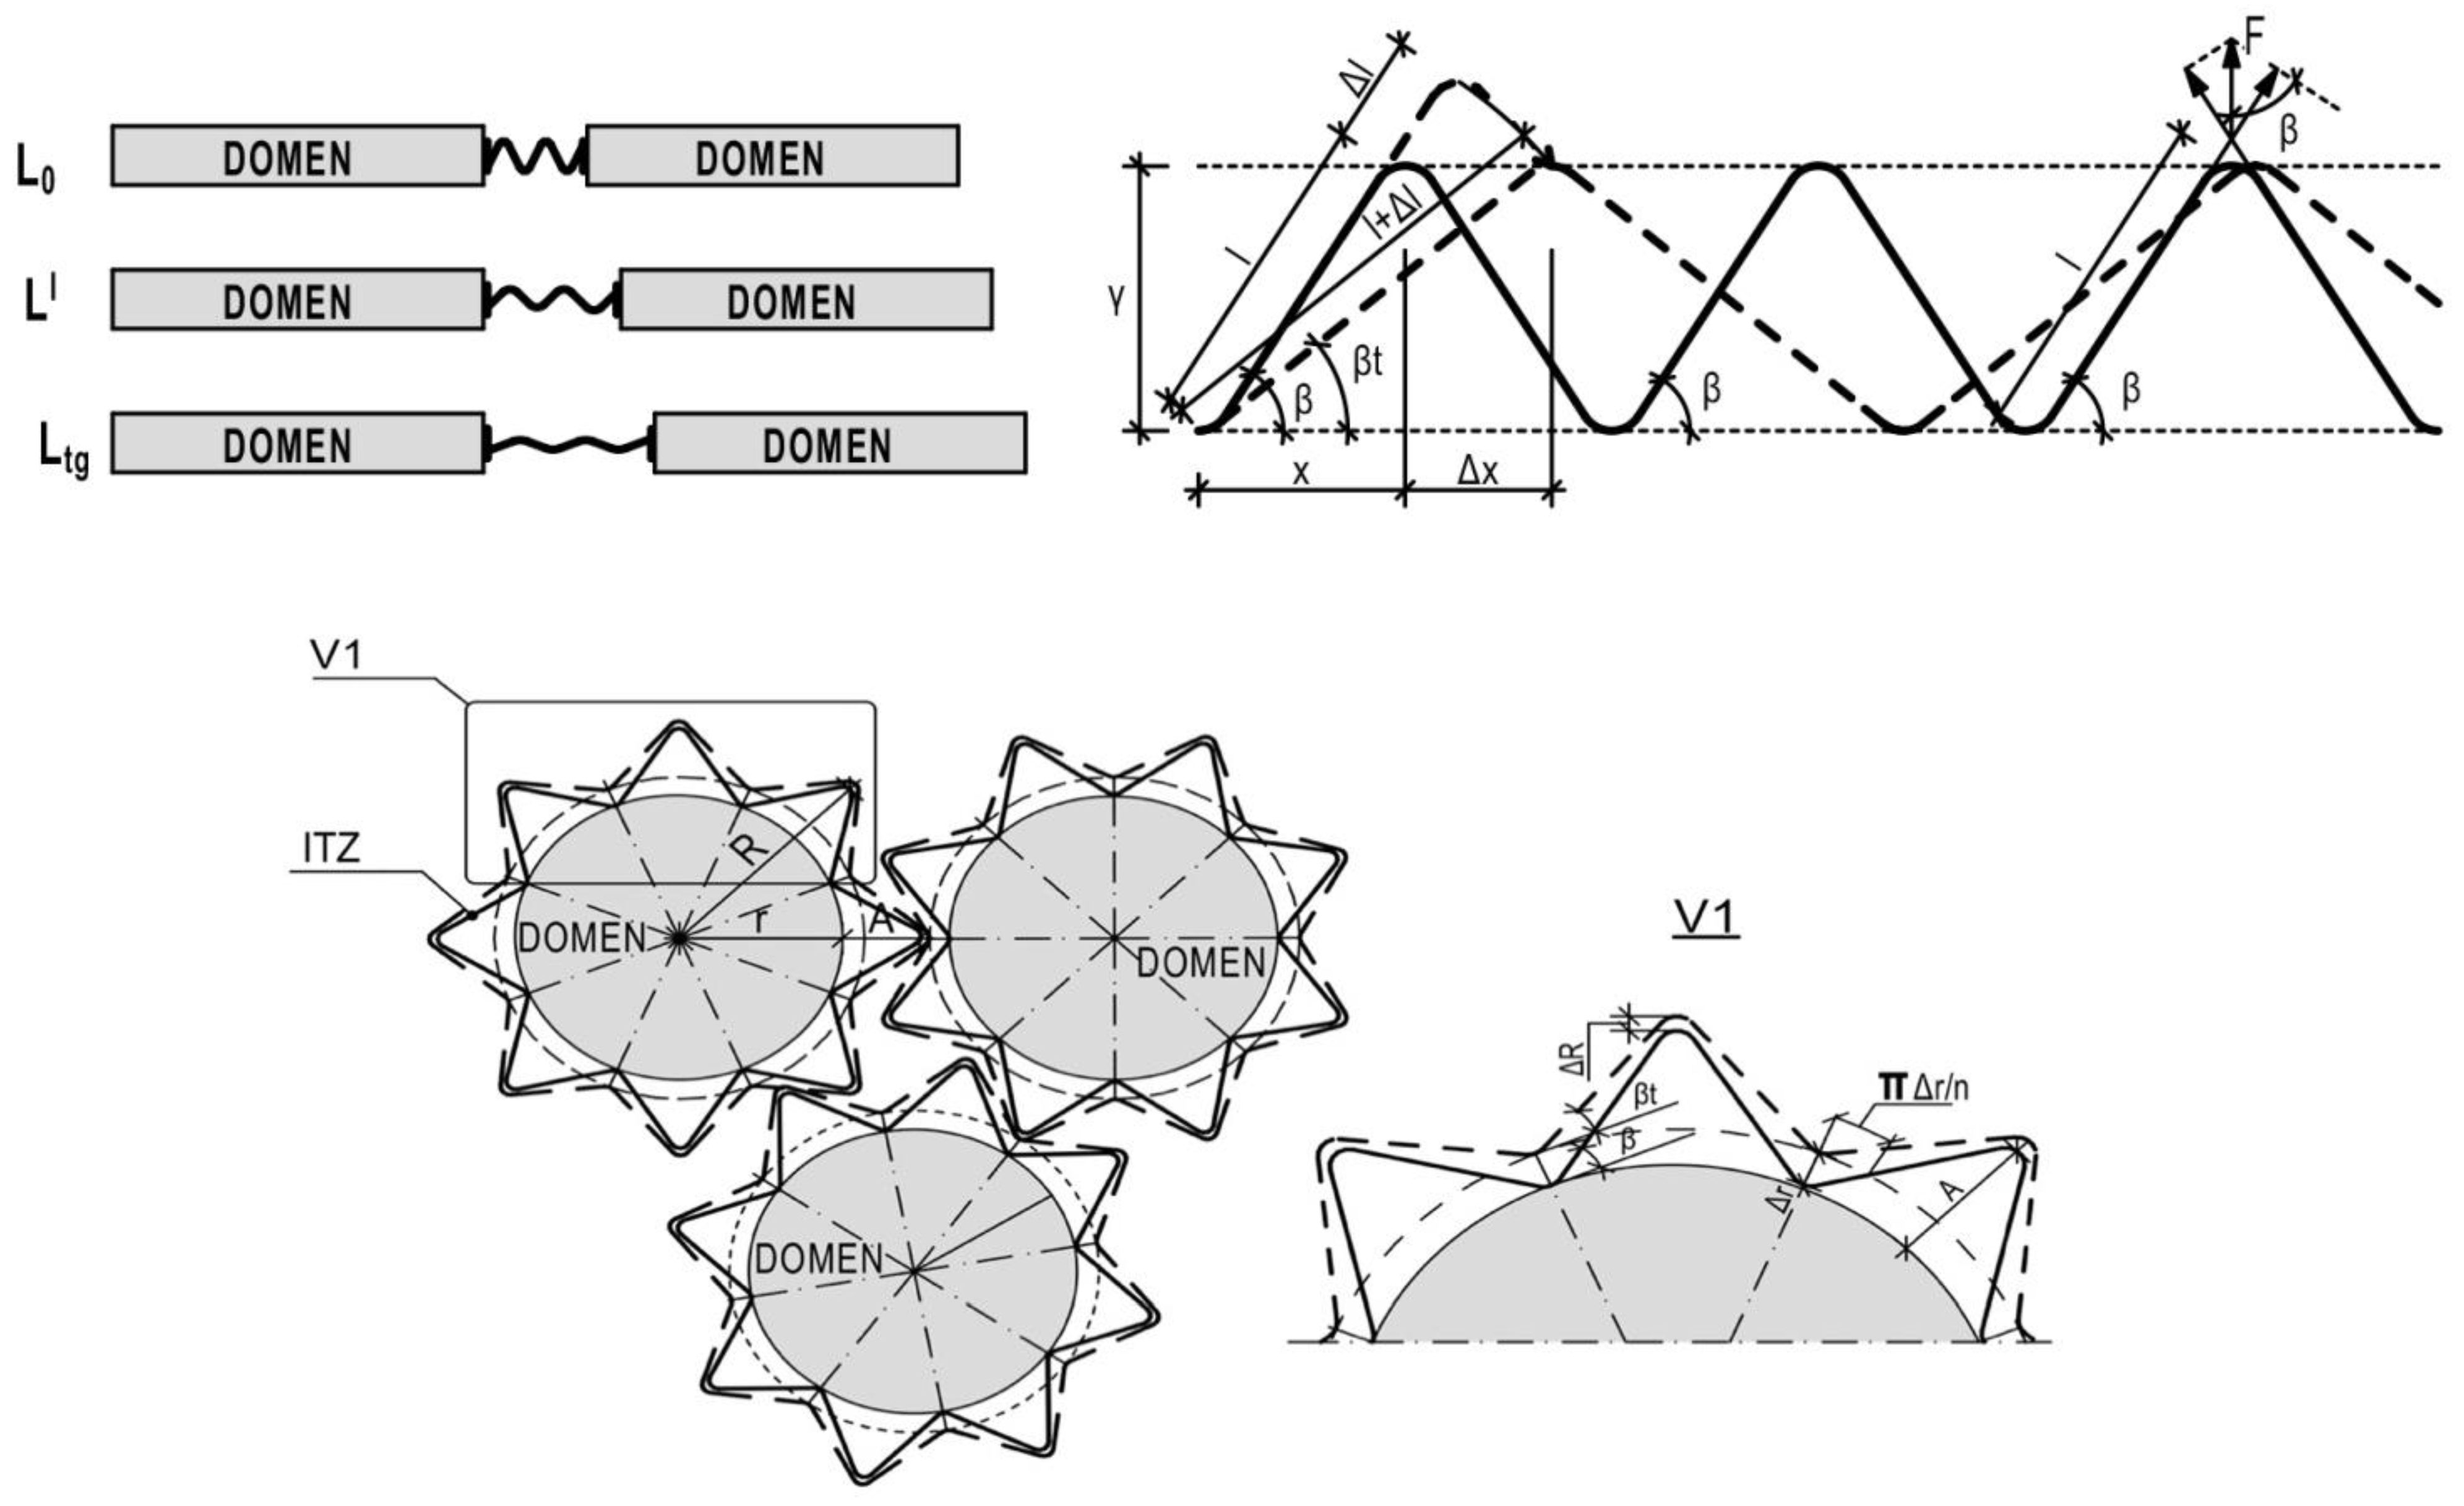
3.2. Supramolecular Relaxation Model of CTE-MoE Relation of Thermosetting Polymers and FRPs

The previous research proved the prediction compensational TE model of thermosetting polymers to be adequate [30]. The main specification of the compensational model is that in two-phase structure rigid elements (spherulitic domains) with linear TE are joined by softer elements (ITZ as the polymer macromolecules’ spiral shell) with shifting bonds and non-linear TE. The Tg is the extremum of the TE non-linear function. In Figure 7, the previous spiral and conglomerate 2D models were combined with a tensile stress–strain model where stresses and deformations influence the deformation of spirals, changing the spiral’s branch angle and separate forces and deformations by the X and Y axes. All deformations of domains influence the respective deformations of the shell. The tensile domain’s expansion by the Y-axis influences the spiral shell’s compression by the Y-axis and the shell’s tensile stress by the X-axis. It leads to the spiral’s branch angle β decreases, and a respective decrease (relaxation) in tensile force in the branch F × s i n β t and a growth of the tensile cross-section’s square S t . It results in the total tensile stress under heating relaxation, the growth of the shift modulus, and a decrease in the tensile MoE. The maximum expansibility is constant because of the spiral geometry—the spiral’s maximum expansibility by Y and compressibility by X.
Thus, on the basis of the supramolecular polymer’s model analysis, the following formulated hypothesis appeared: the total polymer’s expansion under heating leads to the ITZ spiral shell’s tensile stress along the domain surface (X-axis) and to the stress relaxation perpendicular to the domain surface (Y-axis) due to the growth of the stressed cross-section and to the redistribution of tensile forces in spiral branches by the X- and Y-axis.
For math modeling, the supramolecular model (Figure 7) was modified by the tensile forces F distributed in the polymer molecules’ branches, depending on the branch’s angle β . The following math model is developed from MoE under the definite heating temperature function:
E t = σ t ε t
σ t is the stress in the spiral branch.
ε t is the structure’s relative tensile strain/deformation under stress.
The following equations are the author’s development:
The spiral’s relative tensile strain/deformation ε t under tensile stress and heating to temperature t by the Y-axis is equal to the spiral branch’s relative deformation ε 0
ε t = Δ y y = Δ l × c o s β l × c o s β = Δ l l = ε 0
l is the length of the spiral polymer molecule’s branch (Figure 7, top scheme);
Δ l is the expansion of the spiral polymer molecule’s branch (Figure 7, top scheme);
β is the angle of the slope of the spiral polymer molecule’s branch (Figure 7, top scheme).
Decrease in the MoE under heating is related with tensile stress relaxation and a redistribution of tensile and shift stresses; the more heating, X-tensile and Y-compression, the less Y-tensile and more X-shift stresses.
E t = σ t ε 0
The tensile stress under definite temperature is the relation between tensile force in the spiral branch ( F t ) and total square ( S t ) of the cross section under a definite temperature.
σ t = F t S t = F × s i n β t b × l × c o s β t = σ 0 × t g β t
β t is the angle of the slope of the spiral polymer molecule’s branch under heating (Figure 7, bottom).
So, the MoE under a definite temperature depends on the MoE under normal temperature ( E 0 ) by the following model:
E t = E 0 × t g β t
Use Equation (14) of angle β t from the previous CTE modelling by compensational model [30].
E t = E 0 × t g [ a r c t g ( 1 α t α t g ) ] = E 0 ( 1 α t α t g )
α t —CTE under definite heating temperature;
α t g —CTE under glassing temperature Tg.
Thus, the constant of MoE-CTE relation means the basic MoE of the polymer’s supramolecular ITZ shell under a normal temperature.
E 0 = E t α t g α t g α t
For polymers under a normal temperature of 20 °C
E 0 = E 20 α t g α t g α 20
That is the searching function MoE = f(CTE) and relaxation model of MoE-CTE relation. Further investigation was devoted to the approbation of Barker’s and our own relaxation models.

3.3. Testing of Relations between MoE-CTE Models

The processing of the polymers’ and FRPs’ TE and MoE data included a determination of experimental CTE ( α t ) and MoE ( E t ) values under the same character temperatures from Figure 4, Figure 5, Figure 6 and Figure 7. After that, calculations from Barker’s (1) and our own relaxation (9) models were performed. Test of the models of the MoE-CTe relations concluded in correlation between two experimental data arrays of the MoE and CTe of polymers and FRPs. It was the reason for assessing the degree of agreement between the models using the variation coefficient C v . Variation coefficient was determined for every composition by the equation
C v = S y y ¯ 100 %
y ¯ —average arithmetical;
S y = i = 1 n ( y ¯ y i ) 2 is average square variation.
Finally, for each model the average C v was calculated. Only the parameters of compositions before Tg were considered in the calculation of variation characteristics. It is related with absolute changes in dependences’ character and mechanism after Tg. The results of the calculation of the parameters and functions are presented in Table 2.
The average C v for different models and compositions are presented in Table 3.
On the basis of these results the following conclusions were made:
  • The character of CTe and MoE under heating dependencies presents that a growth of polymer or composite CTe due to the heating or due to the growth of CTes’ of a composition’s additional components correlates with a decrease in MoE, which highlights the multiply functions in math modelling of the MoE-CTe relation.
  • The tested MoE-CTE relation models of definite composition under heating can be considered applicable and adequate under these conditions. The variation coefficients differ in a wide range from 6 to 36%, and the accuracy depends on temperature. The most variation is noticed closer to Tg. In summary, our own model has a higher agreement degree than Barker’s.
  • The tested MoE-CTE relation models do not have universality. Constants of the models depend on the composition type.
  • Authors relaxation model’s constant E0 characterizes the elasticity of definite polymer or composite. It is always more than the fact MoE of the composition and it suggests that this constant is the potential maximal MoE of the composition under the extreme density of its supramolecular structure.
  • The average Cv results lead to the conclusion that in conditions under the variation of no more than 20%, Barker’s model is adequate only for polymers and filled polymers, our own relaxation model has the most accuracy and is more applicable to polymers and composites overall.

4. Conclusions

In the results of the presented study all proposed questions were answered:
  • The tested MoE-CTe relation models are applicable and adequate under the conditions.
  • These models are adequate under heating.
  • The relaxation model on the basis of a supramolecular structure’s properties was realized and comparatively more accurate.
The dilatometric and MoE tests under the heating of thermosetting polymers, filled polymers, and FRPs were performed after normal thermosetting and prolonged thermo-relaxation. On the basis of the CTE and MoE parameters, the supramolecular relaxation model of MoE-CTE relation was realized, and our and Barker’s models were tested and compared.
The relaxation model has a compensational mechanism, realized due to the conglomerate two-phase structure of rigid domains and softer ITZ spiral shells with the effect of thermal expansion compensation and tensile stress relaxation under heating. The math function MoE = f(CTE) was developed. The constant of the relaxation model (9) is the potential maximum MoE of polymer or polymer composites in normal conditions with a maximal possible density of the polymer molecules’ pack in the supramolecular structure. Test and calculation data (Table 2) present that the potential elasticity of the structures of polymers and polymer composites are 1.5 to 2 times more than fact. It discovers an additive potency to find the ways of increasing the elasticity of polymers and FRPs under normal and high temperatures, modifying their supramolecular structures.
Finally, the relaxation model of MoE-CTE relation has been designed and proved and may be applied to operative values of thermal expansion by MoE parameters or vice versa: for MoE prediction by the parameters of thermal expansion TE, in the design of polymer composite structures, and in calculations of the thermal and thermo-mechanical stresses and deformations.

Author Contributions

Conceptualization, A.K.; methodology, A.K., M.M. and A.Z; validation, M.M.; formal analysis, A.K.; investigation, A.K., M.M., A.Z.; resources, D.U.; data curation, A.K.; writing—original draft preparation, A.K.; writing—review and editing, A.K. and M.M.; supervision, D.U.; project administration, M.M.; funding acquisition, D.U. and M.M. All authors have read and agreed to the published version of the manuscript.

Funding

Ministry of Science and Higher Education of the Russian Federation: State assignment FENU-2020-0019.

Institutional Review Board Statement

Not applicable.

Informed Consent Statement

Not applicable.

Data Availability Statement

The data that support the findings of this study are available on request from the corresponding author.

Conflicts of Interest

The authors declare no conflict of interest.

References

  1. Astashkin, V.M.; Mishnev, M.V. On the Development of the Manufacturing Technology of Fiberglass Cylindrical Shells of Gas Exhaust Trunks by Buildup Winding. Procedia Eng. 2016, 150, 1636–1642. [Google Scholar] [CrossRef] [Green Version]
  2. Bochicchio, V.A. FRP chimney liners for power plant flue gas desulfurization—A chimney supplier’s perspective. In Proceedings of the NACE—International Corrosion Conference Series, Houston, TX, USA, 13–17 March 2011. [Google Scholar]
  3. Damatty, A.A.; Awad, A.S.; Vickery, B.J. Thermal analysis of FRP chimneys using consistent laminated shell element. Thin Walled Struct. 2000, 37, 57–76. [Google Scholar] [CrossRef]
  4. García-Moreno, I.; Caminero, M.A.; Rodriguez, G.P.; Lopez-Cela, J.J. Effect of thermal ageing on the impact and flexural damage behaviour of carbon fibre-reinforced epoxy laminates. Polymers 2019, 11, 80. [Google Scholar] [CrossRef] [PubMed] [Green Version]
  5. Lal, H.M.; Uthaman, A.; Li, C.; Xian, G.; Thomas, S. Combined effects of cyclic/sustained bending loading and water immersion on the interface shear strength of carbon/glass fiber reinforced polymer hybrid rods for bridge cable. Constr. Build. Mater. 2022, 314, 125587. [Google Scholar] [CrossRef]
  6. Wang, T.; Yasuda, K.; Nishikawa, H. Study on the SPCC and CFRTP Hybrid Joint Performance Produced with Additional Nylon-6 Interlayer by Ultrasonic Plastic Welding. Polymers 2022, 14, 5235. [Google Scholar] [CrossRef]
  7. Barker, R.E., Jr. An Approximate Relation Between Elastic Moduli and Thermal Expansivities. J. Appl. Phys. 1963, 34, 107. [Google Scholar] [CrossRef]
  8. Lomakin, V.A.; Ogibalov, P.M.; Teters, G.A. Problems of the theory of deformation of polymeric materials. Polym. Mech. 1972, 8, 377–385. [Google Scholar] [CrossRef]
  9. Vashisth, A.; Ashraf, C.; Bakis, C.E.; van Duin, A.C.T. Effect of chemical structure on thermo-mechanical properties of epoxy polymers: Comparison of accelerated ReaxFF simulations and experiments. Polymer 2018, 158, 354–363. [Google Scholar] [CrossRef]
  10. Kuperman, A.M.; Turusov, R.A.; Gorenberg, A.Y. Study of elastic and strength properties of hybrid and gradient polymer composites. Compos. Mech. Comput. Appl. 2010, 1, 361–373. [Google Scholar] [CrossRef]
  11. Lobanov, D.S.; Slovikov, S.V. Mechanical Behavior of a Unidirectional Basalt-Fiber-Reinforced Plastic Under Thermomechanical Loadings. Mech. Compos. Mater. 2018, 54, 351–358. [Google Scholar] [CrossRef]
  12. Wong, C.P.; Bollampally, R.S. Thermal conductivity, elastic modulus, and coefficient of thermal expansion of polymer composites filled with ceramic particles for electronic packaging. J. Appl. Polym. Sci. 1999, 74, 3396–3403. [Google Scholar] [CrossRef]
  13. Davy, K.W.M.; Braden, M. Thermal expansion of glassy polymers. Biomaterials 1992, 13, 1043–1046. [Google Scholar] [CrossRef] [PubMed]
  14. Schwarz, G. Thermal expansion of polymers from 4.2 K to room temperature. Cryogenics 1988, 28, 248–254. [Google Scholar] [CrossRef]
  15. Foster, J.C.; Staiger, C.L.; Dugger, J.W.; Redline, E.M. Tuning Epoxy Thermomechanics via Thermal Isomerization: A Route to Negative Coefficient of Thermal Expansion Materials. ACS Macro Lett. 2021, 10, 940–944. [Google Scholar] [CrossRef] [PubMed]
  16. Heinle, M.; Drummer, D. Temperature-dependent coefficient of thermal expansion (CTE) of injection molded, short-glass-fiber-reinforced polymers. Polym. Eng. Sci. 2015, 55, 2661–2668. [Google Scholar] [CrossRef]
  17. Vaggar, G.B.; Kamate, S.C.; Badyankal, P.V. Thermal properties characterization of glass fiber hybrid polymer composite materials. Int. J. Eng. Technol. 2018, 7, 455–458. [Google Scholar] [CrossRef]
  18. Baschek, G.; Hartwig, G. Parameters influencing the thermal expansion of polymers and fibre composites. Cryogenics 1998, 38, 99–103. [Google Scholar] [CrossRef]
  19. Ribeiro, M.C.S.; Reis, J.M.L.; Ferreira, A.J.M.; Marques, A.T. Thermal expansion of epoxy and polyester polymer mortars—Plain mortars and fibre-reinforced mortars. Polym. Test. 2003, 22, 849–857. [Google Scholar] [CrossRef]
  20. Shardakov, I.N.; Trufanov, A.N. Identification of the temperature dependence of the thermal expansion coefficient of polymers. Polymers 2021, 13, 3035. [Google Scholar] [CrossRef]
  21. Sun, Q.; Jin, K.; Huang, Y.; Guo, J.; Rungrotmongkol, T.; Maitarad, P.; Wang, C. Influence of conformational change of chain unit on the intrinsic negative thermal expansion of polymers. Chin. Chem. Lett. 2021, 32, 1515–1518. [Google Scholar] [CrossRef]
  22. Abbasi, A.; Mondali, M. An analytical approach to determine coefficients of thermal expansion of CNT/polymer nanocomposites. Proc. Inst. Mech. Eng. Part C J. Mech. Eng. Sci. 2020, 234, 4268–4276. [Google Scholar] [CrossRef]
  23. Shen, X.; Viney, C.; Johnson, E.R.; Wang, C.; Lu, J.Q. Large negative thermal expansion of a polymer driven by a submolecular conformational change. Nat. Chem. 2013, 5, 1035–1041. [Google Scholar] [CrossRef] [PubMed]
  24. Rousseau, I.A.; Xie, T. Shape memory epoxy: Composition, structure, properties and shape memory performances. J. Mater. Chem. 2010, 20, 3431–3441. [Google Scholar] [CrossRef]
  25. Flory, P.J.; Erman, B. Theory of elasticity of polymer networks. 3. Macromolecules 1982, 15, 800–806. [Google Scholar] [CrossRef]
  26. Dill, K.A.; Bromberg, S.; Stigter, D. Polymer Elasticity & Collapse. In Molecular Driving Forces; Garland Science: New York, NY, USA, 2018; pp. 659–684. [Google Scholar] [CrossRef]
  27. Slutsker, A.I.; Sanphirova, T.P.; Yastrebinskii, A.A.; Kuksenko, V.S. Structure and reversible deformability of oriented crystallizing polymers. J. Polym. Sci. Part C Polym. Symp. 1967, 16, 4093–4101. [Google Scholar] [CrossRef]
  28. Chan, C.H.; Chia, C.H.; Thomas, S. Physical Chemistry of Macromolecules: Macro to Nanoscales; Apple Academic Press: Palm Bay, FL, USA, 2014. [Google Scholar]
  29. Mishnev, M.; Korolev, A.; Ekaterina, B.; Dmitrii, U. Effect of Long-Term Thermal Relaxation of Epoxy Binder on Thermoelasticity of Fiberglass Plastics: Multiscale Modeling and Experiments. Polymers 2022, 14, 1712. [Google Scholar] [CrossRef]
  30. Korolev, A.; Mishnev, M.; Ulrikh, D.V. Non-Linearity of Thermosetting Polymers and GRPs’ Thermal Expanding: Experimental Study and Modeling. Polymers 2022, 14, 4281. [Google Scholar] [CrossRef]
Figure 1. Dilatometer Netzsch DIL 402 C (a) in process; (b) with sample (brown).
Polymers 15 00699 g001
Figure 2. Appearance of fiberglass specimens after prolonged conditioning at elevated temperatures (a), specimens prepared for exposure (b), and three-point bending process at room temperature (c).
Polymers 15 00699 g002
Figure 3. Polymers’ TE curves: (a) EP, (b) EP+FA, (c) EP after T-relax, (d) EP+FA after T-relax.
Polymers 15 00699 g003
Figure 4. Polymers’ MoE under heating curves: (a) EP, (b) EP+FA, (c) EP after TR, (d) EP+FA after TR.
Polymers 15 00699 g004
Figure 5. FRPs’ TE curves: (a) EP+T23, (b) EP+T23+FA, (c) EP+T23 after T-relax, (d) EP+T23+FA after TR.
Polymers 15 00699 g005
Figure 6. FRPs’ MoE under heating curves: FRPs’ TE curves: (a) EP+T23, (b) EP+T23+FA, (c) EP+T23 after T-relax, (d) EP+T23+FA after TR.
Polymers 15 00699 g006
Figure 7. Two-phase relaxation model of polymer expanding under heating.
Polymers 15 00699 g007
Table 1. Types of composites and FRPs investigated.
CompositeNameDilatometryModulus of Elasticity
1Epoxy binderEP++
2Epoxy binder + glass fabric T23EP+T23++
3Epoxy binder 70% + fly ash 30% EP+FA++
4Epoxy binder 70% + fly ash 30% + glass fabric T23EP+T23+FA++
Table 2. Results of calculation of MoE-CTE relation models’ parameters and agreement degrees.
CompositionParameter/FunctionT, °C AverageCv, %
2075100130160αtg
EP E t , MPa3300270017001640---
α t , K−1, 10621.026.038.057.0125.9128.0--
E 2 , MPa.K21,455,3001,825,2002,454,800532,8360-1,911,76737
E 0 = E t α t g α t g α t , MPa3948338824181670-325134
EP/TR E t , MPa3200292025001924354---
α t , K−1, 10636.040.042.650.454.079.3--
E 2 , MPa.K24,147,2004,672,0004,536,9004,887,2671,032,264-4,560,84112
E 0 = E t α t g α t g α t , MPa5861589254025279360-560810
EP+FA E t , MPa 8750 800057601800---
α t , K−1, 106 55.0 60.073.0100.0125.9208.0--
E 2 , MPa.K2 26 , 468 , 750 28,800,00030,695,0401,800,0000-28,654,59710
E 0 = E t α t g α t g α t , MPa 11 , 895 11,24388753470-10,67121
EP+FA/TR E t , MPa 7870 7320 707062001000---
α t , K−1, 106 50.0 54.0 60.063.870.0110.0--
E 2 , MPa.K2 19 , 675 , 000 21 , 345 , 120 25,452,00025,236,7284,900,000-22,927,21222
E 0 = E t α t g α t g α t , MPa 14 , 428 14 , 379 15,55414,7621009-14,7816
EP+T23 E t , MPa 15 , 490 14 , 000 13 , 400 90003560---
α t , K−1, 106 10.0 11.0 12.5 10.28.3022.0--
E 2 , MPa.K2 1 , 549 , 000 1 , 694 , 000 2 , 093 , 750 936,360245,248-1,778,91722
E 0 = E t α t g α t g α t , MPa 28 , 398 28 , 000 31 , 032 16,7803562-29,1438
EP+T23/TR E t , MPa 21 , 500 21 , 000 20 , 000 15 , 800 11,700---
α t , K−1, 106 9.5 10.0 12.0 13.8 13.319.4--
E 2 , MPa.K2 1 , 940 , 375 2 , 100 , 000 2 , 880 , 000 3 , 008 , 952 2,069,613-2,482,33138
E 0 = E t α t g α t g α t , MPa 42 , 131 43,340 52 , 432 54 , 736 11,707-48,16023
EP+T23+FA E t , MPa 23 , 330 23 , 330 21 , 250 10 , 330 6500 ---
α t , K−1, 106 16.0 17.0 18.0 14.0 11.7 22.9--
E 2 , MPa.K2 5 , 972 , 480 6 , 742 , 370 6 , 885 , 000 2 , 024 , 680 889 , 785 -6,533,28311
E 0 = E t α t g α t g α t , MPa 77 , 429 90 , 552 99 , 311 10 , 336 6503 -89,09717
EP+T23+FA/TR E t , MPa14,90014,80013,60013,0506350---
α t , K−1, 1065.55.86.98.07.011.6--
E 2 , MPa.K2450,725497,872647,496835,200311,150-607,82349
E 0 = E t α t g α t g α t , MPa28,33429,60033,56642,0506353-33,38832
Table 3. Results of calculation of models’ average C v .
Average Cv%Polymers and Filled PolymersFRPsTotal
Barker’s model203025
Relaxation model182019
Disclaimer/Publisher’s Note: The statements, opinions and data contained in all publications are solely those of the individual author(s) and contributor(s) and not of MDPI and/or the editor(s). MDPI and/or the editor(s) disclaim responsibility for any injury to people or property resulting from any ideas, methods, instructions or products referred to in the content.

