
Effect of Fiber Sizing Levels on the Mechanical Properties of Carbon Fiber-Reinforced Thermoset Composites

 , ,
, ,
Abstract
:1. Introduction
2. Materials
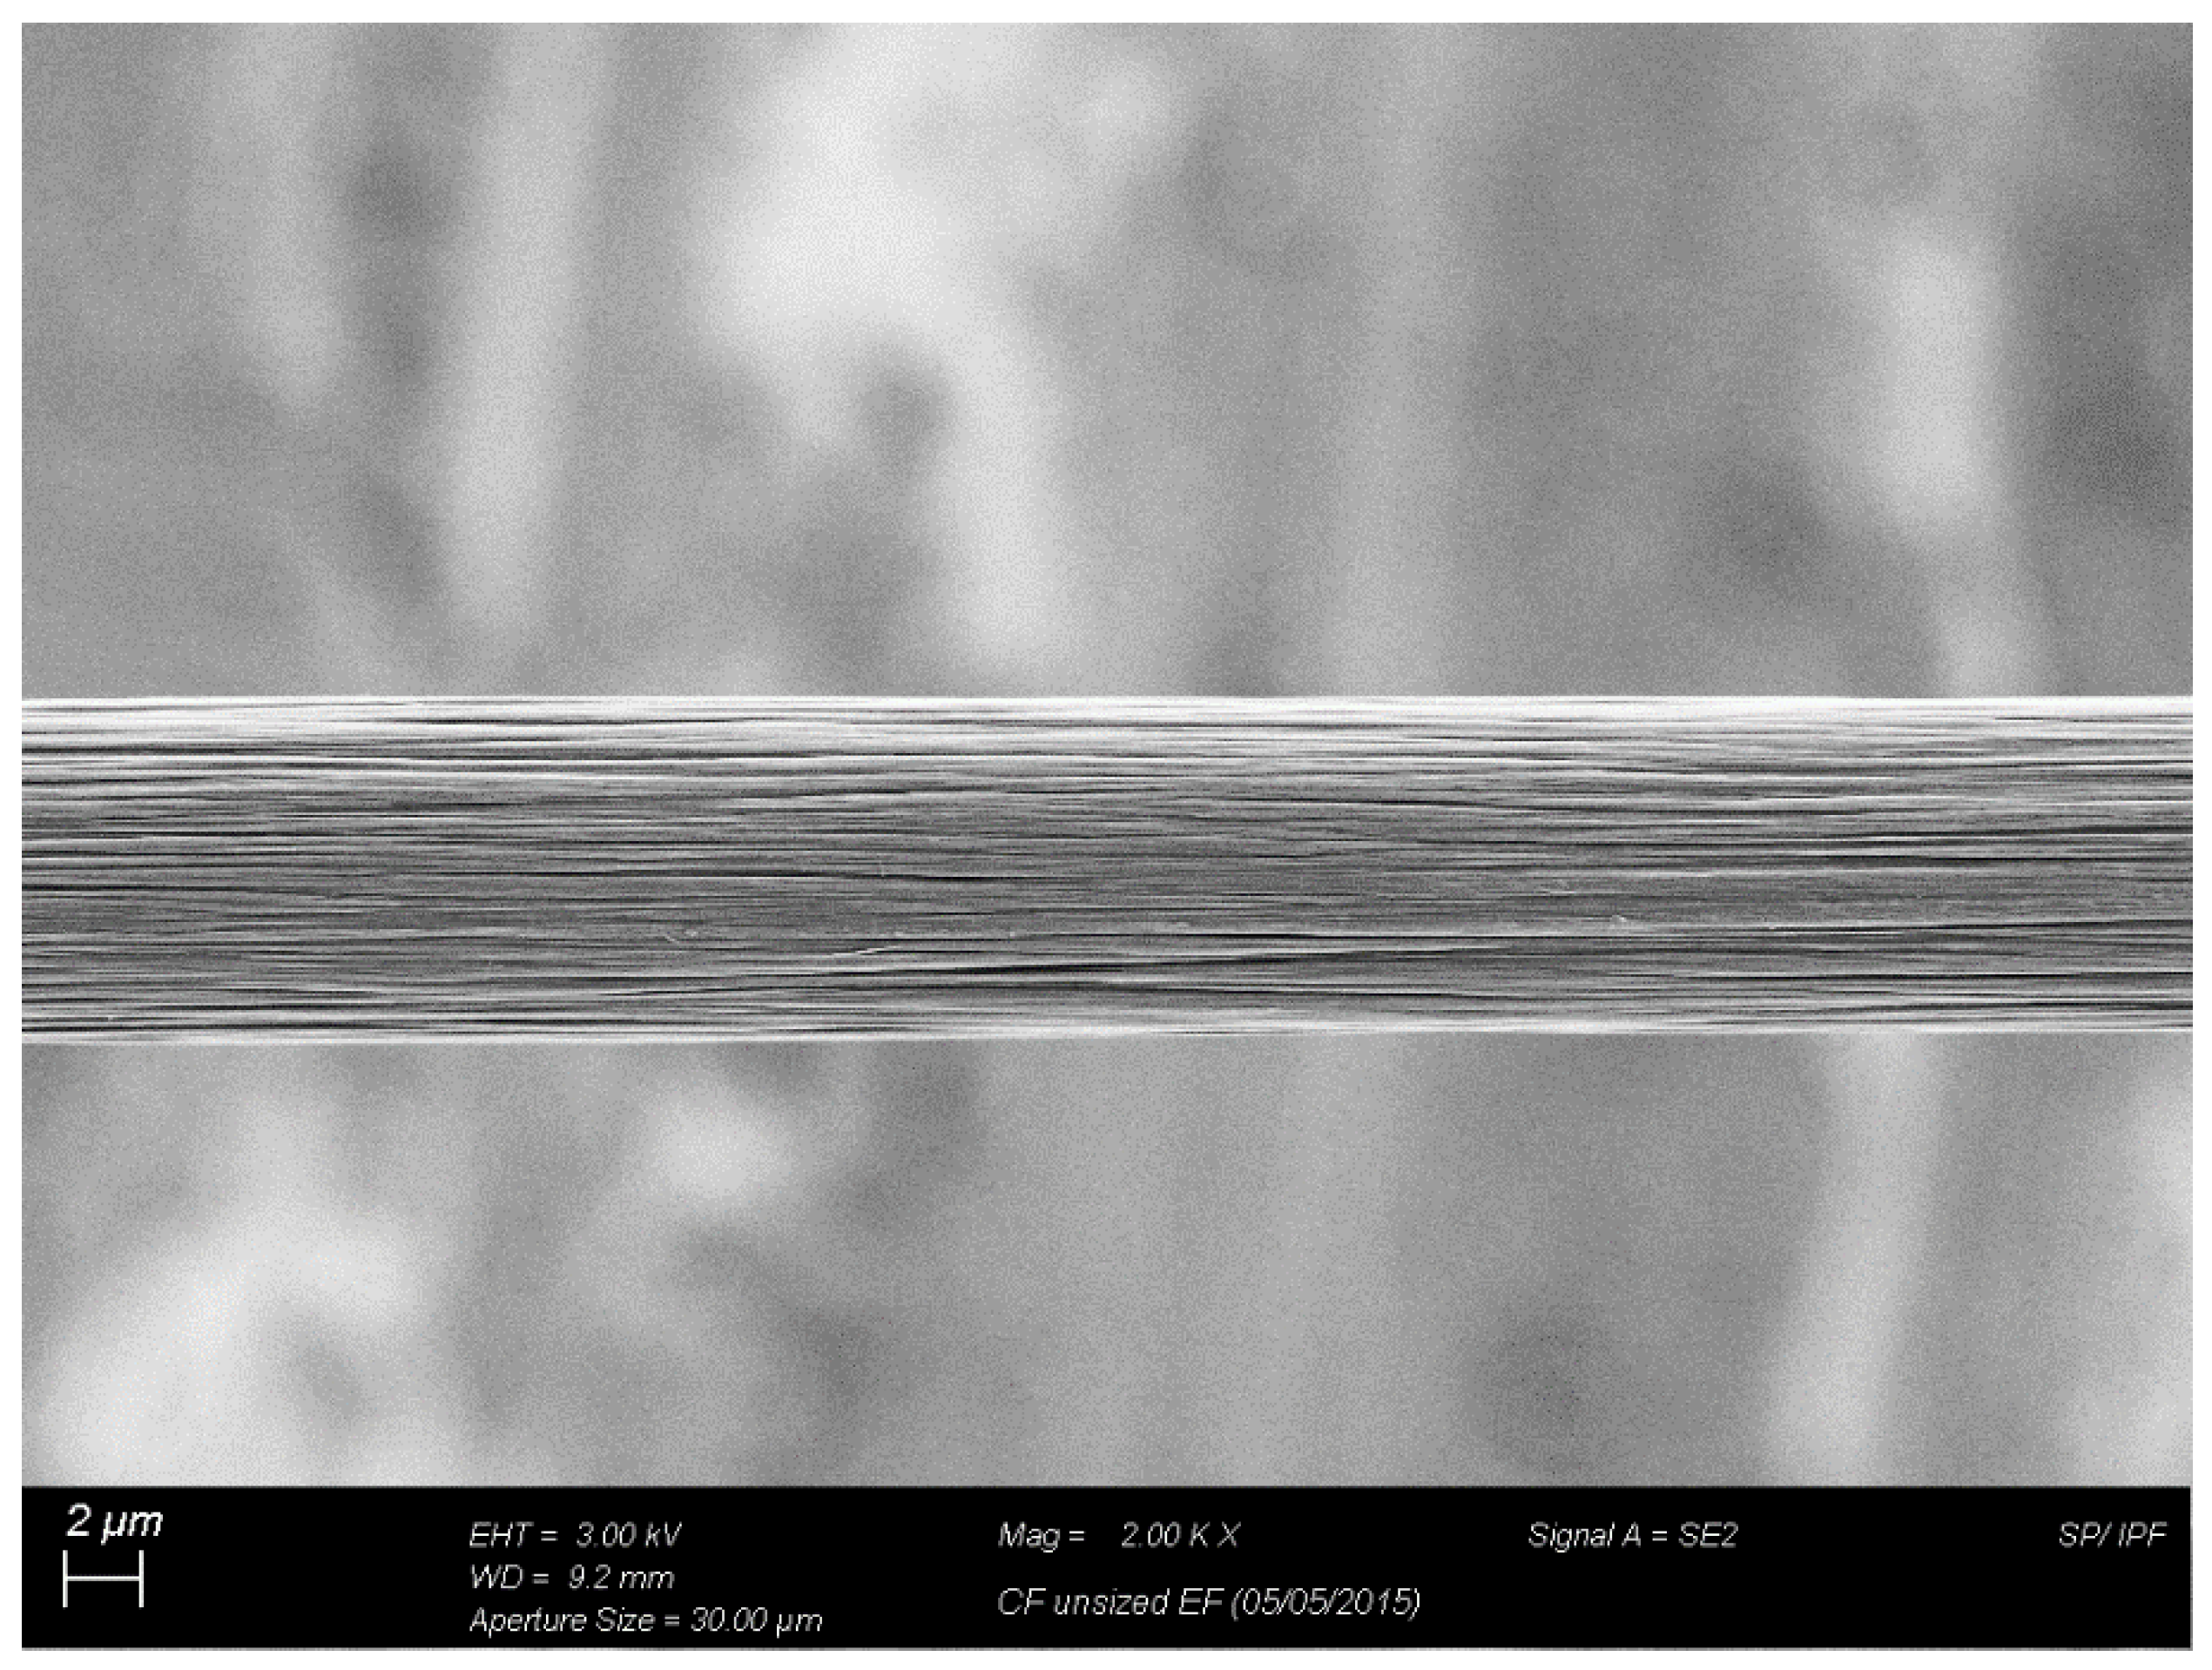
2.1. Carbon Fiber
2.2. Epoxy Resin
2.3. Sizing Formulations
3. Methods
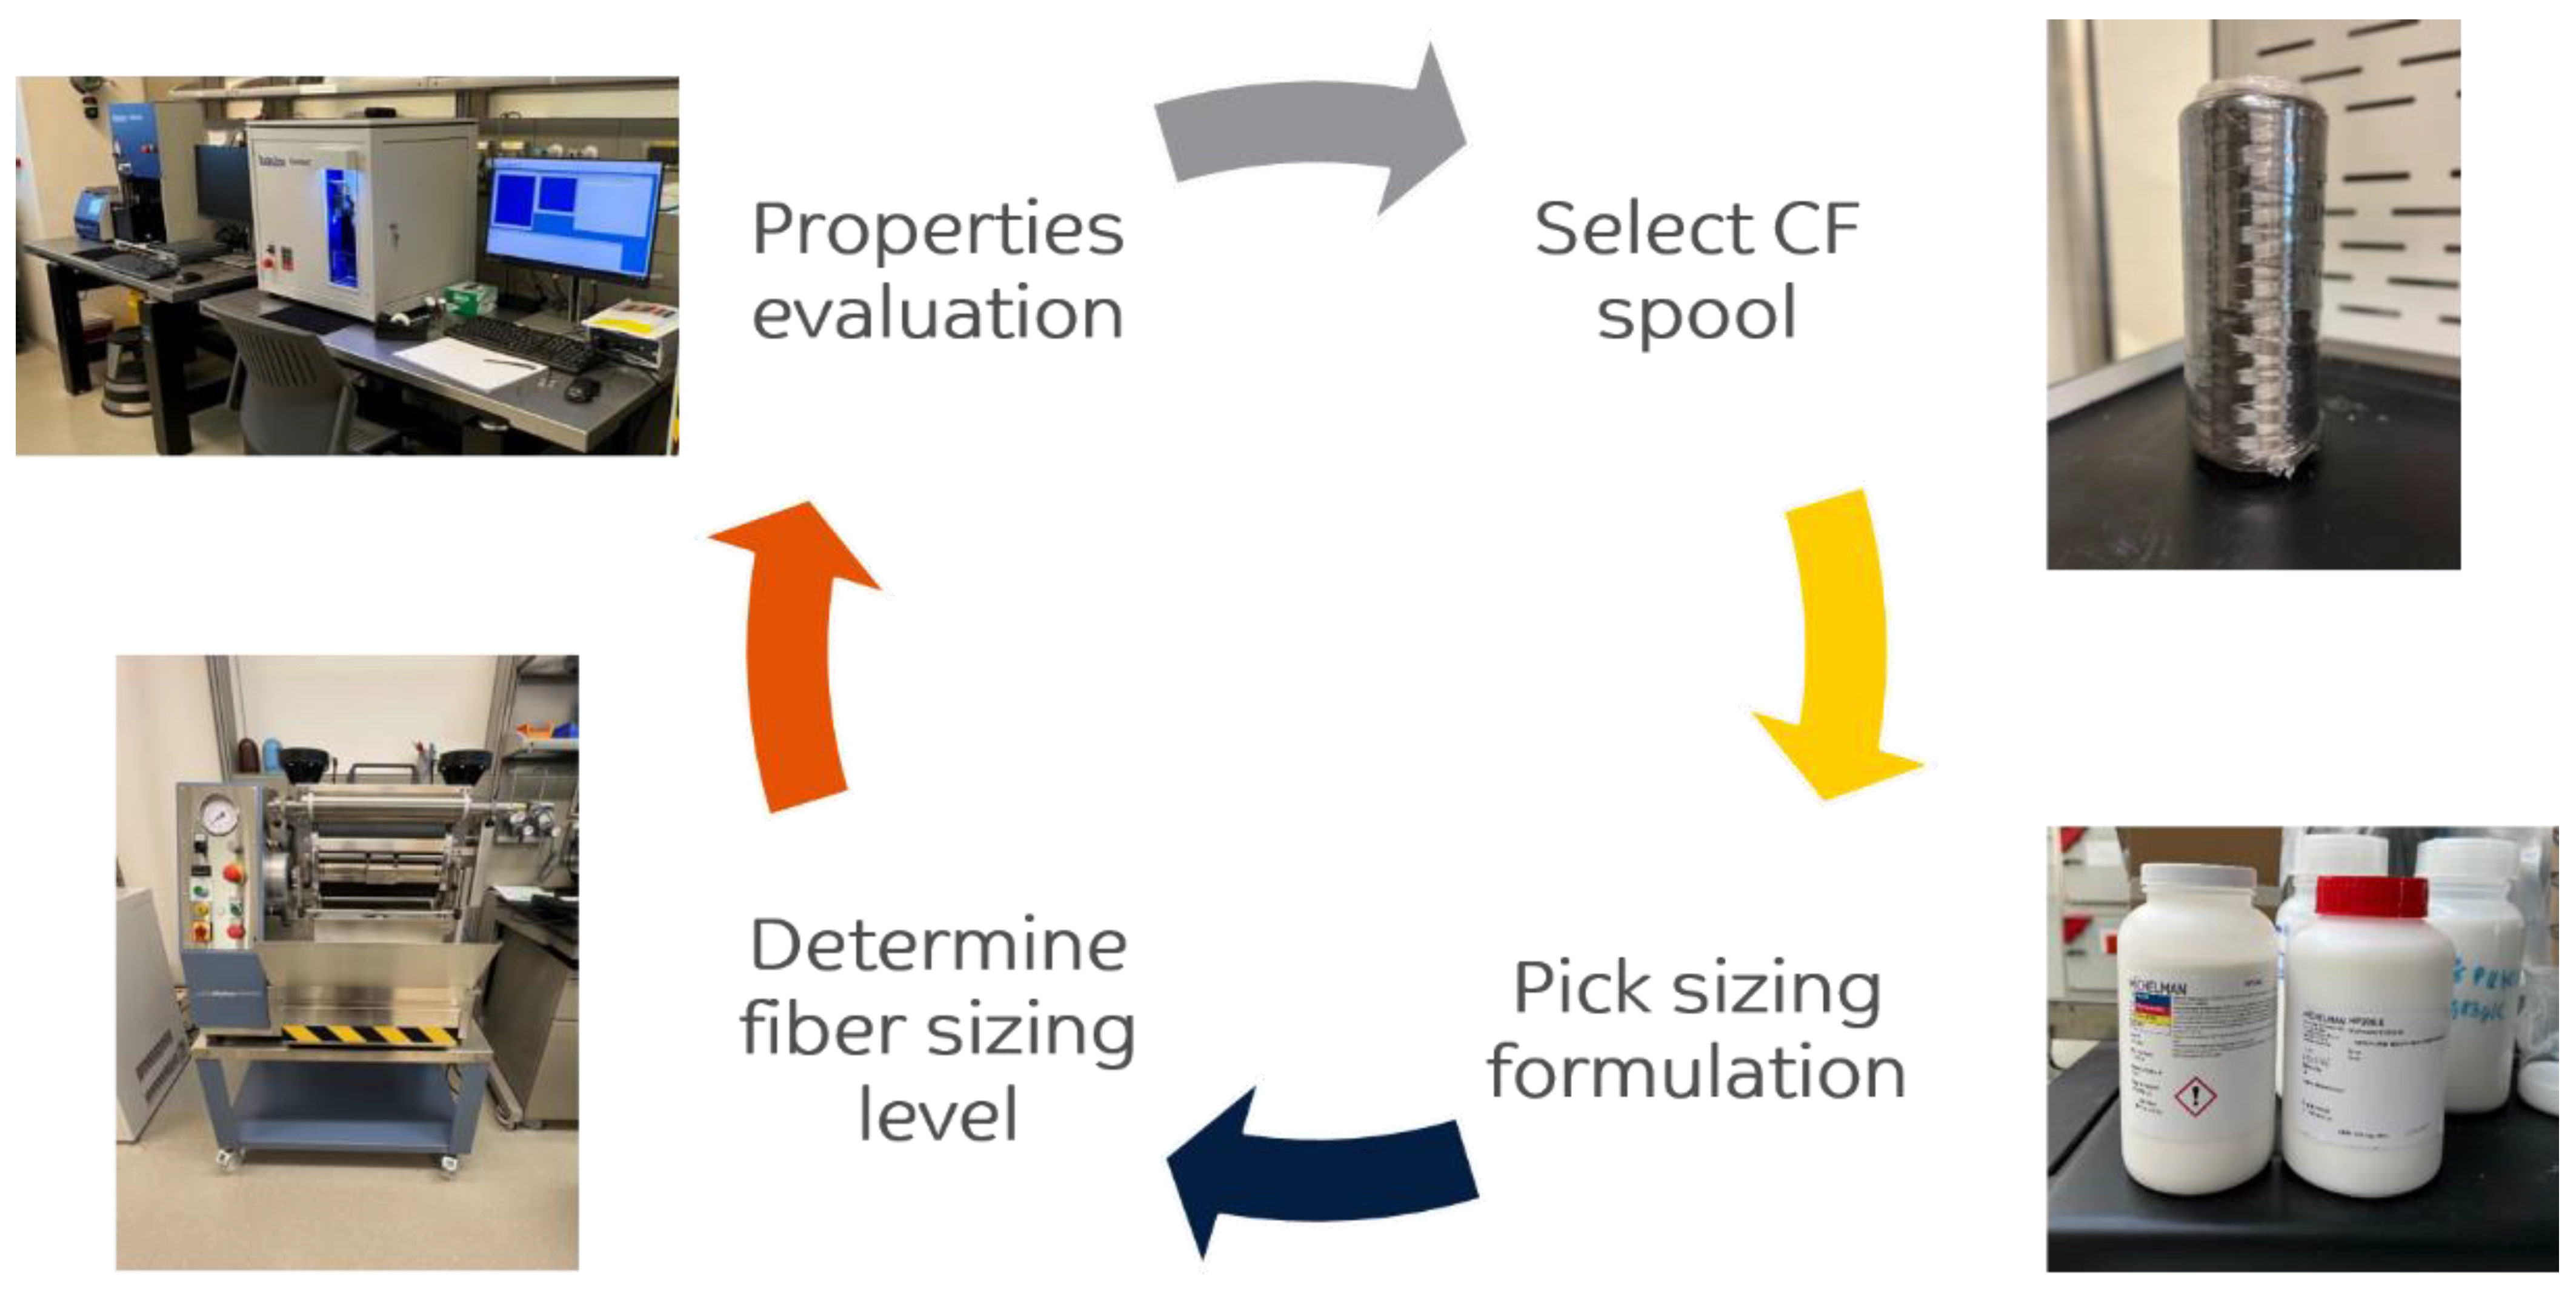
3.1. Fiber Sizing Procedure
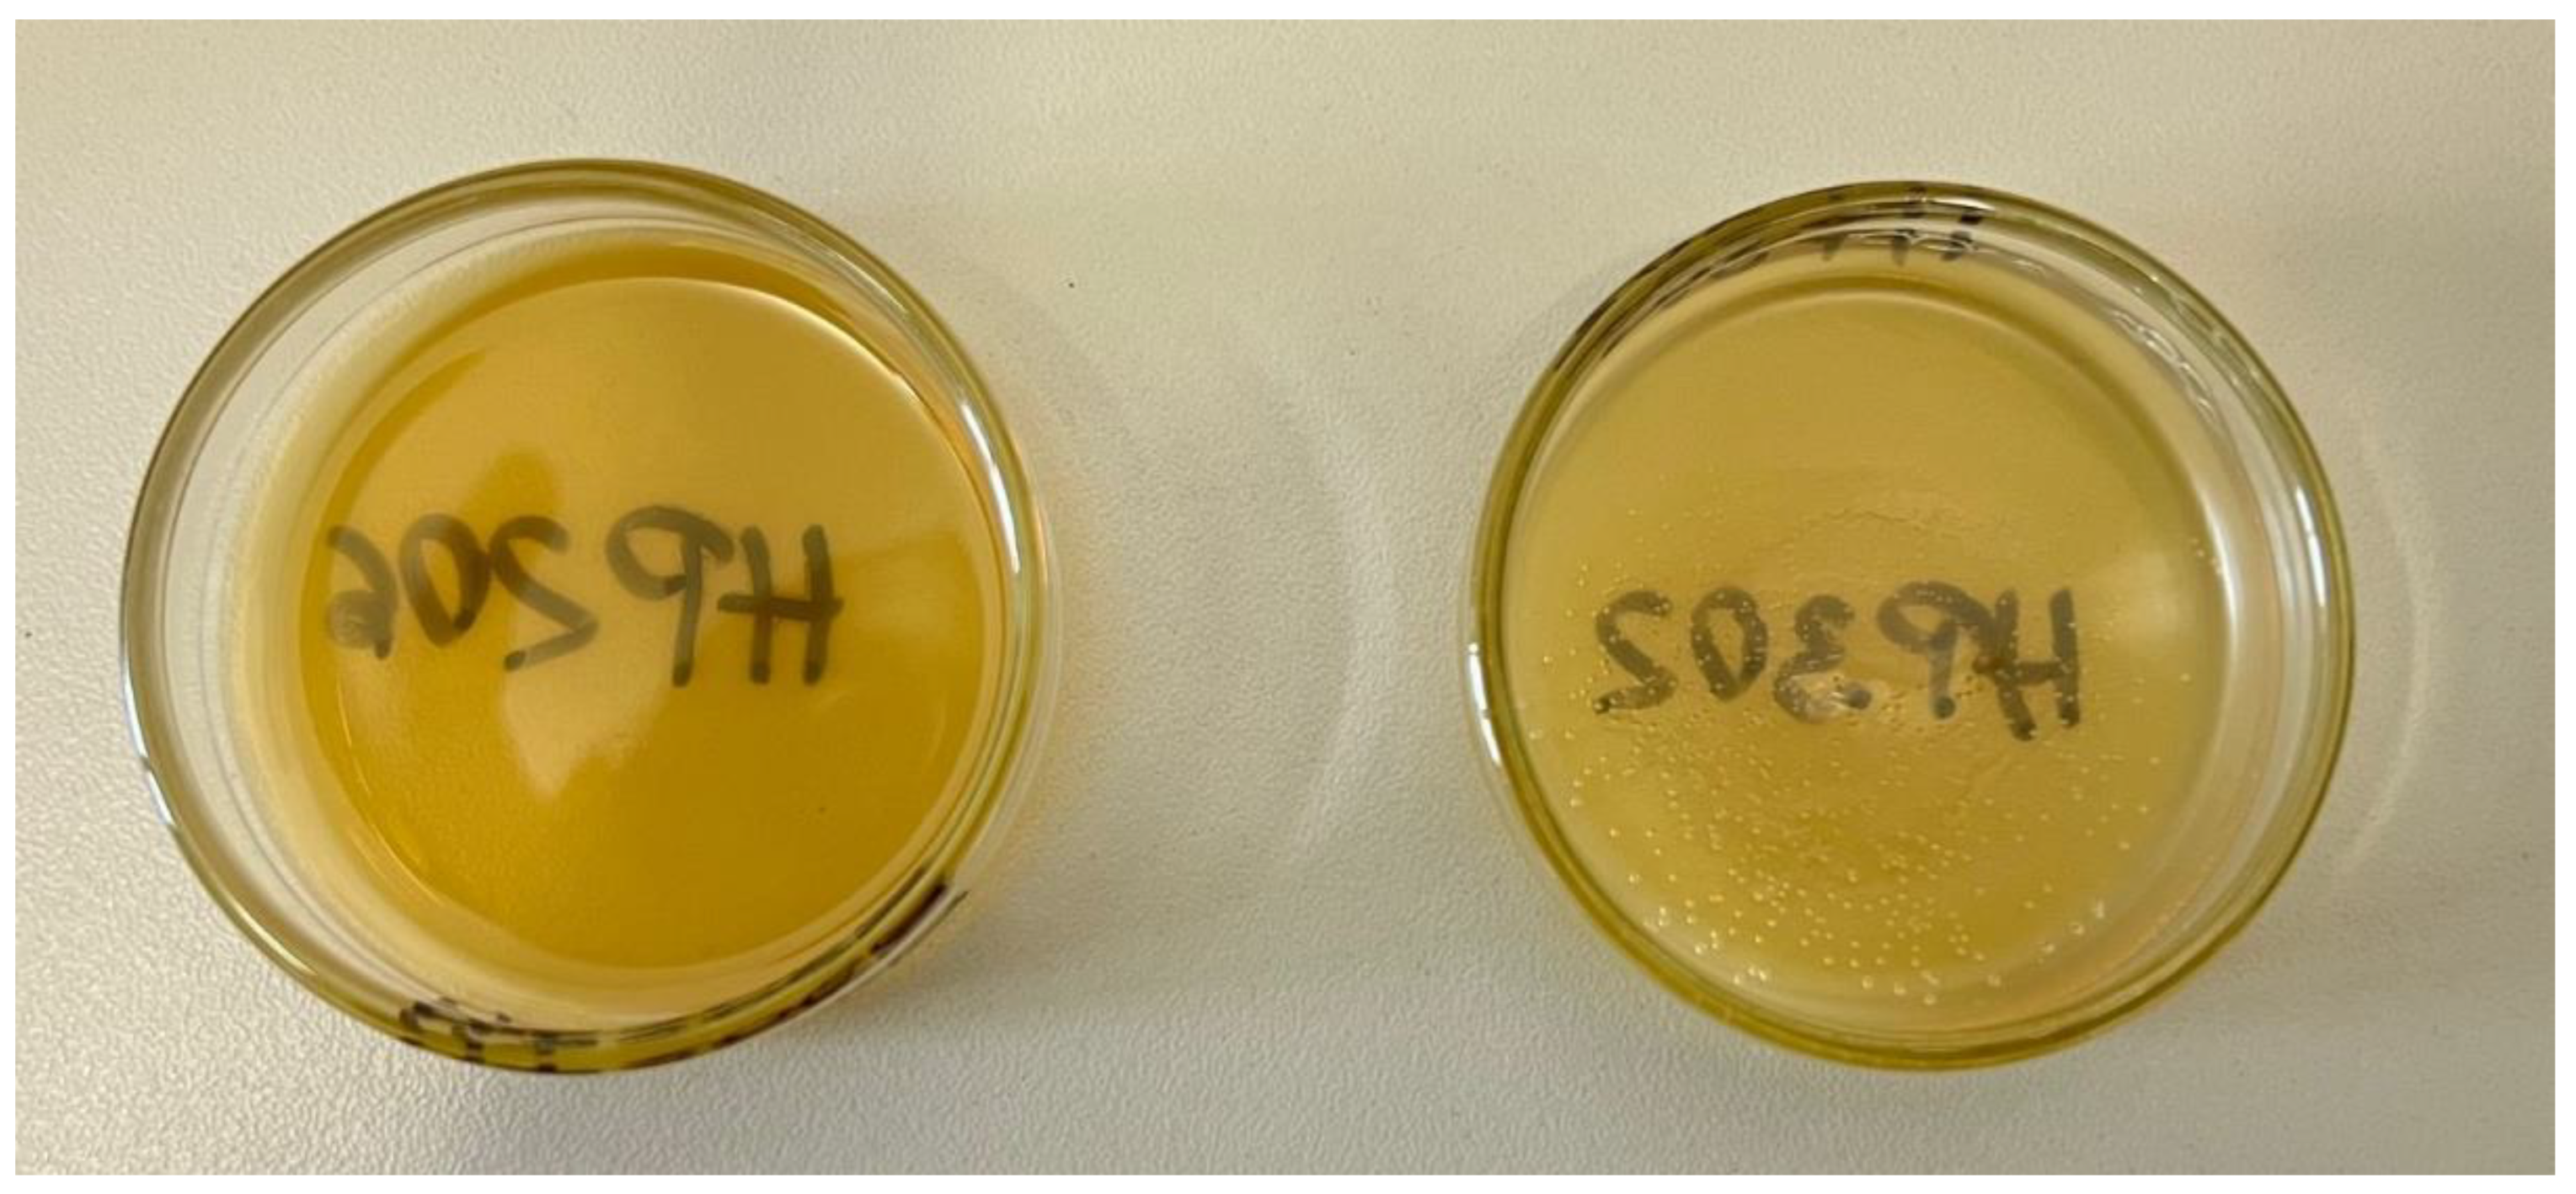
3.2. Determination of Fiber Sizing Content
3.3. Single Fiber Tensile Testing
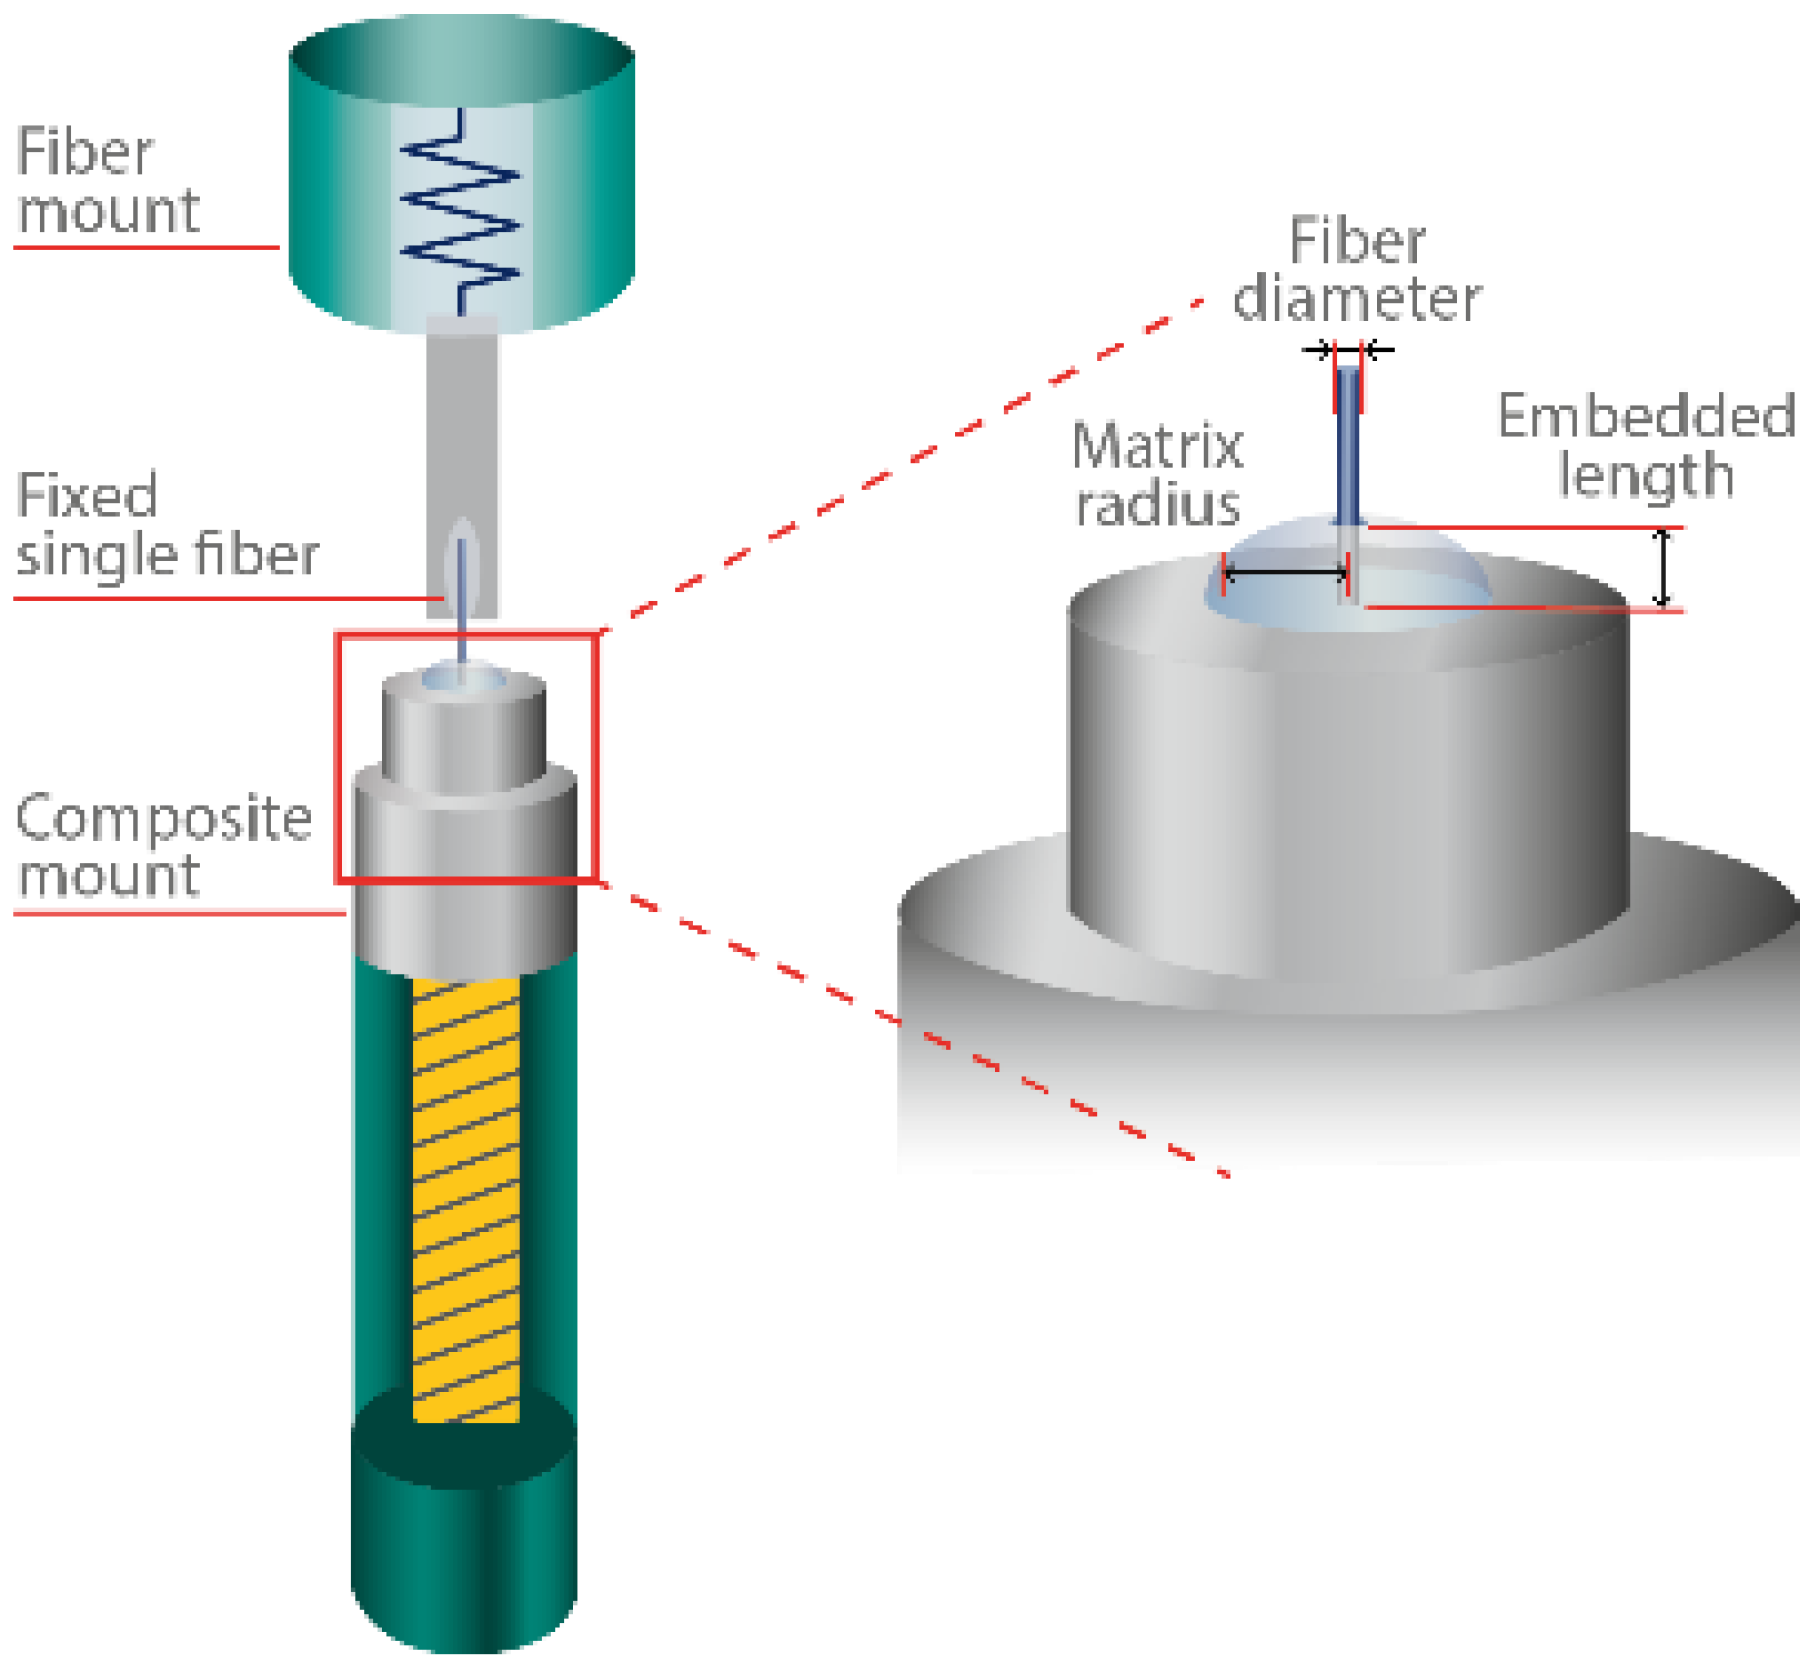
3.4. Fiber–Matrix Adhesion: Single Fiber Pull-Out Testing
3.5. X-ray Photoelectron Spectroscopy
4. Results and Discussions
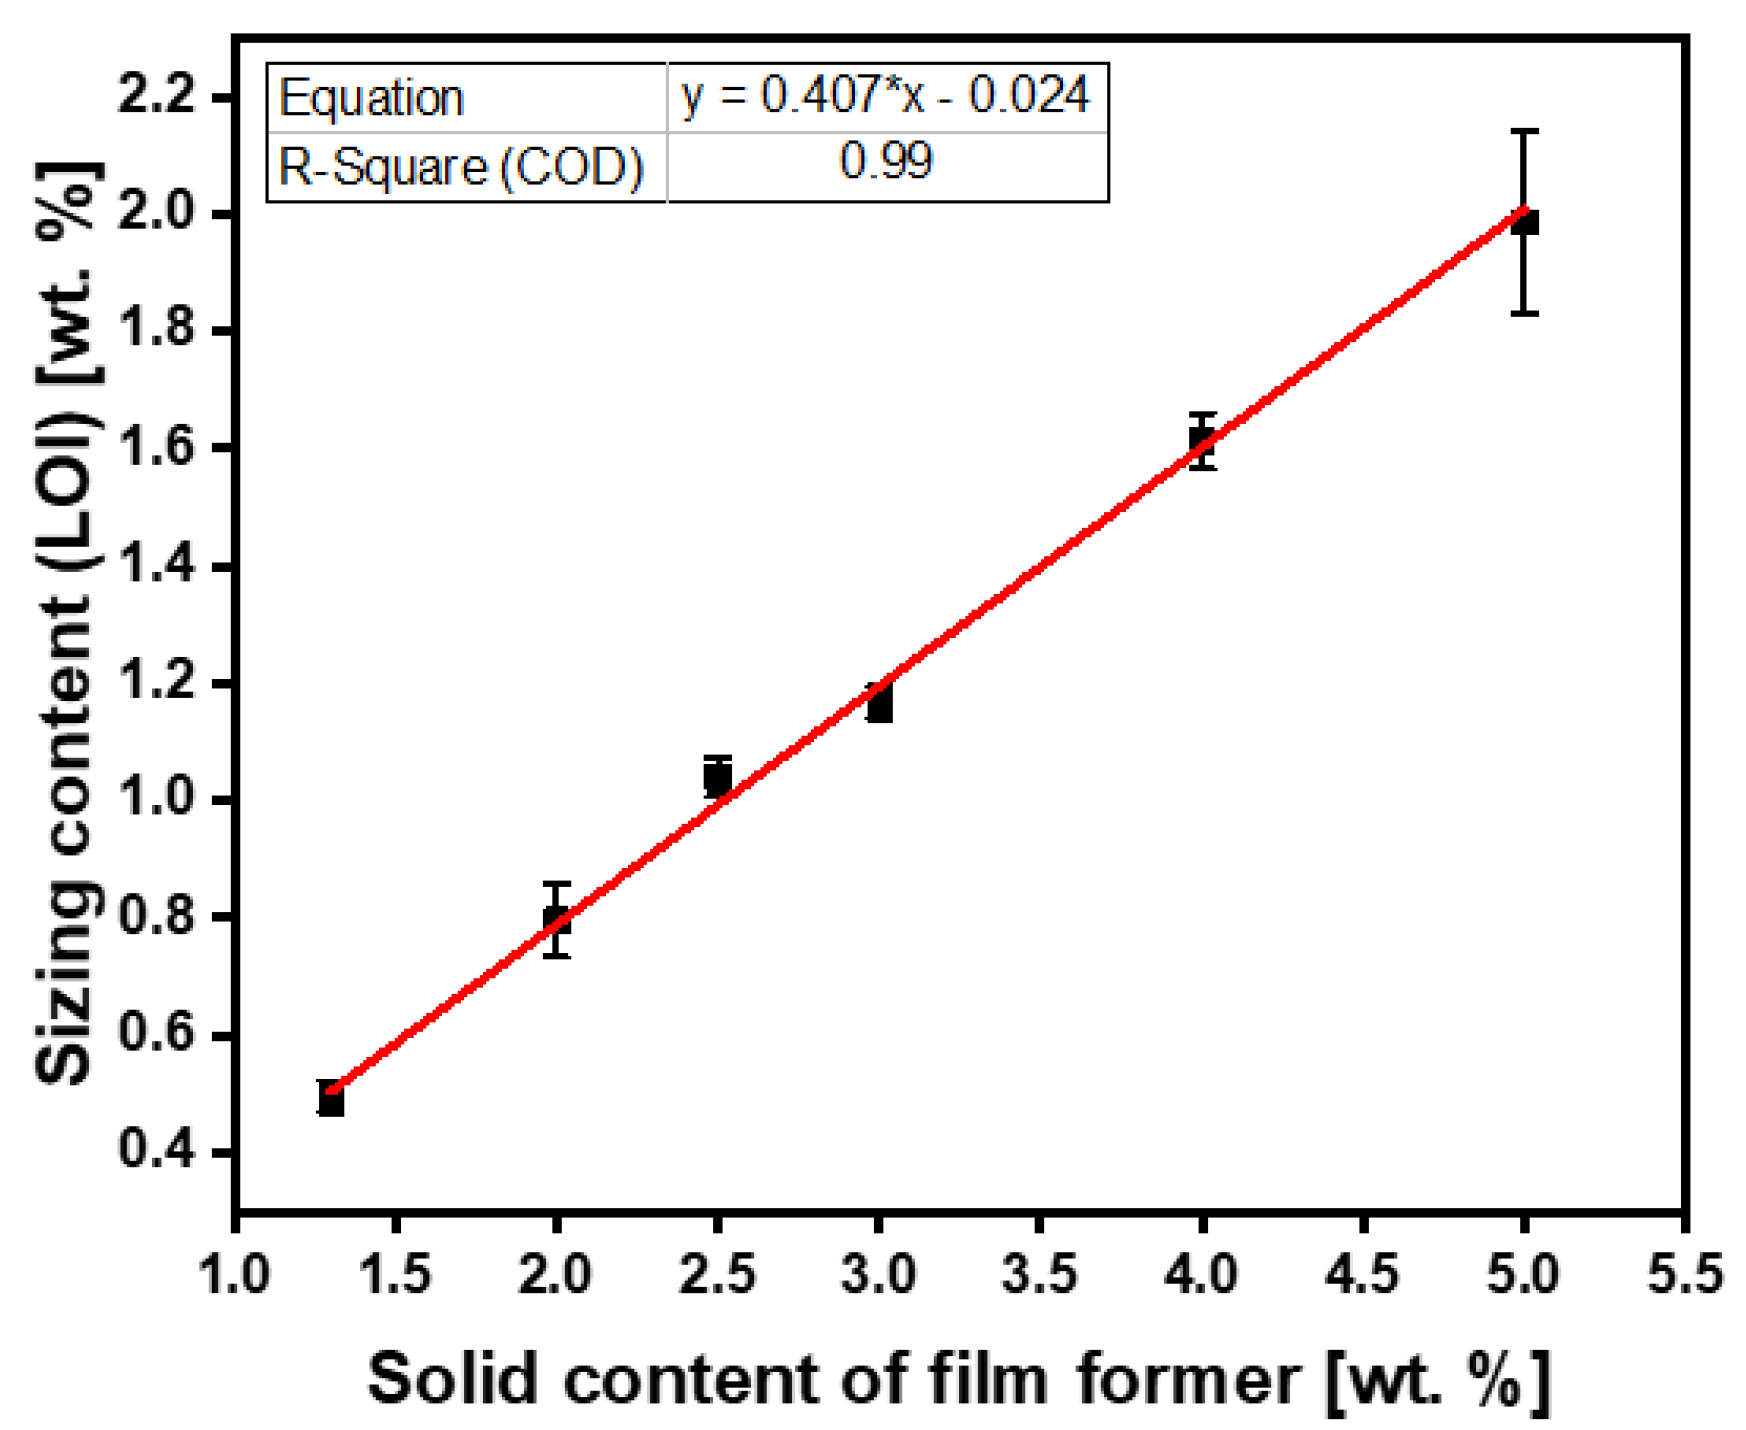
4.1. Achieving the Targeted Sizing Level
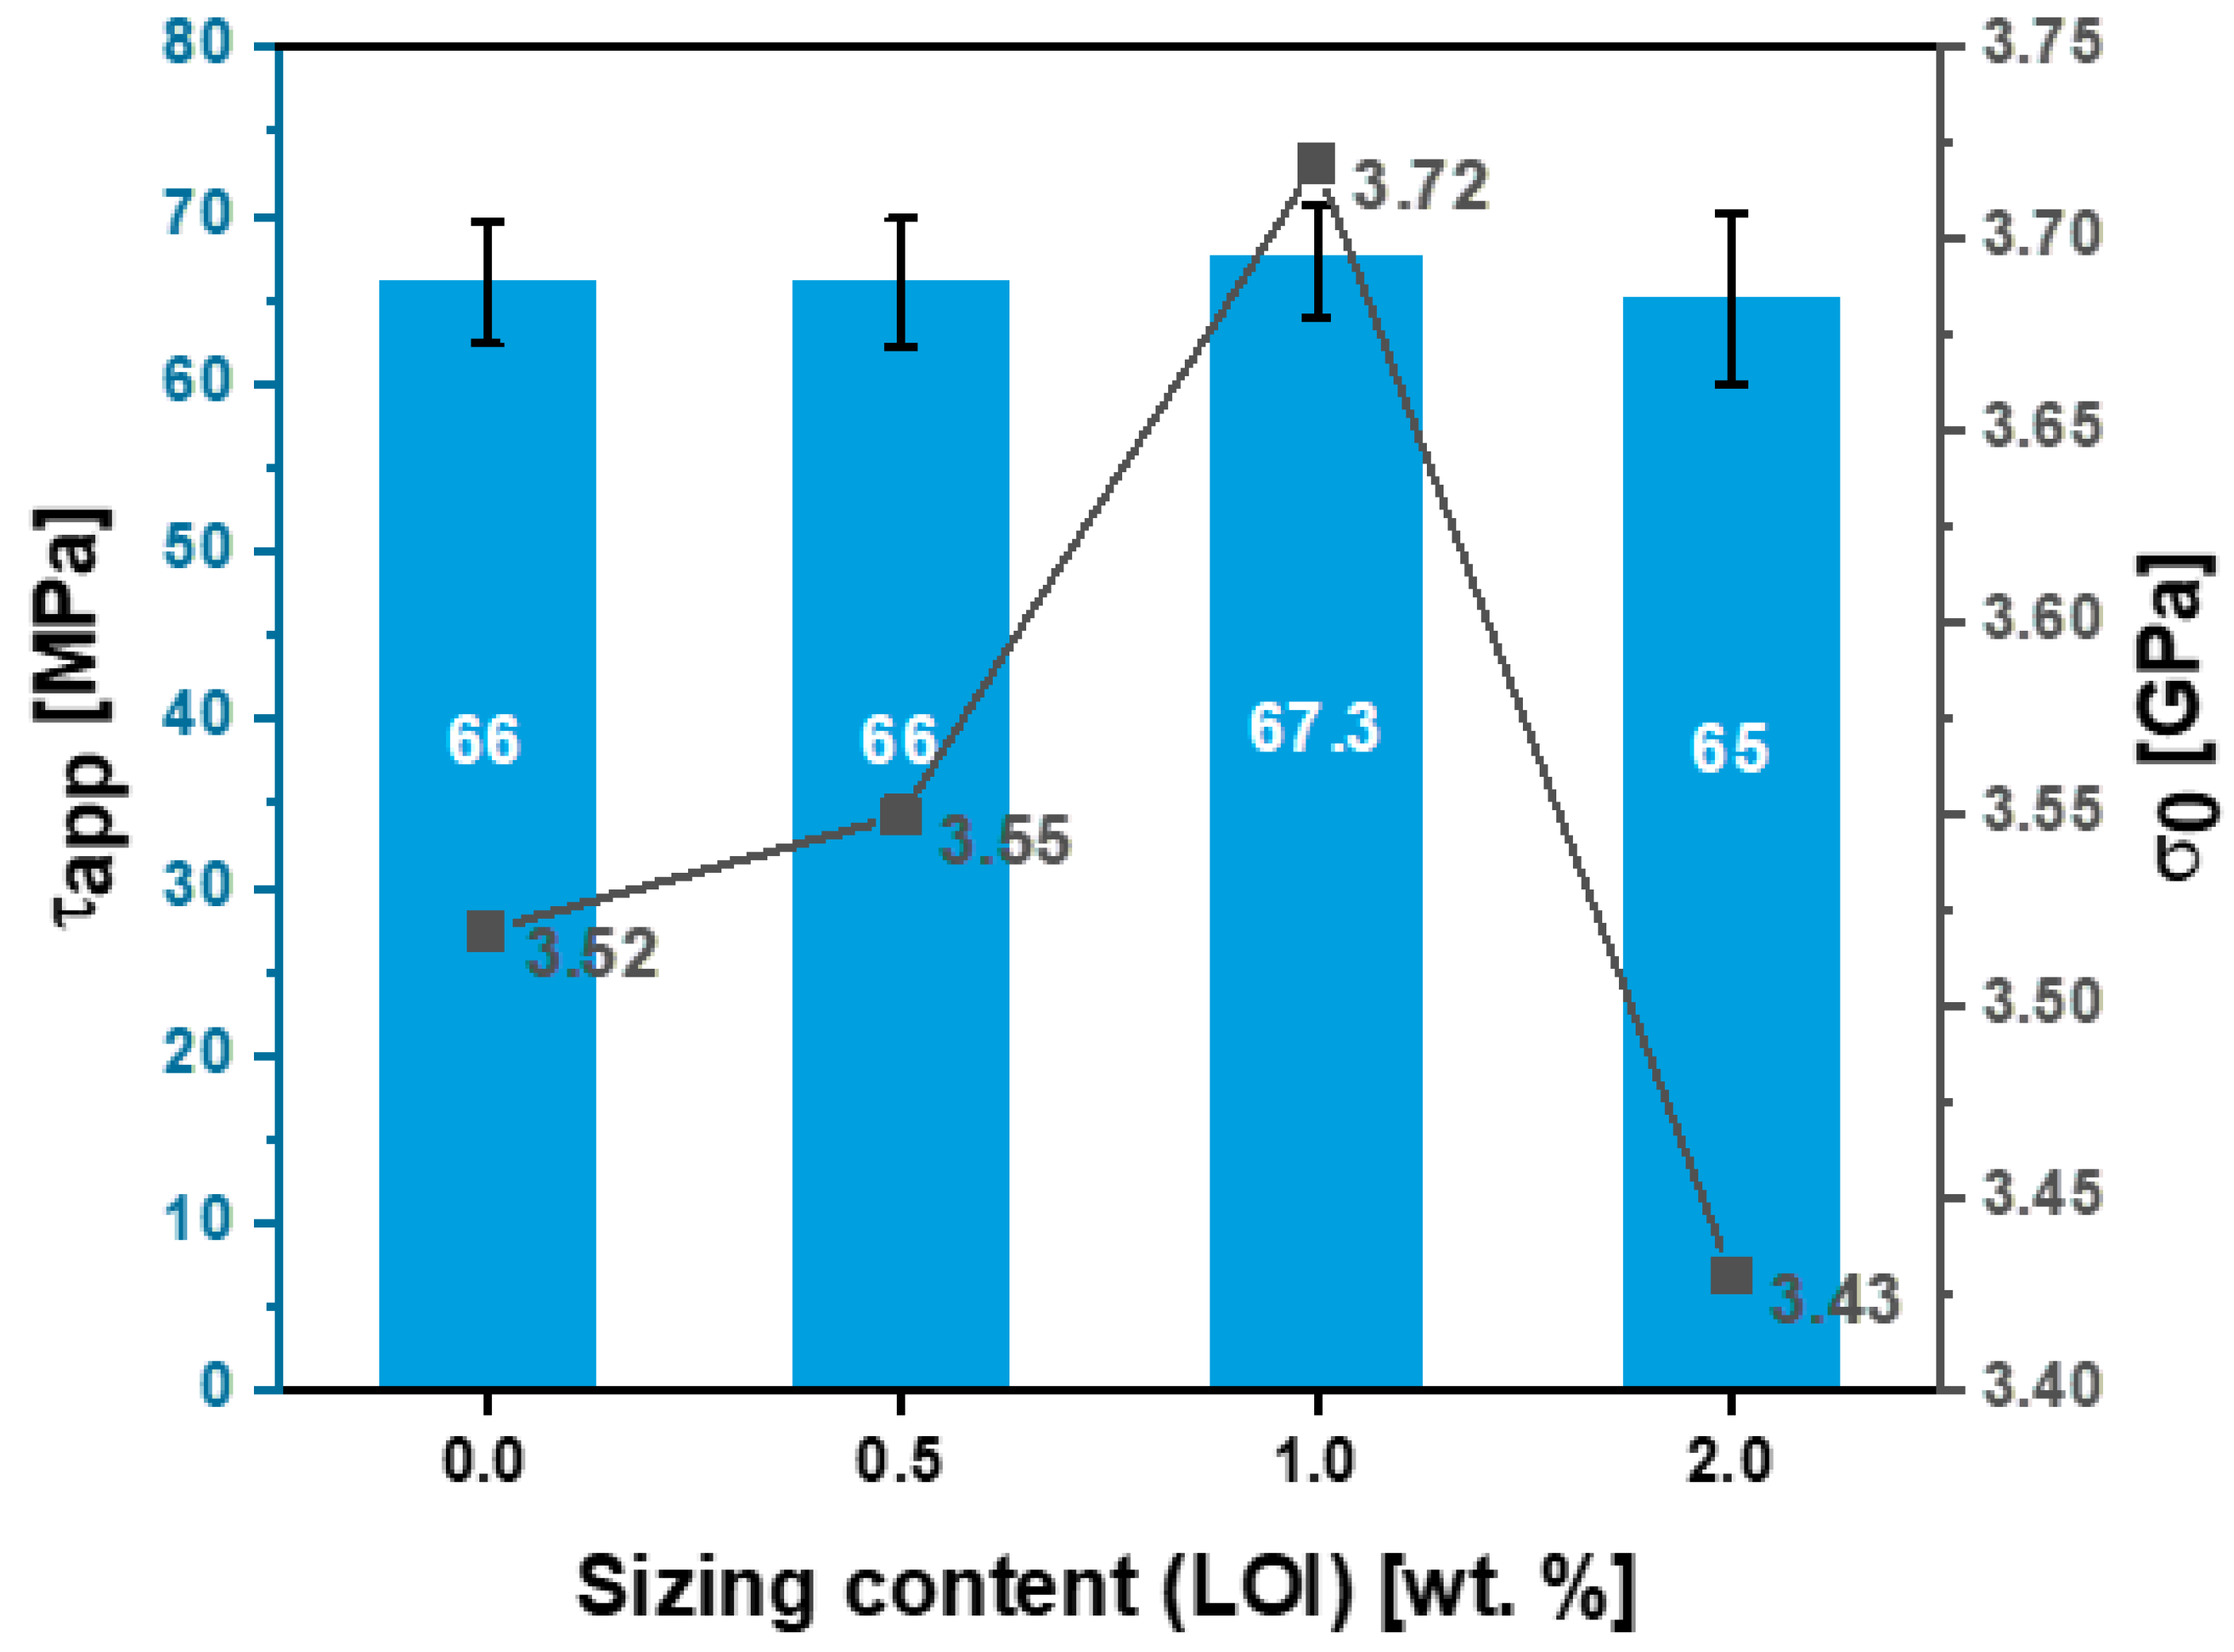
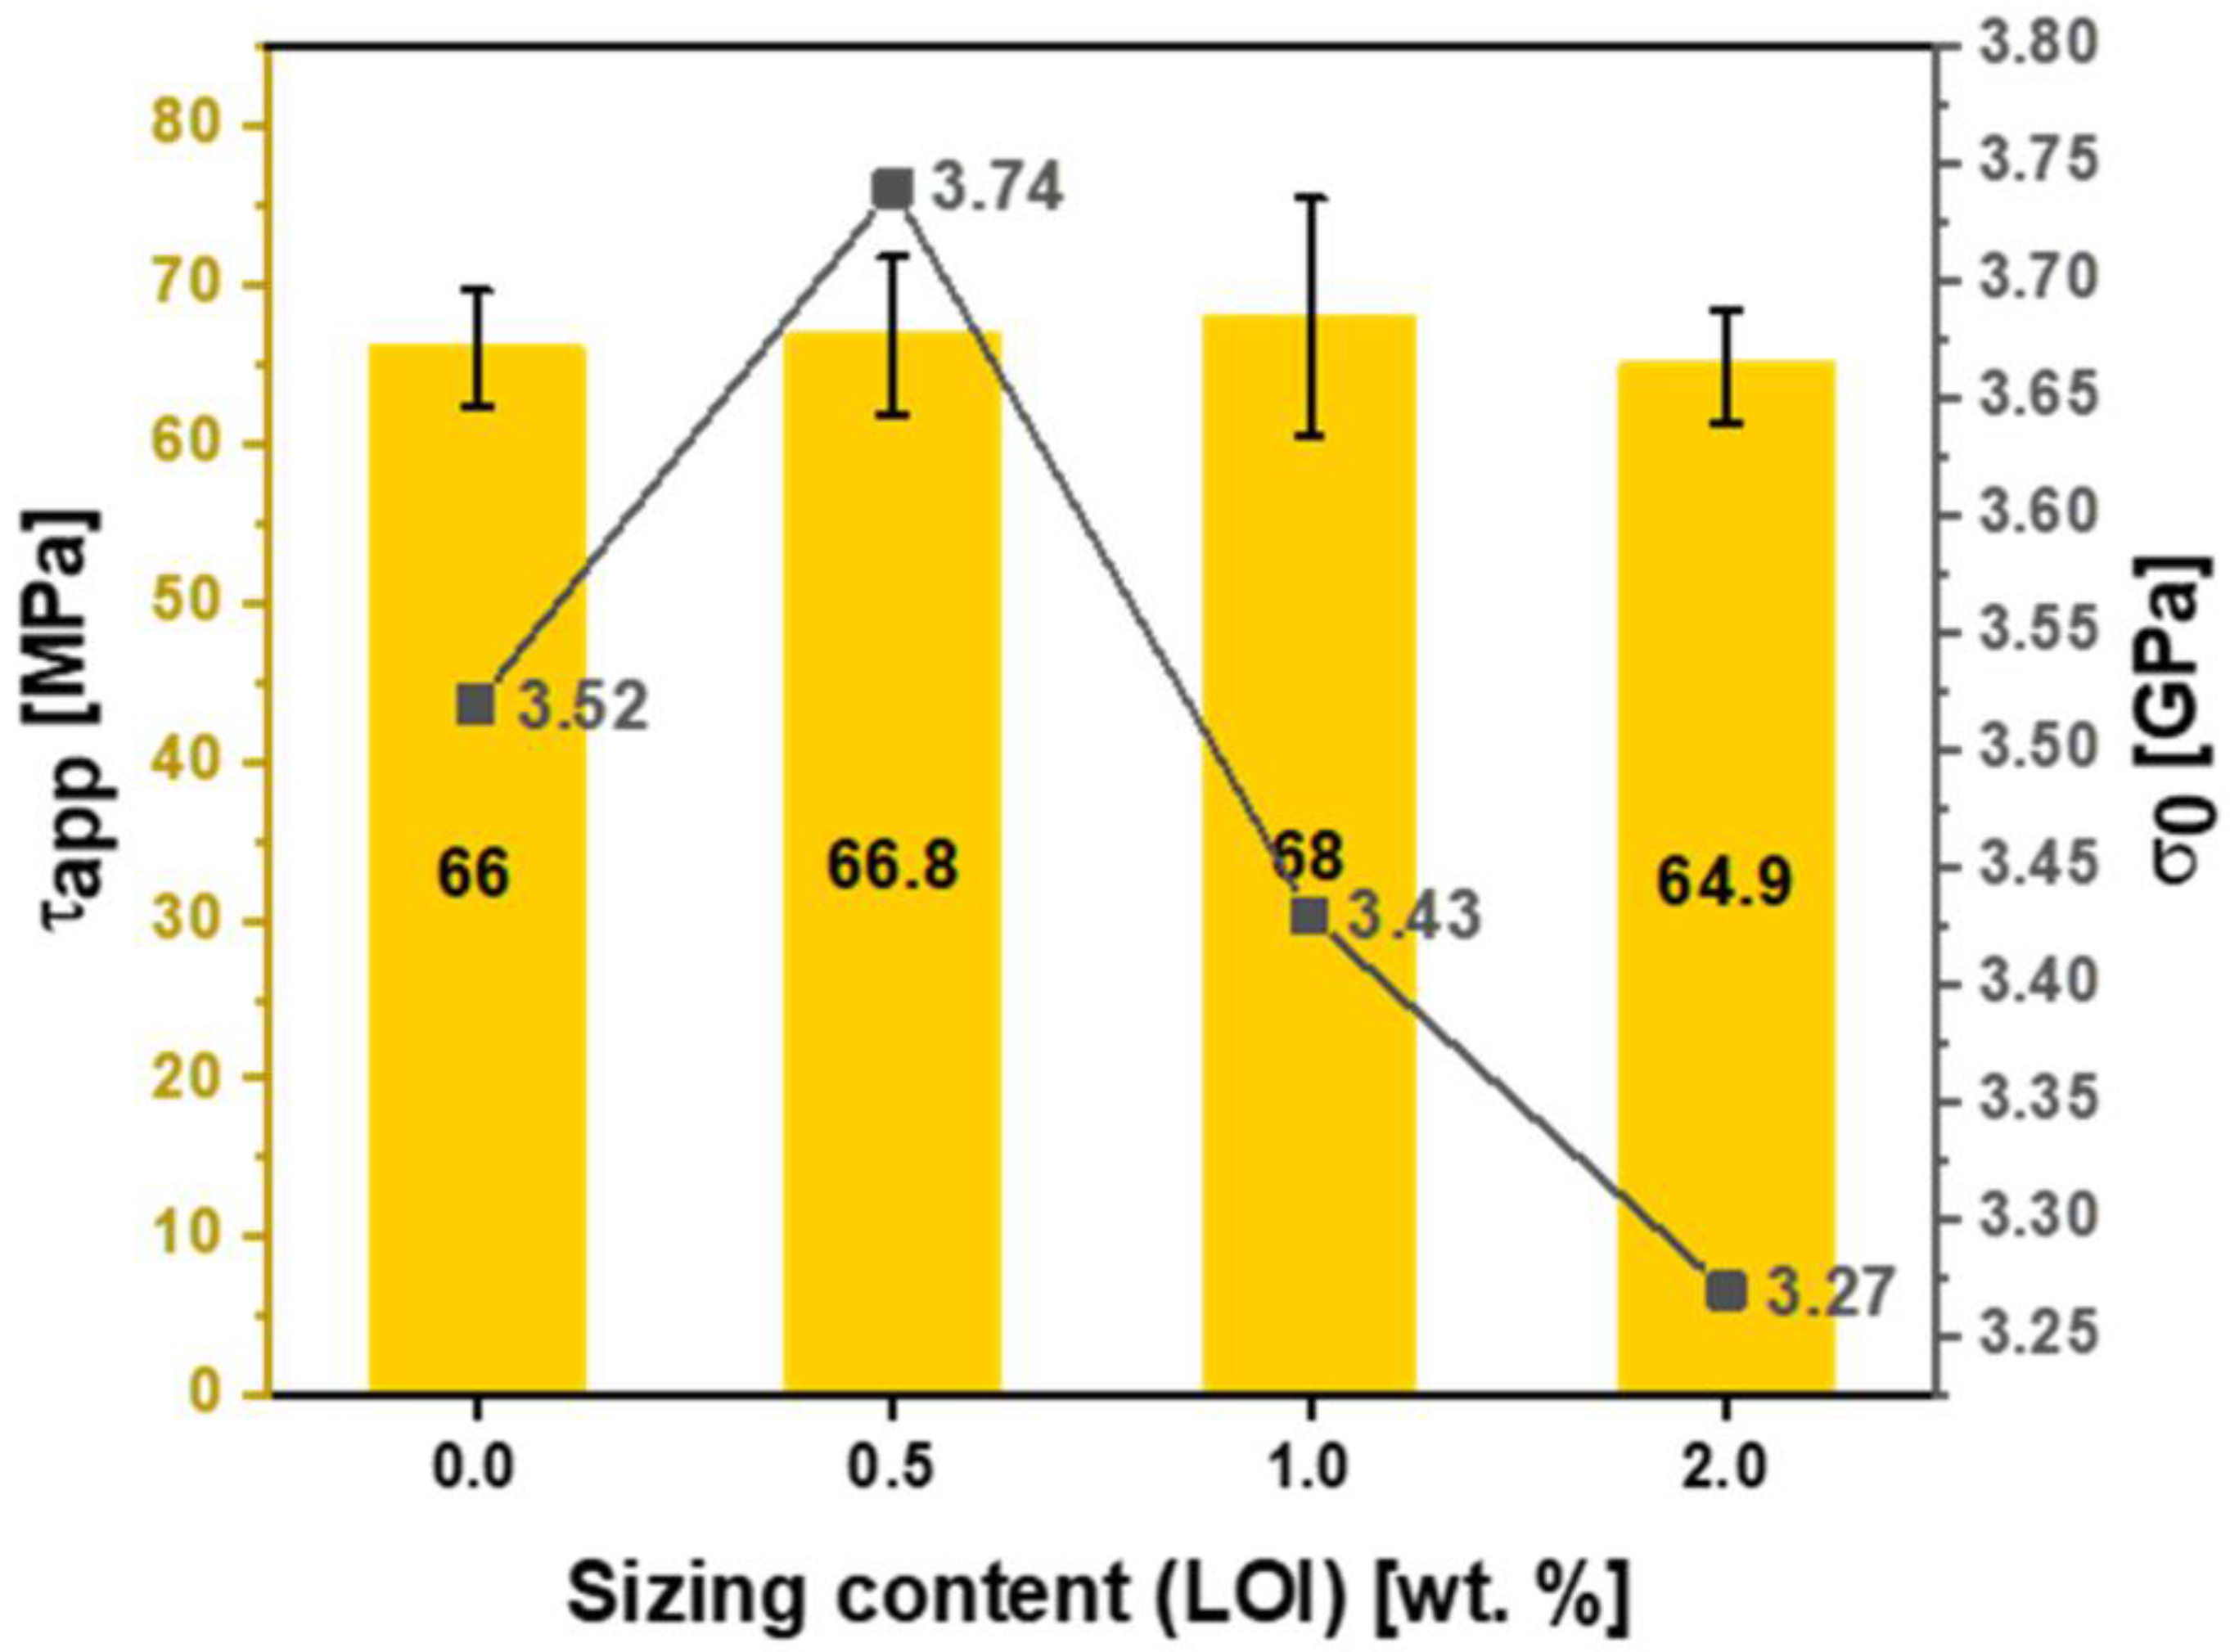
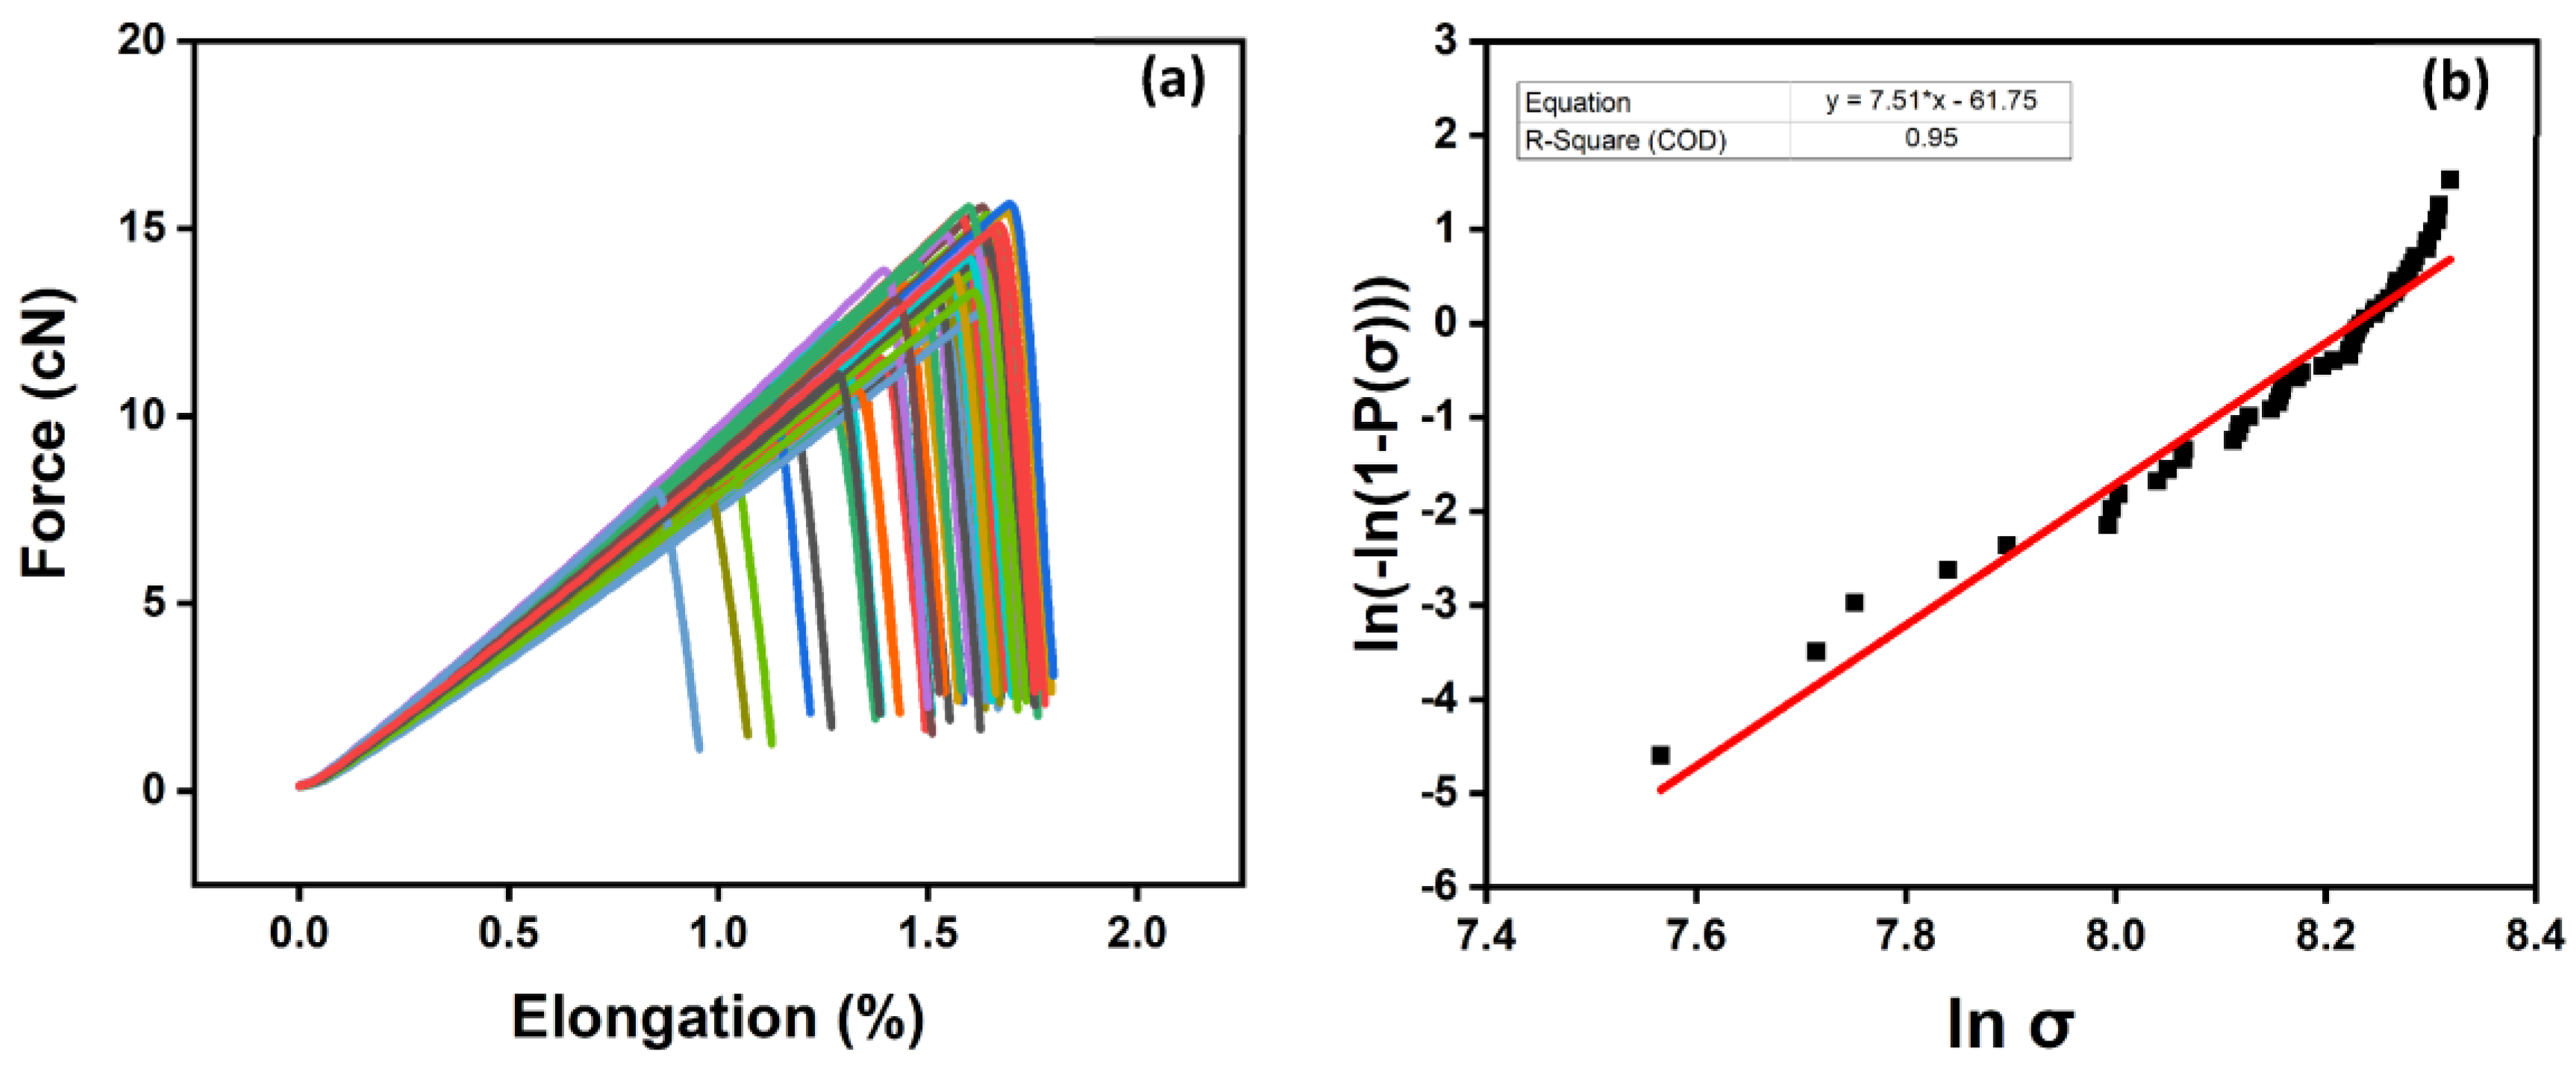
4.2. The Effect of Sizing Level on the Tensile Properties of the Fiber
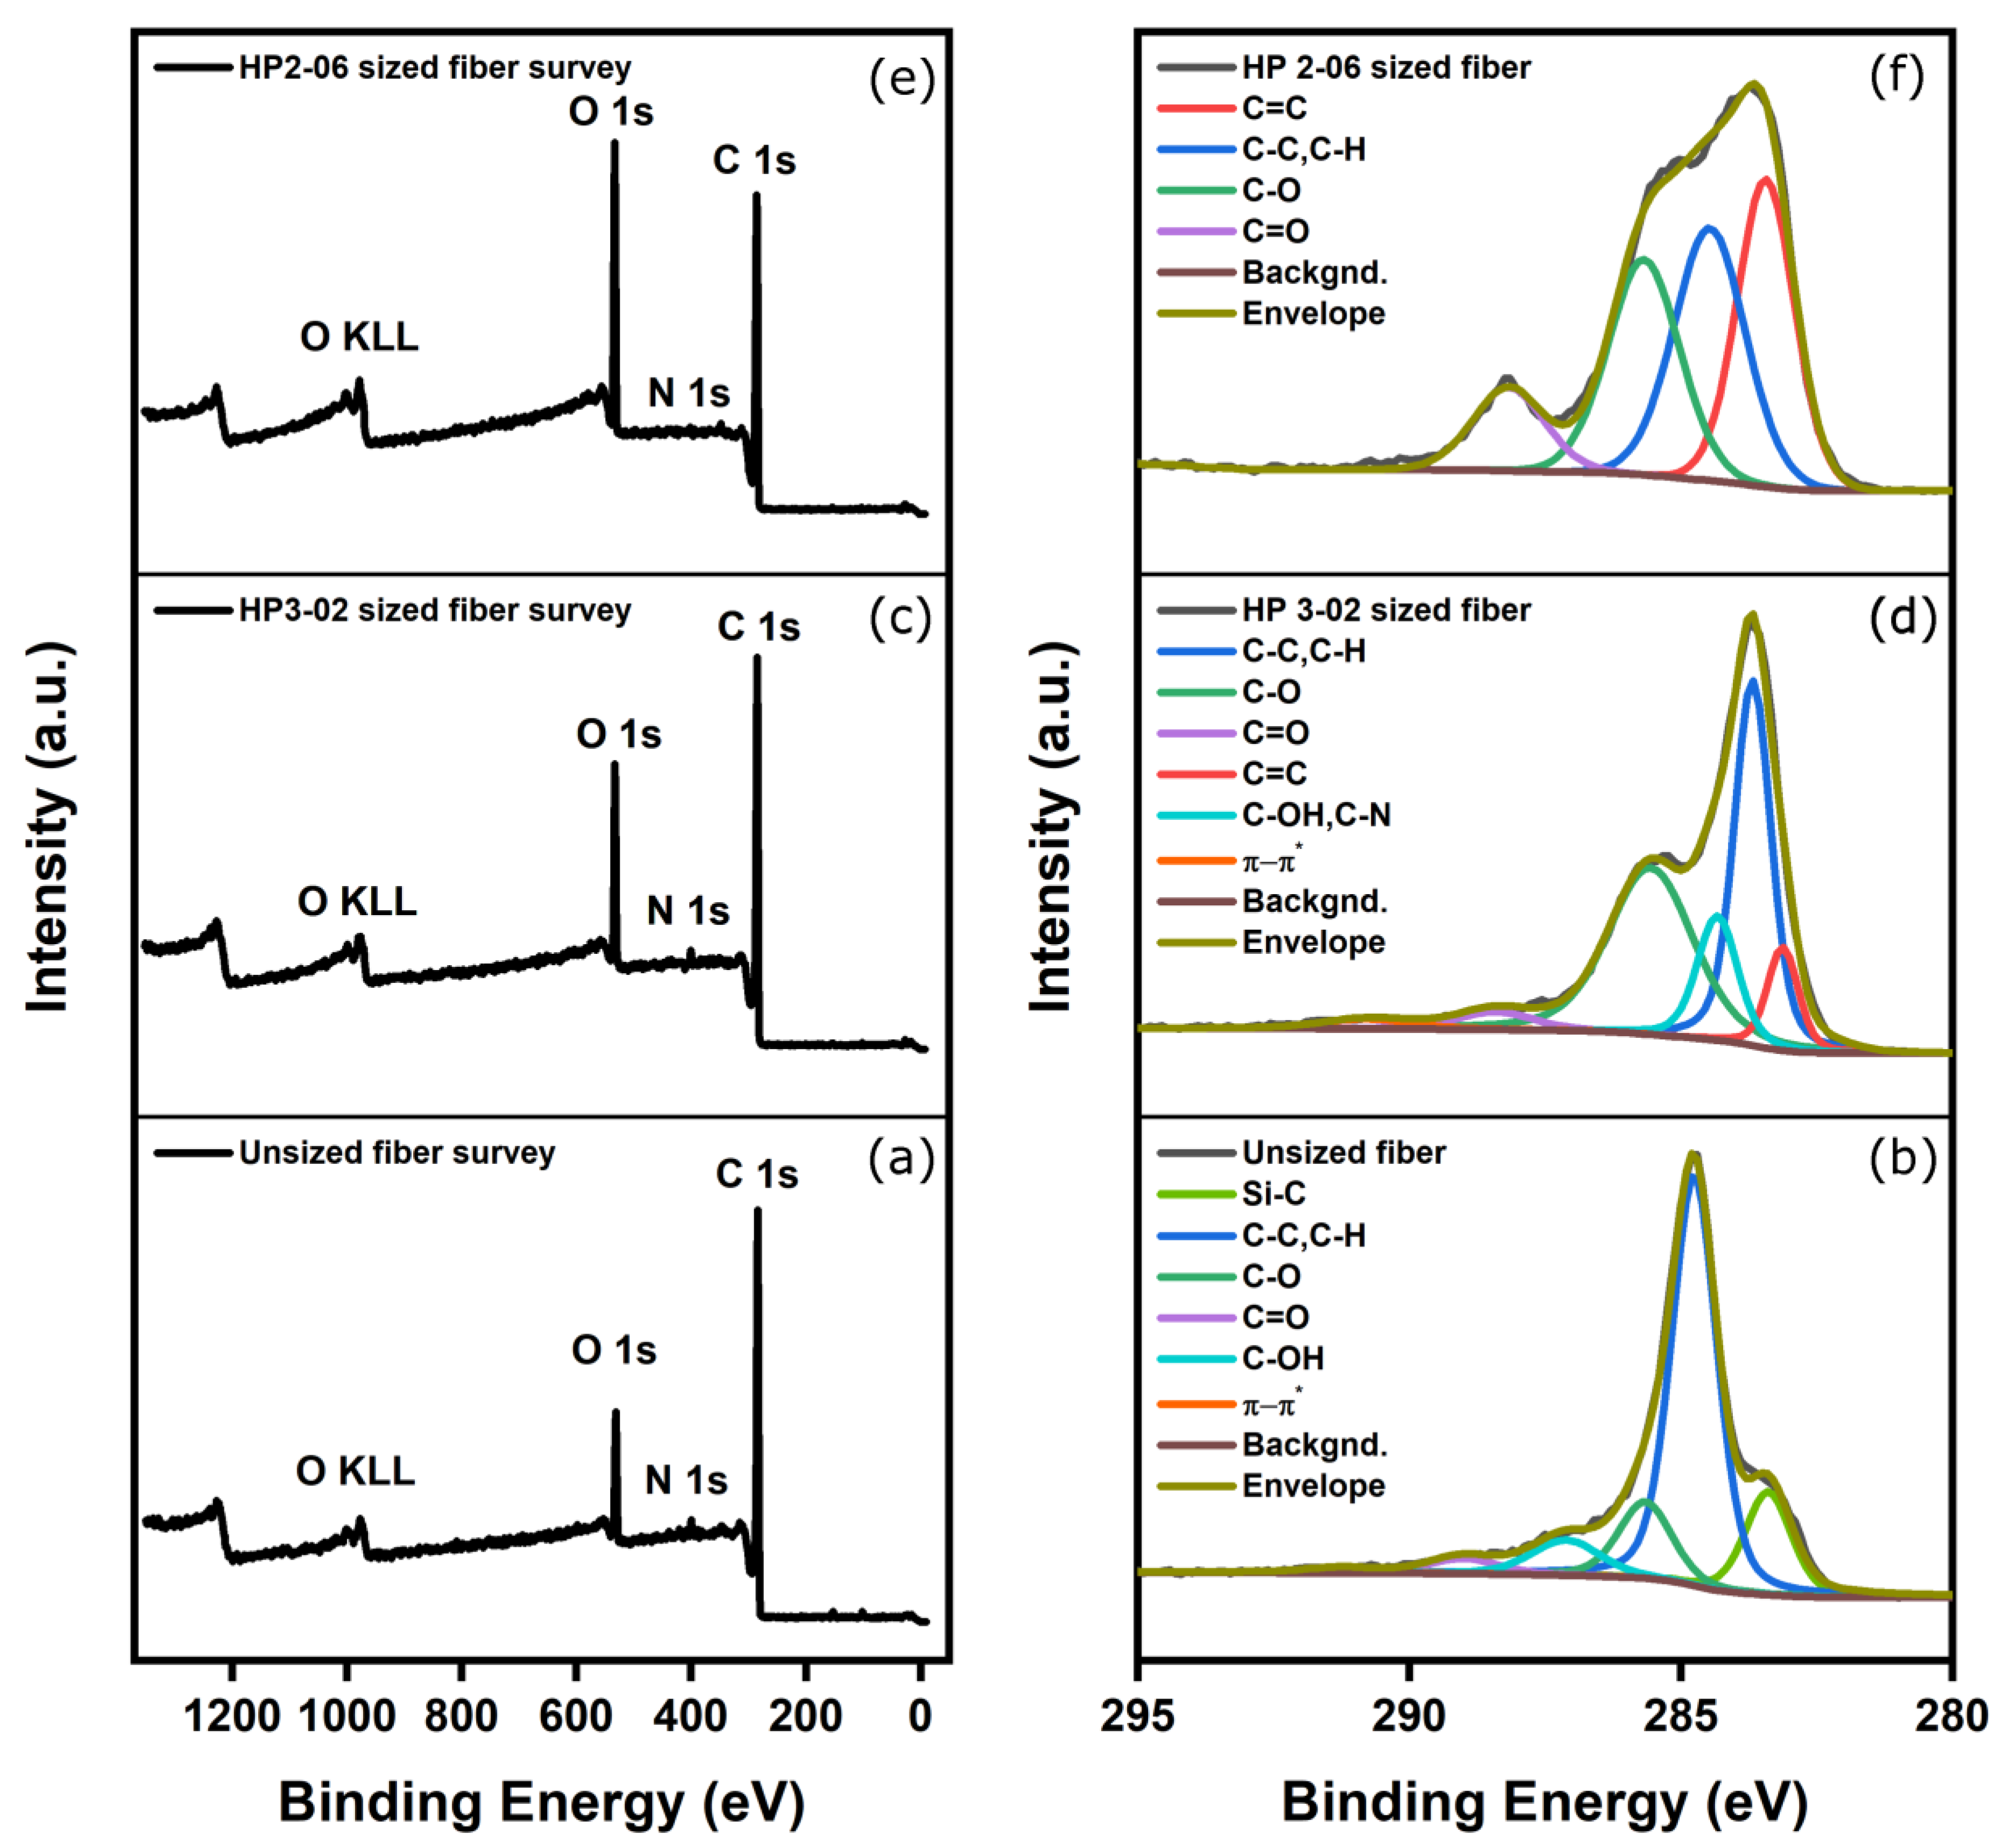
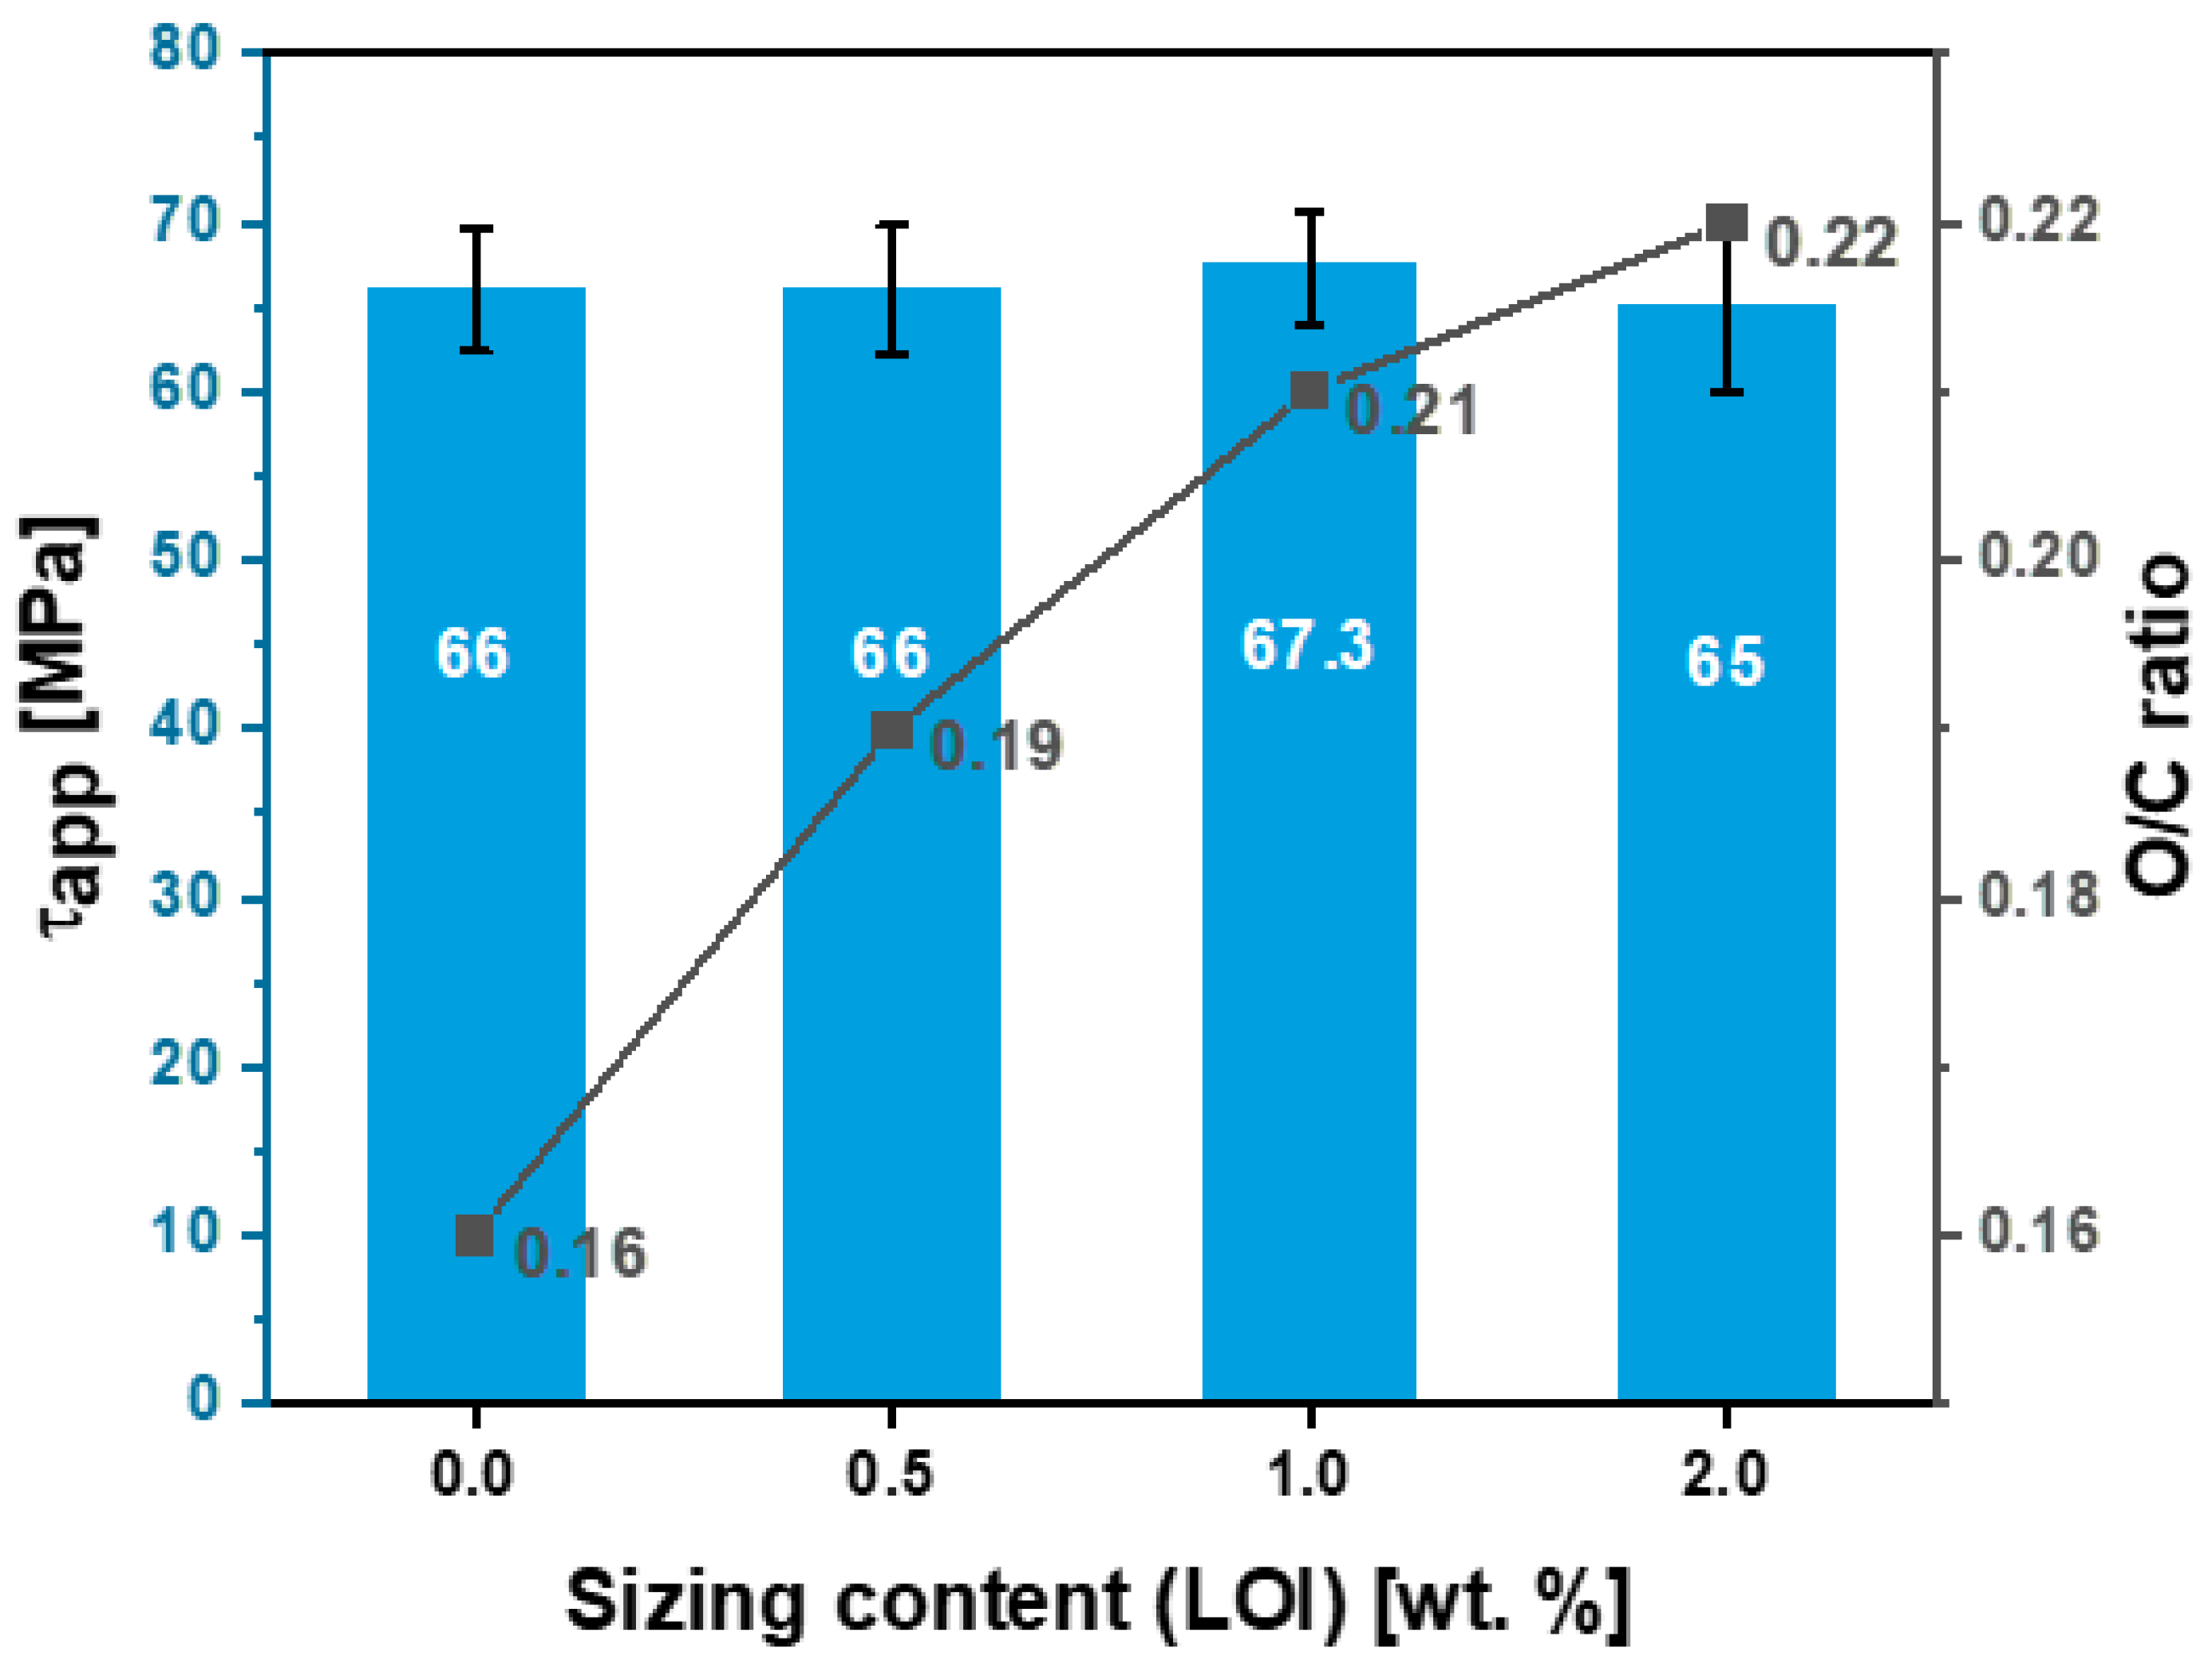
4.3. The Effect of Sizing on Functional Groups
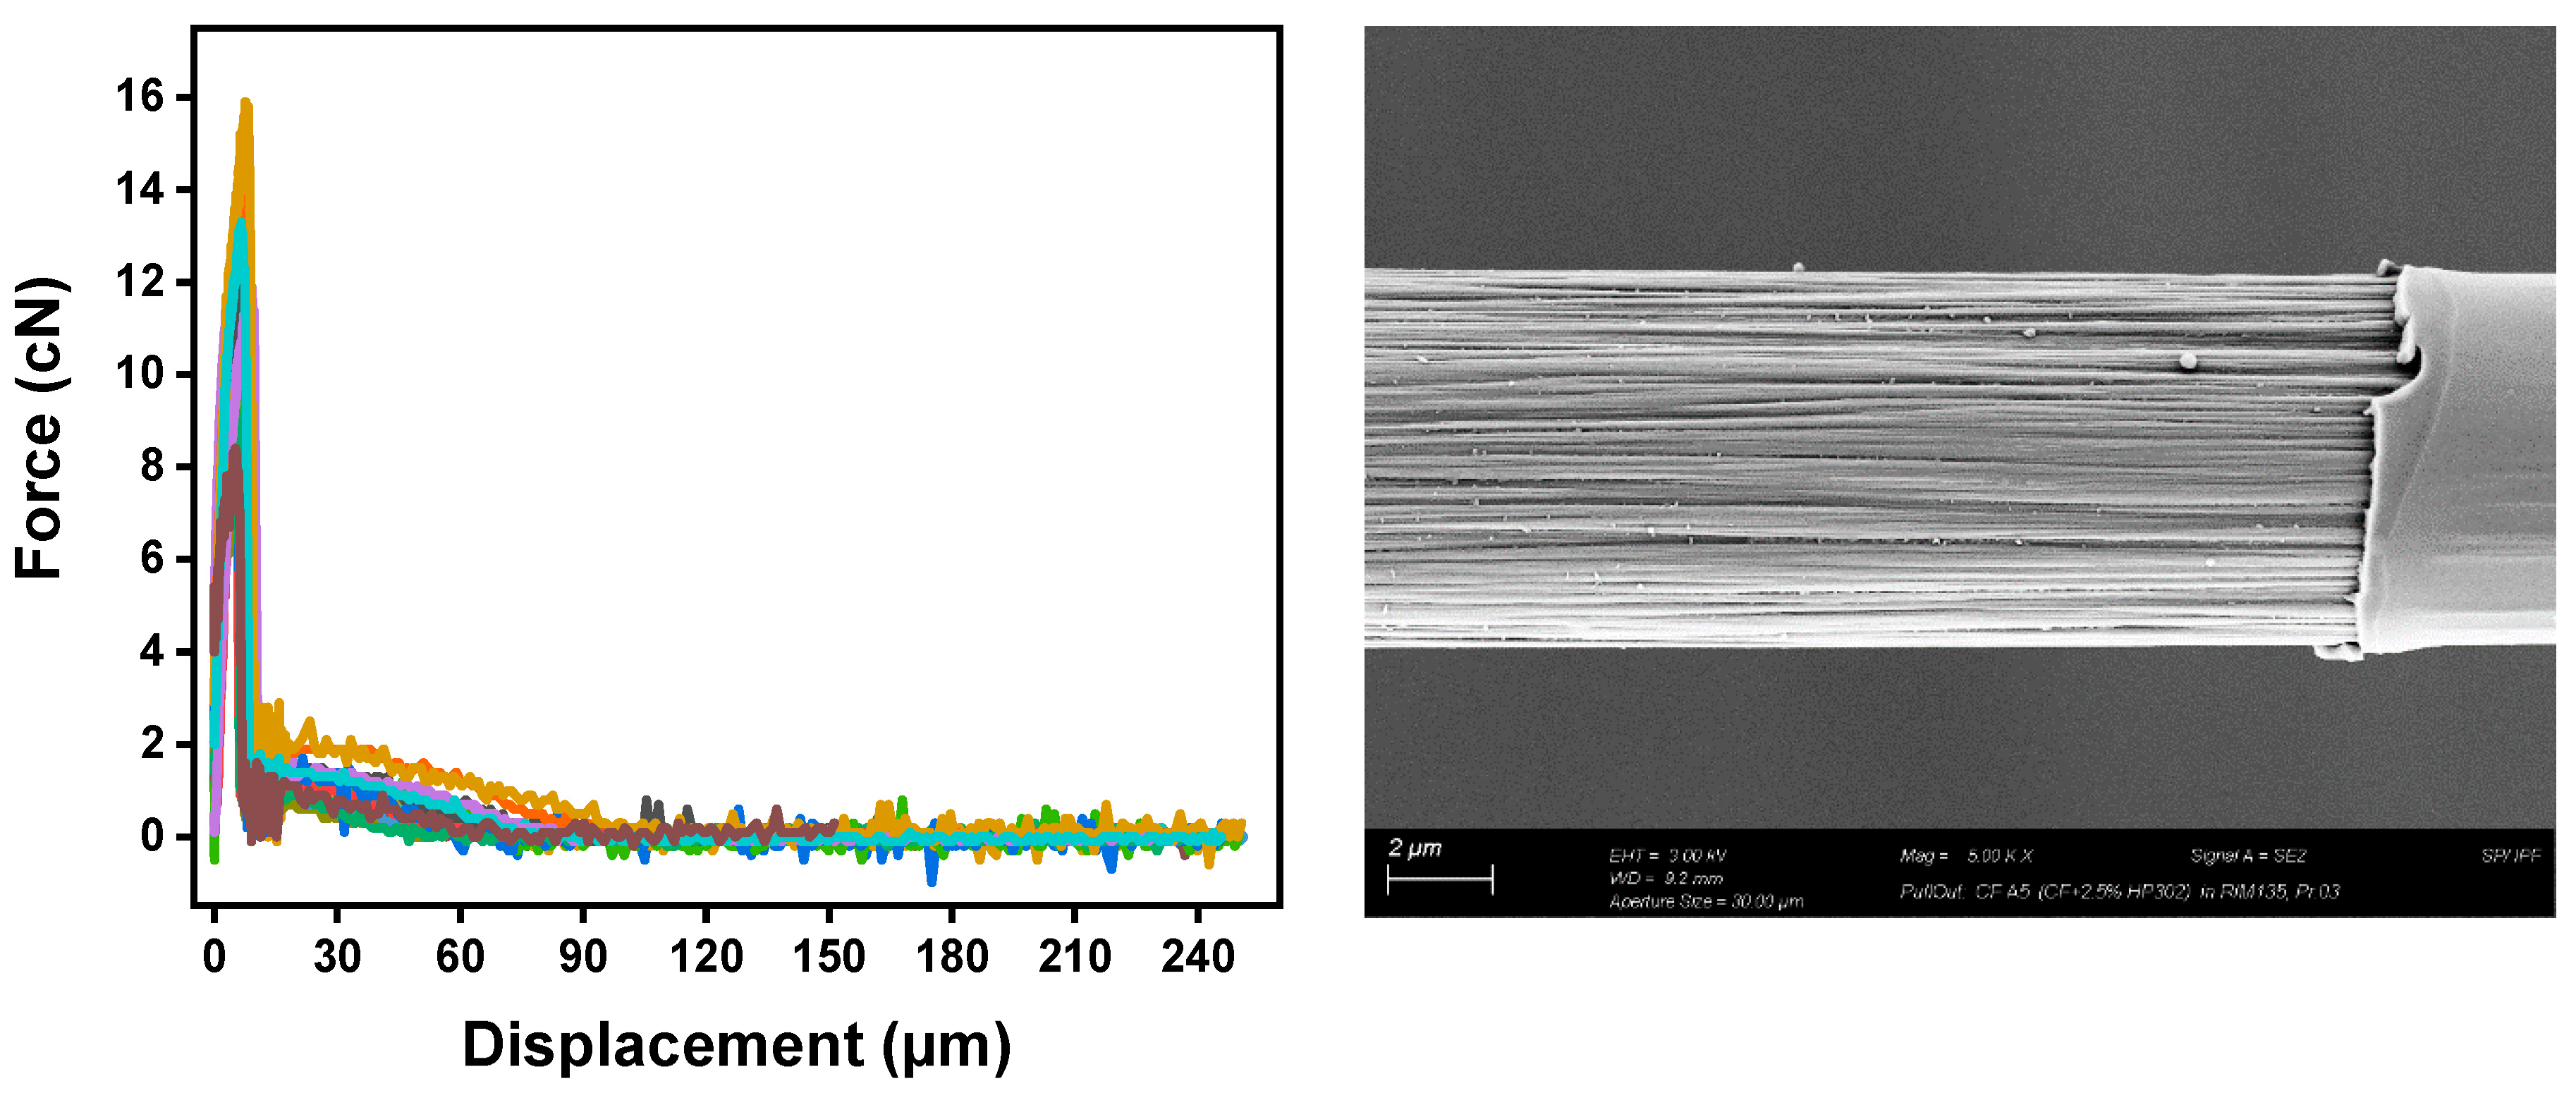
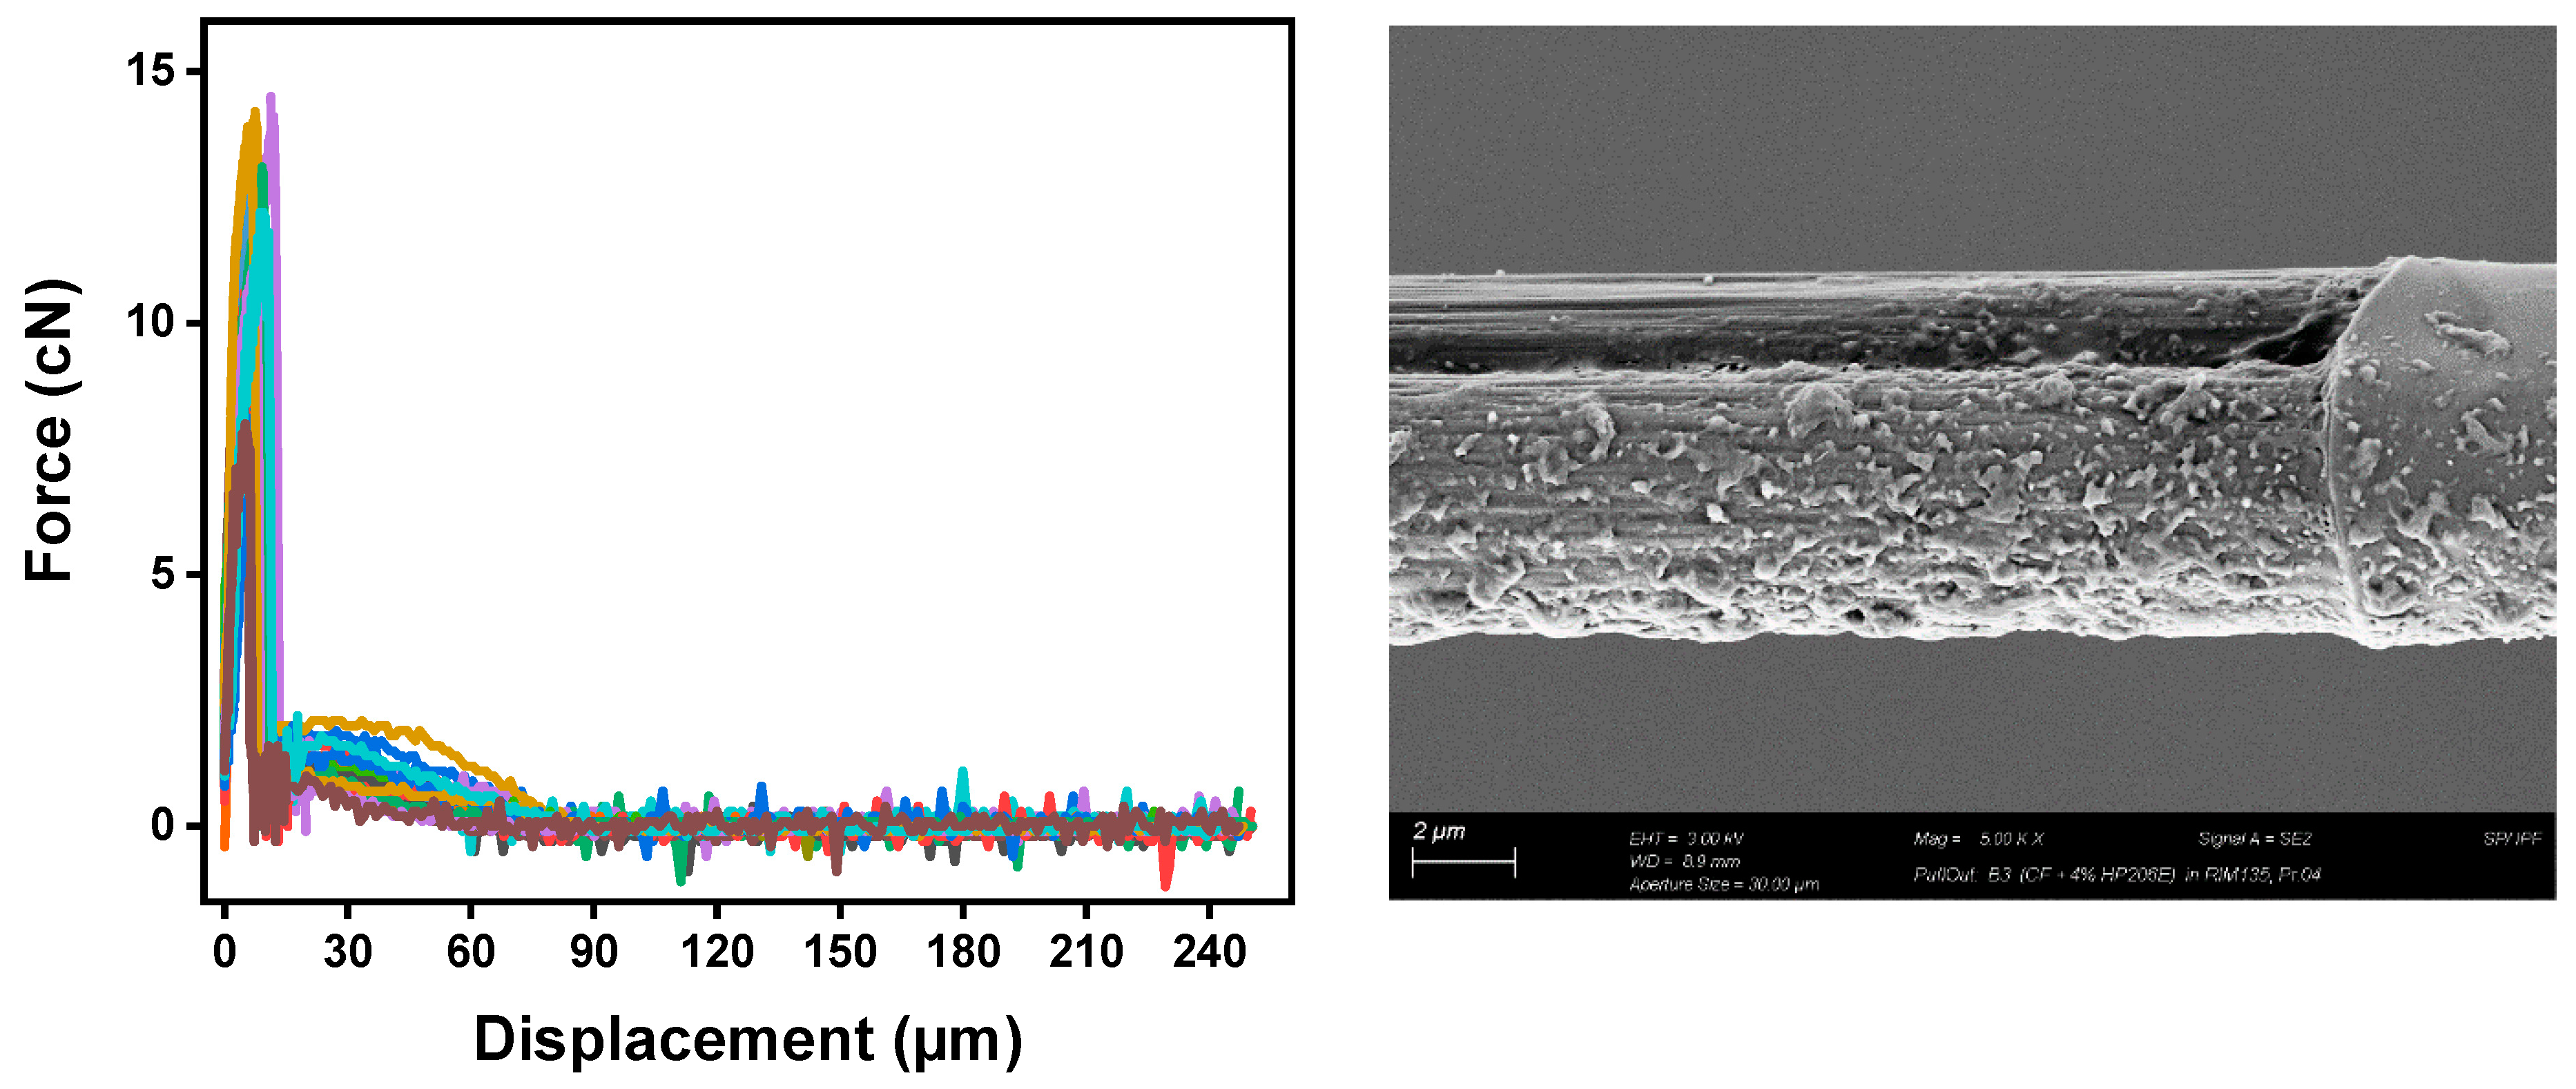
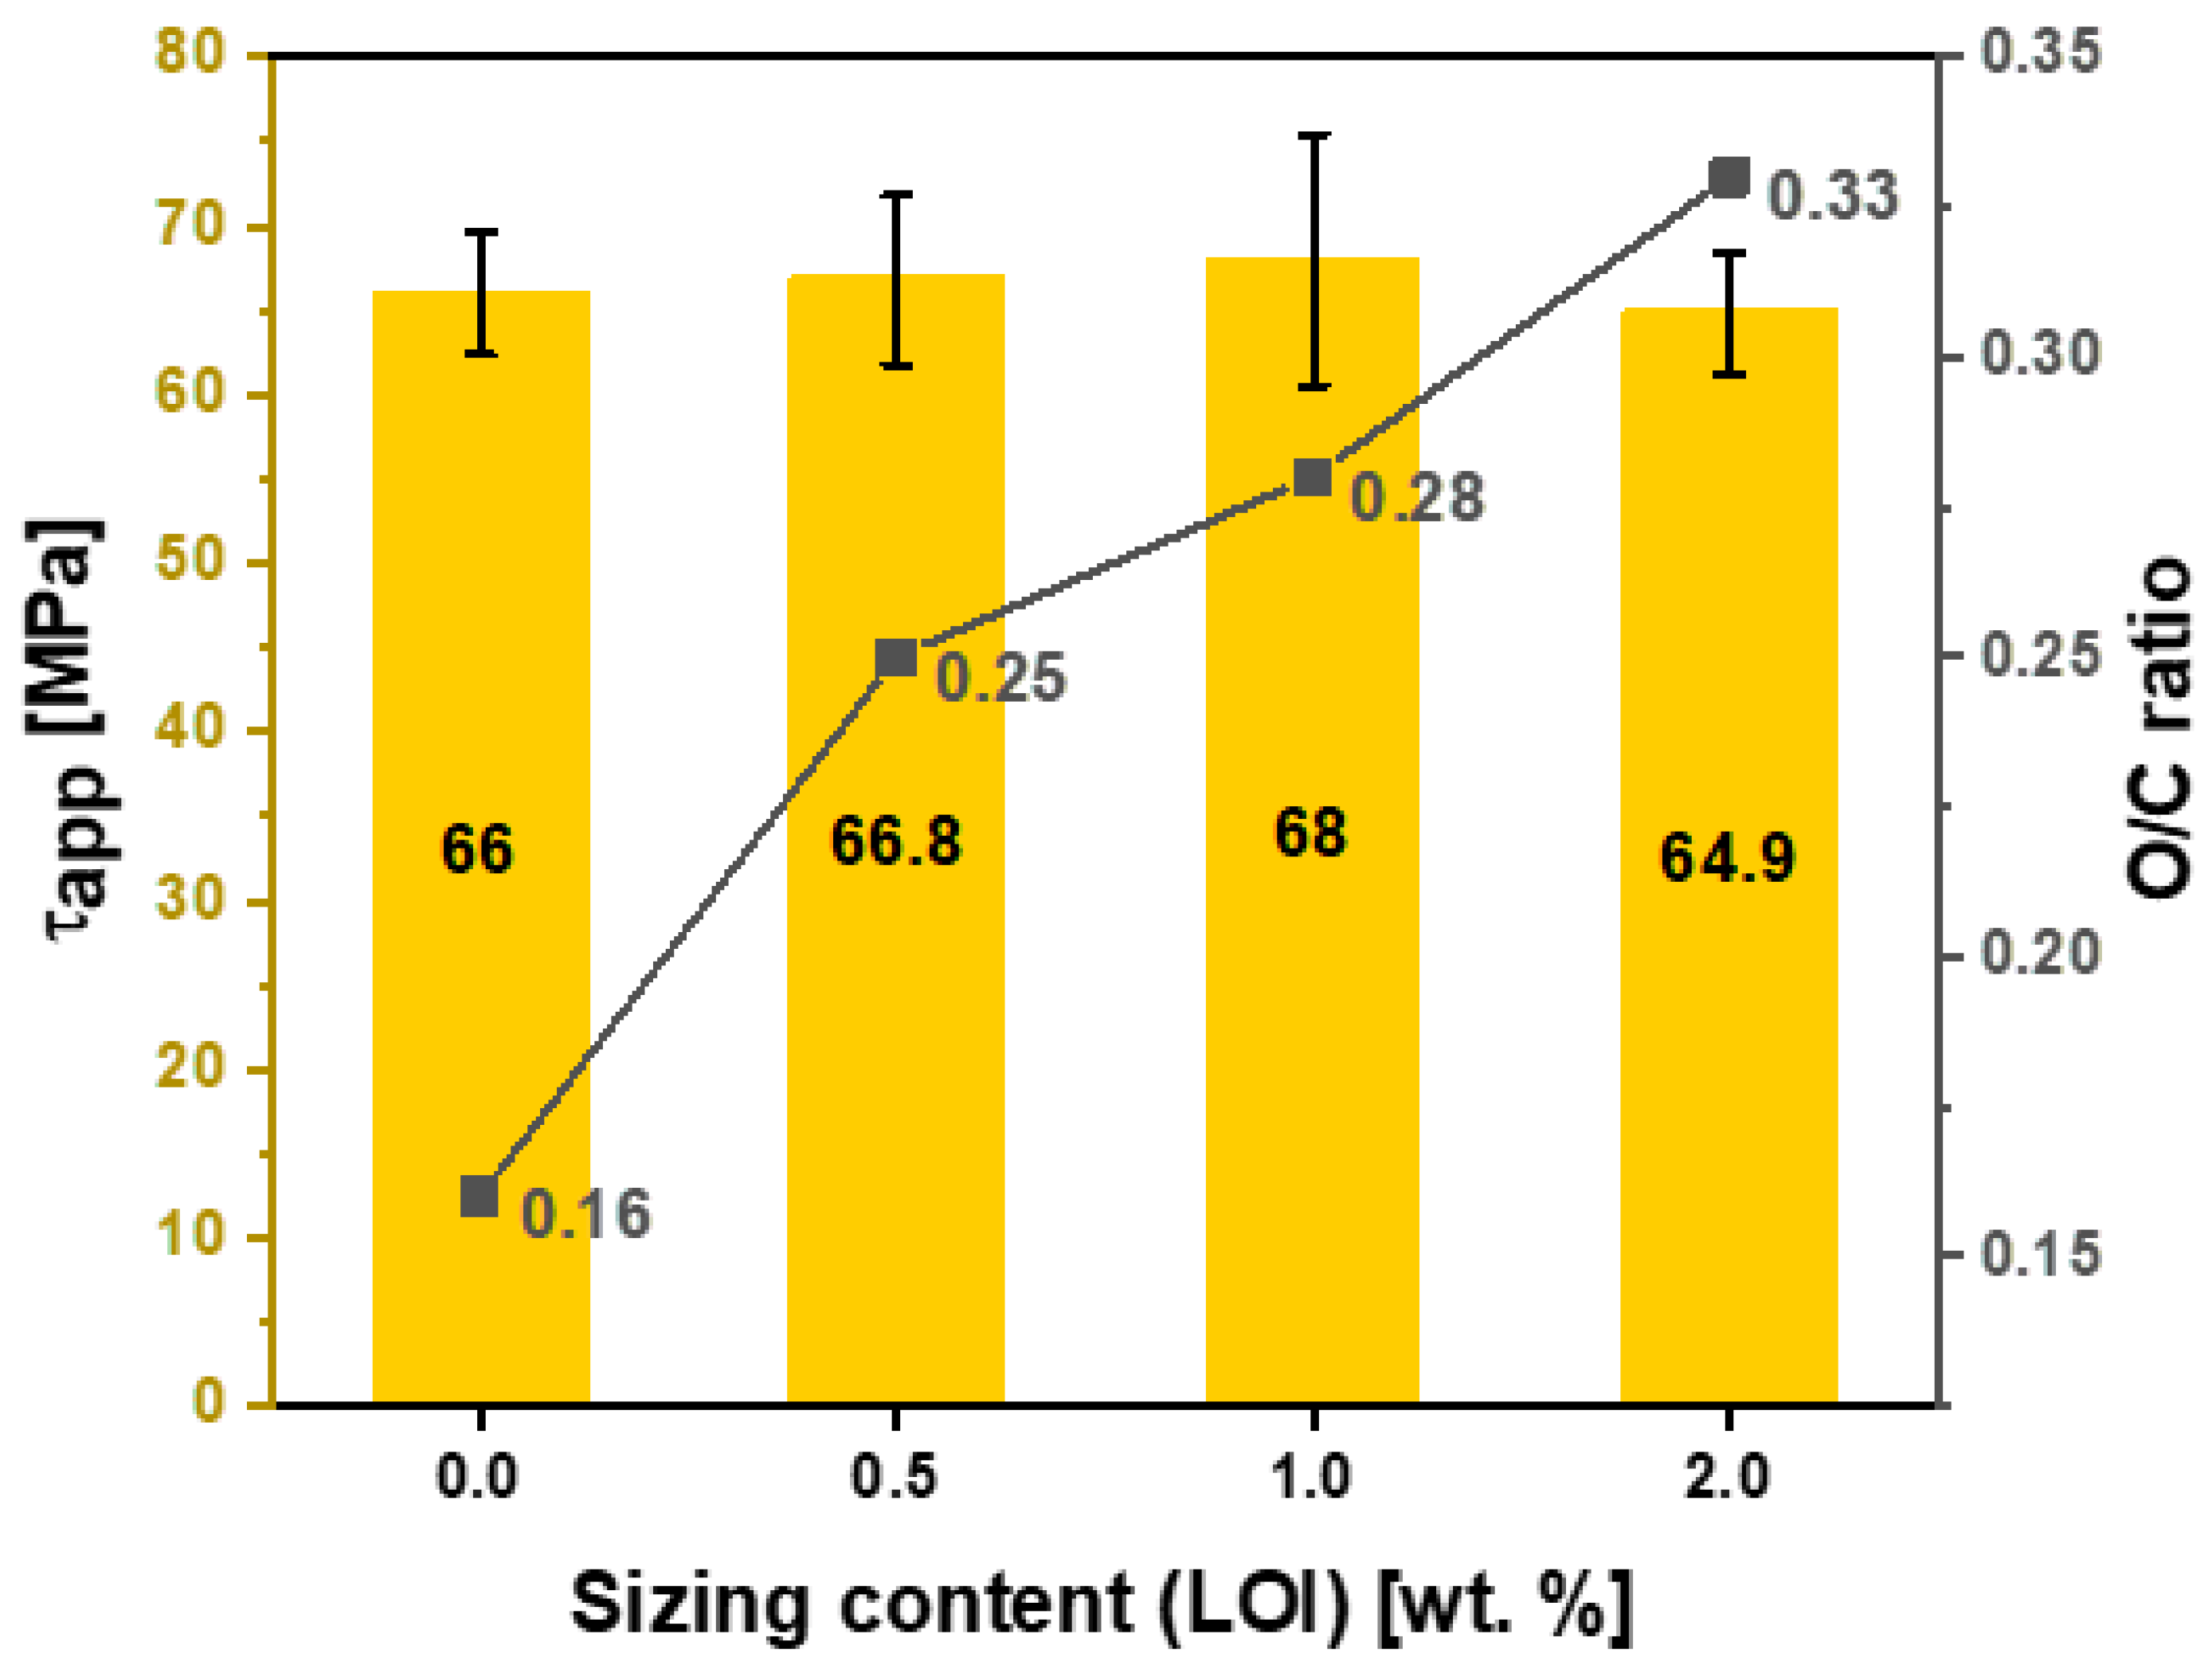
4.4. The Effect of Sizing Levels on the Fiber’s Interfacial Properties
5. Conclusions
Author Contributions
Funding
Institutional Review Board Statement
Data Availability Statement
Acknowledgments
Conflicts of Interest
References
- Advani, S.G.; Sozer, E.M. Process Modeling in Composites Manufacturing; CRC Press: Boca Raton, FL, USA, 2002. [Google Scholar]
- Jaber, A.A.; Obaid, A.A.; Advani, S.G.; Gillespie, J.W. Influence of Relative Humidity on Charge Stability of Ozone Treated Polystyrene Particles. J. Appl. Polym. Sci. 2020, 138, 49900. [Google Scholar] [CrossRef]
- Jaber, A.A.; Obaid, A.A.; Advani, S.G.; Gillespie, J.W., Jr. Prediction of circumferential equilibrium spacing between charged polymer particles in contact with a grounded carbon fiber. Powder Technol. 2021, 386, 307–318. [Google Scholar] [CrossRef]
- Jaber, A.A.; Obaid, A.A.; Advani, S.G.; Gillespie, J.W., Jr. Prediction of equilibrium spacing between charged polymer particles in contact with a carbon fiber. J. Electrost. 2021, 111, 103577. [Google Scholar] [CrossRef]
- Jaber, A.A.; Obaid, A.A.; Advani, S.G.; Gillespie, J.W., Jr. Experimental investigation of dry powder coating processing parameters on the polystyrene particle’s distribution on the surface of carbon fibers. Powder Technol. 2021, 393, 461–470. [Google Scholar] [CrossRef]
- Park, S.-J. Carbon Fibers; Springer Series in Materials Science; Springer: Dordrecht, The Netherlands, 2015; Volume 210. [Google Scholar]
- Lim, T.H.; Kim, M.S.; Yeo, S.Y.; Jeong, E. Preparation and evaluation of isotropic and mesophase pitch-based carbon fibers using the pelletizing and continuous spinning process. J. Ind. Text. 2019, 48, 1242–1253. [Google Scholar] [CrossRef]
- Park, S.-J.; Heo, G.-Y. Precursors and manufacturing of carbon fibers. In Carbon Fibers; Springer: Berlin/Heidelberg, Germany, 2015; pp. 31–66. [Google Scholar]
- Lewis, S. The use of carbon fibre composites on military aircraft. Compos. Manuf. 1994, 5, 95–103. [Google Scholar] [CrossRef]
- Soutis, C. Fibre reinforced composites in aircraft construction. Prog. Aerosp. Sci. 2005, 41, 143–151. [Google Scholar] [CrossRef]
- Vedernikov, A.; Tucci, F.; Safonov, A.; Carlone, P.; Gusev, S.; Akhatov, I. Investigation on the Shape Distortions of Pultruded Profiles at Different Pulling Speed. Procedia Manuf. 2020, 47, 1–5. [Google Scholar] [CrossRef]
- Vedernikov, A.N.; Safonov, A.A.; Gusev, S.A.; Carlone, P.; Tucci, F.; Akhatov, I.S. Spring-in experimental evaluation of L-shaped pultruded profiles. IOP Conf. Ser. Mater. Sci. Eng. 2020, 747, 012013. [Google Scholar] [CrossRef]
- Khayyam, H.; Jazar, R.N.; Nunna, S.; Golkarnarenji, G.; Badii, K.; Fakhrhoseini, S.M.; Kumar, S.; Naebe, M. PAN precursor fabrication, applications and thermal stabilization process in carbon fiber production: Experimental and mathematical modelling. Prog. Mater. Sci. 2020, 107, 100575. [Google Scholar] [CrossRef]
- Sedghi, A.; Farsani, R.E.; Shokuhfar, A. The effect of commercial polyacrylonitrile fibers characterizations on the produced carbon fibers properties. J. Mater. Process. Technol. 2008, 198, 60–67. [Google Scholar] [CrossRef]
- Xu, Z.; Li, J.; Wu, X.; Huang, Y.; Chen, L.; Zhang, G. Effect of kidney-type and circular cross sections on carbon fiber surface and composite interface. Compos. Part A Appl. Sci. Manuf. 2008, 39, 301–307. [Google Scholar] [CrossRef]
- Cai, J.Y.; McDonnell, J.; Brackley, C.; O’Brien, L.; Church, J.S.; Millington, K.; Smith, S.; Phair-Sorensen, N. Polyacrylonitrile-based precursors and carbon fibers derived from advanced RAFT technology and conventional methods—The 1st comparative study. Mater. Today Commun. 2016, 9, 22–29. [Google Scholar] [CrossRef]
- Moskowitz, J.D.; Abel, B.A.; McCormick, C.L.; Wiggins, J.S. High molecular weight and low dispersity polyacrylonitrile by low temperature RAFT polymerization. J. Polym. Sci. Part A Polym. Chem. 2016, 54, 553–562. [Google Scholar] [CrossRef]
- Perrier, S.; Takolpuckdee, P. Macromolecular design via reversible addition-fragmentation chain transfer (RAFT)/xanthates (MADIX) polymerization. J. Polym. Sci. Part A Polym. Chem. 2005, 43, 5347–5393. [Google Scholar] [CrossRef]
- Zhang, J. Different Surface Treatments of Carbon Fibers and Their Influence on the Interfacial Properties of Carbon Fiber/Epoxy Composites. Ph.D. Thesis, École Centrale Paris, Gif-sur-Yvette, France, 2012. [Google Scholar]
- Dai, Z.; Shi, F.; Zhang, B.; Li, M.; Zhang, Z. Effect of sizing on carbon fiber surface properties and fibers/epoxy interfacial adhesion. Appl. Surf. Sci. 2011, 257, 6980–6985. [Google Scholar] [CrossRef]
- Kamps, J.H.; Henderson, L.C.; Scheffler, C.; Van der Heijden, R.; Simon, F.; Bonizzi, T.; Verghese, N. Electrolytic Surface Treatment for Improved Adhesion between Carbon Fibre and Polycarbonate. Materials 2018, 11, 2253. [Google Scholar] [CrossRef] [PubMed]
- Kamps, J.H.; Scheffler, C.; Simon, F.; van der Heijden, R.; Verghese, N. Functional polycarbonates for improved adhesion to carbon fibre. Compos. Sci. Technol. 2018, 167, 448–455. [Google Scholar] [CrossRef]
- Tiwari, S.; Bijwe, J. Surface Treatment of Carbon Fibers—A Review. Procedia Technol. 2014, 14, 505–512. [Google Scholar] [CrossRef]
- Kim, J.-K.; Mai, Y.-W. Engineered Interfaces in Fiber Reinforced Composites; Elsevier: Amsterdam, The Netherlands, 1998. [Google Scholar]
- Sharma, M.; Gao, S.; Mäder, E.; Sharma, H.; Wei, L.Y.; Bijwe, J. Carbon fiber surfaces and composite interphases. Compos. Sci. Technol. 2014, 102, 35–50. [Google Scholar] [CrossRef]
- Morgan, P. Carbon Fibers and Their Composites; CRC Press: Boca Raton, FL, USA, 2005. [Google Scholar]
- Yao, S.-S.; Jin, F.L.; Rhee, K.Y.; Hui, D.; Park, S.J. Recent advances in carbon-fiber-reinforced thermoplastic composites: A review. Compos. Part B Eng. 2018, 142, 241–250. [Google Scholar] [CrossRef]
- Li, N.; Liu, G.; Wang, Z.; Liang, J.; Zhang, X. Effect of surface treatment on surface characteristics of carbon fibers and interfacial bonding of epoxy resin composites. Fibers Polym. 2014, 15, 2395–2403. [Google Scholar] [CrossRef]
- Drzal, L.T.; Rich, M.J.; Koenig, M.F.; Lloyd, P.F. Adhesion of Graphite Fibers to Epoxy Matrices: II. The Effect of Fiber Finish. J. Adhes. 1983, 16, 133–152. [Google Scholar]
- Stojcevski, F.; Hilditch, T.B.; Gengenbach, T.R.; Henderson, L.C. Effect of carbon fiber oxidization parameters and sizing deposition levels on the fiber-matrix interfacial shear strength. Compos. Part A Appl. Sci. Manuf. 2018, 114, 212–224. [Google Scholar] [CrossRef]
- ISO 1887:2014; Determination of Combustible-Matter Content, International Standard Confirmed. ISO: Geneva, Switzerland, 2014.
- Pisanova, E.; Zhandarov, S.; Dovgyalo, V. Interfacial adhesion and failure modes in single filament thermoplastic composites. Polym. Compos. 1994, 15, 147–155. [Google Scholar] [CrossRef]
- Mäder, E.; Grundke, K.; Jacobasch, H.J.; Wachinger, G. Surface, interphase and composite property relations in fibre-reinforced polymers. Composites 1994, 25, 739–744. [Google Scholar] [CrossRef]
- Textechno. Fibre-Matrix Adhesion Tester FIMATEST; Textechno: Mönchengladbac, Germany, 2016. [Google Scholar]
- Scheffler, C.; Förster, T.; Mäder, E.; Heinrich, G.; Hempel, S.; Mechtcherine, V. Aging of alkali-resistant glass and basalt fibers in alkaline solutions: Evaluation of the failure stress by Weibull distribution function. J. Non-Cryst. Solids 2009, 355, 2588–2595. [Google Scholar] [CrossRef]


| Mechanical Data | Value |
|---|---|
| Density [g/cm3] | 1.15 |
| Tensile strength [MPa] | 70 |
| Tensile modulus [GPa] | 2.95 |
| Sample Name | Sizing Formulation | Solid Content of Film Former (wt.%) | Targeted Lot Mass (g) | DI-Water Diluting Mass (g) | Sizing Level (LOI) (wt.%) |
|---|---|---|---|---|---|
| A1 | Hydrosize® HP3-02 | 2 | 11.73 | 188.27 | 0.80 ± 0.06 |
| A2 | 3 | 17.60 | 182.40 | 1.17 ± 0.03 | |
| A3 | 4 | 23.47 | 176.53 | 1.61 ± 0.05 | |
| B1 | Hydrosize® HP2-06 | 2 | 15.31 | 184.69 | 0.46 ± 0.05 |
| B2 | 3 | 22.96 | 177.04 | 0.81 ± 0.02 | |
| B3 | 4 | 30.62 | 169.38 | 1.02 ± 0.02 |
| Sample Name | Sizing Formulation | Solid Content of Film Former (wt.%) | Targeted Lot Mass (g) | DI-Water Diluting Mass (g) | Sizing Level (LOI) (wt.%) |
|---|---|---|---|---|---|
| A4 | Hydrosize® HP3-02 | 1.29 | 7.57 | 192.43 | 0.5 ± 0.03 |
| A5 | 2.52 | 14.78 | 185.22 | 1.04 ± 0.03 | |
| A6 | 5.0 | 29.28 | 170.72 | 2 ± 0.16 | |
| B8 | Hydrosize® HP2-06 | 6.90 | 52.81 | 147.19 | 2.09 ± 0.15 |
| Sample Name | Sizing Formulation | Sizing Level [wt.%] | ||||
|---|---|---|---|---|---|---|
| Unsized fibers (Reference) | NA | 0 | 3.52 | 6.42 | 0.98 | 50 |
| A4 | Hydrosize® HP3-02 | 0.5 | 3.55 | 8.48 | 0.95 | 50 |
| A5 | 1 | 3.72 | 7.58 | 0.97 | 50 | |
| A6 | 2 | 3.43 | 5.34 | 0.98 | 50 | |
| B1 | Hydrosize® HP2-06 | 0.5 | 3.74 | 7.51 | 0.95 | 50 |
| B3 | 1 | 3.27 | 9.21 | 0.91 | 50 | |
| B8 | 2 | 3.43 | 7.49 | 0.98 | 50 |
| Sample Name | Sizing Content (wt.%) | |||||||
|---|---|---|---|---|---|---|---|---|
| B.E./eV | A.C./% | B.E./eV | A.C./% | B.E./eV | A.C./% | |||
| Unsized fiber (Reference) | 0 | 284.80 | 83.1 | 532.0 | 13.2 | 400.3 | 2.3 | 0.16 |
| A4 | 0.5 | 284.80 | 81.4 | 532.8 | 15.4 | 400.1 | 2.7 | 0.19 |
| A5 | 1 | 284.80 | 79.5 | 532.8 | 17.0 | 400.0 | 2.0 | 0.21 |
| A6 | 2 | 284.80 | 80.5 | 533.1 | 17.9 | 400.4 | 1.6 | 0.22 |
| B1 | 0.5 | 284.80 | 78.3 | 532.8 | 19.6 | 400.4 | 2.1 | 0.25 |
| B3 | 1 | 284.80 | 77.0 | 532.8 | 21.4 | 400.2 | 1.5 | 0.28 |
| B4 | 2 | 284.77 | 74.1 | 532.5 | 24.5 | 399.6 | 1 | 0.33 |
| Sample Name | Sizing Formulation | Sizing Level [wt.%] | Broken Fibers | (IFSS) [MPa] | le [µm] |
|---|---|---|---|---|---|
| Unsized fibers (Reference) | NA | 0 | 0/21 | 66.0 ± 3.7 | 79 ± 15 |
| A4 | Hydrosize® HP3-02 | 0.5 | 0/20 | 66.0 ± 3.8 | 80 ± 11 |
| A5 | 1 | 0/20 | 67.3 ± 3.4 | 75 ± 14 | |
| A6 | 2 | 0/20 | 65.0 ± 5.1 | 80 ± 11 | |
| B1 | Hydrosize® HP2-06 | 0.5 | 0/20 | 66.8 ± 5.0 | 73 ± 13 |
| B3 | 1 | 0/20 | 68.0 ± 7.5 | 78 ± 10 | |
| B8 | 2 | 0/20 | 64.9 ± 3.6 | 76 ± 9 |
Disclaimer/Publisher’s Note: The statements, opinions and data contained in all publications are solely those of the individual author(s) and contributor(s) and not of MDPI and/or the editor(s). MDPI and/or the editor(s) disclaim responsibility for any injury to people or property resulting from any ideas, methods, instructions or products referred to in the content. |
© 2023 by the authors. Licensee MDPI, Basel, Switzerland. This article is an open access article distributed under the terms and conditions of the Creative Commons Attribution (CC BY) license (https://creativecommons.org/licenses/by/4.0/).
Share and Cite
Jaber, A.A.; Abbas, S.A.; Farah, A.A.; Kopeć, K.K.; Alsalik, Y.M.; Tayeb, M.A.; Verghese, N. Effect of Fiber Sizing Levels on the Mechanical Properties of Carbon Fiber-Reinforced Thermoset Composites. Polymers 2023, 15, 4678. https://doi.org/10.3390/polym15244678
Jaber AA, Abbas SA, Farah AA, Kopeć KK, Alsalik YM, Tayeb MA, Verghese N. Effect of Fiber Sizing Levels on the Mechanical Properties of Carbon Fiber-Reinforced Thermoset Composites. Polymers. 2023; 15(24):4678. https://doi.org/10.3390/polym15244678
Chicago/Turabian StyleJaber, Albraa A., Sara A. Abbas, Abdiaziz A. Farah, Karina K. Kopeć, Yahya M. Alsalik, Mohammed A. Tayeb, and Nikhil Verghese. 2023. "Effect of Fiber Sizing Levels on the Mechanical Properties of Carbon Fiber-Reinforced Thermoset Composites" Polymers 15, no. 24: 4678. https://doi.org/10.3390/polym15244678
APA StyleJaber, A. A., Abbas, S. A., Farah, A. A., Kopeć, K. K., Alsalik, Y. M., Tayeb, M. A., & Verghese, N. (2023). Effect of Fiber Sizing Levels on the Mechanical Properties of Carbon Fiber-Reinforced Thermoset Composites. Polymers, 15(24), 4678. https://doi.org/10.3390/polym15244678