


Using Heating and Cooling Presses in Combination to Optimize the Consolidation Process of Polycarbonate-Based Unidirectional Thermoplastic Composite Tapes


Abstract
1. Introduction
2. Experimental
2.1. Material
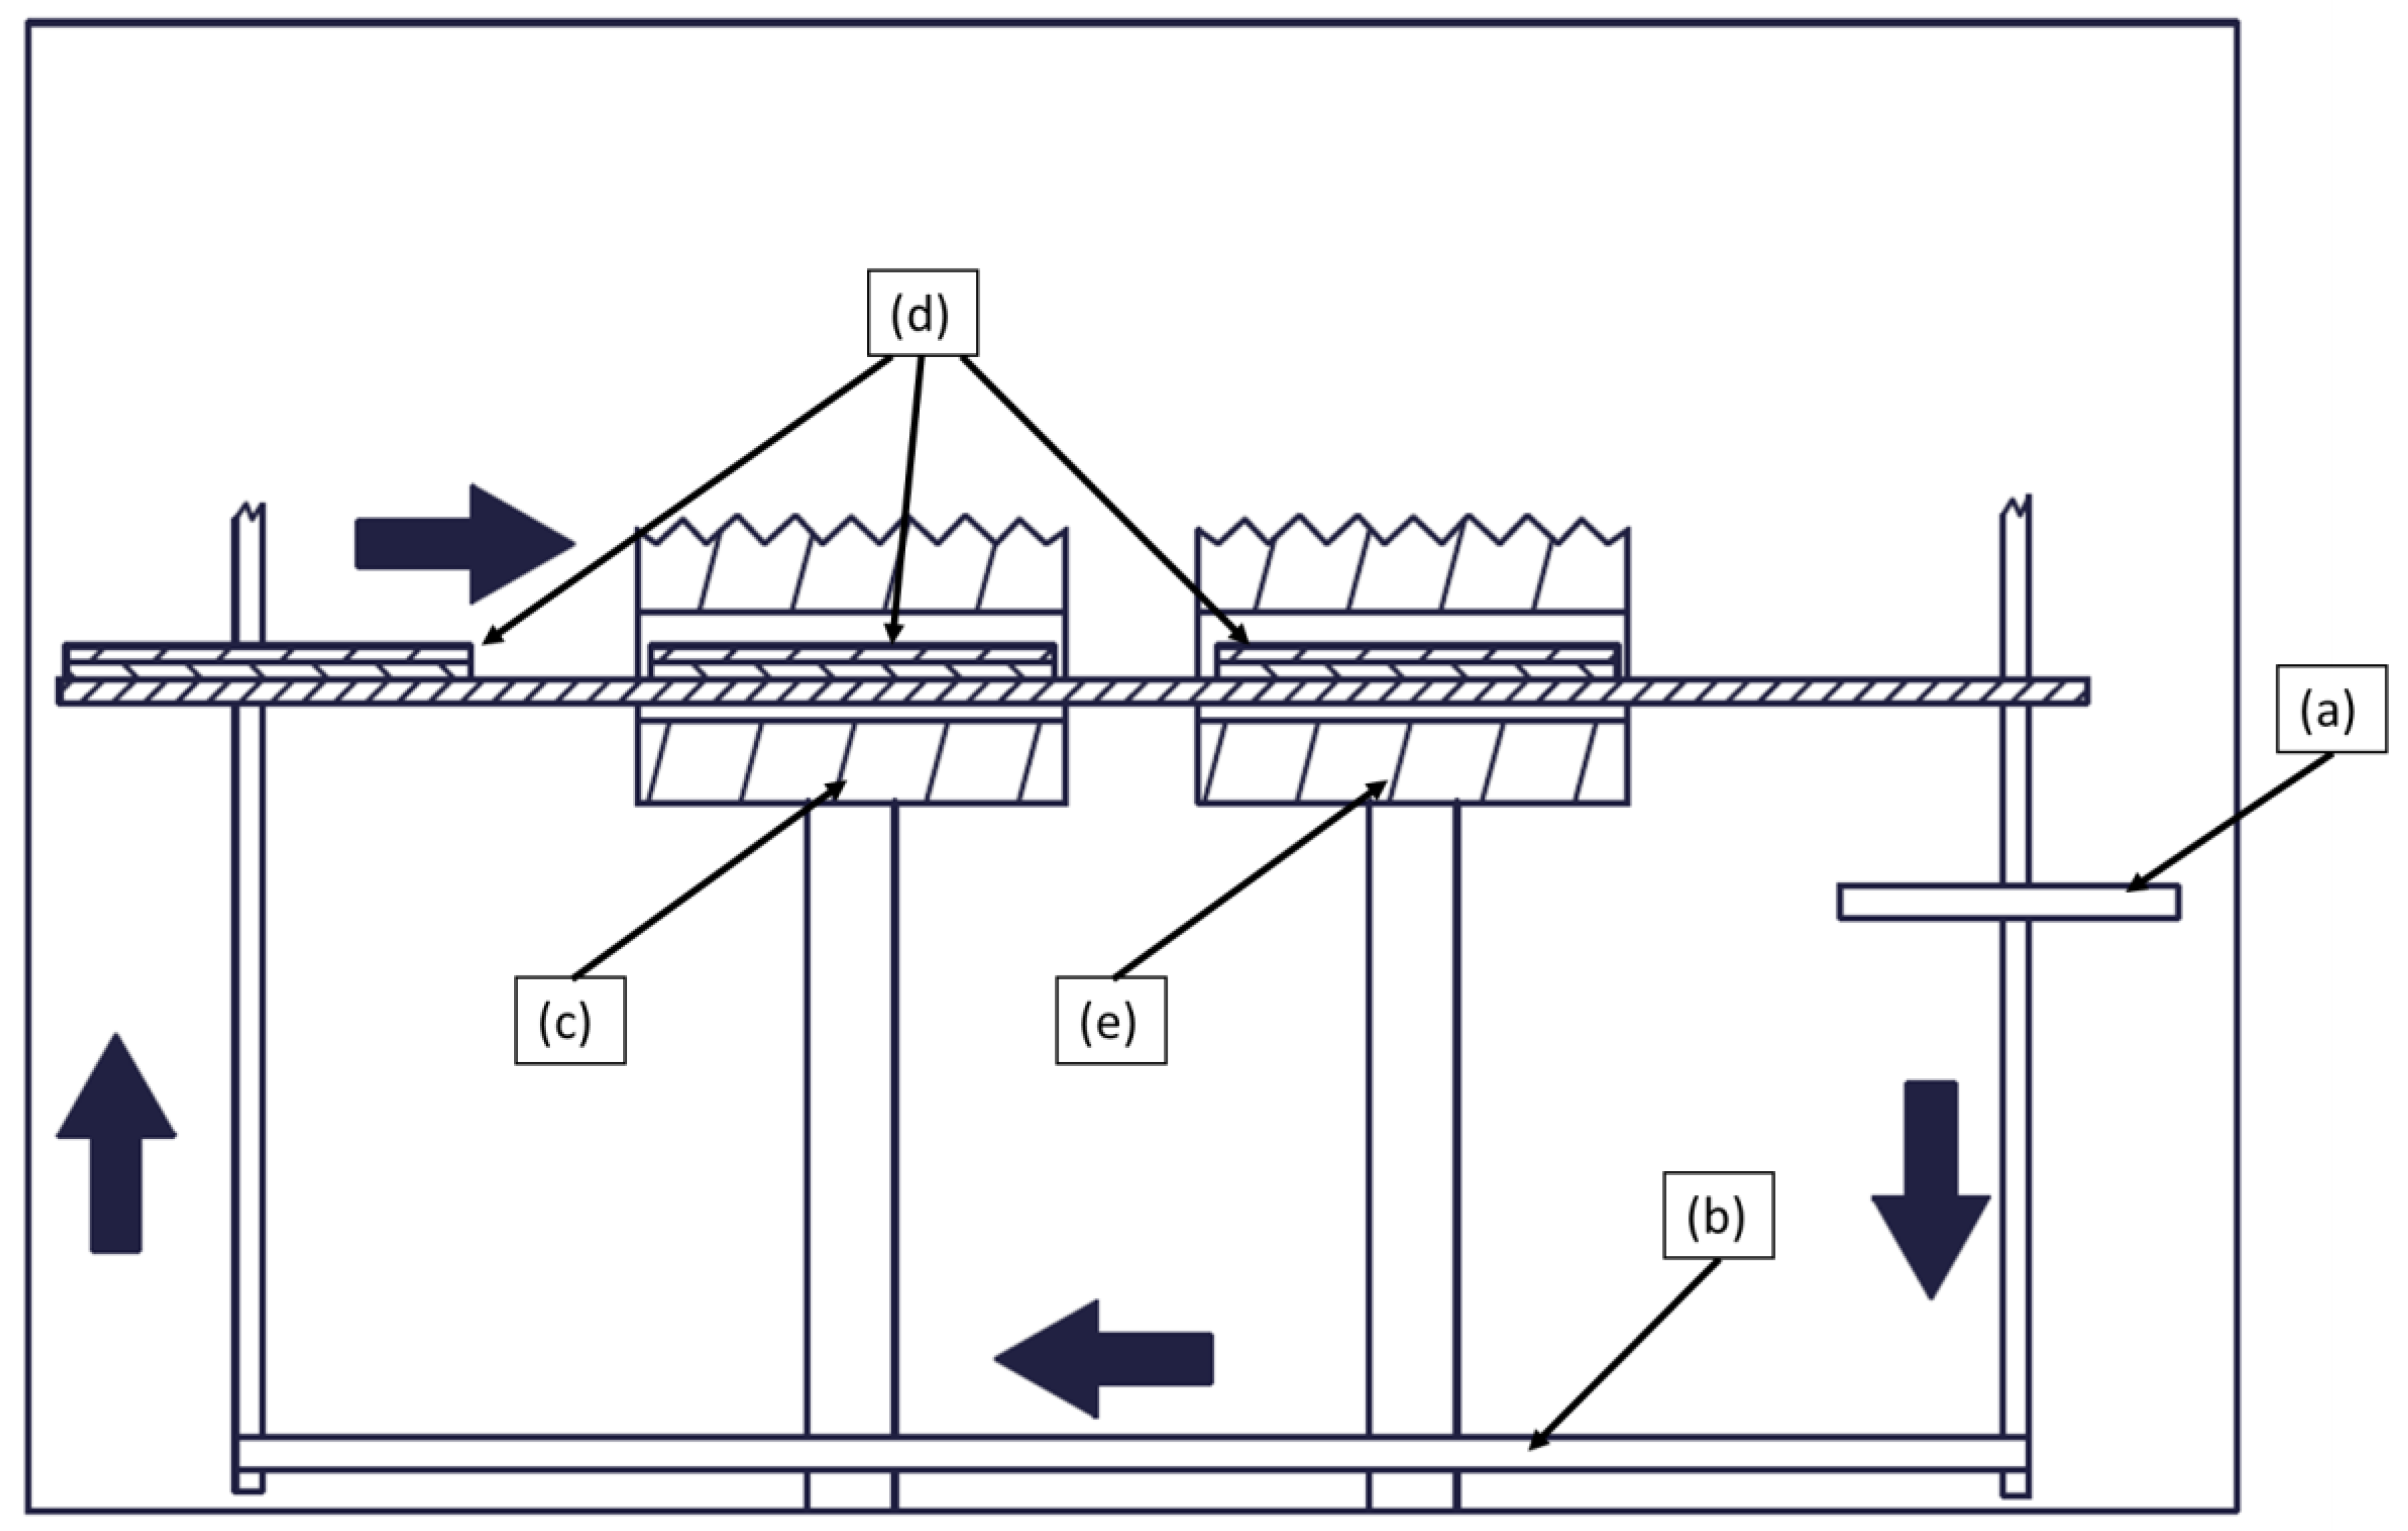
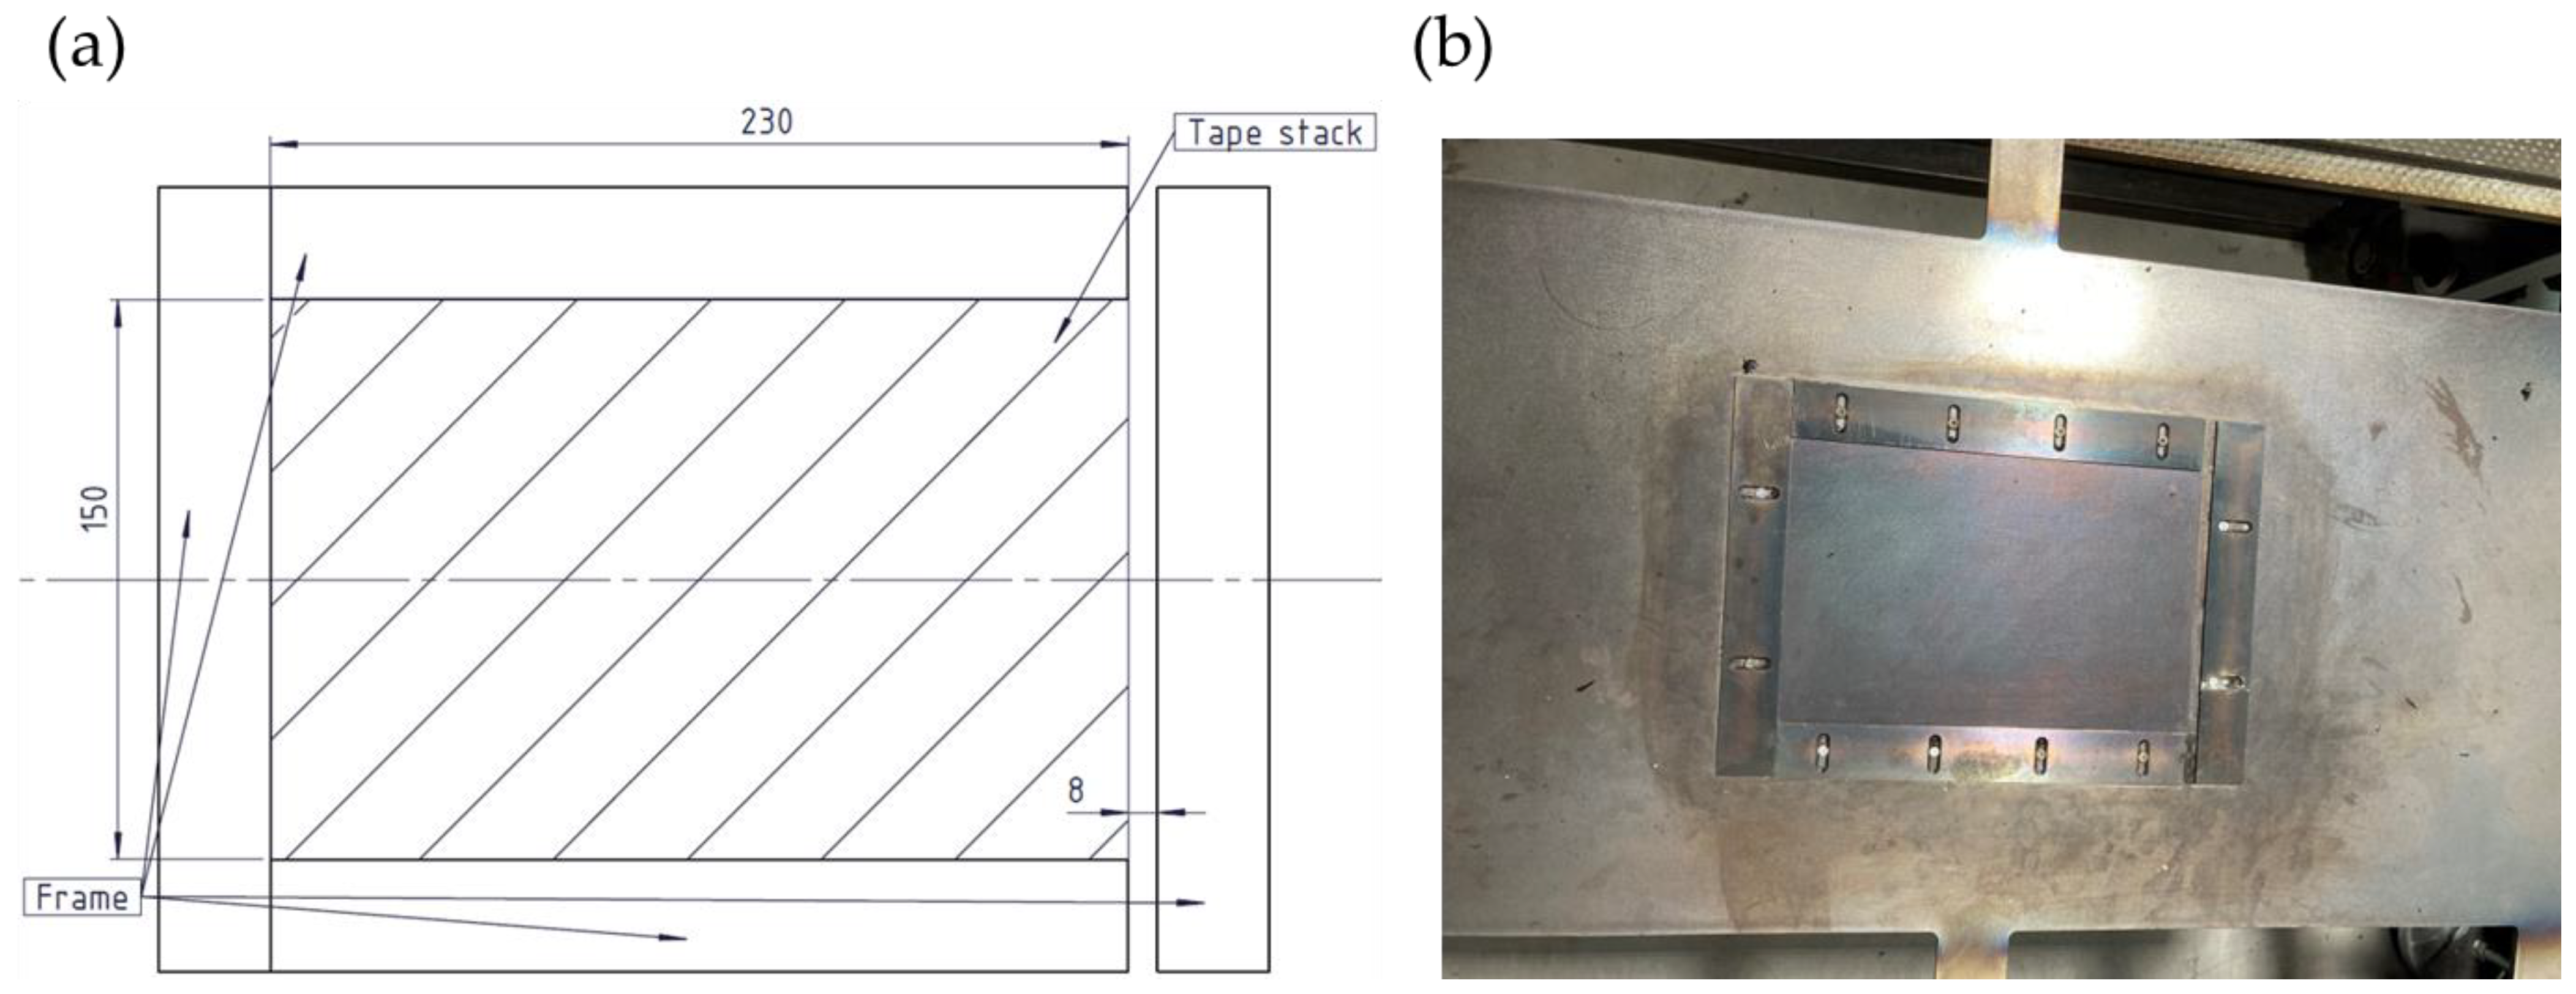
2.2. Experimental Set-Up
2.3. Experimental Design
2.4. Measurement Methods
2.4.1. Projected Area
2.4.2. Thickness
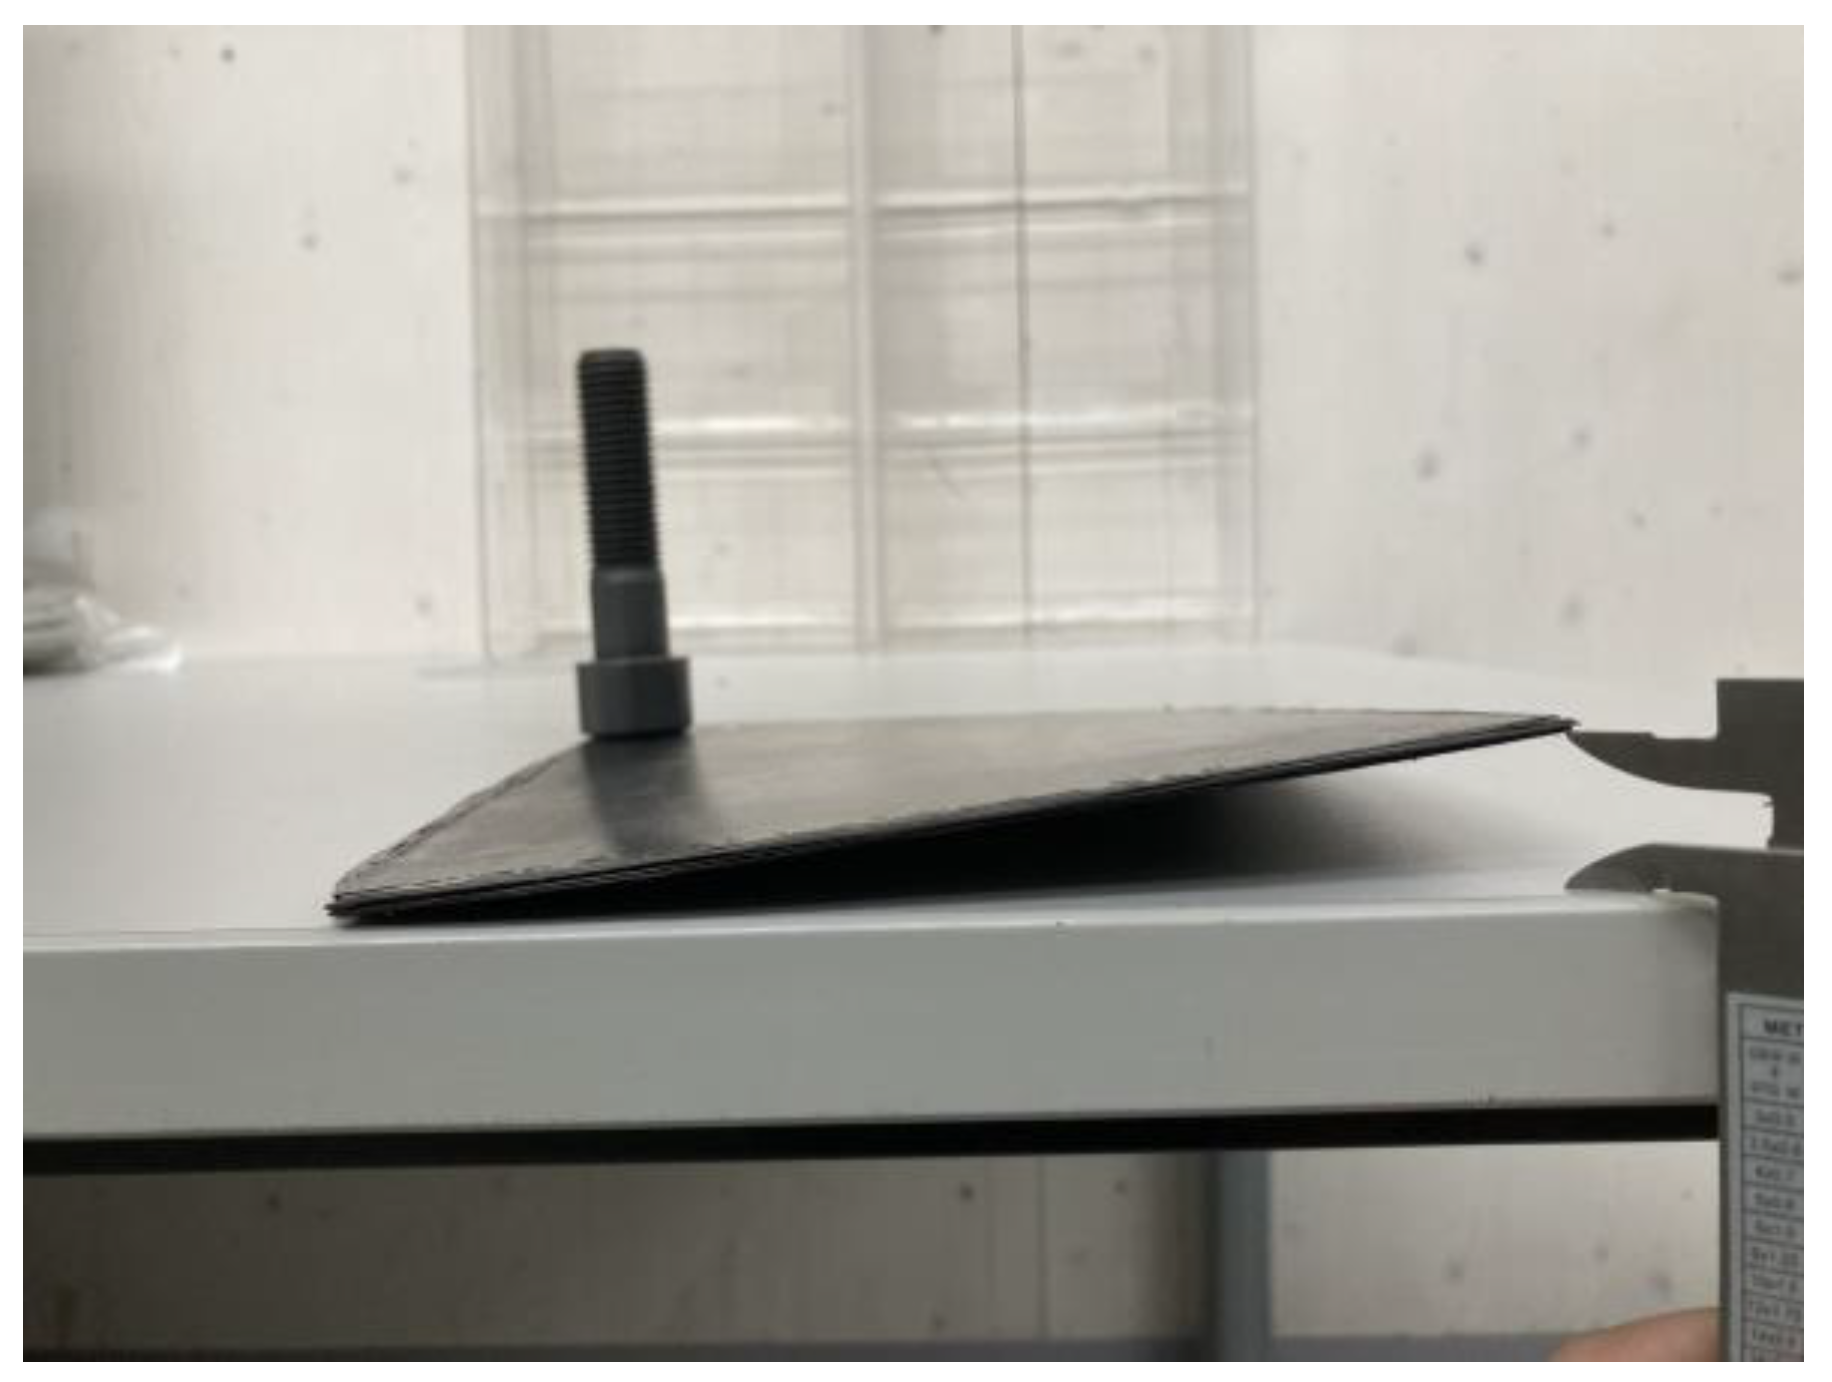
2.4.3. Warpage
2.4.4. Density and Void Content
2.4.5. Apparent Shear Strength
3. Results and Discussion
3.1. Screening Test
3.1.1. Projected Area and Thickness
3.1.2. Warpage
3.1.3. Density
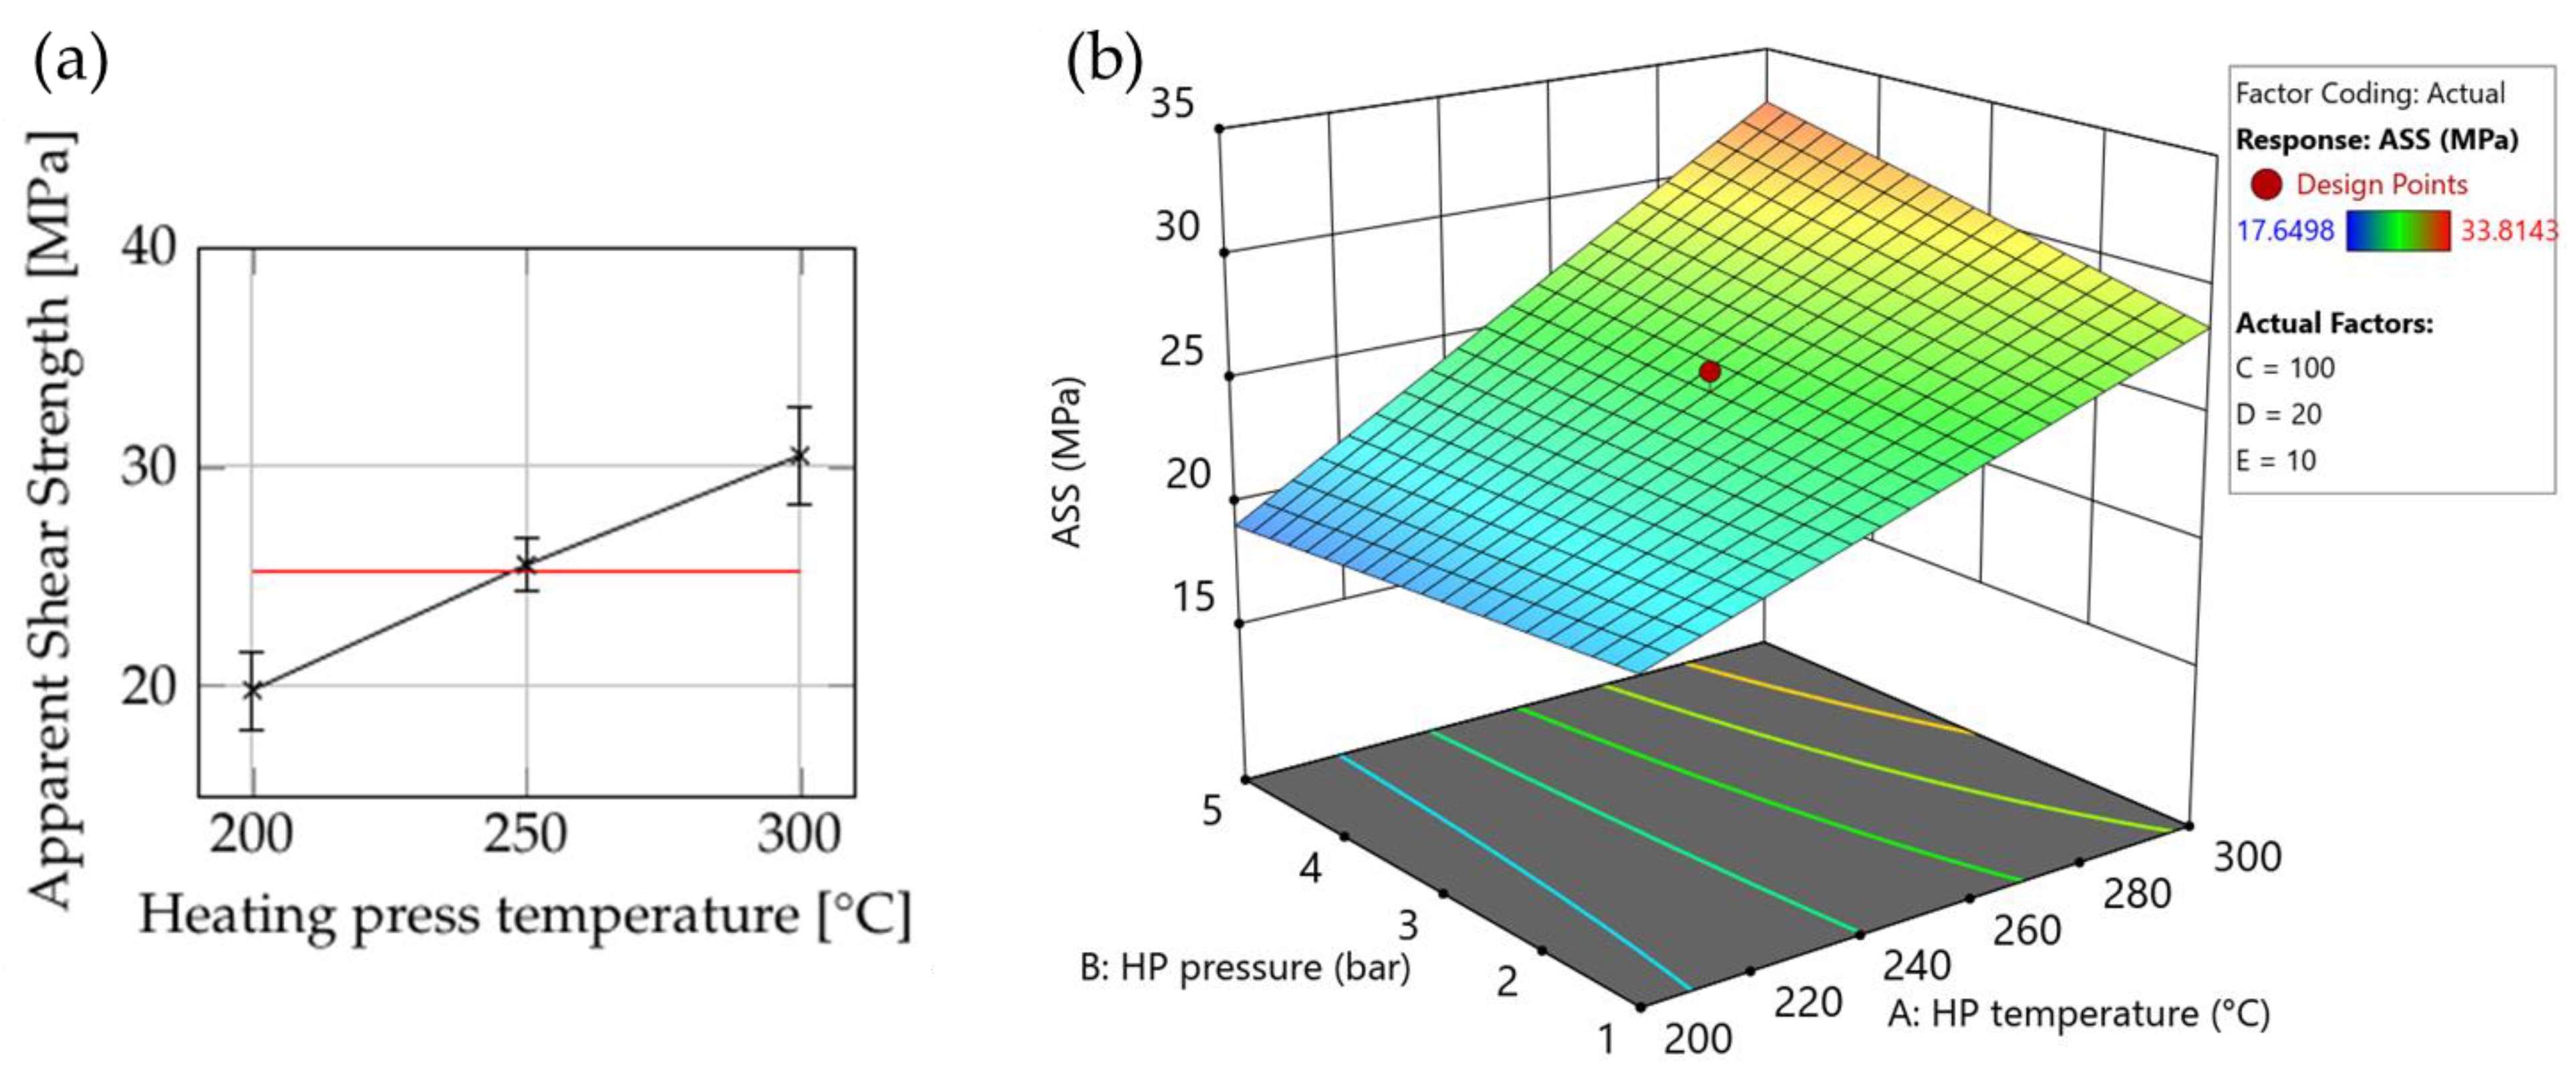
3.1.4. ASS
3.1.5. Screening Trial Discussion
3.2. Optimization Trials
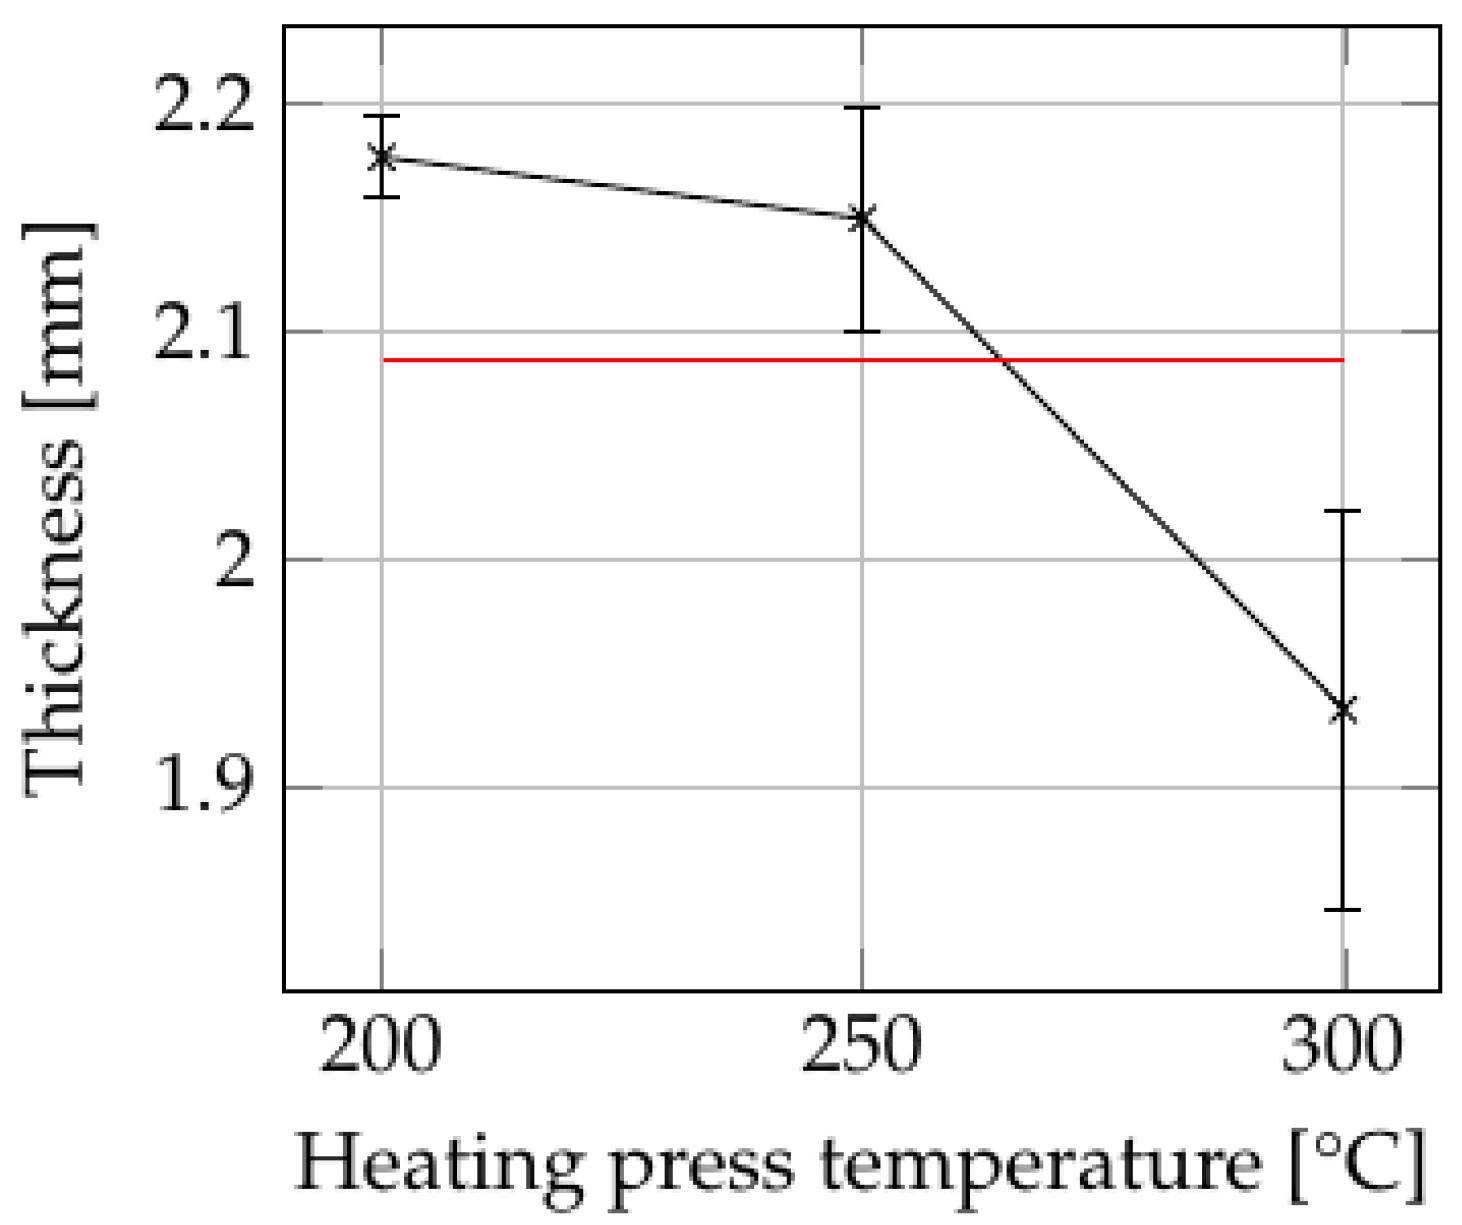
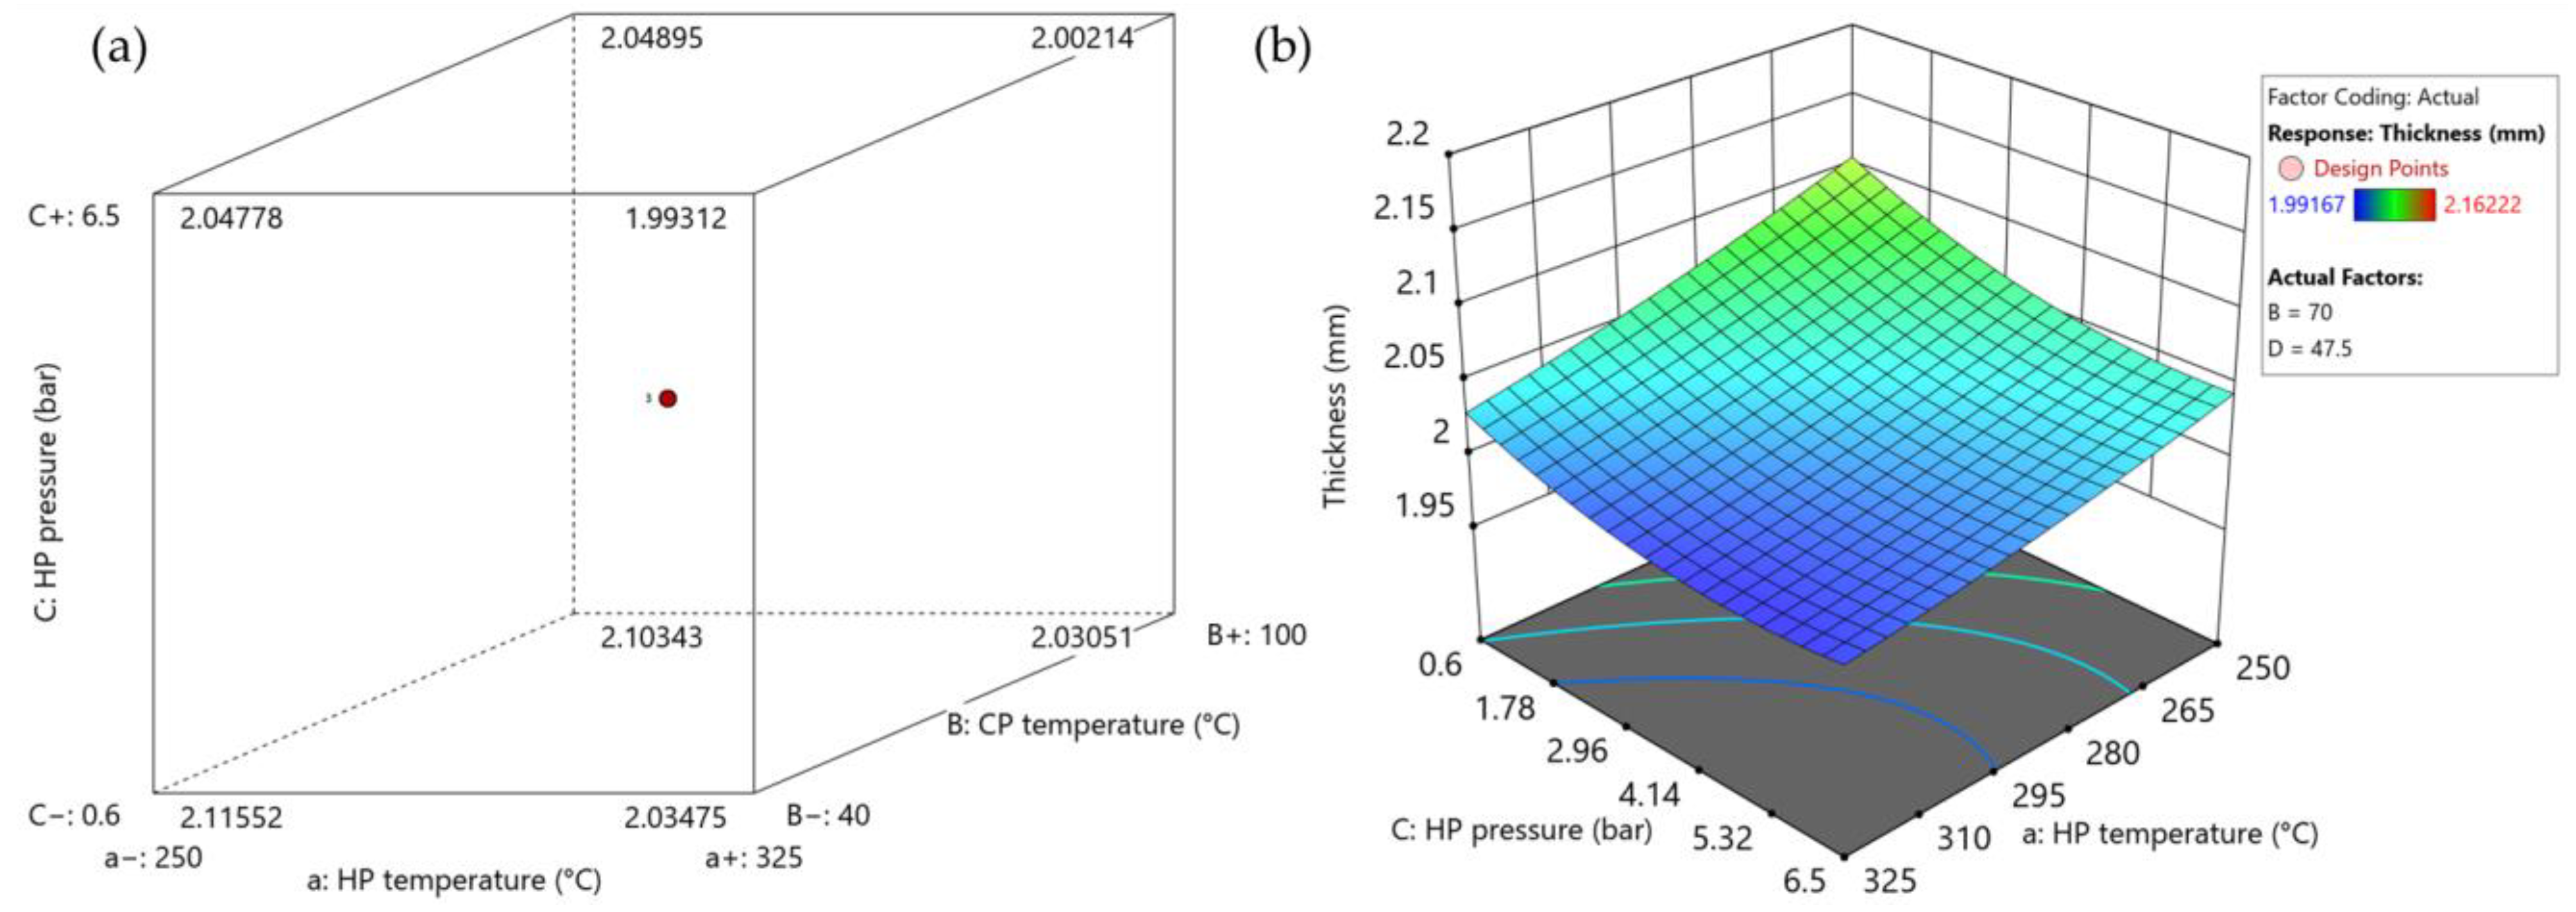
3.2.1. Thickness
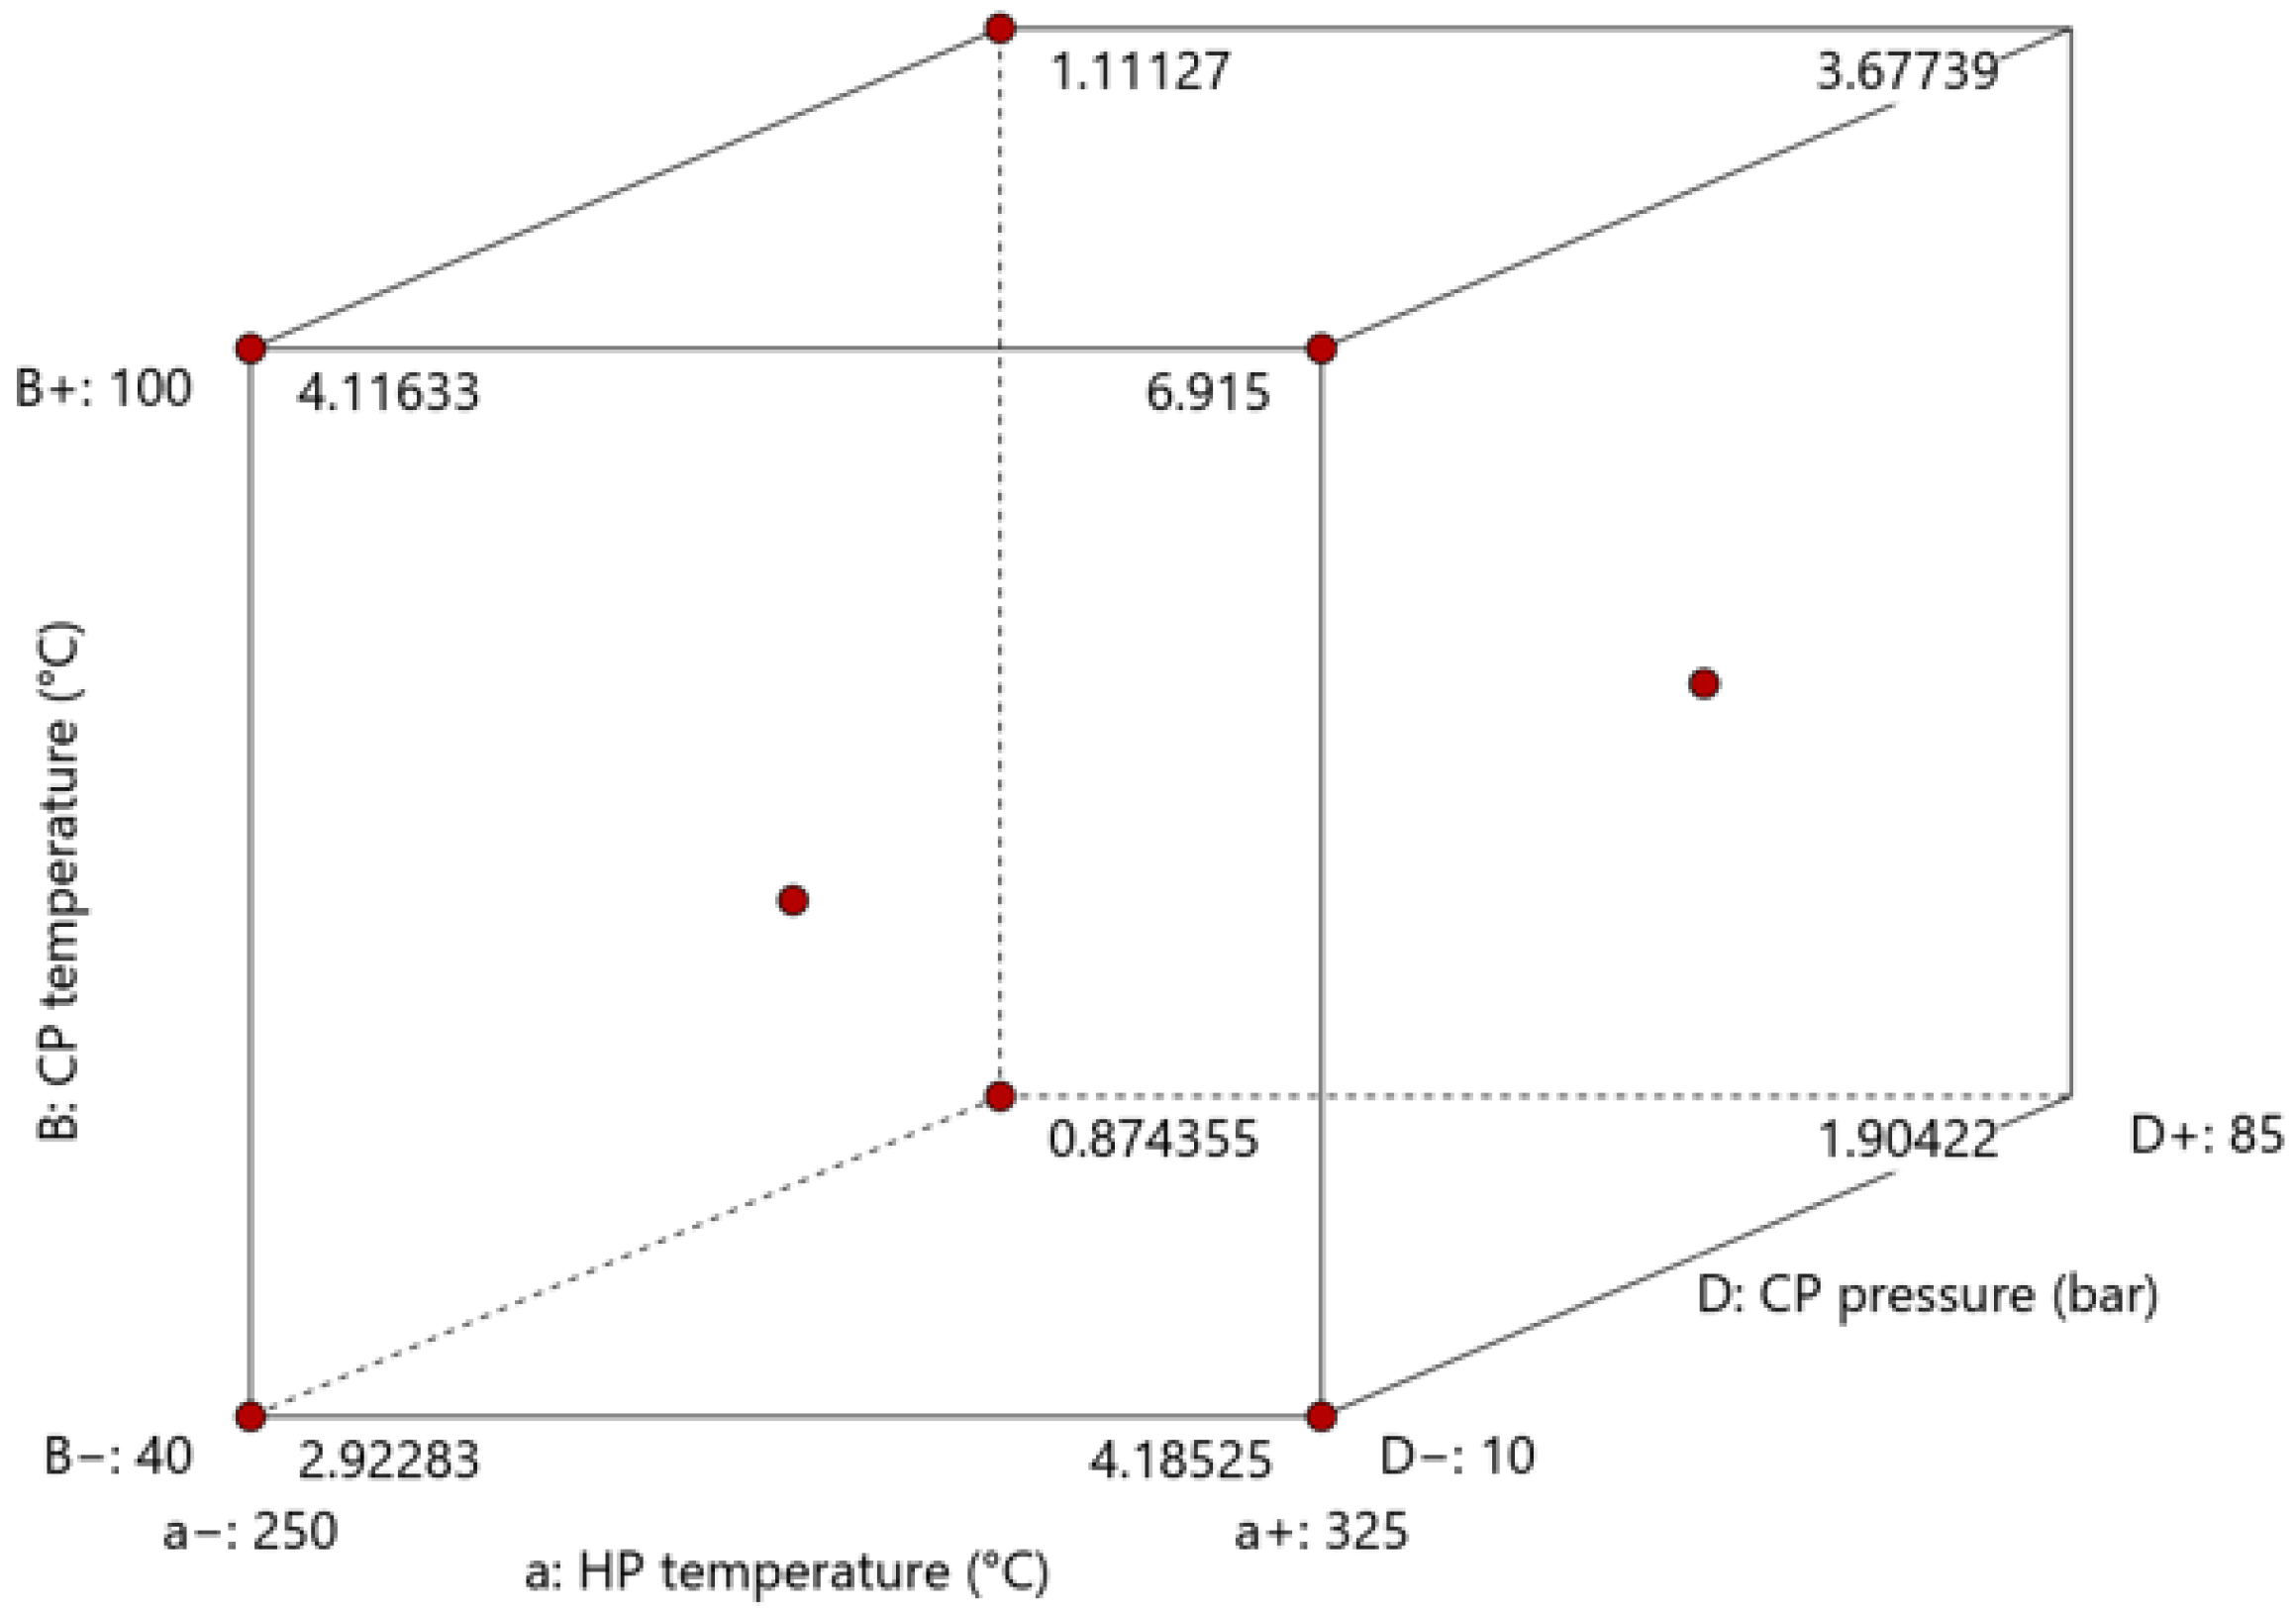
3.2.2. Warpage
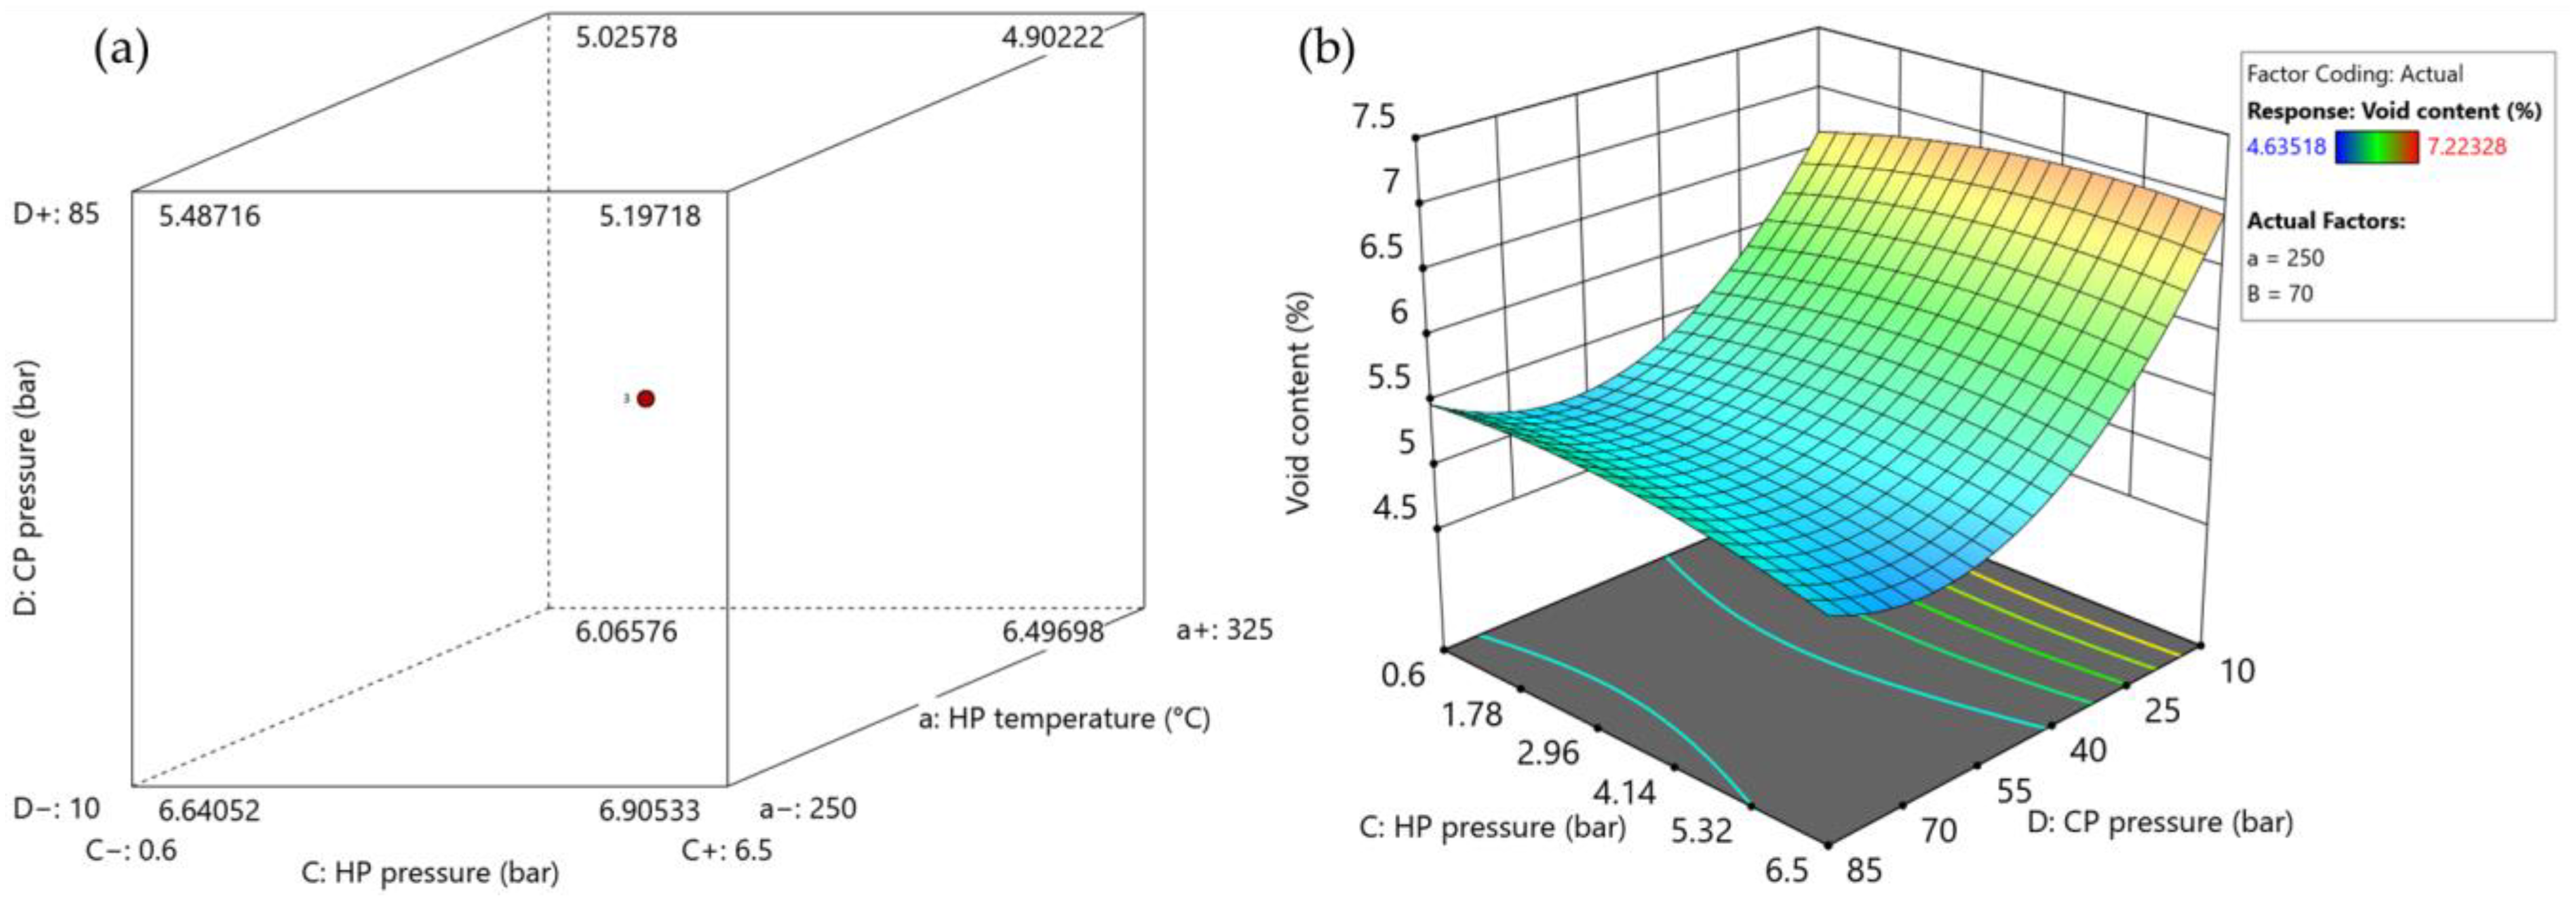
3.2.3. Void Content
3.2.4. ASS
3.2.5. Optimization Trials Discussion
- Heating press temperature: 325 °C;
- Heating pressure: 6.5 bar;
- Cooling press temperature: 100 °C;
- Cooling pressure: 85 bar.
4. Conclusions
Supplementary Materials
Author Contributions
Funding
Institutional Review Board Statement
Informed Consent Statement
Data Availability Statement
Conflicts of Interest
Correction Statement
Abbreviations
| AFP | automated fiber placement |
| ANOVA | analysis of variance |
| ASS | apparent shear strength |
| ATP | automated tape laying |
| CF/PPS | carbon/polyphenylene sulfide |
| CP | cooling press |
| DoE | design of experiments |
| HP | heating press |
| PC | polycarbonate |
| PC/GF | polycarbonate/glass fiber |
| PC/CF | polycarbonate/carbon fiber |
| PAEK | polyaryl ether ketone |
| PEEK | polyetheretherketone |
| PEKK | polyetherketoneketone |
| PP | polypropylene |
| VBO | vacuum-bag-only approach |
| UD | unidirectional |
References
- Njuguna, J. Lightweight Composite Structures in Transport: Design, Manufacturing, Analysis and Performance; Elsevier: Amsterdam, The Netherlands, 2016; ISBN 978-1-78242-343-0. [Google Scholar]
- Biron, M. Thermosets and Composites: Material Selection, Applications, Manufacturing, and Cost Analysis, 2nd ed.; Elsevier: Amsterdam, The Netherlands, 2013. [Google Scholar]
- Sonmez, F.O.; Hahn, H.T. Analysis of the On-Line Consolidation Process in Thermoplastic Composite Tape Placement. J. Thermoplast. Compos. Mater. 1997, 10, 543–572. [Google Scholar] [CrossRef]
- Khan, M.A.; Mitschang, P.; Schledjewski, R. Identification of Some Optimal Parameters to Achieve Higher Laminate Quality through Tape Placement Process. Adv. Polym. Technol. 2010, 29, 98–111. [Google Scholar] [CrossRef]
- Khan, M.A.; Mitschang, P.; Schledjewski, R. Tracing the Void Content Development and Identification of Its Effecting Parameters during in Situ Consolidation of Thermoplastic Tape Material. Polym. Polym. Compos. 2010, 18, 1–15. [Google Scholar] [CrossRef]
- Sonmez, F.O.; Akbulut, M. Process Optimization of Tape Placement for Thermoplastic Composites. Compos. Part A Appl. Sci. Manuf. 2007, 38, 2013–2023. [Google Scholar] [CrossRef]
- Saenz-Castillo, D.; Martín, M.I.; Calvo, S.; Rodriguez-Lence, F.; Güemes, A. Effect of Processing Parameters and Void Content on Mechanical Properties and NDI of Thermoplastic Composites. Compos. Part A Appl. Sci. Manuf. 2019, 121, 308–320. [Google Scholar] [CrossRef]
- Saffar, F.; Sonnenfeld, C.; Beauchêne, P.; Park, C.H. In-Situ Monitoring of the Out-Of-Autoclave Consolidation of Carbon/Poly-Ether-Ketone-Ketone Prepreg Laminate. Front. Mater. 2020, 7, 195. [Google Scholar] [CrossRef]
- Hoang, V.-T.; Kwon, B.-S.; Sung, J.-W.; Choe, H.-S.; Oh, S.-W.; Lee, S.-M.; Kweon, J.-H.; Nam, Y.-W. Postprocessing Method-Induced Mechanical Properties of Carbon Fiber-Reinforced Thermoplastic Composites. J. Thermoplast. Compos. Mater. 2023, 36, 432–447. [Google Scholar] [CrossRef]
- Patou, J.; Bonnaire, R.; De Luycker, E.; Bernhart, G. Influence of Consolidation Process on Voids and Mechanical Properties of Powdered and Commingled Carbon/PPS Laminates. Compos. Part A Appl. Sci. Manuf. 2019, 117, 260–275. [Google Scholar] [CrossRef]
- Schiel, I.; Raps, L.; Chadwick, A.R.; Schmidt, I.; Simone, M.; Nowotny, S. An Investigation of In-Situ AFP Process Parameters Using CF/LM-PAEK. Adv. Manuf. Polym. Compos. Sci. 2020, 6, 191–197. [Google Scholar] [CrossRef]
- Kropka, M.; Reichstein, J.; Neumeyer, T.; Altstaedt, V. Effect of the Pre-Consolidation Process on Quality and Mechanical Properties of Mono and Multi- Material Laminates Based on Thermoplastic UD Tapes. In Proceedings of the 21st International Conference on Composite Materials, Xi’an, China, 20–25 August 2017. [Google Scholar]
- Schell, J.S.U.; Guilleminot, J.; Binetruy, C.; Krawczak, P. Computational and Experimental Analysis of Fusion Bonding in Thermoplastic Composites: Influence of Process Parameters. J. Mater. Process. Technol. 2009, 209, 5211–5219. [Google Scholar] [CrossRef]
- Borowski, A.; Vogel, C.; Behnisch, T.; Geske, V.; Gude, M.; Modler, N. Additive Manufacturing-Based In Situ Consolidation of Continuous Carbon Fibre-Reinforced Polycarbonate. Materials 2021, 14, 2450. [Google Scholar] [CrossRef] [PubMed]
- Akué Asséko, A.C.; Cosson, B.; Lafranche, É.; Schmidt, F.; Le Maoult, Y. Effect of the Developed Temperature Field on the Molecular Interdiffusion at the Interface in Infrared Welding of Polycarbonate Composites. Compos. Part B Eng. 2016, 97, 53–61. [Google Scholar] [CrossRef]
- Almeida, O.D.; Bessard, E.; Bernhart, G. Influence of Processing Parameters and Semi-Finished Product on Consolidation of Carbon/Peek Laminates. In Proceedings of the 15th European Conference on Composite Materials ECCM15, Venise, Italy, 24–28 June 2012. [Google Scholar]
- Qureshi, Z.; Swait, T.; Scaife, R.; El-Dessouky, H.M. In Situ Consolidation of Thermoplastic Prepreg Tape Using Automated Tape Placement Technology: Potential and Possibilities. Compos. Part B Eng. 2014, 66, 255–267. [Google Scholar] [CrossRef]
- Henneberg, A.; Transier, G.; Sinapius, M. Consolidated Fibre Placement (CFP)—Adhesive Joining of Consolidated Fibre Tapes. Compos. Struct. 2016, 140, 337–343. [Google Scholar] [CrossRef]
- Grouve, W.J.B.; Warnet, L.L.; Rietman, B.; Visser, H.A.; Akkerman, R. Optimization of the Tape Placement Process Parameters for Carbon–PPS Composites. Compos. Part A Appl. Sci. Manuf. 2013, 50, 44–53. [Google Scholar] [CrossRef]
- Zhang, C.; Duan, Y.; Xiao, H.; Wang, B.; Ming, Y.; Zhu, Y.; Zhang, F. Effect of Porosity and Crystallinity on Mechanical Properties of Laser In-Situ Consolidation Thermoplastic Composites. Polymer 2022, 242, 124573. [Google Scholar] [CrossRef]
- Lee, W.I.; Talbott, M.F.; Springer, G.S.; Berglund, L.A. Effects of Cooling Rate on the Crystallinity and Mechanical Properties of Thermoplastic Composites. J. Reinf. Plast. Compos. 1987, 6, 2–12. [Google Scholar] [CrossRef]
- Manson, J.-A.E.; Schneider, T.L.; Seferis, J.C. Press-Forming of Continuous-Fiber-Reinforced Thermoplastic Composites. Polym. Compos. 1990, 11, 114–120. [Google Scholar] [CrossRef]
- Sonmez, F.O.; Hahn, H.T.; Akbulut, M. Analysis of Process-Induced Residual Stresses in Tape Placement. J. Thermoplast. Compos. Mater. 2002, 15, 525–544. [Google Scholar] [CrossRef]
- Krämer, E. The Formation of Fiber Waviness during Thermoplastic Composite Laminate Consolidation: Identification and Description of the Underlying Mechanisms. Ph.D. Thesis, University of Twente, Enschede, The Netherlands, 2021. [Google Scholar]
- Sitohang, R.D.R.; Grouve, W.J.B.; Warnet, L.L.; Akkerman, R. Effect of In-Plane Fiber Waviness Defects on the Compressive Properties of Quasi-Isotropic Thermoplastic Composites. Compos. Struct. 2021, 272, 114166. [Google Scholar] [CrossRef]
- Wilhelmsson, D.; Asp, L.E. A High Resolution Method for Characterisation of Fibre Misalignment Angles in Composites. Compos. Sci. Technol. 2018, 165, 214–221. [Google Scholar] [CrossRef]
- Valverde, M.A.; Belnoue, J.P.-H.; Kupfer, R.; Kawashita, L.F.; Gude, M.; Hallett, S.R. Compaction Behaviour of Continuous Fibre-Reinforced Thermoplastic Composites under Rapid Processing Conditions. Compos. Part A Appl. Sci. Manuf. 2021, 149, 106549. [Google Scholar] [CrossRef]
- Shuler, S.F.; Advani, S.G. Transverse Squeeze Flow of Concentrated Aligned Fibers in Viscous Fluids. J. Non-Newton. Fluid Mech. 1996, 65, 47–74. [Google Scholar] [CrossRef]
- Birtha, J.; Marschik, C.; Kobler, E.; Straka, K.; Steinbichler, G.; Schlecht, S.; Zwicklhuber, P. Optimizing the Process of Spot Welding of Polycarbonate-Matrix-Based Unidirectional (UD) Thermoplastic Composite Tapes. Polymers 2023, 15, 2182. [Google Scholar] [CrossRef]
- ASTM D792-13; Standard Test Methods for Density and Specific Gravity (Relative Density) of Plastics by Displacement. ASTM: West Conshohocken, PN, USA, 2013.
- ASTM D2734-16; Standard Test Methods for Void Content of Reinforced Plastics. ASTM: West Conshohocken, PN, USA, 2016.
- ASTM D2584-18; Standard Test Method for Ignition Loss of Cured Reinforced Resins. ASTM: West Conshohocken, PN, USA, 2018.
- ISO 14130:1997; Fibre-reinforced plastic composites: Determination of apparent interlaminar shear strength by short-beam method. ISO: Geneva, Switzerland, 1997.
- Liu, L.; Zhang, B.-M.; Wang, D.-F.; Wu, Z.-J. Effects of Cure Cycles on Void Content and Mechanical Properties of Composite Laminates. Compos. Struct. 2006, 73, 303–309. [Google Scholar] [CrossRef]
- Sloan, J. Out-of-Autoclave Processing: <1% Void Content? Available online: https://www.compositesworld.com/articles/out-of-autoclave-processing-1-void-content (accessed on 20 September 2023).
- Mehdikhani, M.; Gorbatikh, L.; Verpoest, I.; Lomov, S.V. Voids in Fiber-Reinforced Polymer Composites: A Review on Their Formation, Characteristics, and Effects on Mechanical Performance. J. Compos. Mater. 2019, 53, 1579–1669. [Google Scholar] [CrossRef]


| Material | Property | Value | Unit |
|---|---|---|---|
| Matrix (Polycarbonate) | Melt mass flow rate | 37 | g/10 min (300 °C/1.2 kg) |
| Density | 1190 | kg/m3 | |
| Glass-transition temperature | 145 | °C | |
| Tensile modulus | 2400 | MPa | |
| Yield stress | 65 | MPa, at 50 mm/s | |
| Fiber (Carbon Fiber) | Density | 1800 | kg/m3 |
| Denier | 14,400 | den | |
| Tensile modulus | 250 | GPa |
| Trial | Condition | Experimental Design | Number of Settings | Sample Type | Number of Test Samples Per Setting | Metrics |
|---|---|---|---|---|---|---|
| Screening | No frame tool | Definitive screening design | 13 | Whole plate | 12 | Projected area Warpage |
| Small samples | 14 | Thickness Density ASS | ||||
| Optimization | Frame tool | Split-plot central composite design | 26 | Whole plate | 3 | Warpage |
| Small samples | 9 | Thickness Void content ASS |
Disclaimer/Publisher’s Note: The statements, opinions and data contained in all publications are solely those of the individual author(s) and contributor(s) and not of MDPI and/or the editor(s). MDPI and/or the editor(s) disclaim responsibility for any injury to people or property resulting from any ideas, methods, instructions or products referred to in the content. |
© 2023 by the authors. Licensee MDPI, Basel, Switzerland. This article is an open access article distributed under the terms and conditions of the Creative Commons Attribution (CC BY) license (https://creativecommons.org/licenses/by/4.0/).
Share and Cite
Birtha, J.; Kobler, E.; Marschik, C.; Straka, K.; Steinbichler, G. Using Heating and Cooling Presses in Combination to Optimize the Consolidation Process of Polycarbonate-Based Unidirectional Thermoplastic Composite Tapes. Polymers 2023, 15, 4500. https://doi.org/10.3390/polym15234500
Birtha J, Kobler E, Marschik C, Straka K, Steinbichler G. Using Heating and Cooling Presses in Combination to Optimize the Consolidation Process of Polycarbonate-Based Unidirectional Thermoplastic Composite Tapes. Polymers. 2023; 15(23):4500. https://doi.org/10.3390/polym15234500
Chicago/Turabian StyleBirtha, Janos, Eva Kobler, Christian Marschik, Klaus Straka, and Georg Steinbichler. 2023. "Using Heating and Cooling Presses in Combination to Optimize the Consolidation Process of Polycarbonate-Based Unidirectional Thermoplastic Composite Tapes" Polymers 15, no. 23: 4500. https://doi.org/10.3390/polym15234500
APA StyleBirtha, J., Kobler, E., Marschik, C., Straka, K., & Steinbichler, G. (2023). Using Heating and Cooling Presses in Combination to Optimize the Consolidation Process of Polycarbonate-Based Unidirectional Thermoplastic Composite Tapes. Polymers, 15(23), 4500. https://doi.org/10.3390/polym15234500