3.1. Mass per Unit Area, Thickness, and Air Permeability of Nonwoven Mulches
The results of mass per unit area, thickness, and air permeability of nonwoven mulches before exposure to environmental conditions (0 days) and after 30, 60, 90, 120, 180, 240, and 300 days of exposure are presented in
Table 3.
The mass per unit area and thickness of nonwoven mulch do not decrease linearly with time, i.e., mass and thickness increase and decrease over time. Although it is assumed that under the influence of weather conditions (temperature, humidity, precipitation) and soil (microorganisms), the decomposition of fibres of the mulches should occur, the degradation of nonwoven fabrics produced on the card and bonded by needle-punching cannot be monitored by mass or thickness reduction. Environmental conditions influence changes in the nonwoven mulches structure, i.e., dimensions, resulting in mulches shrinkage and expansion. Due to nonwoven mulches’ structural changes, air permeability does not show an expected increase due to mulches’ degradation as well.
Along with the change in structure, grains of soil, dried weed leaves, and stems are embedded in the mulch structure, between the web layers, increasing the mass and thickness of the nonwoven mulches. As mulches of the same dimensions, 2.25 m
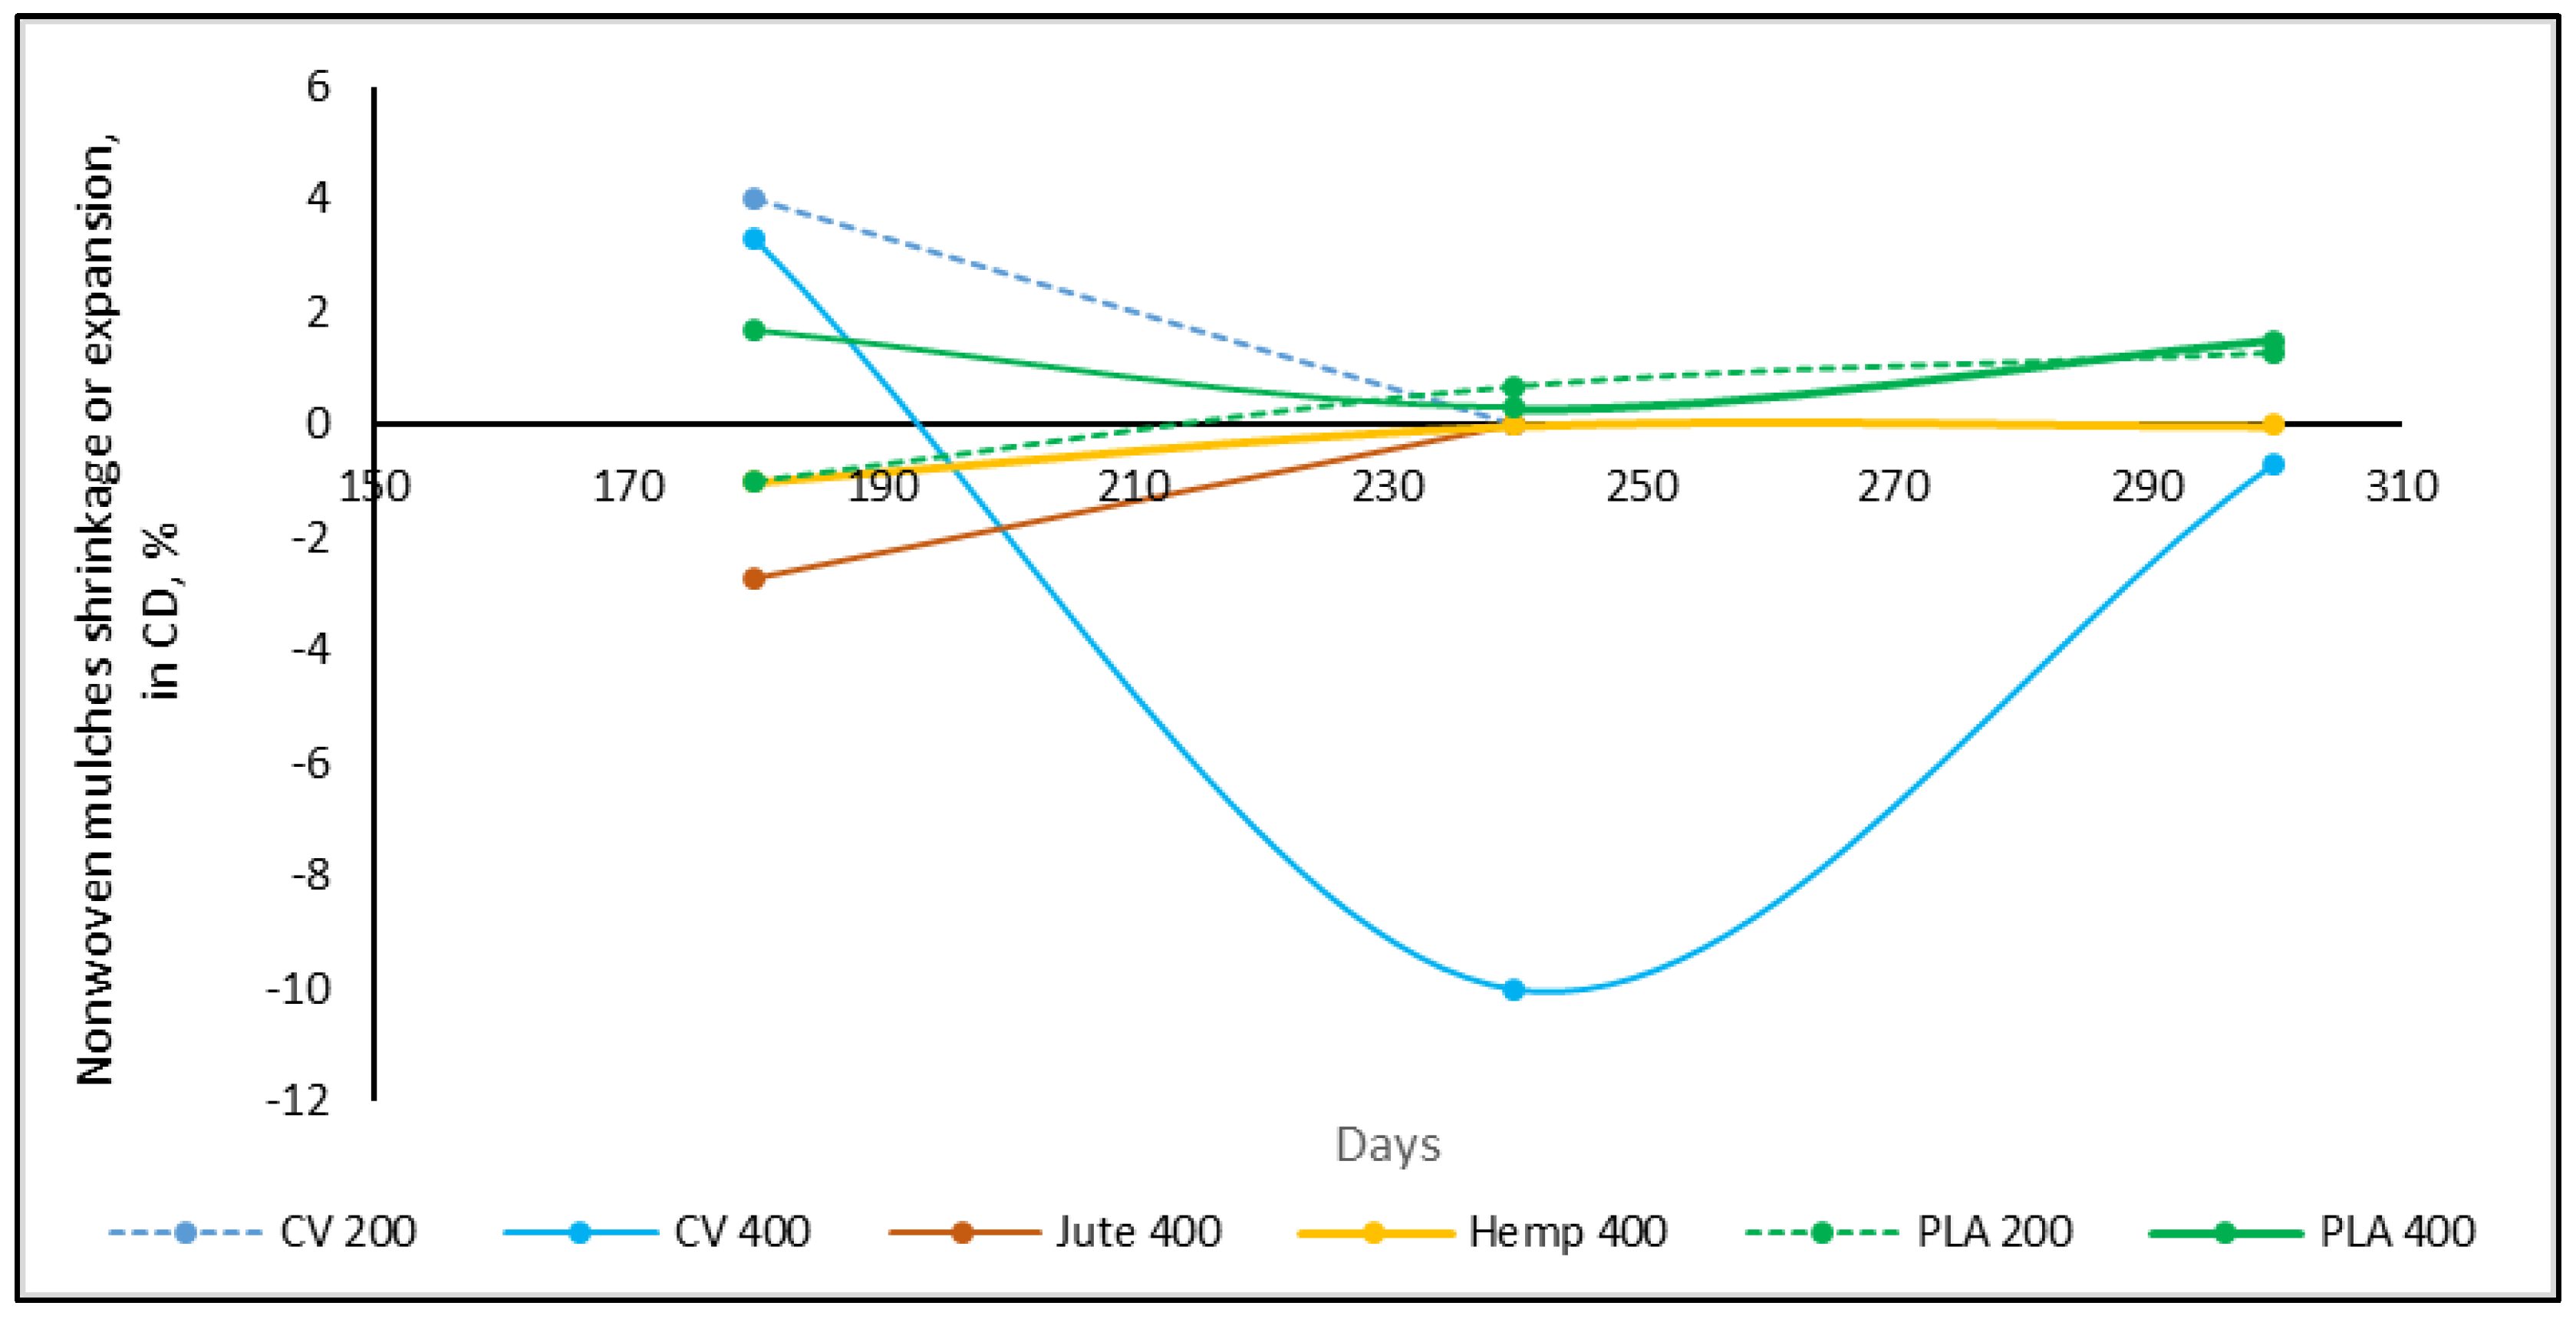
2 (1.5 m × 1.5 m), were placed on the test field, after removing the mulches from the test site, the dimensions of the mulches were measured, and the percentage of changes in length and width (shrinkage or extension) was calculated (
Table 4,
Figure 3 and
Figure 4).
The trend of the dimension change in the mulches was not established. After 180 days of exposure on the field to environmental conditions, the viscose mulches of 200 gm
−2 shrank by 6.7% in the machine direction (MD) and extended in the cross-machine direction (CD) by 4.0%, after which the mulch degraded (
Table 4). The nonwoven viscose mulches of 400 gm
−2 after 180 days have the same trend but with a lesser percentage change (mulch in the MD shrank by 3.3% and extended in the CD by 3.3%). After 240 days, mulch extension was 3.5% in the MD and 10.0% in the CD regarding initial dimension (1.5 m × 1.5 m), meaning that after 240 days in total, nonwoven mulches in the MD extended by 6.7% and shrank by 13.3% in the CD. After 300 days, the total change in nonwoven mulch dimensions regarding unexposed mulches to environmental conditions was shrinkage by 6.1% in the MD and 7.4% in the CD.
Mulches made of bast fibres (jute and hemp) have the same trend, where after 180 days nonwoven mulches from bast fibres extended in the MD (4.7%, 0.7%) and shrank in the CD (2.7%, 1.0%). The change in dimension was more pronounced for jute mulches. After 240 days, the jute mulch degraded while the hemp mulch dimension changed to the initial dimension, and finally degraded after 300 days. The dimensional change in PLA mulches produced in different masses per unit area throughout testing differ, where dimensional changes are up to 2.0%.
Dimensional changes in nonwoven mulches should be monitored throughout the exposure period, as some mulches show both dimensional changes, shrinkage and expansion (
Figure 3 and
Figure 4). An example is viscose mulches of 400 g/m
2, which after 180 days extended in the CD, then significantly shrank after 240 days, and extended after 300 days (
Figure 4). In the case of nonwoven viscose mulches in the MD, the change is reversed, but not so pronounced.
3.2. Tensile Properties of Nonwoven Mulches
The nonwoven mulches, produced on cards and bonded using the needle-punching process, have a higher breaking force in the CD (cross-machine direction) than MD (machine direction) due to the manufacturing process. The fibre alignment in the cross-machine direction on cross-lappers provides better strength properties in the CD. Considering mass per unit area, the lowest breaking force is in mulches made of viscose followed by jute, hemp, and finally PLA fibres (
Figure 5 and
Figure 6).
After 30 days of environmental exposure, a significant increase in the breaking force of all nonwoven mulches in both production directions is visible. The previously mentioned nonwoven mulches’ structural changes influenced the breaking force in the MD and the CD of tested mulches. For example, the mass per unit area and air permeability of mulches made of PLA fibres slightly decrease while thickness slightly increases. Those structural changes provide a higher breaking force of the PLA nonwoven mulch in the MD (315% for mulch of 200 g/m2; 217% for mulch of 400 g/m2) and CD (284% for mulch of 200 g/m2; 290% for mulch of 400 g/m2).
The greatest increase in breaking force after 30 days of exposure is visible for viscose mulches of 400 g/m2 in both directions (MD for 640%; CD for 775%). Viscose mulches of 200 g/m2 have a breaking force increase of 156% in the MD and 148% in the CD. The lowest breaking force increase after 30 days of exposure is visible for bast fibres, i.e., hemp (MD for 57%; CD for 36%) and jute (MD for 23%; CD for 36%).
Besides mass per unit area and thickness, fibre type has a substantial impact on the nonwoven fabric breaking force. The breaking force of nonwoven fabric is influenced by fibre strength, flexibility, elongation, diameter as well as surface texture, and roughness when a nonwoven fabric is produced using the same technological process and parameters. The impact of fibre arrangement on nonwoven fabric breaking force is pronounced, where it should be noted that different fibre types are differently distributed in the fibrous web. The friction and entanglement between fibres influence the nonwoven fabrics’ breaking force, since some fibre types naturally interlock better, leading to improved breaking force. The reason for the exposed nonwoven mulches’ breaking force increase could be found in the influence of environmental conditions (air and soil temperature and humidity, precipitation) on the structure. Considering the nonwoven mulch fibre types and properties, it can be concluded that the finest viscose fibres (1.78 dtex) change the nonwoven structure after 30 days of exposure the most. Slightly coarser PLA fibres (6.84 dtex) follow viscose mulches, where the coarse bast fibres hemp (58.54 dtex) and jute (31.02 dtex) nonwoven structure changes are the smallest. The breaking force of agrofoil does not follow the trend of the nonwoven mulches’ breaking force.
After 60 days of exposure, the breaking force of viscose mulches decreases in both production directions, and until the end of the testing period (altogether 300 days) slightly decreases and increases. Between 180 and 240 days of exposure, the viscose mulch with a nominal surface mass of 200 g/m2 degraded to an extent that it could not be collected from the field and subjected to testing. The decrease in the breaking force of viscose mulch mass of 400 gm−2, after 300 days of exposure, is 10.0% in the MD and 27.2% in the CD.
Mulches produced from jute fibres degraded within a period between 180 and 240 days of exposure. Contrary to viscose mulches, the breaking force of jute mulches, in both production directions, just before degradation (tested on mulches after 180 days) was higher than for jute mulches that were not subjected to environmental influences. The above can be explained by the fineness and surface roughness of the jute and viscose fibres. Unlike viscose smooth fibres, the coarser jute fibres retained the nonwoven structure until considerable jute fibre decomposition.
Hemp mulches were decomposed throughout 240 to 300 days. After 30 days of exposure and a significant breaking force increase, the decrease in hemp mulches’ breaking force tends to decrease in both production directions until their degradation. The breaking force decrease in hemp mulches in the time intervals and during 300 days of environmental exposure is higher in the MD (from 8% to 42%) than in the CD (12% to 21%). The above can be explained by partially decomposed fibres and the frictional forces between the fibres oriented in the CD that maintain the nonwoven fabric structure.
The mulches made of PLA fibres have a lower decrease in breaking force in both production directions (from 1% to 10%). After 300 days of exposure, the breaking force of PLA mulches is significantly higher than before exposure to environmental conditions (from 261.6% to 323.3%) for both production directions. This can be explained by the structural change in nonwoven mulches made of PLA fibres, where the mass per unit area and air permeability did not change significantly and thickness slightly increased.
Average breaking force and elongation at break of the nonwoven mulches tested during the period of exposure to the environmental conditions are presented in
Table 5 and
Table 6.
Changes in the breaking strength of nonwoven mulches, that indicate structural changes, follow the trends of their breaking forces explained previously.
After 30 days of environmental exposure, an increase in the breaking elongation of viscose and PLA 200 nonwoven mulches in the MD is visible. In the CD, an increase is visible for all mulches, except CV 200 and Hemp 400. This could be explained by the orientation of the fibres within the nonwoven mulches’ structure, respectively; nonwoven fabrics made on cards have a structure where fibres are mostly orientated in the CD. At 60 days of environmental exposure, change in nonwoven mulches’ elongation at break decreased for almost all mulches, except Jute 400 and PLA 400. After 60 days of environmental exposure, breaking elongation of nonwoven mulches, in both production directions, tends to slightly increase and decrease. At the end of the field experiment, the breaking elongation of all mulches, except mulches made of PLA fibres, significantly decreased in both production directions.
Nonwoven mulches’ tensile properties were tested according to the available standard ISO 9073-3:2023, where five samples were cut and tested in the MD (machine direction) and CD (cross-machine direction). To evaluate the reproducibility of breaking force and elongation at break of nonwoven mulches, the standard error is calculated and provided in
Table 6 and
Table 7.
3.3. Microscopic Images
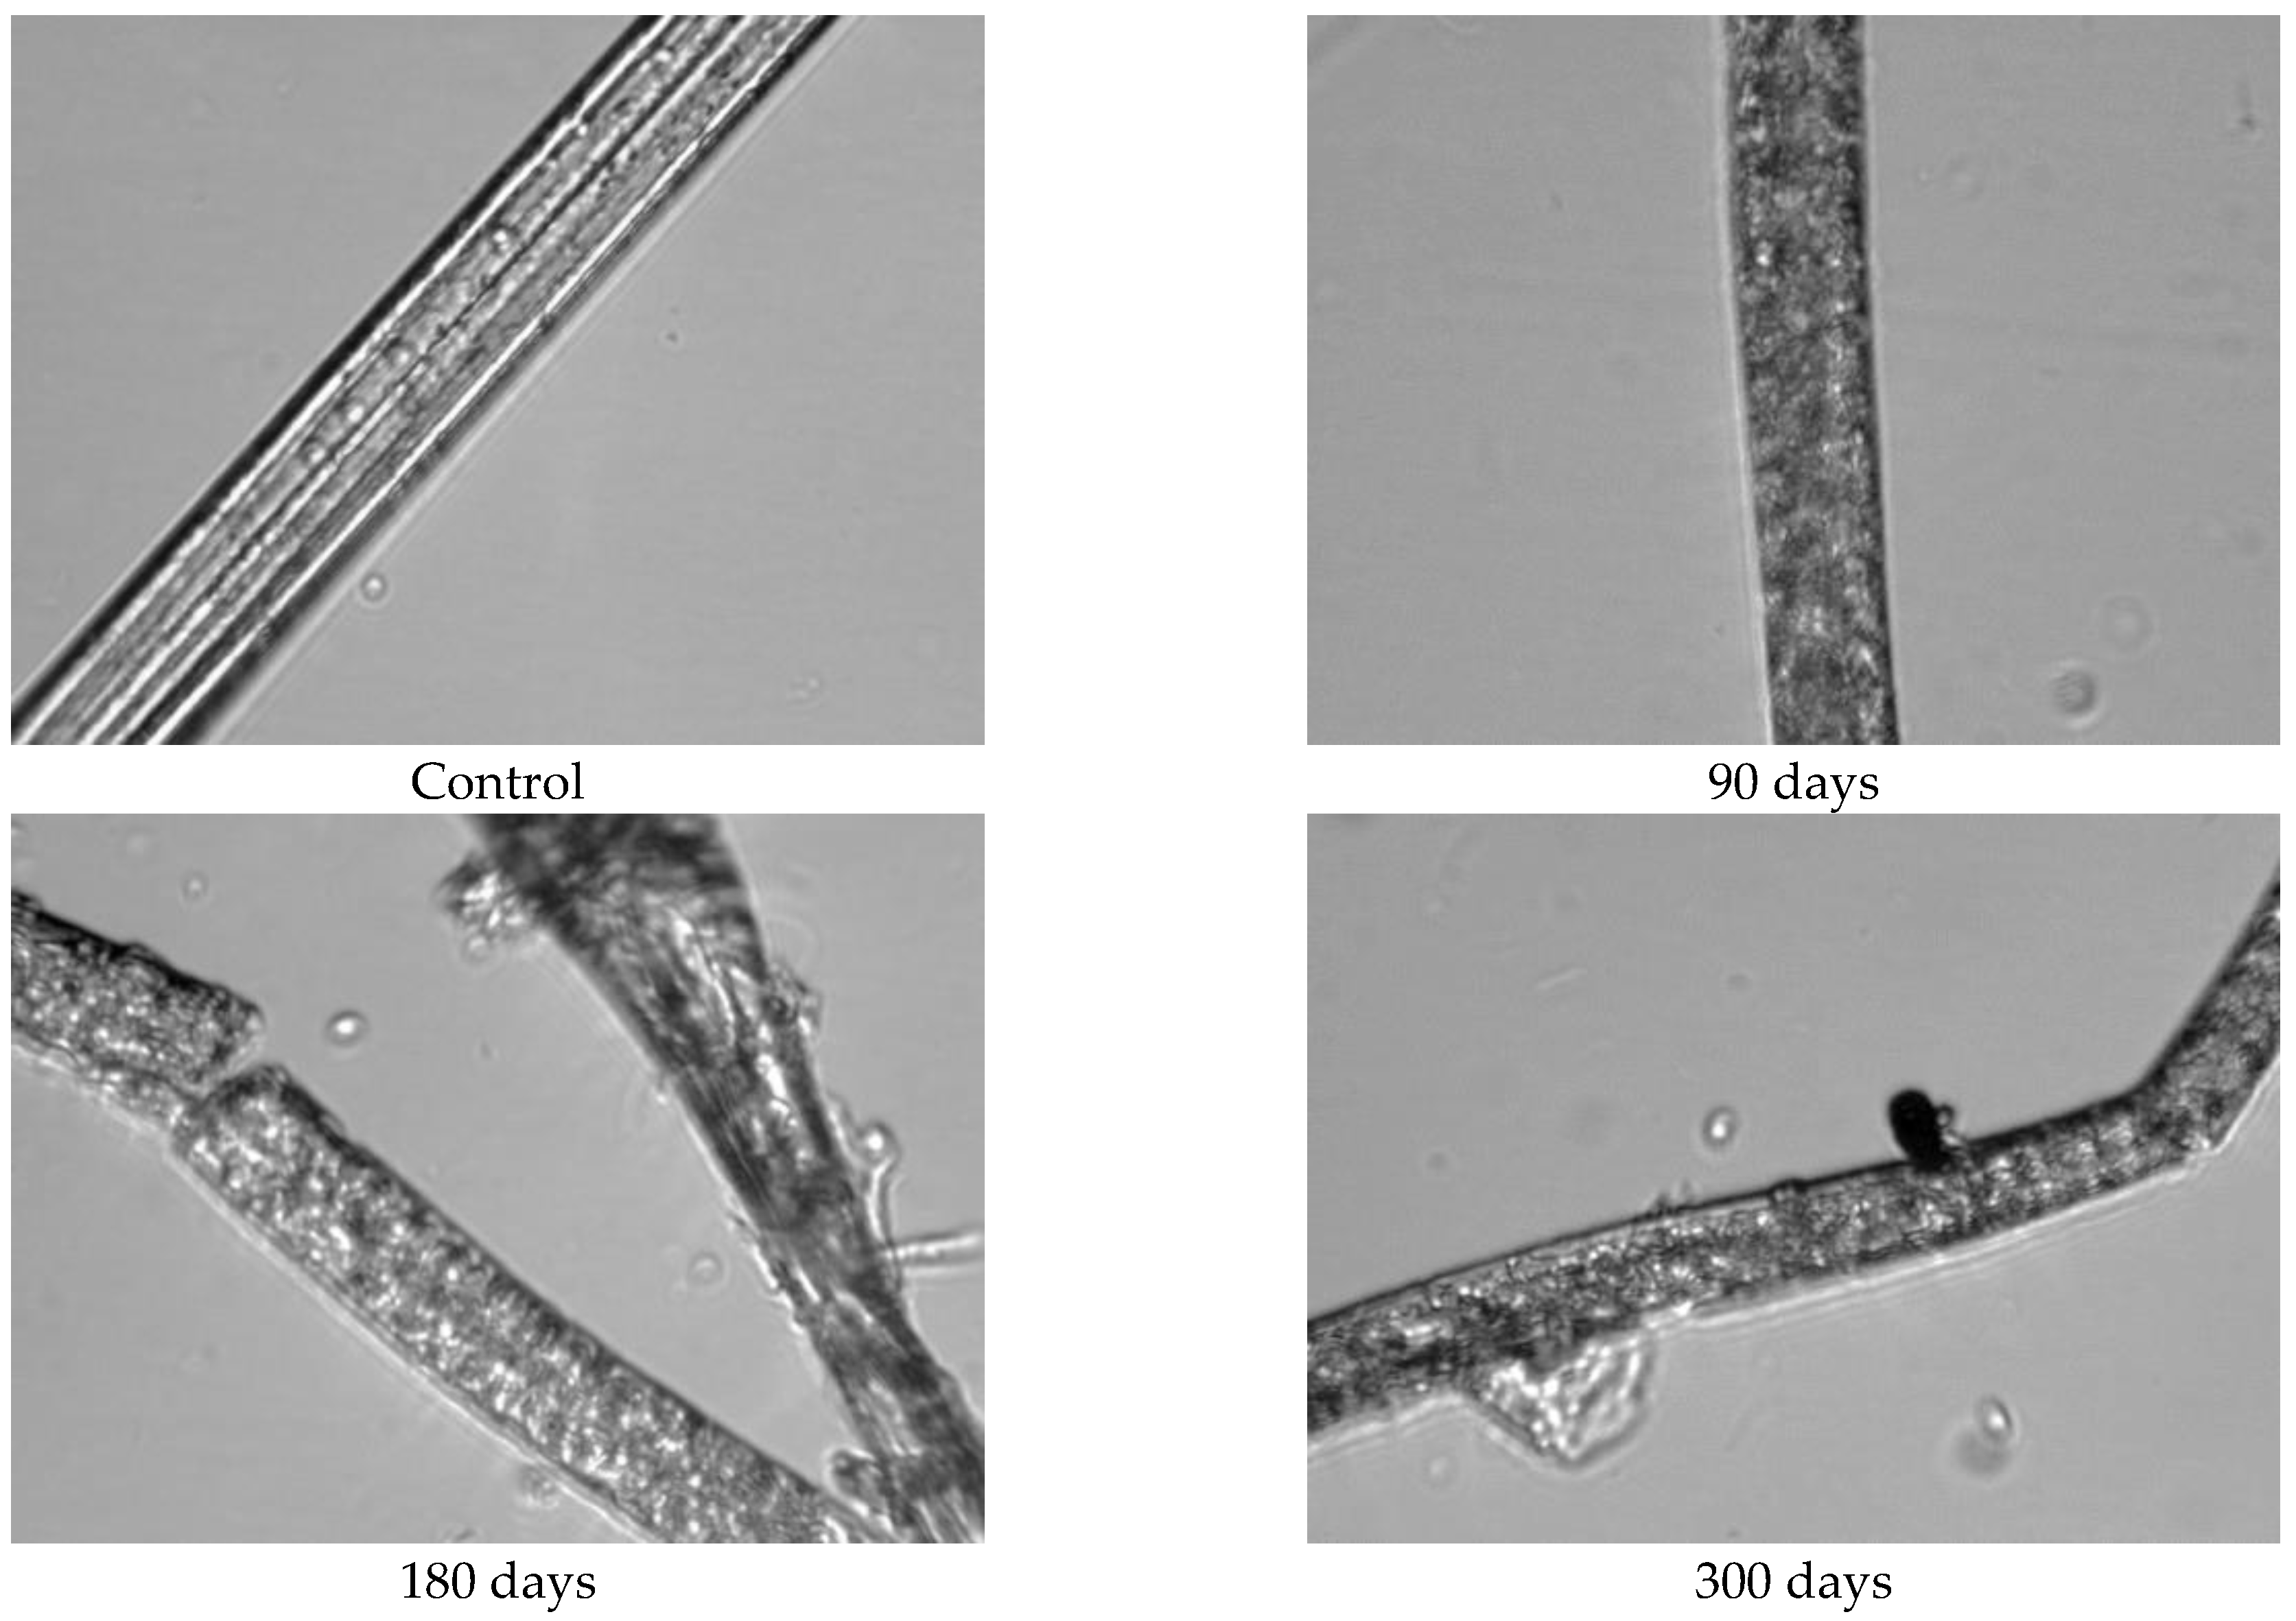
Since the physical–mechanical properties of the nonwoven mulches do not show the expected changes due to decomposition, and the change in structure dimension during exposure is evident, microscopic images of the mulches’ fibres (unexposed and after 90, 180, and 300 days of exposure) were made to investigate the biodegradation of the fibres themselves. The fibres for microscopic images were taken from nonwoven mulches, respectively, from unexposed mulches and after 90, 180, and 300 days of exposure to environmental conditions (
Figure 7).
Viscose fibre consists of 100% cellulose and exhibits hygroscopic properties, absorbing moisture from the environment. Due to the low degree of polymerisation, weaker orientation, and reduced crystallinity, the fibres tend to characteristically swell and stiffen in the wet state (
Figure 7 and
Figure 8). Images of unexposed viscose fibres show characteristic longitudinal striations on the fibre surface caused by surface wrinkling during the chemical spinning process, filament hardening, and pulp regeneration. After exposure of viscose mulch of 200 g/m
2 to environmental conditions, numerous defects become visible on the viscose fibre surface and more pronounced surface cracking and scars are observed after 300 days of exposure (
Figure 8). After 90 and 180 days, the protective “skin” created during the spinning process of viscose fibres begins to wrinkle in certain places.
Unexpected results were obtained when comparing viscose fibres from the nonwoven mulches of 200 g/m
2 and 400 g/m
2 mass per unit area. Viscose fibres from the 400 g/m
2 mulches exhibit more significant wrinkling that becomes increasingly pronounced with time exposure to environmental conditions (
Figure 9). During the viscose fibre preparation for microscopy, it became evident that there was no need to adhere to the prescribed microscopy procedure, i.e., cutting the fibres. During the nonwoven mulch handling, the fibres from the mulch began to disintegrate, suggesting significant fibre degradation due to exposure to environmental conditions.
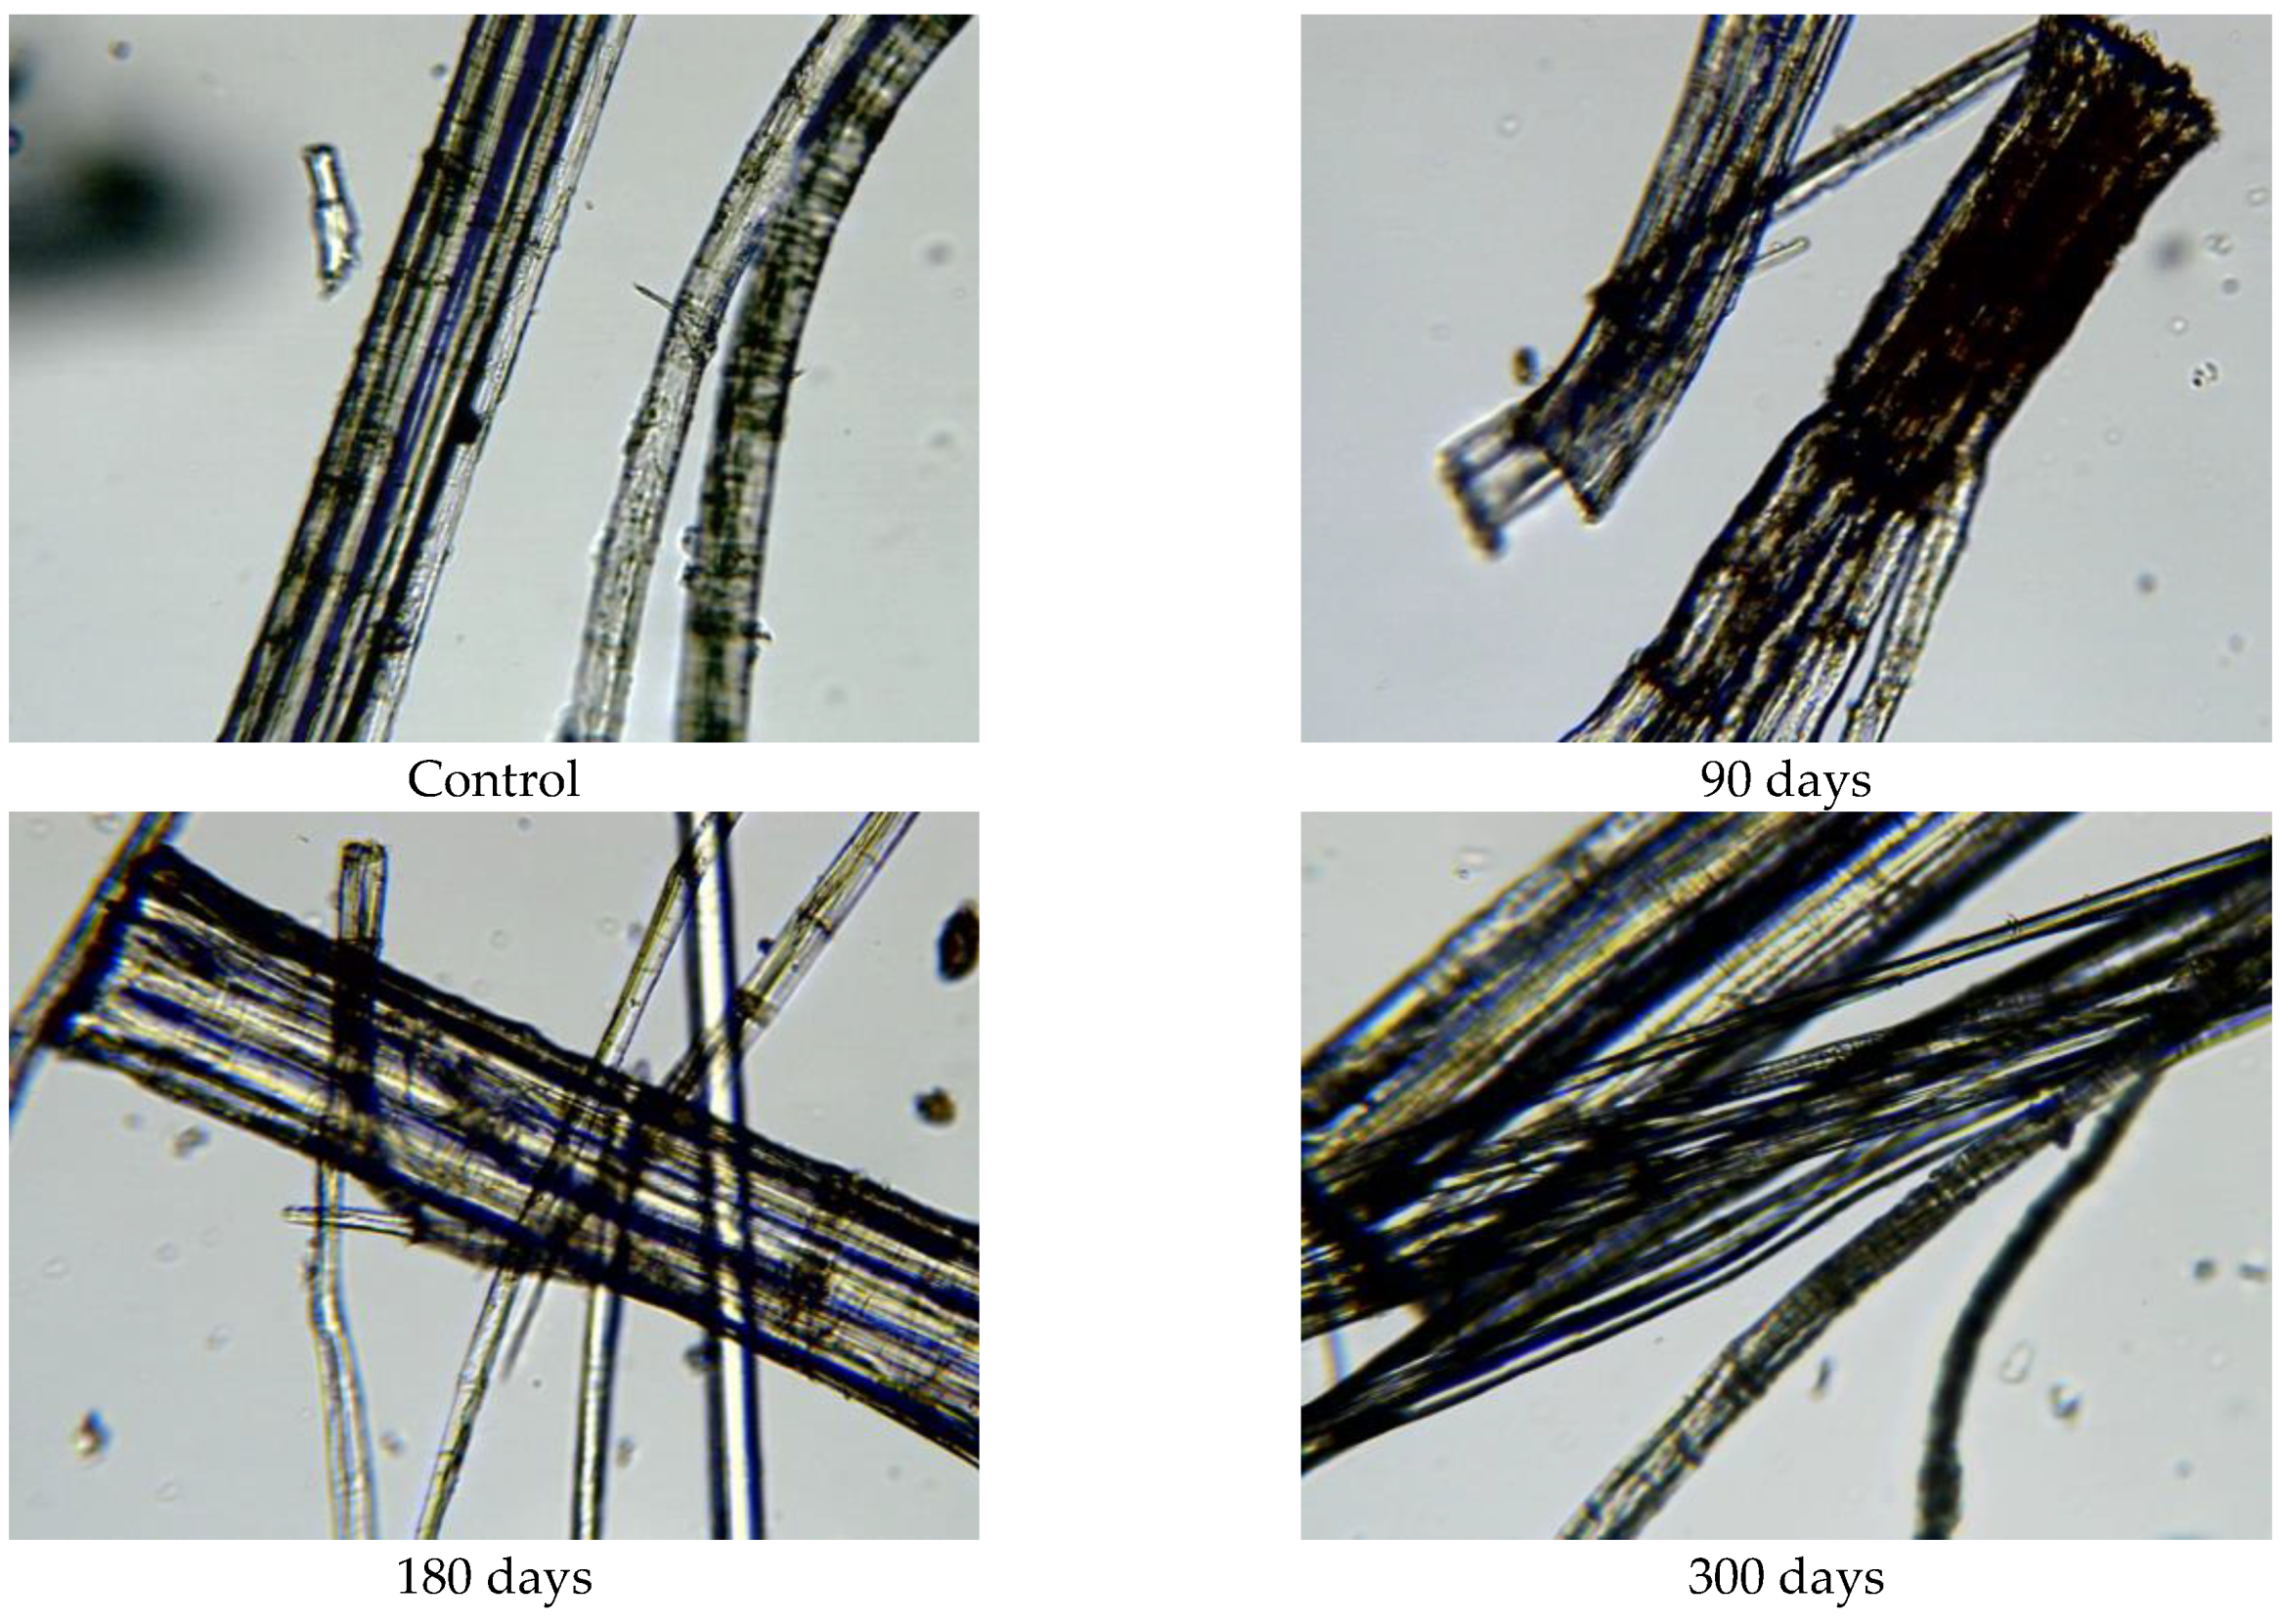
The exposed mulch degradation is particularly noticeable for hemp and jute mulches, attributed to the higher moisture absorption capacity of the fibres, which creates favourable conditions for microorganism development. The images of hemp and jute fibres taken from the nonwoven mulches of 400 g/m
2 exhibit surface damage, roughness, and prominent cracks compared to the control fibres (
Figure 10 and
Figure 11).
Hemp and jute, as bast fibres, are technical fibres consisting of numerous elementary fibres held together by internal pectin, which is a favoured food source for microorganisms. Since hemp fibres have a lower amount of lignin and pectin, which act as protective layers, compared to jute fibres, it can be assumed that the degradation of hemp fibres started first (
Figure 10). The release of elementary fibres from the internal pectin in hemp fibre started after 90 days of exposure to the open field. After 300 days of exposure, hemp fibres predominantly exist as elementary fibres due to microorganism attacks on the internal pectin.
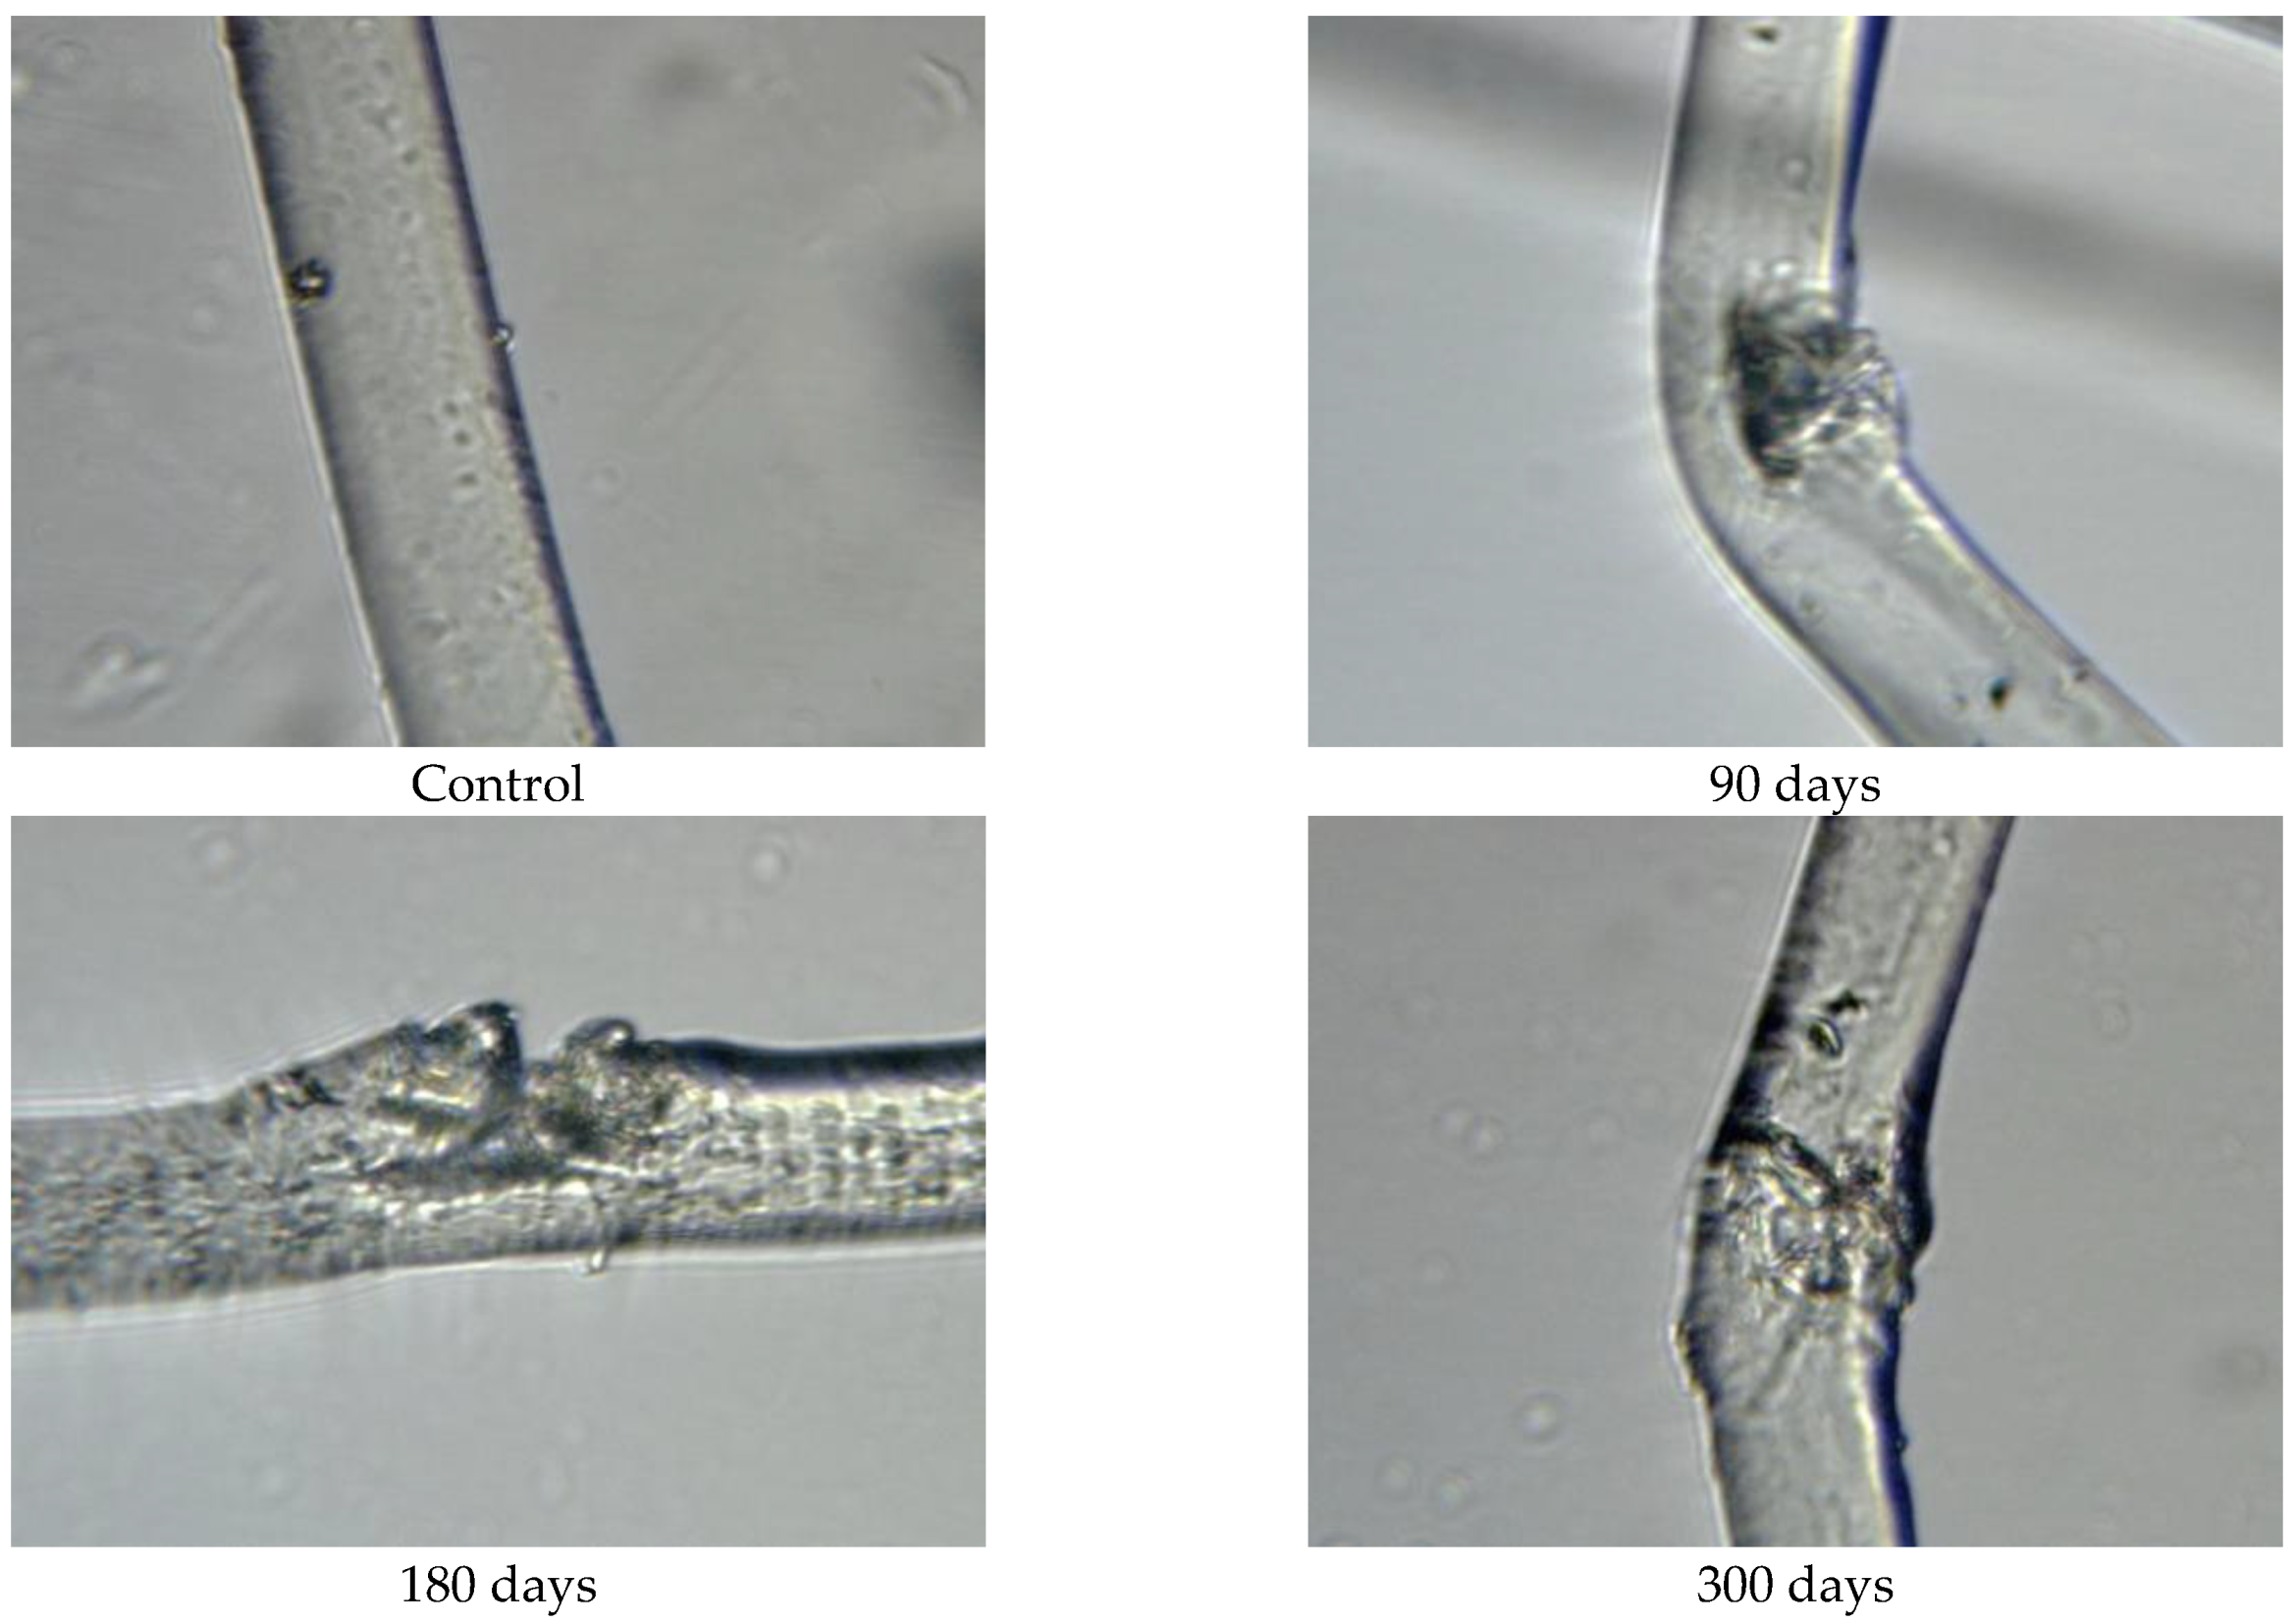
Before exposure to environmental conditions, the PLA fibres from the nonwoven mulches of 200 g/m
2 and 400 g/m
2 (
Figure 12 and
Figure 13) exhibited smooth and clean surfaces. Comparing the PLA fibres from the 200 g/m
2 needle-punched nonwoven mulches exposed to environmental conditions for 90 days with the control sample, several cracks were observed on the fibre surfaces, indicating degradation. As the exposure duration extended to 180 and 300 days, the PLA fibres displayed increasing roughness and a higher concentration of cracks on their surfaces as a degradation consequence. Similar behaviour was observed with PLA fibres from the 400 g/m
2 needle-punched nonwoven mulches, but cracks appeared after 90 days of exposure, increasing with time of exposure to environmental conditions.
3.4. FTIR Analyses of Nonwoven Mulches
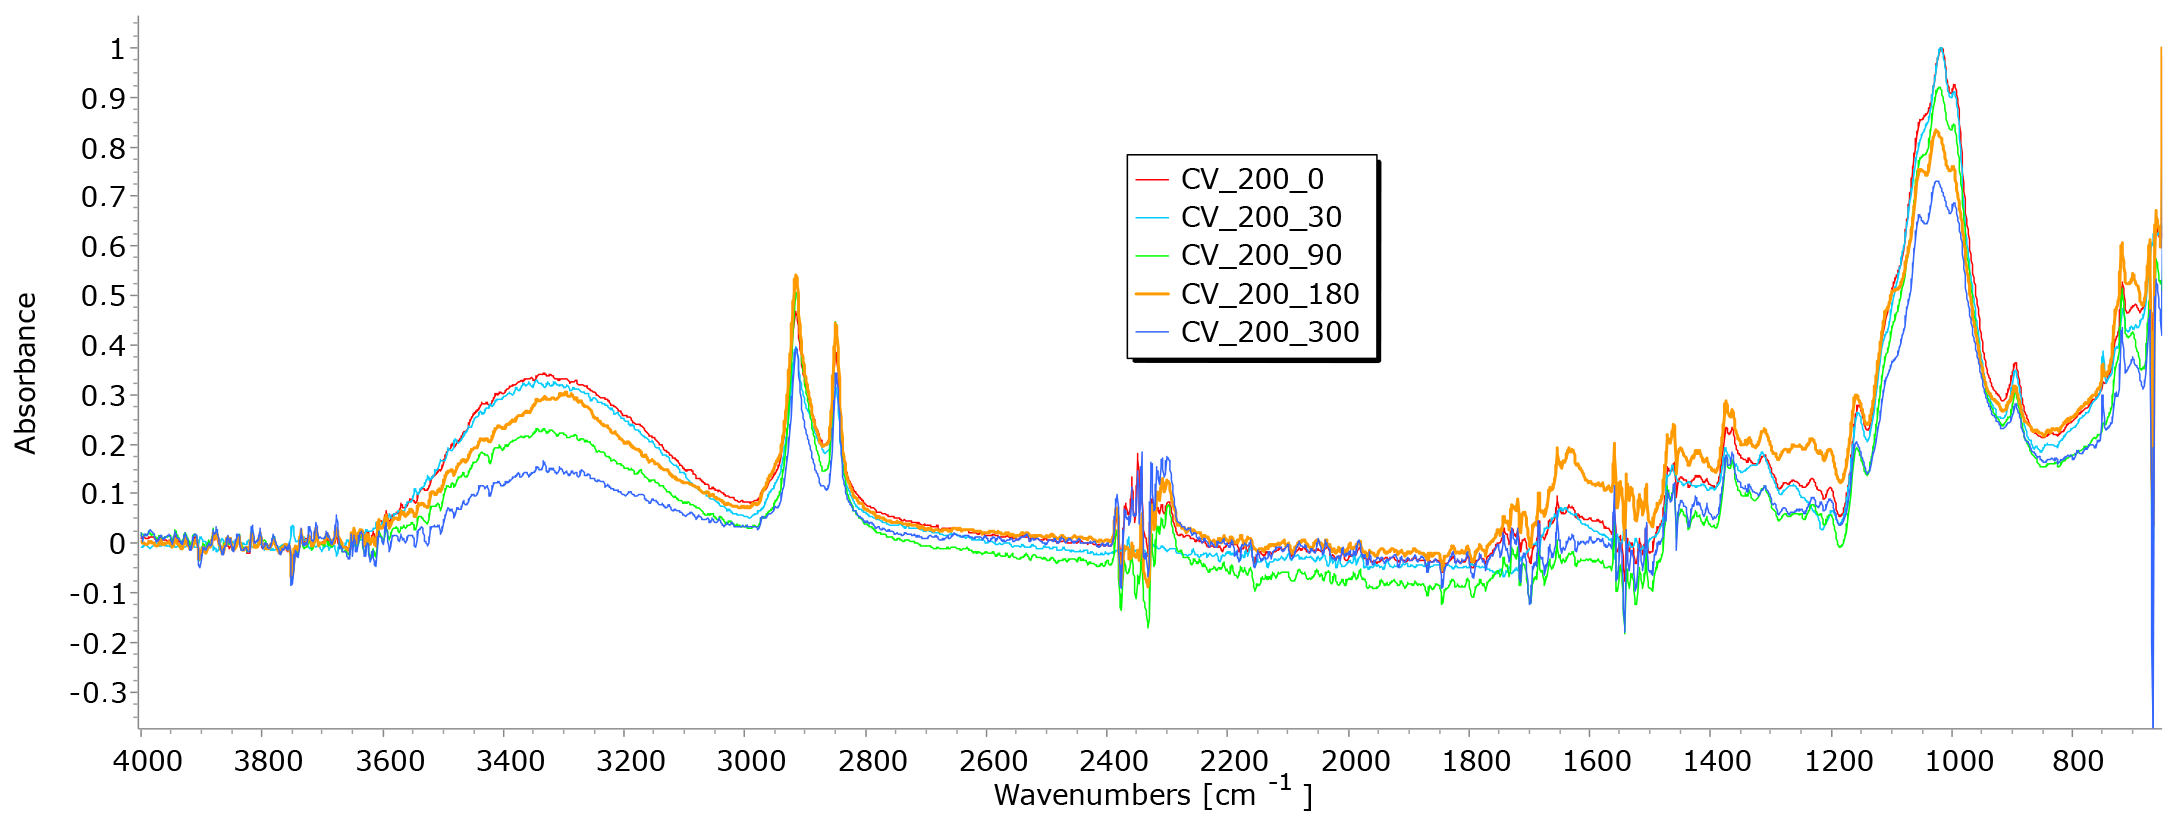
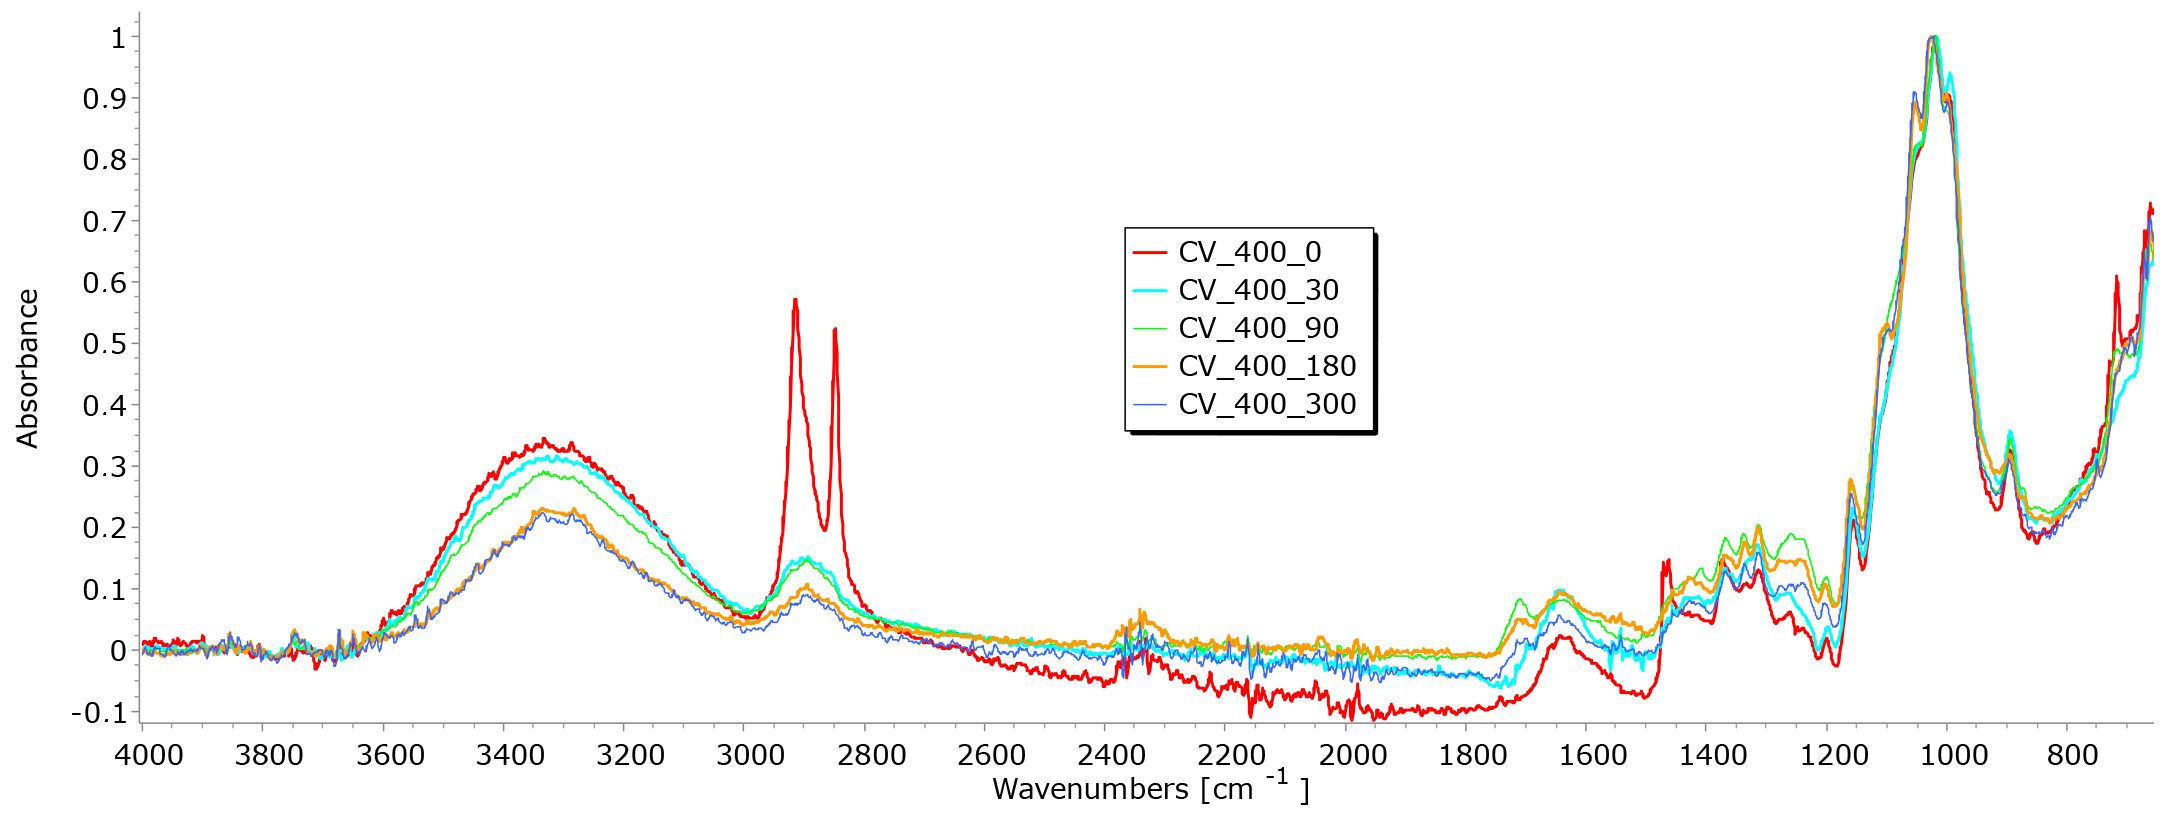
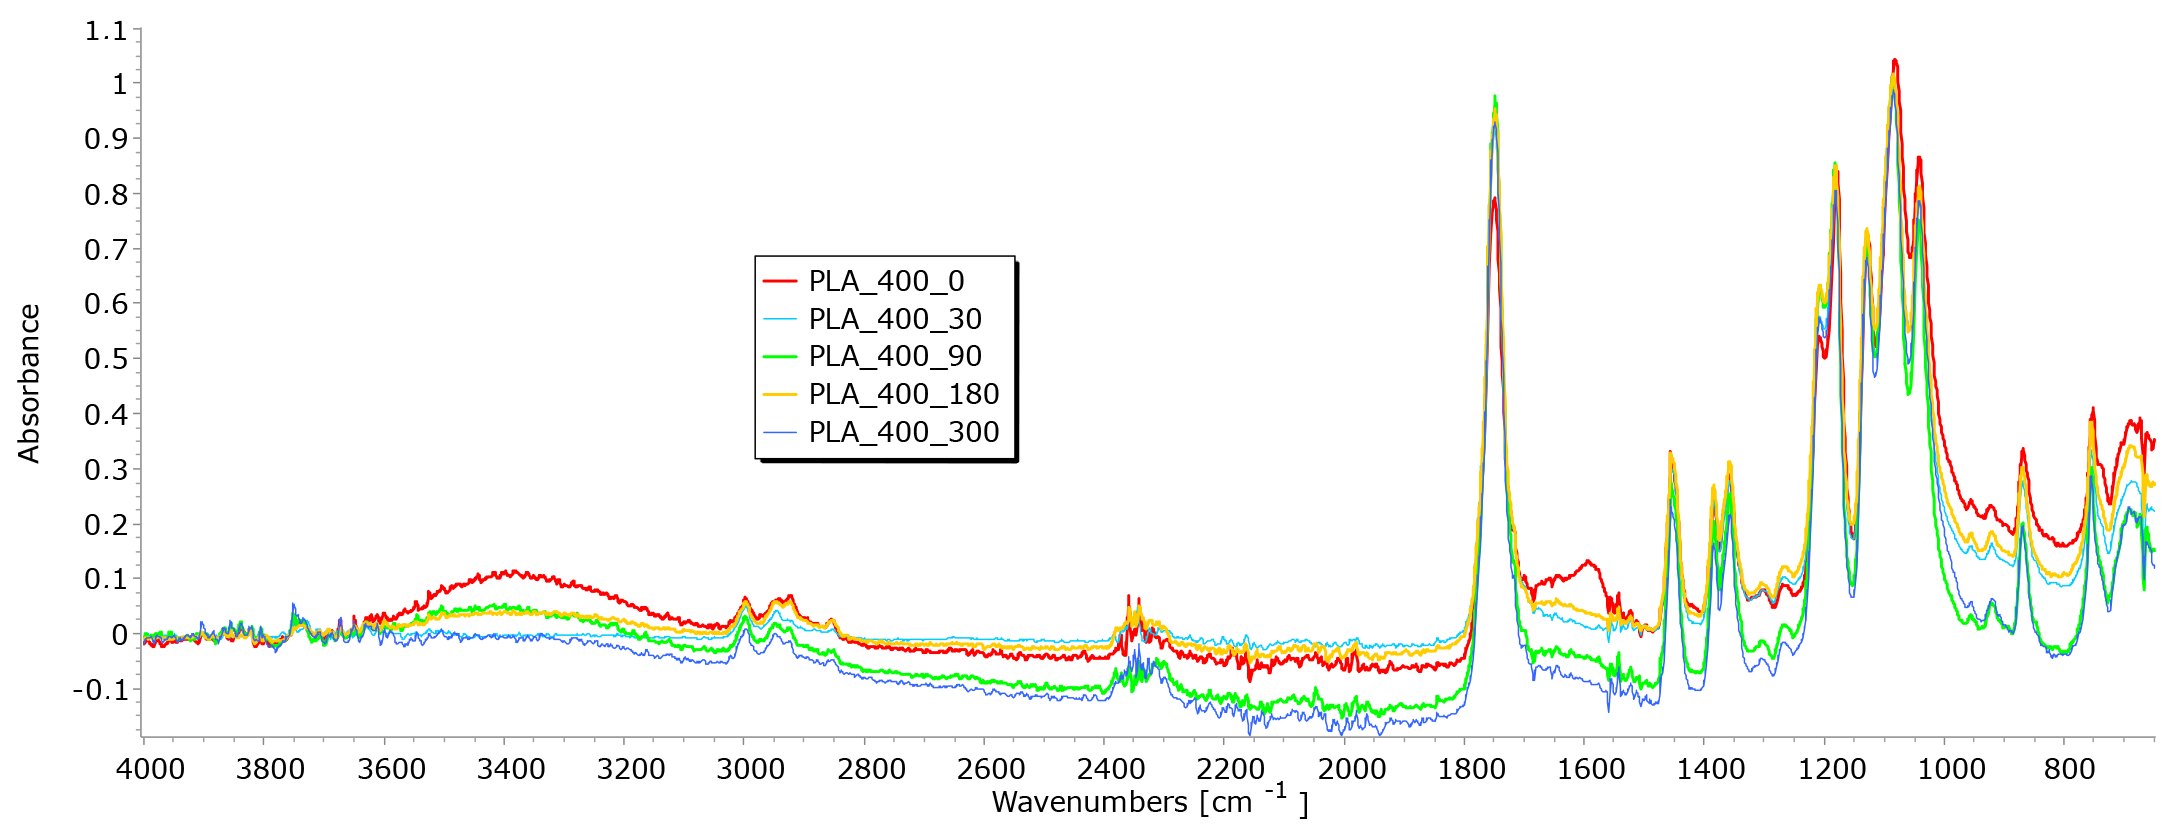
From the results of mass per unit area, thickness, permeability, and breaking force, it is notable that the determination of nonwoven mulches’ degradation in time is difficult. Due to the nonwoven mulch structure, the obtained results do not show mulch degradation, just the opposite. To determine to what extent the nonwoven structure impacted the results and degradation of fibre within nonwoven fabric structures occurred, FTIR analysis was performed. The fibres from nonwoven mulches were subjected to Fourier transform infrared spectroscopy, which can provide insights into the changes occurring in the chemical structure of fibres after exposure to environmental conditions (
Figure 14,
Figure 15,
Figure 16,
Figure 17,
Figure 18,
Figure 19 and
Figure 20). Comparing the FTIR spectra of the fibres taken from control mulches with nonwoven mulches exposed to environmental conditions, alterations in functional groups and chemical bonds can be identified, indicating progress and extent of degradation. Upon exposure to environmental conditions in an open field, organic material undergoes degradation, resulting in alterations to its chemical composition. Degradation can decrease the intensity of characteristic peaks observed in the FTIR spectra, indicating changes in functional groups or molecular vibrations. After degradation, characteristic peaks of the viscose fibres may increase, while others can remain unchanged, indicating significant alterations in the chemical structure of the fibres.
Viscose fibres, primarily composed of cellulose, in the 3200–3600 cm
−1 range exhibit a characteristic peak, representing the stretching vibrations of hydroxyl (OH) groups. Peaks within 2800–3000 cm
−1 correspond to the stretching vibrations of carbon–hydrogen (C-H) bonds within the aliphatic sidechains of cellulose molecules, while the range of 1000–1200 cm
−1 reveals stretching vibrations associated with C-O bonds. Additionally, peaks at 1420–1470 cm
−1 signify the bending vibrations of C-H bonds in the aliphatic sidechains of cellulose. These distinctive peaks not only indicate the presence of cellulose but also provide specific wavenumbers and intensity information that can signal degradation in viscose fibres exposed to environmental conditions [
26,
27].
A decrease in peaks of exposed viscose fibres at higher wavenumbers (3333 cm
−1, 2915 cm
−1) signifies modifications or loss of certain functional groups, resulting in changes in molecular vibrations during degradation (
Figure 14 and
Figure 15).
Slight changes appear at lower wavenumbers (2916 cm
−1, 2730 cm
−1, 2541 cm
−1), suggesting the formation of new functional groups within the fibre structure. Minor changes observed at lower wavenumbers (under 1000 cm
−1) may be attributed to signals from other molecules in this region. The region around 3000 cm
−1, where the hydroxyl band shows changes, is particularly interesting. These changes are linked to alterations in the crystalline structure, indicative of the degradation of the fibres. Analysing viscose fibres from nonwoven mulches of 400 gm
−2 mass per unit area, a characteristic peak at 2915 cm
−1 is observed (
Figure 15).
With both viscose samples (200 and 400 g/m
2), it is evident that after 30 days of exposure to external conditions, there was no significant drop in the intensity of the FTIR signals, which were very similar to the zero sample. Increasing the exposure time, this peak changes and decreases slightly, suggesting the progressive degradation of the molecular structure associated with it. Two additional peaks at 2848 cm
−1 and 2730 cm
−1 are present in the control sample but disappear in the exposed fibres, signifying significant alterations in the molecular vibrations or functional groups. These FTIR spectral changes provide evidence of the chemical transformations occurring in the viscose fibres during the degradation process (
Figure 14 and
Figure 15).
Cellulose is the primary structural component of bast fibres such as hemp and jute, along with a smaller amount of hemicellulose and various other non-cellulosic components. The non-cellulosic components, including lignin, pectin, fats, waxes, water, pigments, minerals, and ashes, are present in varying proportions. In the FTIR spectrum of bast fibres, characteristic peaks associated with cellulosic features appear, such as OH stretching (around 3300–3600 cm−1), CH stretching (around 2900 cm−1), and CH2 bending (around 1200 cm−1). In the FTIR spectra of hemp and jute fibres, characteristic peaks typically reflect unique chemical compositions and molecular structures. The exact positions and intensities of the peaks can vary depending on factors such as cultivars, agroecological growing conditions, fibre extraction, mechanical processing, and differences in chemical composition and structure. It is important to note that bast fibres may also contain hemicellulose and lignin, which can introduce additional peaks in the FTIR spectra. The presence and intensity of these peaks can vary depending on the amount of pectin and lignin. It is also necessary to be careful when interpreting the characteristic peaks of lignin and pectin, as they can be closely situated. The characteristic peaks of lignin are typically found in the range of 1600–1700 cm−1, representing aromatic ring stretching vibrations, and 830–900 cm−1, indicating C-H aromatic bending vibrations. The pectin’s peaks may encompass O-H stretching in the range of 3200–3600 cm−1 and C-O stretching in the range of 1000–1200 cm−1. To discern between the mentioned compounds, it is essential to identify the specific functional groups associated with each peak. Lignin, for instance, contains aromatic rings, leading to characteristic peaks related to aromatic C=C bonds. Conversely, pectin contains carboxyl groups (C=O), so peaks in the range of 1700–1750 cm−1 might indicate the presence of pectin with the fact that lignin’s aromatic ring stretching peaks are usually more intense and prominent compared to pectin’s peaks.
The FTIR spectra of jute and hemp fibres following exposure to environmental conditions reveal noticeable changes in the positions of characteristic peaks and a reduction in peak intensity, indicative of degradation processes (
Figure 16 and
Figure 17). Changes signify chemical and structural alterations within the fibres, i.e., reduction can be attributed to the breakdown and loss of cellulose chains.
The hemp fibres exhibited a higher reduction in peak intensity, particularly at 1025 cm
−1 and 1745 cm
−1, which can be attributed to the higher cellulose content (approximately 70%) and lower lignin content (approximately 6%) compared to jute fibres (55–65% of cellulose and around 12% of lignin) [
28,
29]. The most significant decrease in peak intensity was observed in the FTIR spectrum of hemp fibres after 300 days of exposure to environmental conditions. The decrease is particularly evident in the peaks at 1025 cm
−1 and 1745 cm
−1, which are characteristic peaks of pectin and lignin, which signify a reduction in the concentration of these chemical components. A similar trend was observed in the FTIR spectrum of jute fibres, with the highest reduction in peak intensity occurring after 180 days of exposure to environmental conditions [
30,
31,
32].
The FTIR analysis of jute and hemp fibres exposed to environmental conditions reveals significant changes in characteristic peaks, reflecting the degradation and chemical modifications to the fibres. The differing responses of hemp and jute fibres can be attributed to variations in cellulose, lignin, and other components’ content [
27,
33,
34].
Several characteristic peaks were identified in the FTIR analysis of the unexposed nonwoven mulch produced from PLA fibres of 200 and 400 g/m
2 (
Figure 18 and
Figure 19) [
35,
36]. The peaks at 3742 cm
−1 and 3751 cm
−1 correspond to the stretching vibration of hydroxyl groups (O-H), and the peak at 1750 cm
−1 (both samples) corresponds to the stretching vibration of the carbonyl group (C=O) in the ester linkage of PLA. In addition, there is a peak at 2997 cm
−1 and 2998 cm
−1, corresponding to the stretching vibration of C-H bonds in the methylene (CH
2) groups of PLA, and peaks at 1180 cm
−1 and 1179 cm
−1 corresponding to the stretching vibration of C-O bonds. After fibre exposure of 90, 180, and 300 days to environmental conditions, minimal changes in characteristic peaks were observed, typically considered insignificant and indicative of minor changes in chemical structure. The FTIR spectra of these samples exhibited a slight decrease in peak intensity, suggesting the beginning of fibre degradation.
The main characteristic feature of PE is the intense band associated with the stretching vibration of the methylene (CH
2) groups. The peak is typically observed around 2916–2848 cm
−1. The second distinctive peak corresponds to the bending vibrations of CH
2 groups, which appear around 1470–1465 cm
−1. The PE polymer also has CH
3 groups, and their stretching vibrations reveal a peak around 1375 cm
−1. Peaks associated with the stretching vibrations of carbon–carbon (C-C) and carbon–hydrogen (C-H) bonds in the PE polymer chain can be found in the range of 1100–1200 cm
−1. These characteristic peaks in the FTIR spectrum of PE agrofoil are the result of its polymer structure, primarily consisting of long chains of carbon and hydrogen atoms. Analysis of the FTIR spectrum of PE agrofoil in this research reveals the absence of significant changes in FTIR peaks (
Figure 20). This suggests that even after exposure to environmental conditions for 90, 180, and 300 days, discernible degradation in the PE agrofoil was not obtained. This behaviour is consistent with the known resistance of PE to any environmental conditions, owing to its chemical stability. Additionally, the relatively short exposure time may not have been adequate for the noticeable degradation in agrofoil.
3.5. Performance of Nonwoven Mulches—Soil Temperature and Moisture, and Weed Suppression
From May 2022 to February 2023, the soil beneath the conventional agrofoil was higher than on the bare control field from 0.1 °C to 1.4 °C on average (
Table 8). Only in February 2023 was the temperature beneath the agrofoil 0.4 °C lower than on the control field. Comparing temperatures beneath the agrofoil and mulches, it is evident that the temperature beneath the nonwoven mulches was mostly lower. An exception was recorded in June for viscose (0.8 °C, 1.7 °C), jute (1.5 °C), and hemp (0.8 °C) mulches; in November for hemp mulches (3.7 °C); and in December for PLA mulches (0.3 °C, 0.4 °C). It can be concluded that nonwoven mulches generally provide higher soil temperatures compared to bare soil, but not as high as beneath conventional agrofoil.
From July to December of 2022, the relative soil humidity was higher beneath the mulches than conventional agrofoil (
Table 9). Lower soil relative humidity beneath the mulches regarding agrofoil, considering the period from May 2022 to February 2023, was obtained in May for all nonwoven mulches (from 0.6% to 1.7%), in June for mulches made of PLA fibres (0.6%; 0.5%), in January 2023 for viscose mulches (0.3%) and jute mulches (0.5%), and February for jute (2.3%), hemp (1.0%), and PLA mulches (1.2%).
In months when plants are growing, higher relative soil humidity provides a better climate for plant development and growth. Considering bare soil humidity and soil humidity beneath the mulches, higher soil humidity was found beneath all mulches in the period of plant growing (June to October) except in May. The produced nonwoven mulches showed better soil humidity maintenance than conventionally used agrofoil.
Sustainable mulches should have similar performance to conventional agrofoil related to weed suppression. To determine the nonwoven mulches’ weed suppression ability, weeds under the mulches and on the control field were collected, dried, and weighed. The percentage of weeds that passed through the mulch relative to weeds grown on the control field was determined (
Table 10).
From June to October, weeds only passed through nonwoven mulches produced from bast fibres, where the percentage of weeds that passed through jute mulches was low (up to 2.2%). Relative to the control field, 14.3% of weeds passed through the nonwoven mulches made of hemp fibres. From October, a low percentage of passed weeds were found on viscose and PLA mulches of 400 gm−2. In December, the percentage of weeds that passed through the viscose nonwoven mulches increased (10.3%). Considering the obtained results, it can be concluded that the produced nonwoven mulches provided good weed suppression, except the hemp mulches.


