Abstract
Beer bagasse is a residue waste produced in great amounts; nevertheless, it is still underestimated in the industry. The aim of this paper is to develop an innovative and efficient methodology to recycle the beer bagasse by producing Poly-lactic acid(PLA)-based bio-composites, in the forms of pellets and filaments, to be used in additive manufacturing processes. To assess the suitability of beer bagasse for extrusion-based 3D printing techniques, it was, firstly, physically and chemically characterized. Then, it was added in combination with different kinds of plasticizers to PLA to make bio-composites, analyzing their thermal and physical properties. The results prove the great potential of bagasse, evidencing its printability. Both composites’ pellets and filaments were used in two different 3D printing machines and the mechanical properties of the 3D-printed models were evaluated as a function of the composition and the kind of technology used. All the used plasticizers improved processability and the polymer–bagasse interface. Compared to neat PLA, no changes in thermal properties were detected, but a lowering of the mechanical properties of the 3D-printed composites compared to the neat polymers was observed. Finally, a comparison between the efficiency of the two 3D printing techniques to be used with the bio-based composites was performed.
1. Introduction
Beer is one of the most commonly drank beverages and a growth in customer demand implies an ongoing growth in its production. The intensification of the production of beer causes a consequent increase in the fixed wastes generated during its production. The most abundant beer waste is bagasse (spent brewers’ grain), rising from the filtering and pressing of the malt obtained after the saccharification of the malted barley grain [1]. Its composition is extremely variable, mostly due to the production process, neat materials, and the industrial advancement of the sector [1,2]. Several studies evaluate the possibility to re-use beer bagasse, for the recovery of energy [1,3], the production of xylanase and cellulase [1,4] or bioplastics [1,5]. To the best of our knowledge, no studies reported the possibility to re-use beer bagasse to produce bio-composites to be used in additive manufacturing techniques, but for other processes [6]. Additive manufacturing (AM), also known as three-dimensional (3D) printing, according to standard [7], refers to those technologies that, based on a geometrical representation from 3D model data, create parts by successive addition of material layer-upon-layer [8,9,10]. This latter approach allows the fabrication of complex geometries, with low wastage production [11,12]. For this reason, AM techniques can be considered suitable technologies to reach one of the most important and current scientific and social aims, i.e., the transition from the linear economy model to a circular model. Some of the authors of this paper have already demonstrated that the correct use of AM can have a strategic impact on the economy and on environmental pollution, not only reducing waste production, but also obtaining new products with high added value, driving the industry towards economically and environmentally sustainability [10,13,14,15,16,17,18,19,20]. In this framework, this paper is aimed at studying the possibility to add beer bagasse to PLA, in presence of different kinds of natural plasticizers, to produce bio-composites in the forms of pellets and filaments. Bio-composites are composite materials composed of biodegradable natural fibers or fillers as reinforcement and biodegradable (or non-biodegradable) polymers as the matrix [15]. In particular, natural and recycled fillers can be used to produce fully biodegradable green composites, representing an innovative and efficient solution for current environmental issues. Among the advantages of bio-composites, in fact, the most important are the low energy and low CO2 emissions associated with their processing, biodegradability, renewability, low specific weight, higher specific strength, stiffness, high electrical resistance, low cost, and good thermal and acoustic insulating properties. However, most of them present some disadvantages, such as high sensitivity to moisture, low durability, and low adhesion between matrix and fiber [15]. Although some of these disadvantages make them unsuitable for certain applications where the specific requirements are too stringent, they may find a use in other applications where severe features are not required. In the literature, several attempts to create bio-composites by recovering wastes and using it as filler are reported: Toro et al. [21] studied the introduction of egg shell in a polypropylene matrix, Li et al. [22] used waste shellfish shell as filler with polypropylene matrix again [23], durian skin waste was employed by Manshor et al. [24] as filler in PLA bio-composites after a pre-treatment, Sing et al. [25] prepared bio-composites made by PLA with wood waste and rise hush, and Lima et al. recovered mango seed waste and used it as reinforcement in PLA matrix [26]. All these works show that it is possible to recover and valorize waste that can be used in the production of bio-composites.
Among 3D printing techniques that can use bio-composites, the material extrusion process (MEX) can use thermoplastic polymers or composites, in the form of filament, dispensed through a nozzle or orifice. Several studies considered PLA-based bio-composites to be printed using MEX techniques: Hong et al. [27] realized a filament of PLA reinforced by modified lignin to be used as feed material in a fused deposition modeling process, Flores-Hernandez et al. [28] showed how to prepare bio-composites of PLA reinforced with rachis obtained from chicken feathers and used it in AM, and Le Duigou et al. employed bio-composites with PLA and continuous flax fibers for structural application [29]. In previous works, PLA filaments for MEX processes with filler derived from scraps of olive wood [16], ceramics [17], and stones [13] were also prepared. Nowadays, new 3D printing machines have substituted the filament extruder with a pellet extruder, thus reducing the cost of the printing process, printing a wider range of materials, and increasing the speed of prints and the chance of recyclability when compared to filament extruder. Overall, this paper reports a comparison between the properties of the bio-composites containing PLA and beer bagasse in the presence of different kinds of compatibilizer, in the form of pellets and filaments. It also evaluates the suitability of both kinds of produced bio-composites in relation to their use for the two selected MEX techniques. Finally, it presents a comparison between the physical–mechanical properties of the 3D-printed model, by using pellets and filaments, in order to evaluate if the feed material could affect the printing quality or the mechanical properties of the formulations. Specifically, we expected the use of pellets to result in better performing objects, considering the facts that they have undergone fewer processing steps.
2. Materials and Methods
2.1. Materials
In this work, a comparison between the properties of 3D bio-composite samples printed by using two different AM techniques was carried out. To this aim, two extrusion-based 3D printers that required filament and pellets as feed material were selected.
A heat-resistant and high-impact strength grade poly lactic acid (PLA 3D870), supplied by Ingeo (Plymouth, MN, USA, EEUU), was used as a matrix to produce a composite material for 3D printing. The main properties of PLA 3D870, according to the technical data sheet, are reported in Table 1.

Table 1.
Main properties of PLA 3D870, according to the technical datasheet [30].
A total of 10 wt. % of beer bagasse, a by-product of beer production, supplied by Cervezas Lluna (Alcoy, Spain) was added to PLA, to produce both composite filaments and pellets.
Several plasticizers have been also added to PLA with a compatibility function: maleic anhydride (MA), provided by Scharlab (Sentmenat, Spain), and epoxidized linseed oil (ELO) and epoxidized soybean oil (ESBO) supplied by Sigma Aldrich (St. Louis, MI, USA). Table 2, Table 3 and Table 4 report the specifications of the three substances.
Table 2.
Main properties of MA, according to the technical datasheet [35].
Table 3.
Main properties of ELO, according to the technical datasheet [36].
Table 4.
Main properties of ESBO, according to the technical datasheet [37].
2.2. Bagasse’s Characterization
Bagasse (BG) was firstly ground using rotor mill Retsch ZM300 (Retsch GmbH, Haan, Germania [38] to obtain a powder with a granulometry of 0.5 mm.
Fourier-transform infrared spectroscopy (FT-IR 6300 Jasco from Jasco Europe s.r.l.) (Cremella, Italy) [39] was carried out on grounded BG samples, spectra were recorded in the 400–4000 cm−1 range, using 128 scans and 4 cm−1 of resolution by using a germanium round crystal window to determine the characteristic chemical functional groups.
XRD analysis (Rigaku Ultima +, Tokyo, Japan) [40] was carried out on the BG powder with CuKα radiation (λ = 1.5418 Å) in the step-scanning mode recorded in the 2θ range of 10°–60°, with a step size of 0.02° and step duration of 0.5 s. X-ray diffraction is one of the most important non-destructive tools to analyze matter ranging from fluids, to powders and crystals, and it is useful to understand the crystalline or amorphous organization of materials.
Finally, thermal stability of the powder was investigated through thermogravimetric analysis (TA Instruments TGA Q500) (TA instrumens, New Castle, DE 19720, USA) [41], scanning from 0 °C to 565 °C in a N2 atmosphere and from 565 °C to 1000 °C in a O2 atmosphere, with a heating rate of 10 °C/min.
2.3. Mixture’s Preparation
The bagasse was firstly dried at 40 °C for 72 h in a dryer to remove about 80 wt% of absorbed water, to prevent the appearance of microorganisms and the bagasse from rotting. The temperature was not raised above 40 °C to avoid damaging polyphenols and proteins.
Then, humidity content was measured using the Cobos FD-720 analyzer (Cobos Precision, Barcelona, Spain) [42], in automatic mode with a measurement deviation of 0.01% and a temperature of 80 °C. The result was 2.86 wt% humidity. In detail, for the measurement of humidity, the method carried out consisted of performing consecutive weighing of the sample, while it was subjected to drying at a constant temperature (80 °C) using IR light lamps. When two consecutive weighings have a weight difference of less than 0.01%, the weight variation is considered null and, therefore, there is no longer a loss of water in the sample. Finally, the equipment takes this last weighing as the final mass of the sample and subtracts it from the initial mass. The percentage of humidity is calculated by dividing the difference between the initial mass and the final mass by the initial mass and multiplying the result by 100, to obtain the result in % of humidity (, as shown in the following equation:
where mf is the weight after drying, m0 is the weight before drying. The measurement of the different weights of the sample and the calculation of % humidity is carried out automatically by the measuring equipment.
Before performing the compounding with PLA, both BG and PLA were dried at 80 °C for 4 h to remove traces of moisture in the dryer Arid X10X Dri-air industries (Thompson Rd, East Windsor, NJ, USA) [43] and in a ventilated dryer UF55 Memmert (Schwabach, Germany) [44], respectively. This treatment was necessary to avoid the appearance of microorganisms and fungi, caused by the presence of humidity (between 70 and 85%), lipids, protein matter, and fermentable sugars, responsible for the deterioration of BG properties [1]. Final humidity of BG was 1.05 wt. %.
Three different formulations were prepared by melt compounding of PLA (shaped in pellets), BG, and the compatibilizer using extruder Collin Teach Line ZK25 [45]. The amount of each compatibilizer was 5 wt. % of the mixture PLA/BG (in ratio 90:10). The compositions are shown in Table 5, where each formulation is labelled by specifying the pellet form by “-p”.
Table 5.
Composition of the formulations in the form of pellets.
Consequently, a filament for each formulation was produced through the extruder Next 1 Advance from 3Devo (Utrecht, The Netherlands) [46], setting a temperature profile for the four extruder zones and the screw speed, as reported in Table 6. The temperature profiles were chosen following extensive research of the literature and optimised for different compositions, considering that the presence of an additive normally causes a viscosity reduction with temperature. In fact, as several works report, the introduction of an additive with a high compatibility with PLA allows for a reduction in glass transition and melting temperatures [47,48,49]. Each formulation in filament form is labelled with “-f”. The PLA–BG formulation could not be extruded because it was too brittle.
Table 6.
Processing parameters of the filament extrusion for each formulation.
2.4. Three-Dimensional Printing Techniques
Two different 3D printing techniques were employed.
NX Pro Pellets (Tumaker (Irun, Spain)) [50] were selected to test the printability of the produced composite pellets, reported in Table 2.
Witbox 2 from BQ (Madrid, Spain) [51] was used to process the composite filaments of Table 3 as feedstock material.
Tensile specimens were produced by using both 3D printers, to perform characterization tests on the 3D-printed samples and compare the results. The printing parameters used to produce tensile, flexure, and impact specimens, by using both machines, are listed in Table 7, and some of them are explained below:
Table 7.
The 3D printing parameters used for the production of tensile, flexure, and impact specimens.
- The extrusion multiplier determines as a percentage the amount of wire or pellets to be extruded adding or subtracting to the ones calculated. As can be noted, there is a significant difference in this parameter in the two printing techniques. If set above 1, it allows for the creation of more dense prints, but values that are much greater than 1 can sometimes cause material overflow the defines the shape of the printed element, resulting in lower dimensional accuracy but stronger prints [52]. It generally ranges between 0.9 and 1.1, but in the case of Tumaker NX Pro Pellets, it was necessary to set a significantly higher value due to the discontinuity of the feed material;
- The shrink rate represents the polymer shrinkage and it is a form of polymer compensation;
- The first layer width is set to allow a proper adhesion to the substate, and also a speed reduction factor is provided to improve the adhesion.
2.5. Characterization Techniques
Glass transition temperature and melting temperature of composite filaments, pellets samples, and 3D-printed models were evaluated by differential scanning calorimetry DSC Q200 calorimeter TA Instruments (New Castle, DE, USA) [53]. Dynamic scans were performed following standard [54], in a N2 atmosphere with a flow of 50 mL/min. Each scan consisted of an initial heating cycle from 25 °C to 250 °C at a rate of 10 °C/min and a subsequent cooling down to −90 °C at a rate of 5 °C/min to eliminate eventual stresses. Then, a second scan was performed from 0 °C to 250 °C at a rate of 10 °C/min.
TGA analysis was conducted to investigate thermal stability of the different formulations, according to standard [55] using TA Instruments TGA Q500 [41]. Specifically, a heating from 30 °C to 565 °C in N2 atmosphere and a heating from 565 °C to 1000 °C in O2 atmosphere were performed, with a gas flow of 50 mL/min.
Melt flow index (MFI) was also evaluated following standard [56], using Twelvindex Atsfaar [57].
The mechanical behavior of the 3D-printed samples, by using both 3D printing techniques, was examined through tensile, flection, and impact tests. Tensile and flection test occurred using dynamometer Instron 6025 (Canton, MA, USA) [58].
Tensile proves follow the standard [59], at a strain rate of 1 mm/min for the measurement of Young’s modulus and 500 mm/min for the rest of the test. The grips used in these tests were wedge-type grips, the distance between grips was 115 mm, and the load cell was 10 kN. The dimensions of the specimen refer to the 1BA type, according to the standard.
Bending tests were performed according to standard [60] at a strain rate of 2 mm/min. The distance between supports was 64 mm and the load cell used was 10 kN. The specimens tested are straight prism specimens measuring 80 mm × 10 mm × 4 mm.
Impact tests were carried out using Ceast Resil impactor 6967.000 [61], following the standard [62]. The pendulum used was 5 J and the specimens used were type 1 specimens (prism measuring 80 mm × 10 mm × 4 mm).
2.6. Statistical Analysis
One-way analysis of variance (ANOVA) was used to highlight the statistical significance of the addition of each plasticizer on the mechanical properties. For this purpose, the F value, which is defined as the ratio of the variation between sample means to the variation within the samples, was calculated from the measured data. Then, with “a” being the number of levels of the variance factor and “n” the number of tests for each level, the critical F value, FCV (a − 1, a(n − 1), α), can be estimated. FCV represents the value of F distribution with degrees of freedom (a − 1) and a(n − 1), which, at a confidence level, α, corresponds to the null hypothesis (equivalence of the means). Therefore, F < FCV indicates that the population means are equivalent, whereas F > FCV indicates that the population means are significantly different. Another quantitative measure for reporting the result of a test of hypothesis is the p-value. The p-value is the probability of the test statistic to be at least as extreme as the one observed, given that the null hypothesis is true. A small p-value is an indication that the null hypothesis is false. It is good practice to decide in advance of the test how small a p-value is required to reject the test, that is, to choose a significance level, α, for the test. For example, it can be decided to reject the null hypothesis if the test statistic exceeds the critical value (for α = 0.05) or, analogously, to reject the null hypothesis if the p-value is smaller than 0.05.
3. Results and Discussion
3.1. Bagasse’s Characterization
Bagasse is a typical biomass, containing cellulose, hemicelluloses, and lignin [63]. The chemical characterization of bagasse was carried out using ATR-FTIR spectroscopy: the spectrum is shown in Figure 1a.
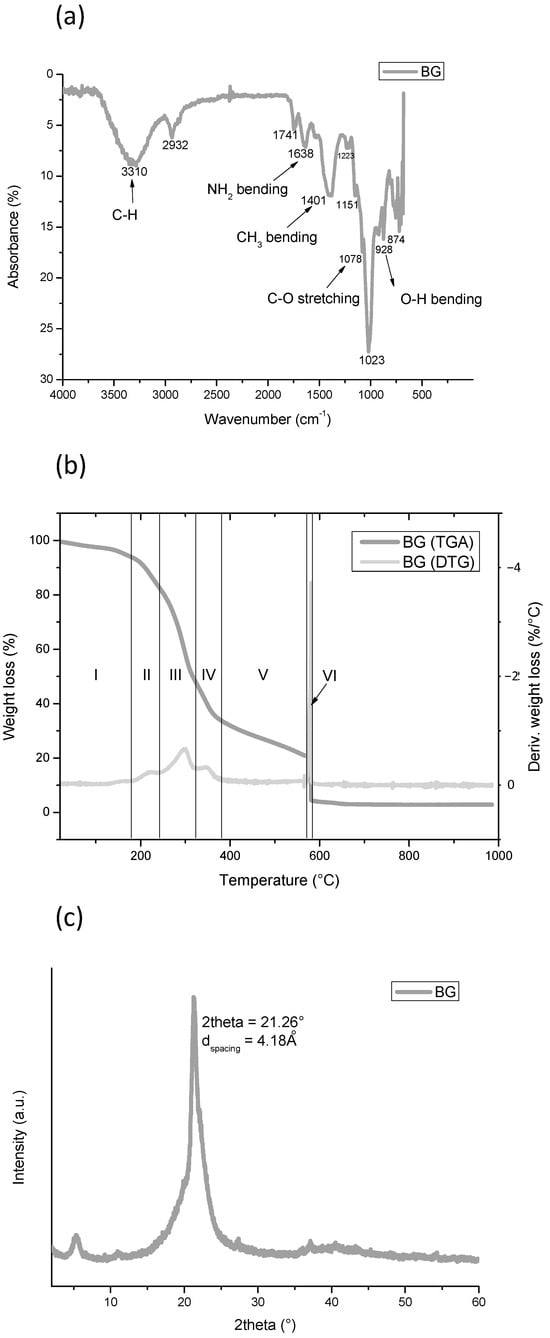
Figure 1.
BG characterization: (a) FTIR analysis of dried BG; (b) TGA and DTG analysis of dried BG; (c) XRD analysis of BG.
The hydroxyl of cellulose and hemicellulose caused the strong absorbance that happened at the range of 3200–3600 cm−1 [63]. The peaks at 2932 cm−1 and 2872 cm−1 are associated with the asymmetrical and symmetrical stretching vibrations of the C-H groups. The peak at 1741 cm−1 corresponds to the C=O stretching of the saturated esters, associated with the hemicellulose present in bagasse. Amino bonds at 1638 cm−1, 1521 cm−1, and 1401 cm−1, which correspond to amide I, amide II, and amide III, respectively, are also evident in the spectrum; these bands are associated with protein, lignin, and polysaccharide biomolecules [1]. Finally, the peaks at 1223 cm−1 and 1023 cm−1 are associated with the holocellulose biomolecules (cellulose and hemicellulose) [64,65].
As can be seen in Figure 1b, TGA and DTG analysis assessed that the degradation of BG happened in six steps. By observing the two curves, it is possible to identify the start and end temperatures of each step and the temperature at the maximum degradation rate, which can be detected by DTG analysis as the peak temperature of each stage. This experimental result suggests that BG is composed of at least six different compounds. The weight loss of degradation step I happens between 120 °C and 180 °C, showing a maximum degradation rate at 160 °C and a weight loss of 7.6%. This relates to structural or chemical water molecules belonging to the BG network that were not completely expelled during drying. Step number II starts at 180 °C; it is probably related to the dissociation of O-acetyl side-chain fragmentation reactions to form acetic acid, and a second fragmentation reaction to form some light volatiles [66]. It reaches a maximum degradation rate at 222 °C, and ends at 242 °C, when step number III starts. The latter induces a weight loss of 34.3% and it ends at 322 °C after reaching a maximum degradation rate at 298 °C. It is attributed to the depolymerization reaction of the xylopyranose chain of the hemicellulose [66]. A slope change can be noticed at 322 °C, which marks the beginning of degradation step number IV, with a maximum rate at 347 °C, due to cellulose degradation [66] corresponding to a 14.8% of weight loss. Then, at 383 °C the slope changes again, marking the linear step, V, with a constant degradation rate, which ends at 570 °C, resulting in a weight loss of 12.7%. Over this temperature, weight loss at step number VI, with a very fast degradation, is observed when O2 atmosphere is introduced, and it finishes at 582 °C, leading to a weight loss of 16.4%. The degradation is completed at 650 °C, and, above this temperature, the solid residue is about 3 wt. %. TGA and DTG results are summarized in Table 8.
Table 8.
TGA and DTG results.
From XRD analysis (Figure 1c), it has been shown the BG powder is mainly amorphous. However, it has ordered crystalline fractions, as suggested by XRD spectra. The main peak occurs at a 2-theta angle of 21.26°, and corresponds to a d-spacing of 4.18 Å. It can be attributed to the crystalline fraction of cellulose [67].
3.2. Pellets and Filament Thermal Properties
Before printing, the properties of both produced pellets and filament composites were analyzed, starting with the thermal behavior.
Considering TGA results for both pellets and filaments, reported in Figure 2a,b, it can be observed that the thermal stability of PLA is affected by the presence of both BG and compatibilizer.
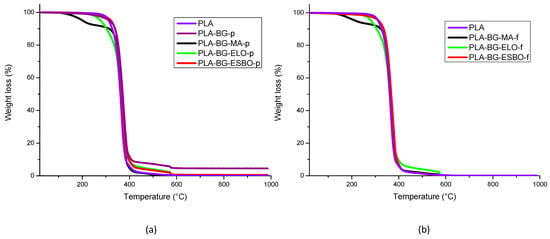
Figure 2.
TGA curves of formulations in pellet (a) and formulations in filament (b).
The starting and ending degradation temperatures, the maximum rate degradation temperature (Tdm), and the weight loss of each degradation step, measured starting from the curves of Figure 2, are reported in Table 9. For the PLA–BG–MA formulation, it can be seen a first degradation step related to the MA’s evaporation happens at 200 °C [68]. PLA–BG–ELO shows an initial degradation temperature lower than that of neat PLA, because ELO starts to degrade at 250 °C and then its degradation is superimposed on that of PLA [48,49]. However, ESBO has a degradation range that completely overlaps with that of PLA [48]. Therefore, all formulations exhibit similar behavior to PLA, degrading almost completely between 300 °C and 400 °C, but MA is less thermally stable than the other two additives. In fact, the degradation of PLA–BG–MA starts at lower temperatures (125 °C), which makes the PLA–BG–ELO and PLA–BG–ESBO formulations more suitable for printing temperatures and possible subsequent processing steps.
Table 9.
Thermal properties from TGA test of pellets and filaments.
After this main step, in some cases, a final section of the curve relating to the degradation of certain BG components can be seen.
Changes in thermal properties with respect to virgin PLA were investigated, measuring the glass transition temperature (Tg) and melting temperature (Tm) of all formulations by using DSC. The thermograms obtained from the DSC analysis are shown in Figure 3a,b, while in Figure 3c,d the zoom on glass transition temperature of PLA and plasticized PLA is reported.
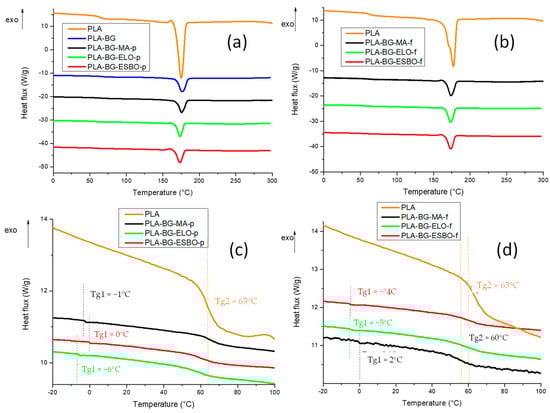
Figure 3.
DSC test of formulations in pellet (a) and formulations in filament (b). Zoom on Tg of the DSC test of formulations in pellet (c) and formulations in filament (d). The heat flux is exothermic upwards.
As can be observed, pristine PLA shows, both for pellet and filament, a single glass transition at 63 °C. However, two glass transitions are visible for PLA plasticized with the three compatibilizers. This indicates that although the plasticization process occurs with the addition of each compatibilizer, some phase segregation happens during processing, due to an inhomogeneous mixing of the plasticizers into PLA. Therefore, two domains can be detected in plasticized PLA: the first one, characterized by lower glass transition temperatures (about 0 °C) with a higher content of plasticizer, and the second one, at higher glass transition temperatures (about 60 °C), rich in PLA content, with a very low amount of plasticizer.
The values of the characteristic temperatures are also summarized in Table 10.
Table 10.
Thermal properties from DSC test of pellets and filaments.
MFI measurements were also carried out on pellets and filaments. The results obtained are reported in Table 11. For the PLA–BG–MA-f sample, it was not possible to measure MFI because of its low viscosity. As can be seen from the MFI values of Table 11, the introduction of MA induced an improvement in the processability of the composite, due to the reduction in viscosity, but in filament form, the viscosity has been significantly reduced. This would make processing less smooth, as the viscosity of the fluid must be in a range suitable for the temperatures employed. Otherwise, the formulations with ELO or ESBO show a lower MFI, especially for the pellet-shaped ones, which means more difficult processability, but the viscosity is still adequate for the processes to which the various formulations were subjected. Despite this, no particular difficulties were encountered at the processing stage.
Table 11.
MFI values of the formulations in pellets and filaments.
3.3. Thermal Properties of 3D-Printed Specimens
To appreciate eventual changes in thermal properties, the same characterizations performed on feed printing materials (in pellets and filaments) were repeated on the tensile specimens printed by the two different 3D printers. No changes in glass transition and melting temperature were observed from DSC tests on 3D-printed samples compared to pellets and filament composites. Moreover, TGA results show, again, no important variations in thermal stability and degradation temperatures of the 3D-printed samples, as can be seen in Figure S1, reported in the supplementary information section.
3.4. Mechanical Properties of 3D-Printed Specimens
The 3D-printed tensile specimens were tested from a mechanical point of view. An example of a tested sample is reported in Figure 4, where the dimensions of the specimen are also indicated, in mm. Firstly, tensile tests were carried out, and the results are shown in Table 9 and Table 10, for the sample printed using Tumaker NX Pro Pellets (labelled with “-Tum”) and by BQ Witbox 2 (labelled with “-Wit”), respectively. Analogously, Table 11 and Table 12 report the bending behaviour of the tested samples, and Table 13 and Table 14 show impact strength. These last two tests were carried out with rectangular specimens (Figure 4d,e).
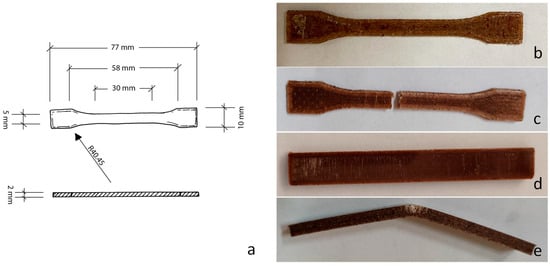
Figure 4.
Dimension (in mm) of a tensile specimen (a) of PLA–BG–ELO-f before tensile test (b) and after tensile test (c); rectangular specimen before bending test (d) and after bending test (e).
Table 12.
Mechanical properties from tensile tests of sample printed using Tumaker NX Pro Pellets.
Table 13.
Mechanical properties from tensile tests of sample printed using BQ Witbox 2.
Table 14.
Mechanical properties from bending tests of sample printed using Tumaker NX Pro Pellets.
The introduction of BG to PLA had a stiffening and embrittlement effect, as shown by the Young’s modulus increase, and strength and elongation reduction. However, when adding the compatibilizer, the stiffness decreases, as well as tensile strength (σt) and elongation at break (εt), as demonstrated by the values reported in Table 12 and Table 13. However, comparing the properties of the specimens realized by the printer Tumaker NX Pro Pellets and by the BQ Witbox 2, the former allowed for obtaining a reduction in a less important properties, probably due to fewer steps of processing of the raw material introduced in the printer. In fact, in the first case, the Young’s modulus (Et) drops 7–21% based on the compatibilizer), and in the second, the decrease observed is 24–26%. Regarding σt, the samples realized by Tumaker NX Pro Pellets show a reduction due to the addition of the compatibilizer of 29–31%, but εt is reduced in the PLA–BG formulation but increased to exceed that of PLA due to the presence of the compatibilizer. Employing the other printing technique, they shows a reduction between 38% and 42%, and of 28%, respectively. The three different compatibilizers act in a very similar way, reporting an analogous response in terms of reduction in PLA properties.
From bending tests, a non-important reduction in stiffness is observed in the different formulations, regardless of printing system, as can be seen in Table 14 and Table 15. Considering samples realized through Tumaker NX Pro Pellets, the maximum bending strength of pure PLA of 78 MPa was reduced when adding BG by 19% and subsequently when adding MA, ELO, or ESBO by 42%, 32%, and 33%, respectively (Table 14). With regard to samples made with BQ Witbox 2, the bending strength suffered a reduction from 81 MPa of the pure PLA specimen of 34% by adding MA and 39% by adding ELO or ESBO (Table 15). This behaviour demonstrates a better suitability of Tumaker NX Pro Pellets in the case of PLA–BG–ELO and PLA–BG–ESBO formulations, while for PLA–BG–MA the BQ Witbox 2 was more appropriate due to a lower loss of properties. At the same time, a reduction in elongation at break from 10% of pure PLA to 7% was observed with the introduction of BG in the PLA matrix, but the addition of the compatibilizer allowed for a new increase up to 11–12% in the case of ELO and ESBO, regardless of printing system.
Table 15.
Mechanical properties from bending tests of sample printed by BQ Witbox 2.
The mechanical behavior was also investigated through impact tests, the results of which are given in Table 16 and Table 17. In general, the impact strength of samples realized by Tumaker NX Pro Pellets was the same as that of samples made with BQ Witbox 2. Specifically, in the former case, the introduction of bagasse alone led to a 60% reduction in impact strength compared to a pure PLA sample, probably due to poor adhesion between the polymer chains and BG granules. With the addition of the compatibilizer, the loss of strength became 48%, 46%, and 48%, with reference to MA, ELO, and ESBO, respectively. These additives, therefore, resulted in an improvement in the polymer–BG interface. In the latter case, a lower loss of impact strength is found, although the impact strength shown by a pure PLA sample printed with BQ Witbox 2 is lower than that of the same sample printed with Tumaker NX Pro Pellets. In fact, the reduction observed for the three formulations was 40%, 37%, and 47%. However, the final properties achieved, in terms of impact resistance, are the same. Therefore, regardless of the printing technique, the PLA–BG–ELO formulation suffers the least reduction in impact strength compared to pure PLA, so ELO seems to show better compatibilization properties than the other additives.
Table 16.
Mechanical properties from impact tests of sample printed using Tumaker NX Pro Pellets.
Table 17.
Mechanical properties from impact tests of sample printed using BQ Witbox 2.
In general, ELO and ESBO would seem to be more suitable for PLA–BG compatibility, since they are more thermally stable than MA, and result in acceptable mechanical properties.
A comparison of the different mechanical properties is reported in Figure 5. Observing the behavior of the three compatibilizers, it is possible to see how the effect imparted on the mechanical properties is almost the same for all three. They are all capable of promoting better dispersion of the filler in the PLA matrix in a very similar way, thanks to the good compatibility with PLA. Of course, a drop in mechanical properties due to the presence of a waste was expected. However, this reduction in mechanical properties is not such as to prevent the developed formulations from finding an application. In addition, the need to add a compatibilizer improves the polymer–BG interface, making the printed objects more cohesive and improving the quality of the printing, but on the other hand, it causes an increase in ductility. Therefore, considering the entity of the reduction in properties, we can consider the developed formulations suitable for some applications where high requirements are not necessary, thus, meaning the beer bagasse can be used profitably.
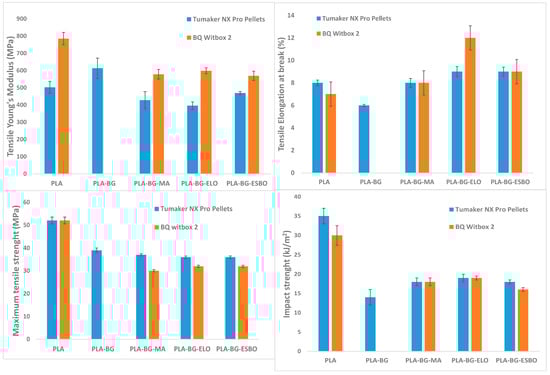
Figure 5.
Comparison of mechanical properties of sample realized by Tumaker NX Pro Pellets and by BQ Witbox 2.
Results of statistical analysis ANOVA are reported in the following tables (Table 18, Table 19, Table 20, Table 21, Table 22 and Table 23). Considering the kind of plasticizer as the source of variation, with three levels, and two degrees of freedom, its significance on tensile modulus, flexural modulus, and impact resistance for samples obtained both from filament and pellet was tested, and strength was tested by calculating the F value as the ratio of the variance between the means to the variance of the experimental error. The F value was then used in order to calculate the corresponding p-value, which was then compared with the confidence level, α = 0.05. According to ANOVA, p > α corresponds to the null hypothesis (equivalence of the means), whereas p < α indicates that the population means were significantly different. For tensile modulus, p = 0.56947 and p = 0.19675 for samples produced from filament and pellet, respectively, indicating that the corresponding mechanical properties were not influenced by the change of the plasticizer in the tested range of compositions. The same result was obtained for the flexural modulus of samples obtained from filament: with a p = 0.83922, flexural strength is not statistically affected by the type of plasticizer.
Table 18.
ANOVA analysis: tensile modulus of samples made from filament.
Table 19.
ANOVA analysis: tensile modulus of samples made from pellets.
Table 20.
ANOVA analysis: flexural modulus of samples made from filament.
Table 21.
ANOVA analysis: flexural modulus of samples made from pellets.
Table 22.
ANOVA analysis: impact resistance of samples made from filament.
Table 23.
ANOVA analysis: impact resistance of samples made from pellets.
In contrast, p = 0.01064 for the flexural modulus of samples obtained by pellets indicates the statistically relevant effect of the addition of different plasticizers on the corresponding property of the blend.
Finally, for impact resistance, p = 0.0522 and p = 0.3421 were found for samples produced by filament and pellets, respectively, thus, indicating that the addition of different plasticizers was not statistically significant.
3.5. Optical Microscopy
The quality of 3D-printed models by using the two different printing techniques was assessed by observing the printed samples under an optical microscope. Considering the specimens printed with the Tumaker NX Pro Pellets printer, shown in Figure 6, it can be seen that the absence of compatibilizer results in a very rough surface (Figure 6A). The introduction of a compatibilizer instead results in more homogenous surfaces with better definitions (Figure 6B–D). When comparing these samples with those printed with the BQ Witbox printer (Figure 7), it can be seen that the latter technique results in less homogenous and defined specimens. In some cases, it is also possible to appreciate the presence of a higher number of larger voids. In particular, the formulation containing MA has large voids, of about 200 µm. Therefore, considering the quality of the printed samples, it can be said that it decreases with increasing the number of processing steps the mixtures undergo.
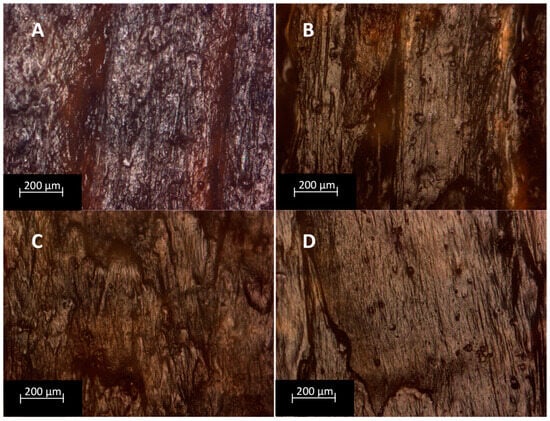
Figure 6.
Optical microscope photographs with a magnification of 10× of formulations printed by Tumaker NX Pro Pellets: (A) PLA–BG, (B) PLA–BG–MA-Tum, (C) PLA–BG–ELO-Tum, (D) PLA–BG–ESBO-Tum.
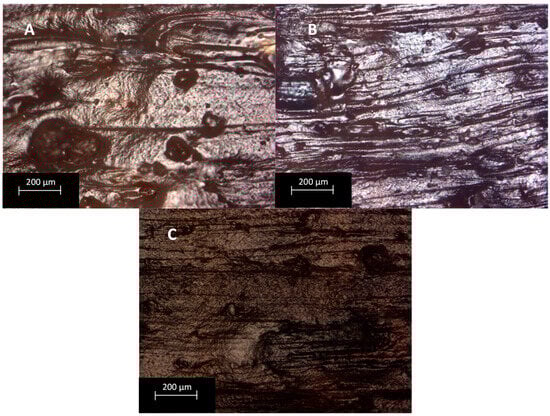
Figure 7.
Optical microscope photographs with magnification of 10× of formulations printed by BQ Witbox 2: (A) PLA–BG–MA-Wit, (B) PLA–BG–ELO-Wit, (C) PLA–BG–ESBO-Wit.
All the scientific results obtained from this study confirm the stabilizing effect of each compatibilizer, evidencing that the Tumaker NX Pro Pellets printer is able to minimize the number of defects of the printed models, allowing the printability of less basic shapes with higher precision, as demonstrated by the representative sample printed by Tumaker NX Pro Pellets, using PLA–BG–MA, PLA–BG–ELO, and PLA–BG–ESBO pellets (Figure 8).
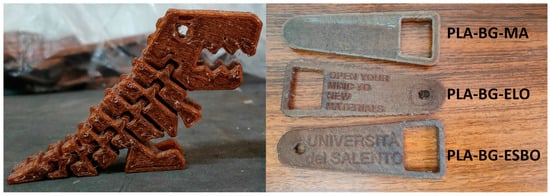
Figure 8.
Representative objects printed by Tumaker NX Pro Pellets: on the left, an object manufactured using PLA–BG–ELO formulation; on the right, three objects manufactured using PLA–BG–MA, PLA–BG–ELO, and PLA–BG–ESBO formulations, top down, respectively.
4. Conclusions
The present work shows a profitable and efficient possibility in the use of a waste that is currently not valorized. Beer bagasse was, in fact, found to be a possible filler to be used in the preparation of bio-composites, which would be able to reduce the quantity of virgin polymer necessary for the production of feed materials for AM. PLA-based bio-composites in forms of pellets and filaments suitable for MEX 3D printing process were developed, by recovering a waste material of the beer production chain. The effect of different kind of compatibilizer (MA, ELO, and ESBO) on the physical–chemical properties of the bio-composites was assessed. Finally, two different extrusion-based 3D printing techniques were used to evaluate the printability of the developed bio-composites. The following are the relevant conclusions that can be drawn from this work:
- Among the various additives used, MA was the one that made processing convenient thanks to the low viscosity shown at working temperatures. However, at the same time, it was not very thermally stable, since its degradation starts at 125 °C;
- On the other hand, PLA–BG–ELO and PLA–BG–ESBO show very similar mechanical properties, but ELO would seem to be better suited to preserve impact strength properties, probably due to a better polymer–BG interface that it is able to create;
- It was observed that the addition of BG and compatibilizer led to a reduction in stiffness, but the presence of the compatibilizer was useful to improve elongation at break and impact strength with respect to the formulation without the compatibilizer, thanks to a better compounding of the elements and a better cohesion;
- In general, a loss of mechanical properties with respect to pure PLA samples was observed, but the characteristics are still high enough to be used in several applications allowing for the recovering of a waste;
- The 3D samples printed by Tumaker NX Pro Pellets show a higher tensile strength than those made by BQ Witbox 2, and also a better accuracy in printing. It can, hence, be concluded that the extrusion of pellets produced objects with a better quality than those produced through filament extrusion, probably due to the fewer steps of processing necessary for the production of the pellets.
Supplementary Materials
The following supporting information can be downloaded at: https://www.mdpi.com/article/10.3390/polym15214323/s1, Figure S1: TGA curves of PLA–BG–MA in pellet form, filament form, and printed by Tumaker NX Pro Pellets, and by BQ Witbox 2 (a), PLA–BG–ELO in pellet form, filament form, and printed by Tumaker NX Pro Pellets, and by BQ Witbox 2 (b), PLA–BG–ESBO in pellet form, filament form, and printed by Tumaker NX Pro Pellets, and by BQ Witbox 2 (c).
Author Contributions
Conceptualization, C.E.C. and A.M.-G.; methodology, C.E.C. and A.M.-G.; validation, A.M.-G. and D.F.; formal analysis, D.S. and M.J.-R.; investigation, D.S. and S.C.; resources, A.M.-G.; data curation, D.F. and D.R.; writing—original draft preparation, S.C.; writing—review and editing, C.E.C., F.F., A.M.-G., D.F. and D.R.; visualization, D.R.; supervision, C.E.C., F.F. and A.M.-G.; project administration, C.E.C. and A.M.-G.; funding acquisition, C.E.C. and A.M.-G. All authors have read and agreed to the published version of the manuscript.
Funding
We acknowledge the funding to IVACE, through GVA 2022 and GVA 2023: I+D Materiales funcionales” ref. IMAMCA/2022/3 and “IMAMCA/2023/3, respectively.
Institutional Review Board Statement
Not applicable.
Data Availability Statement
The data presented in this study are available on request from the corresponding author.
Conflicts of Interest
The authors declare no conflict of interest. The funders had no role in the design of the study; in the collection, analyses, or interpretation of data; in the writing of the manuscript; or in the decision to publish the results.
References
- Castro-Criado, D.; Abdullah, J.A.A.; Romero, A.; Jiménez-Rosado, M. Stabilization and Valorization of Beer Bagasse to Obtain Bioplastics. Polymers 2023, 15, 1877. [Google Scholar] [CrossRef]
- Aliyu, S.; Bala, M. Brewer’s spent grain: A review of its potentials and applications. Afr. J. Biotechnol. 2011, 10, 324–331. [Google Scholar]
- Ortiz, I.; Torreiro, Y.; Molina, G.; Maroño, M.; Sánchez, J. A feasible application of circular economy: Spent grain energy recovery in the beer industry. Waste Biomass Valorization 2019, 10, 3809–3819. [Google Scholar] [CrossRef]
- Moran-Aguilar, M.; Costa-Trigo, I.; Calderón-Santoyo, M.; Domínguez, J.; Aguilar-Uscanga, M. Production of cellulases and xylanases in solid-state fermentation by different strains of Aspergillus niger using sugarcane bagasse and brewery spent grain. Biochem. Eng. J. 2021, 172, 108060. [Google Scholar] [CrossRef]
- Mussatto, S.I. Biotechnological potential of brewing industry by-products. In Biotechnology for Agro-Industrial Residues Utilisation: Utilisation of Agro-Residues; Springer: Berlin/Heidelberg, Germany, 2009; pp. 313–326. [Google Scholar]
- Jordá-Reolid, M.; Ibáñez-García, A.; Martínez García, A. Proceedings of the Biopol 2022-8th International Conference on Bio-Based and Biodegradable Polymers; Optimization of the Percentage of Beer Bagasse Fibres in bioPE polymeric Matrix-BIOVALORA Project; Garigós, M.D.C., Jiménez, A., Eds.; Universidad de Alicante: Alicante, Spain, 2022. [Google Scholar]
- ISO/ASTM 52900:2021; Additive Manufacturing. ISO: Geneva, Switzerland, 2021.
- Wang, X.; Jiang, M.; Zhou, Z.; Gou, J.; Hui, D. 3D printing of polymer matrix composites: A review and prospective. Compos. Part B Eng. 2017, 110, 442–458. [Google Scholar] [CrossRef]
- Wu, H.; Fahy, W.; Kim, S.; Kim, H.; Zhao, N.; Pilato, L.; Kafi, A.; Bateman, S.; Koo, J. Recent developments in polymers/polymer nanocomposites for additive manufacturing. Prog. Mater. Sci. 2020, 111, 100638. [Google Scholar] [CrossRef]
- Fico, D.; Rizzo, D.; Casciaro, R.; Esposito Corcione, C. A review of polymer-based materials for fused filament fabrication (FFF): Focus on sustainability and recycled materials. Polymers 2022, 14, 465. [Google Scholar] [CrossRef]
- Ivanova, O.; Williams, C.; Campbell, T. Additive manufacturing (AM) and nanotechnology: Promises and challenges. Rapid Prototyp. J. 2013, 19, 353–364. [Google Scholar] [CrossRef]
- González-Henríquez, C.M.; Sarabia-Vallejos, M.A.; Rodriguez-Hernandez, J. Polymers for additive manufacturing and 4D-printing: Materials, methodologies, and biomedical applications. Prog. Polym. Sci. 2019, 94, 57–116. [Google Scholar] [CrossRef]
- Corcione, C.E.; Palumbo, E.; Masciullo, A.; Montagna, F.; Torricelli, M.C. Fused Deposition Modeling (FDM): An innovative technique aimed at reusing Lecce stone waste for industrial design and building applications. Constr. Build. Mater. 2018, 158, 276–284. [Google Scholar] [CrossRef]
- D’Accolti, L.; De Cataldo, A.; Montagna, F.; Esposito Corcione, C.; Maffezzoli, A. The Role of 3D Printing in the Development of a Catalytic System for the Heterogeneous Fenton Process. Polymers 2023, 15, 580. [Google Scholar] [CrossRef]
- Ferrari, F.; Striani, R.; Fico, D.; Alam, M.M.; Greco, A.; Esposito Corcione, C. An Overview on Wood Waste Valorization as Biopolymers and Biocomposites: Definition, Classification, Production, Properties and Applications. Polymers 2022, 14, 5519. [Google Scholar] [CrossRef] [PubMed]
- Fico, D.; Rizzo, D.; De Carolis, V.; Montagna, F.; Palumbo, E.; Corcione, C.E. Development and characterization of sustainable PLA/Olive wood waste composites for rehabilitation applications using Fused Filament Fabrication (FFF). J. Build. Eng. 2022, 56, 104673. [Google Scholar] [CrossRef]
- Fico, D.; Rizzo, D.; De Carolis, V.; Montagna, F.; Esposito Corcione, C. Sustainable Polymer Composites Manufacturing through 3D Printing Technologies by Using Recycled Polymer and Filler. Polymers 2022, 14, 3756. [Google Scholar] [CrossRef]
- Fico, D.; Rizzo, D.; Montagna, F.; Esposito Corcione, C. Fused Filament Fabrication and Computer Numerical Control Milling in Cultural Heritage Conservation. Materials 2023, 16, 3038. [Google Scholar] [CrossRef]
- Rizzo, D.; Montagna, F.; Palumbo, E.; Fico, D.; De Carolis, V.; Casciaro, R.; Esposito Corcione, C. From apulian waste to original design objects: Fused filament fabrication (FFF) as a sustainable solution. In Proceedings of International Conference Florence Heri-Tech: The Future of Heritage Science and Technologies; Springer: Cham, Switzerland, 2022; pp. 127–139. [Google Scholar]
- Rizzo, D.; Fico, D.; Montagna, F.; Casciaro, R.; Esposito Corcione, C. From Virtual Reconstruction to Additive Manufacturing: Application of Advanced Technologies for the Integration of a 17th-Century Wooden Ciborium. Materials 2023, 16, 1424. [Google Scholar] [CrossRef] [PubMed]
- Toro, P.; Quijada, R.; Yazdani-Pedram, M.; Arias, J.L. Eggshell, a new bio-filler for polypropylene composites. Mater. Lett. 2007, 61, 4347–4350. [Google Scholar] [CrossRef]
- Li, H.-Y.; Tan, Y.-Q.; Zhang, L.; Zhang, Y.-X.; Song, Y.-H.; Ye, Y.; Xia, M.-S. Bio-filler from waste shellfish shell: Preparation, characterization, and its effect on the mechanical properties on polypropylene composites. J. Hazard. Mater. 2012, 217, 256–262. [Google Scholar] [CrossRef]
- Bashir, A.S.; Manusamy, Y. Recent developments in biocomposites reinforced with natural biofillers from food waste. Polym. Plast. Technol. Eng. 2015, 54, 87–99. [Google Scholar] [CrossRef]
- Manshor, M.; Anuar, H.; Aimi, M.N.; Fitrie, M.A.; Nazri, W.W.; Sapuan, S.; El-Shekeil, Y.; Wahit, M. Mechanical, thermal and morphological properties of durian skin fibre reinforced PLA biocomposites. Mater. Des. 2014, 59, 279–286. [Google Scholar] [CrossRef]
- Singh, T.; Pattnaik, P.; Aherwar, A.; Ranakoti, L.; Dogossy, G.; Lendvai, L. Optimal Design of Wood/Rice Husk-waste-Filled PLA Biocomposites Using Integrated CRITIC–MABAC-Based Decision-Making Algorithm. Polymers 2022, 14, 2603. [Google Scholar] [CrossRef]
- Lima, E.M.B.; Middea, A.; Neumann, R.; Thiré, R.M.d.S.M.; Pereira, J.F.; de Freitas, S.C.; Penteado, M.S.; Lima, A.M.; Minguita, A.P.d.S.; Mattos, M.d.C. Biocomposites of PLA and mango seed waste: Potential material for food packaging and a technological alternative to reduce environmental impact. Starch-Stärke 2021, 73, 2000118. [Google Scholar] [CrossRef]
- Hong, S.-H.; Park, J.H.; Kim, O.Y.; Hwang, S.-H. Preparation of chemically modified lignin-reinforced PLA biocomposites and their 3D printing performance. Polymers 2021, 13, 667. [Google Scholar] [CrossRef]
- Flores-Hernandez, C.; Velasco-Santos, C.; Hernandez-Zea, A.; Gomez-Guzman, O.; Yañez-Limon, J.; Rivera-Armenta, J.; Martinez-Hernandez, A. Low concentrations for significant improvements in thermal and thermomechanical properties of poly (lactic acid)–keratin biocomposites obtained by extrusion and 3D printing. J. Nat. Fibers 2022, 19, 1715–1728. [Google Scholar] [CrossRef]
- Le Duigou, A.; Barbé, A.; Guillou, E.; Castro, M. 3D printing of continuous flax fibre reinforced biocomposites for structural applications. Mater. Des. 2019, 180, 107884. [Google Scholar] [CrossRef]
- Datasheet. Ingeo Biopolymer 3D870 Technical Data Sheet. Available online: www.natureworksllc.com (accessed on 15 February 2023).
- ASTM D792-20; Standard Test Methods for Density and Specific Gravity (Relative Density) of Plastics by Displacement. ASTM International: West Conshohocken, PA, USA, 2020.
- ASTM D1238-10; Standard Test Method for Melt Flow Rates of Thermoplastics by Extrusion Plastometer; D1238 Standard Test Method for Melt Flow Rates of Thermoplastics by Extrusion Plastometer. ASTM International: West Conshohocken, PA, USA, 2010.
- ASTM D3418-21; D3418 Standard Test Method for Transition Temperatures and Enthalpies of Fusion and Crystallization of Polymers by Differential Scanning Calorimetry. ASTM International: West Conshohocken, PA, USA, 2021.
- ASTM E2092-18a; E2092 Standard Test Method for Distortion Temperature in Three-Point Bending by Thermomechanical Analysis. ASTM International: West Conshohocken, PA, USA, 2018.
- Datasheet. Available online: https://www.scharlab.com (accessed on 15 February 2023).
- Datasheet. Plastic Additive 05 EP Reference Standard CAS 8016-11-3 Sigma Aldrich. Available online: www.sigmaaldrich.com (accessed on 17 February 2023).
- Datasheet. Plastic Additive 15 USP Reference Standard Sigma-Aldrich. Available online: www.sigmaaldrich.com (accessed on 17 February 2023).
- Specification of Rotor Mill Retsch ZM300. Laboratory Ultra Centrifugal Mill ZM 300—RETSCH. Available online: www.retsch.com (accessed on 5 May 2023).
- Specification of FT-IR 6300. FTIR_6000_Spec_Sheet.pdf. Available online: www.jascoinc.com (accessed on 5 May 2023).
- Specification of XRD Instrument. SmartLab|Rigaku Global Website. Available online: www.rigaku.com (accessed on 5 May 2023).
- Specification of TGA Instrument. TGA 550—TA Instruments. Available online: www.tainstrumens.com (accessed on 5 May 2023).
- Specification of FD720 Moisture Analyzer. FD-720 Moisture Analyzer—Balanzas Cobos. Available online: www.balanzascobos.com (accessed on 7 May 2023).
- Specification of Dryer Arid X10X. ARIDX10B MAN. Available online: www.dri-air.com (accessed on 15 May 2023).
- Specification of Dryer UF55 Memmert. Universal Oven UF55—Memmert GmbH + Co. KG. Available online: www.memmert.com (accessed on 5 May 2023).
- Specification of Extruder Collin Teach Line ZR25. Teach Line Compounder—COLLIN Lab & Pilot Solutions. Available online: www.collin-solutions.com (accessed on 7 May 2023).
- Specification of Extruder Next 1 Advance from 3D evo. Meet Our Filament Maker—Desktop Filament Makers|3devo. Available online: www.3devo.com (accessed on 10 May 2023).
- Burgos, N.; Martino, V.P.; Jiménez, A. Characterization and ageing study of poly (lactic acid) films plasticized with oligomeric lactic acid. Polym. Degrad. Stab. 2013, 98, 651–658. [Google Scholar] [CrossRef]
- Orue, A.; Eceiza, A.; Arbelaiz, A. Preparation and characterization of poly (lactic acid) plasticized with vegetable oils and reinforced with sisal fibers. Ind. Crops Prod. 2018, 112, 170–180. [Google Scholar] [CrossRef]
- Balart, J.; Fombuena, V.; Fenollar, O.; Boronat, T.; Sánchez-Nacher, L. Processing and characterization of high environmental efficiency composites based on PLA and hazelnut shell flour (HSF) with biobased plasticizers derived from epoxidized linseed oil (ELO). Compos. Part B Eng. 2016, 86, 168–177. [Google Scholar] [CrossRef]
- Specification of Tumaker NX Pro Pellets. 3D Printer Tumaker NX Pro Pellets—Printer Pellets|IT3D Group. Available online: www.tumaker.com (accessed on 17 February 2023).
- Specification of BQ Witbox 2: BQ Educación. Available online: www.stampa3dstore.com (accessed on 17 February 2023).
- Ćwikła, G.; Grabowik, C.; Kalinowski, K.; Paprocka, I.; Ociepka, P. The influence of printing parameters on selected mechanical properties of FDM/FFF 3D-printed parts. In IOP Conference Series: Materials Science and Engineering; IOP Publishing: Bristol, UK, 2017; p. 012033. [Google Scholar]
- Specification of DSC Q200. Meet our Filament Maker—Desktop Filament Makers|3devo. Available online: www.tainstrumens.com (accessed on 7 May 2023).
- UNI EN ISO 11357-1: 2023; Plastics—Differential Scanning Calorimetry (DSC)—Part 1: General Principles. ISO: Geneva, Switzerland, 2023.
- Materie Plastiche—Termogravimetria (TG) dei Polimeri—Parte 1: Principi Generali. UNI EN ISO 11358-1: 2022; ISO: Geneva, Switzerland, 2022.
- UNI EN ISO 1133: 2022; Materie Plastiche—Determinazione Dell’indice di Fluidità in Massa (MFR) e Dell’indice di Fluidità in Volume (MVR) dei Materiali Termoplastici—Parte 1: Metodo Normalizzato. ISO: Geneva, Switzerland, 2022.
- Specification of Twelvindex Atsfaar. Laboratori Chiavi in Mano Milano Sesto San Giovanni—Fornitura Installazione Arredi Tecnici Strumentazione Analisi. Available online: www.atsfaar.it (accessed on 7 May 2023).
- Specification of Dynamometer Instron 6025. Universal Testing Systems Up to 300 kN|Instron. Available online: www.instron.com (accessed on 7 May 2023).
- UNI EN ISO 527-2:2012; Materie Plastiche—Determinazione Delle Proprietà a Trazione—Parte 2: Condizioni di Prova per Materie Plastiche per Stampaggio ed Estrusione. ISO: Geneva, Switzerland, 2012.
- UNI EN ISO 178:2019; Materie Plastiche—Determinazione Delle Proprietà di Flessione. ISO: Geneva, Switzerland, 2019.
- Specification of Ceast Resil Impactor 6967. Impact Drop Towers and Pendulums|Instron. Available online: www.instron.com (accessed on 15 May 2023).
- UNI EN ISO 179-1:2023; Materie Plastiche—Determinazione Delle Caratteristiche All’urto Charpy—Parte 1: Prova d’urto non Strumentato. ISO: Geneva, Switzerland, 2023.
- Lin, Y.; Liao, Y.; Yu, Z.; Fang, S.; Ma, X. A study on co-pyrolysis of bagasse and sewage sludge using TG-FTIR and Py-GC/MS. Energy Convers. Manag. 2017, 151, 190–198. [Google Scholar] [CrossRef]
- Olsson, A.-M.; Salmén, L. The association of water to cellulose and hemicellulose in paper examined by FTIR spectroscopy. Carbohydr. Res. 2004, 339, 813–818. [Google Scholar] [CrossRef] [PubMed]
- Oh, S.Y.; Yoo, D.I.; Shin, Y.; Seo, G. FTIR analysis of cellulose treated with sodium hydroxide and carbon dioxide. Carbohydr. Res. 2005, 340, 417–428. [Google Scholar] [CrossRef]
- Chen, W.-H.; Wang, C.-W.; Ong, H.C.; Show, P.L.; Hsieh, T.-H. Torrefaction, pyrolysis and two-stage thermodegradation of hemicellulose, cellulose and lignin. Fuel 2019, 258, 116168. [Google Scholar] [CrossRef]
- Ju, X.; Bowden, M.; Brown, E.E.; Zhang, X. An improved X-ray diffraction method for cellulose crystallinity measurement. Carbohydr. Polym. 2015, 123, 476–481. [Google Scholar] [CrossRef] [PubMed]
- Ručigaj, A.; Alič, B.; Krajnc, M.; Šebenik, U. Investigation of cure kinetics in a system with reactant evaporation: Epoxidized soybean oil and maleic anhydride case study. Eur. Polym. J. 2014, 52, 105–116. [Google Scholar] [CrossRef]
Disclaimer/Publisher’s Note: The statements, opinions and data contained in all publications are solely those of the individual author(s) and contributor(s) and not of MDPI and/or the editor(s). MDPI and/or the editor(s) disclaim responsibility for any injury to people or property resulting from any ideas, methods, instructions or products referred to in the content. |
© 2023 by the authors. Licensee MDPI, Basel, Switzerland. This article is an open access article distributed under the terms and conditions of the Creative Commons Attribution (CC BY) license (https://creativecommons.org/licenses/by/4.0/).