
Use of Pyrolysis–Gas Chromatography/Mass Spectrometry as a Tool to Study the Natural Variation in Biopolymers in Different Tissues of Economically Important European Softwood Species


Abstract
:1. Introduction
2. Materials and Methods
2.1. Preparation of Wood Samples
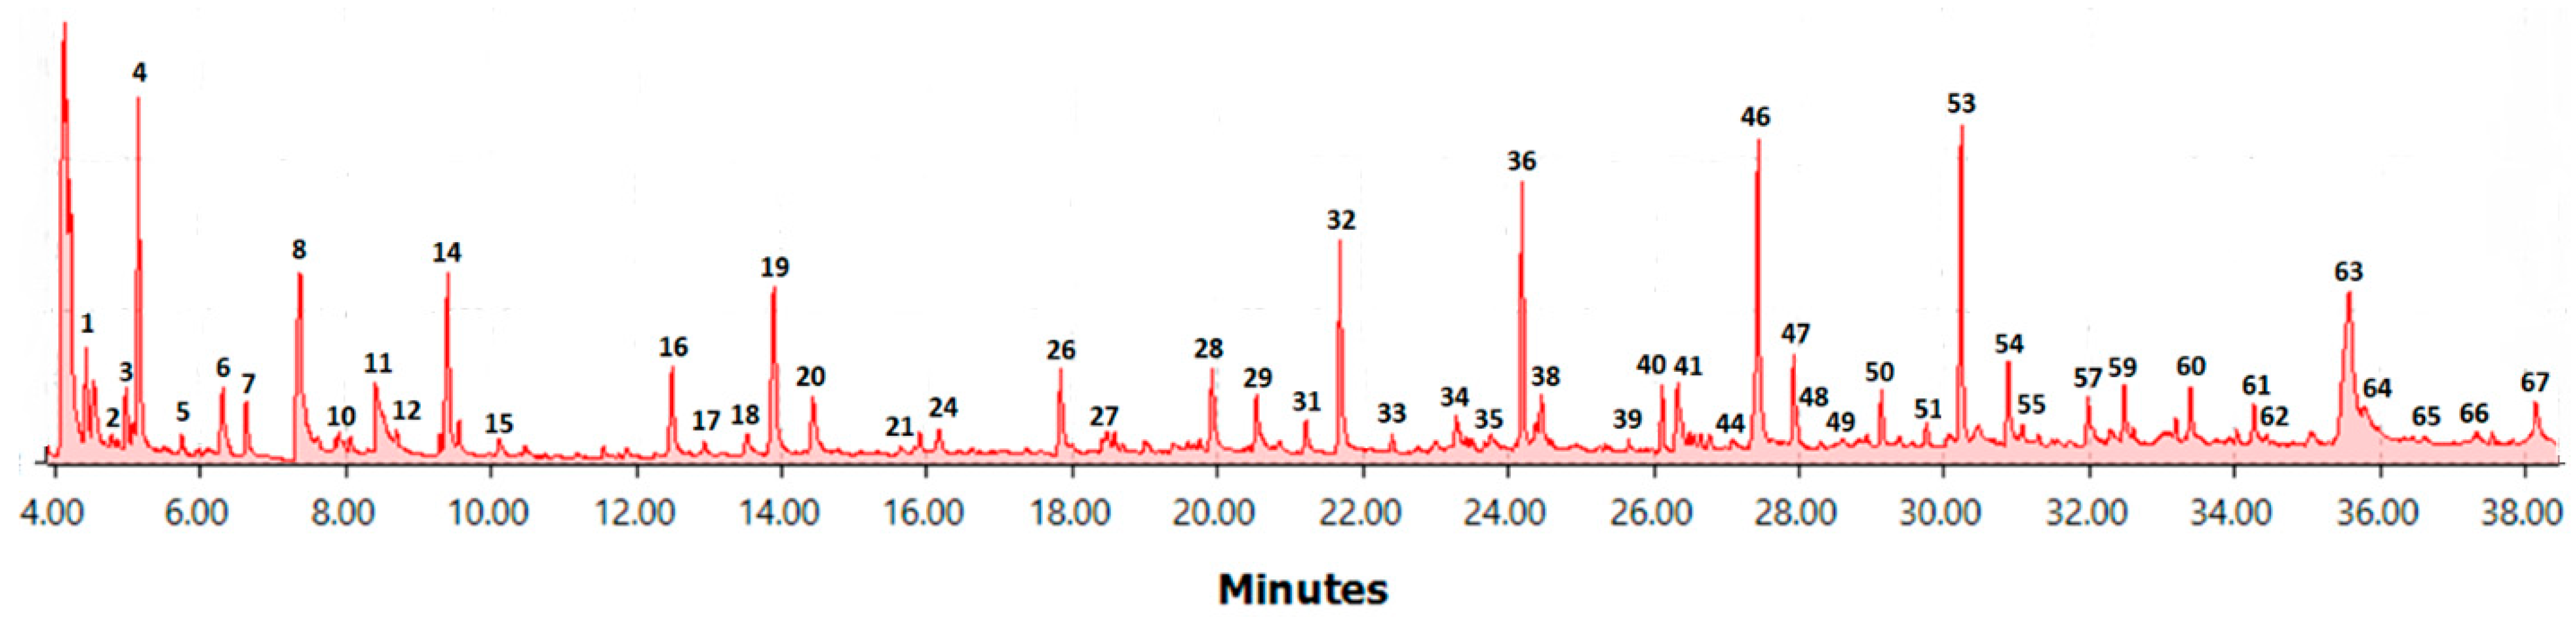
2.2. Flash Pyrolysis
2.3. Wet Chemical Analysis
2.3.1. Lignin Content
2.3.2. Holocellulose Content
2.3.3. α-Cellulose Content
2.4. Peak Integration and Statistical Analysis
3. Results
3.1. Py-Lignin
3.1.1. Stemwood and Knotwood
Wet Chemical Analysis
Statistical Analysis
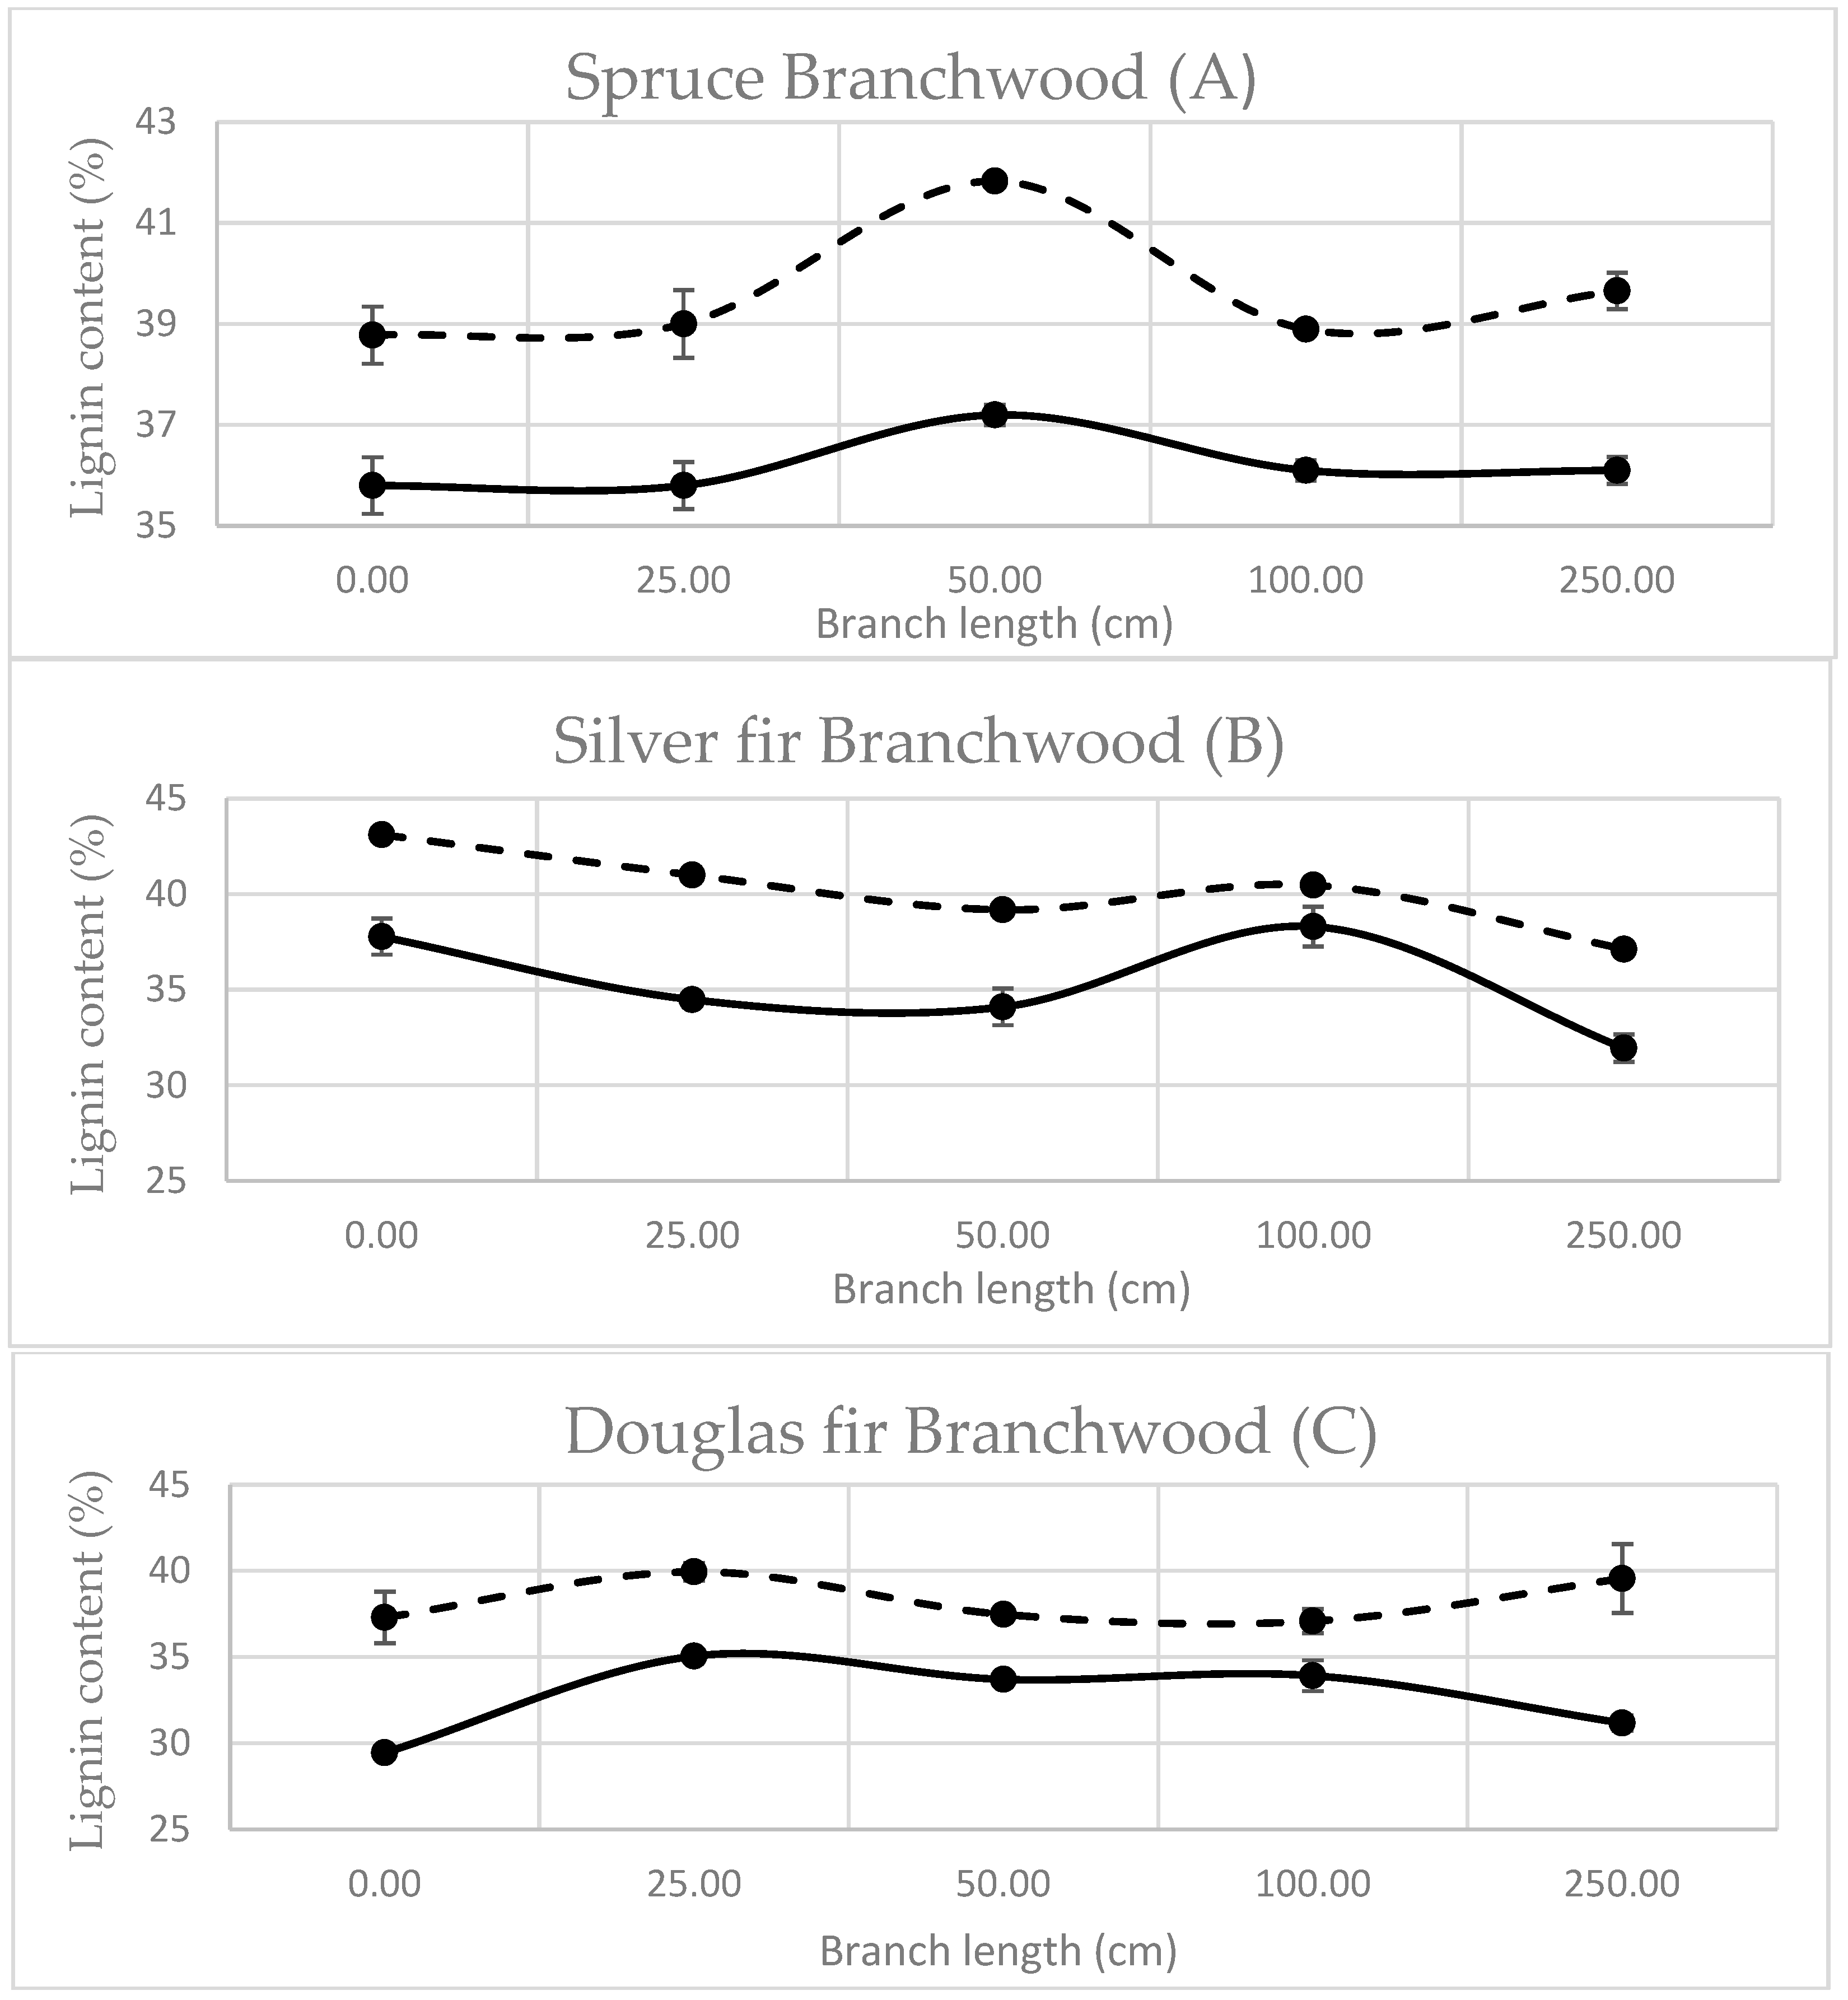
3.1.2. Branchwood
3.2. Principal Component Analysis
3.2.1. Differences between Species
3.2.2. Inter-Tissue Differences
3.2.3. Height Differences
4. Conclusions
Author Contributions
Funding
Data Availability Statement
Conflicts of Interest
References
- Cao, L.; Yu, I.K.M.; Liu, Y.; Ruan, X.; Tsang, D.C.W.; Hunt, A.J. Lignin Valorization for the Production of Renewable Chemicals: State-of-the-Art Review and Future Prospects. Bioresour. Technol. 2018, 269, 465–475. [Google Scholar] [CrossRef] [PubMed]
- Lupoi, J.S.; Singh, S.; Parthasarathi, R.; Simmons, B.A.; Henry, R.J. Recent Innovations in Analytical Methods for the Qualitative and Quantitative Assessment of Lignin. Renew. Sustain. Energy Rev. 2015, 49, 871–906. [Google Scholar] [CrossRef]
- Alves, A.; Schwanninger, M.; Pereira, H.; Rodrigues, J. Analytical Pyrolysis as a Direct Method to Determine the Lignin Content in Wood: Part 1: Comparison of Pyrolysis Lignin with Klason Lignin. J. Anal. Appl. Pyrolysis 2006, 76, 209–213. [Google Scholar] [CrossRef]
- Alves, A.; Rodrigues, J.; Wimmer, R.; Schwanninger, M. Analytical Pyrolysis as a Direct Method to Determine the Lignin Content in Wood. Part 2: Evaluation of the Common Model and the Influence of Compression Wood. J. Anal. Appl. Pyrolysis 2008, 81, 167–172. [Google Scholar] [CrossRef]
- Alves, A.; Gierlinger, N.; Schwanninger, M.; Rodrigues, J. Analytical Pyrolysis as a Direct Method to Determine the Lignin Content in Wood. Part 3. Evaluation of Species-Specific and Tissue-Specific Differences in Softwood Lignin Composition Using Principal Component Analysis. J. Anal. Appl. Pyrolysis 2009, 85, 30–37. [Google Scholar] [CrossRef]
- Alves, A.; Cisneros, E.F.; Balmelli, G.; Poltri, S.N.M.; Rodrigues, J. Assessment of Eucalypts Wood Lignin Content by Analytical Pyrolysis, Comparison with Klason and Total Lignin Contents. J. Wood Chem. Technol. 2021, 41, 229–235. [Google Scholar] [CrossRef]
- Lourenço, A.; Gominho, J.; Marques, A.V.; Pereira, H. Comparison of Py-GC/FID and Wet Chemistry Analysis for Lignin Determination in Wood and Pulps from Eucalyptus Globulus. BioResources 2013, 8, 2967–2980. [Google Scholar] [CrossRef]
- Choi, J.W.; Faix, O.; Meier, D. Characterization of Residual Lignins from Chemical Pulps of Spruce (Picea abies L.) and Beech (Fagus sylvatica L.) by Analytical Pyrolysis-Gas Chromatography/Mass Spectrometry. Holzforschung 2001, 55, 185–192. [Google Scholar] [CrossRef]
- Heigenmoser, A.; Liebner, F.; Windeisen, E.; Richter, K. Investigation of Thermally Treated Beech (Fagus sylvatica) and Spruce (Picea abies) by Means of Multifunctional Analytical Pyrolysis-GC/MS. J. Anal. Appl. Pyrolysis 2013, 100, 117–126. [Google Scholar] [CrossRef]
- Barta-Rajnai, E.; Sebestyén, Z.; Jakab, E.; Patus, E.; Bozi, J.; Wang, L.; Skreiberg, Ø.; Grønli, M.; Khalil, R.; Czégény, Z. Pyrolysis of Untreated and Various Torrefied Stem Wood, Stump, and Bark of Norway Spruce. Energy Fuels 2019, 33, 3210–3220. [Google Scholar] [CrossRef]
- Łucejko, J.J.; Modugno, F.; Colombini, M.P.; Zborowska, M. Archaeological Wood from the Wieliczka Salt Mine Museum, Poland—Chemical Analysis of Wood Degradation by Py(HMDS)-GC/MS. J. Cult. Herit. 2012, 13, S50–S56. [Google Scholar] [CrossRef]
- Tamburini, D.; Lucejko, J.J.; Modugno, F.; Colombini, M.P. Characterisation of Archaeological Waterlogged Wood from Herculaneum by Pyrolysis and Mass Spectrometry. Int. Biodeterior. Biodegrad. 2014, 86, 142–149. [Google Scholar] [CrossRef]
- Tamburini, D.; Łucejko, J.J.; Ribechini, E.; Colombini, M.P. New Markers of Natural and Anthropogenic Chemical Alteration of Archaeological Lignin Revealed by in Situ Pyrolysis/Silylation-Gas Chromatography-Mass Spectrometry. J. Anal. Appl. Pyrolysis 2016, 118, 249–258. [Google Scholar] [CrossRef]
- Jia, L.; Buendia-Kandia, F.; Dumarcay, S.; Poirot, H.; Mauviel, G.; Gérardin, P.; Dufour, A. Fast Pyrolysis of Heartwood, Sapwood, and Bark: A Complementary Application of Online Photoionization Mass Spectrometry and Conventional Pyrolysis Gas Chromatography/Mass Spectrometry. Energy Fuels 2017, 31, 4078–4089. [Google Scholar] [CrossRef]
- Van Erven, G.; De Visser, R.; De Waard, P.; Van Berkel, W.J.H.; Kabel, M.A. Uniformly 13C Labeled Lignin Internal Standards for Quantitative Pyrolysis-GC-MS Analysis of Grass and Wood. ACS Sustain. Chem. Eng. 2019, 7, 20070–20076. [Google Scholar] [CrossRef]
- Brennan, M.; Hentges, D.; Cosgun, S.; Dumarcay, S.; Colin, F.; Gérardin, C.; Gérardin, P. Intraspecific Variability of Quantity and Chemical Composition of Ethanolic Knotwood Extracts along the Stems of Three Industrially Important Softwood Species: Abies Alba, Picea abies and Pseudotsuga Menziesii. Holzforschung 2021, 75, 168–179. [Google Scholar] [CrossRef]
- Willför, B.S.; Hemming, J.; Reunanen, M.; Eckerman, C.; Holmbom, B. Lignans and Lipophilic Extractives in Norway Spruce Knots and Stemwood. Holzforchung 2003, 57, 27–36. [Google Scholar] [CrossRef]
- Faix, O.; Fortmann, I.; Bremer, J.; Meier, D. Thermal Degradation Products of Wood—A Collection of Electron-Impact (EI) Mass Spectra of Polysaccharide Derived Products. Holz Als Roh-Und Werkst. 1991, 49, 299–304. [Google Scholar] [CrossRef]
- Faix, O.; Meier, D.; Fortmann, I. Thermal Degradation Products of Wood—Gas Chromatographic Separation and Mass Spectrometric Characterization of Monomeric Lignin Derived Products. Holz Als Roh-Und Werkst. 1990, 48, 281–285. [Google Scholar] [CrossRef]
- Arias, M.E.; Rodriáguez, J.; Pérez, M.I.; Hernández, M.; Polvillo, O.; González-Pérez, J.A.; González-Vil, F.J. Analysis of Chemical Changes in Picea abies Wood Decayed by Different Streptomyces Strains Showing Evidence for Biopulping Procedures. Wood Sci. Technol. 2010, 44, 179–188. [Google Scholar] [CrossRef]
- Brosse, N.; El Hage, R.; Chaouch, M.; Pétrissans, M.; Dumarçay, S.; Gérardin, P. Investigation of the Chemical Modifications of Beech Wood Lignin during Heat Treatment. Polym. Degrad. Stab. 2010, 95, 1721–1726. [Google Scholar] [CrossRef]
- Rowell, R. Handbook of Wood Chemistry and Wood Composites, 2nd ed.; CRC Press: Boca Raton, FL, USA, 2012; ISBN 9781439853818. [Google Scholar]
- Brennan, M.; McLean, J.P.; Klingberg, A.; Altaner, C.; Harris, P.J. Pyrolysis Gas-Chromatography Mass-Spectrometry (Py-GC/MS) to Identify Compression Wood in Pinus Radiata Saplings. Holzforschung 2014, 68, 505–517. [Google Scholar] [CrossRef]
- Patwardhan, P.R.; Satrio, J.A.; Brown, R.C.; Shanks, B.H. Influence of Inorganic Salts on the Primary Pyrolysis Products of Cellulose. Bioresour. Technol. 2010, 101, 4646–4655. [Google Scholar] [CrossRef] [PubMed]
- Nassar, M.M.; Bilgesu, A.; Mackay, G.D.M. Effect of Inorganic Salst on Product Composition during Pyrolysis of Black Spruce. Soc. Wood Sci. Technol. 1986, 18, 3–10. [Google Scholar]
- Fetisova, O.Y.; Mikova, N.M.; Chudina, A.I.; Kazachenko, A.S. Kinetic Study of Pyrolysis of Coniferous Bark Wood and Modified Fir Bark Wood. Fire 2023, 6, 59. [Google Scholar] [CrossRef]
- Kramb, J.; Demartini, N.; Perander, M.; Moilanen, A.; Konttinen, J. Modeling of the Catalytic Effects of Potassium and Calcium on Spruce Wood Gasi Fi Cation in CO2. Fuel Process. Technol. 2016, 148, 50–59. [Google Scholar] [CrossRef]
- Zhang, J.; Choi, Y.S.; Yoo, C.G.; Kim, T.H.; Brown, R.C.; Shanks, B.H. Cellulose-Hemicellulose and Cellulose-Lignin Interactions during Fast Pyrolysis. ACS Sustain. Chem. Eng. 2015, 3, 293–301. [Google Scholar] [CrossRef]
- Yu, J.; Paterson, N.; Blamey, J.; Millan, M. Cellulose, Xylan and Lignin Interactions during Pyrolysis of Lignocellulosic Biomass. Fuel 2017, 191, 140–149. [Google Scholar] [CrossRef]
- Lawoko, M.; Henriksson, G.; Gellerstedt, G. Structural Differences between the Lignin-Carbohydrate Complexes Present in Wood and in Chemical Pulps. Biomacromolecules 2005, 6, 3467–3473. [Google Scholar] [CrossRef]
- Tarasov, D.; Leitch, M.; Fatehi, P. Biotechnology for Biofuels Lignin—Carbohydrate Complexes: Properties, Applications, Analyses, and Methods of Extraction: A Review. Biotechnol. Biofuels 2018, 11, 269. [Google Scholar] [CrossRef]
- Zhou, X.; Li, W.; Mabon, R.; Broadbelt, L.J. A Critical Review on Hemicellulose Pyrolysis. Energy Technol. 2017, 5, 52–79. [Google Scholar] [CrossRef]
- Guerra, A.; Filpponen, I.; Lucia, L.A.; Argyropoulos, D.S. Comparative Evaluation of Three Lignin Isolation Protocols for Various Wood Species. J. Agric. Food Chem. 2006, 54, 9696–9705. [Google Scholar] [CrossRef] [PubMed]
- Martinez, A.T.; Camaero, S.; Gutierrez, A.; Bocchini, P.; Galletti, G.C. Studies on Wheat Lignin Degradation by Pleurotus Species Using Analytical Pyrolysis. J. Anal. Appl. Pyrolysis 2001, 58–59, 401–411. [Google Scholar] [CrossRef]
- Iveta, Č.; Michal, B.; Kučerová, V.; Jurczyková, T. Chemical and Morphological Composition of Norway Spruce Wood (Picea abies, L.) in the Dependence of Its Storage. Polymers 2021, 13, 1619. [Google Scholar]
- Lourenço, A.; Pereira, H. Compositional Variability of Lignin in Biomass. Intech 2016, i, 13. [Google Scholar] [CrossRef]
- Kučerová, V.; Lagaňa, R.; Hýrošová, T. Changes in Chemical and Optical Properties of Silver Fir (Abies alba L.) Wood Due to Thermal Treatment. J. Wood Sci. 2019, 65, 21. [Google Scholar] [CrossRef]
- Lombardi, F.; Cherubini, P.; Tognetti, R.; Cocozza, C.; Lasserre, B.; Marchetti, M. Investigating Biochemical Processes to Assess Deadwood Decay of Beech and Silver Fir in Mediterranean Mountain Forests. Ann. For. Sci. 2013, 70, 101–111. [Google Scholar] [CrossRef]
- Topaloglu, E.; Erisir, E. Longitudinal Variation in Selected Wood Properties of Oriental Beech and Caucasian Fir. Maderas Cienc. Tecnol. 2018, 20, 403–416. [Google Scholar] [CrossRef]
- Lourenço, A.; Gominho, J.; Pereira, H. Chemical Characterization of Lignocellulosic Materials by Analytical Pyrolysis. In Analytical Pyrolysis; IntechOpen: London, UK, 2018; p. 22. [Google Scholar]
- Krajnc, L.; Farrelly, N.; Harte, A.M. The Effect of Thinning on Mechanical Properties of Douglas Fir, Norway Spruce, and Sitka Spruce. Ann. For. Sci. 2019, 76, 3. [Google Scholar] [CrossRef]
- Jyske, T.; Kaakinen, S.; Nilsson, U.; Saranpää, P.; Vapaavuori, E. Effects of Timing and Intensity of Thinning on Wood Structure and Chemistry in Norway Spruce. Holzforschung 2010, 64, 81–91. [Google Scholar] [CrossRef]
- Lang, R.; Kaliske, M. Description of Inhomogeneities in Wooden Structures: Modelling of Branches. Wood Sci. Technol. 2013, 47, 1051–1070. [Google Scholar] [CrossRef]
- Barnett, J.; Gril, J.; Saranpää, P. The Biology of Reaction Wood Introduction; hal-014520; Springer: Berlin/Heidelberg, Germany, 2017. [Google Scholar]
- Maguire, D.; Kershaw, J.; Hann, D.W. Predicting the Effects of Silvicultural Regime on Branch Size and Crown Wood Core in Douglas-Fir. For. Sci. 1991, 37, 1409–1428. [Google Scholar]
- Katō, K.; Komorita, H. Pyrolysis of Cellulose. Agric. Biol. Chem. 1968, 32, 21–26. [Google Scholar] [CrossRef]
- Mukarakate, C.; Mital, A.; Cieselski, P.; Budhi, S.; Thompson, L.; Iisa, K.; Nimlos, M.; Donohoe, B. Influence of Crystal Allomorph and Crystallinity on the Products and Behavior of Cellulose during Fast Pyrolysis. ACS Sustain. Chem. Eng. 2016, 4, 4662–4674. [Google Scholar] [CrossRef]
- Hirayama, H.; Akiyama, T.; Kimura, S.; Nawawi, D.S.; Syafii, W.; Yokoyama, T.; Matsumoto, Y. Influence of the p-Hydroxyphenyl/Guaiacyl Ratio on the Biphenyl and β-5 Contents in Compression Wood Lignins. Holzforschung 2019, 73, 923–935. [Google Scholar] [CrossRef]
- Timell, T.E. Compression Wood in Gymnosperms; Springer: Berlin/Heidelberg, Germany, 1986. [Google Scholar]
- Wang, X.Q.; Tank, D.C.; Sang, T. Phylogeny and Divergence Times in Pinaceae: Evidence from Three Genomes. Mol. Biol. Evol. 2000, 17, 773–781. [Google Scholar] [CrossRef]
- Hintsteiner, W.J.; van Loo, M.; Neophytou, C.; Schueler, S.; Hasenauer, H. The Geographic Origin of Old Douglas-Fir Stands Growing in Central Europe. Eur. J. For. Res. 2018, 137, 447–461. [Google Scholar] [CrossRef]
- Hernández, V. Radiata Pine PH and Buffering Capacity: Effect of Age and Location in the Stem. Maderas Cienc. Tecnol. 2013, 15, 73–78. [Google Scholar] [CrossRef]


| Species | Management | Tree | MILAB | H1BVAB | HBHAB | DEC20AB | DEC10AB | Height | Age | DBH |
|---|---|---|---|---|---|---|---|---|---|---|
| Abies alba | Un-thinned | 1 | 480 | 1130 | 1365 | 1685 | 1705 | 2240 | 50 | 28 |
| Un-thinned | 2 | 330 | 1136 | 1350 | - | 617 | 1575 | 44 | 13.9 | |
| Thinned | 3 | 697 | 495 | 795 | 1350 | 1745 | 2140 | 43 | 41.2 | |
| Thinned | 4 | 685 | 703 | 890 | 1318 | 1720 | 2120 | 44 | 38.9 | |
| Picea abies | Un-thinned | 1 | 1040 | 1540 | 1965 | 2036 | 2567 | 3065 | 53 | 40.9 |
| Un-thinned | 2 | 860 | 1470 | 868 | 376 | 1595 | 2203 | 53 | 22.3 | |
| Thinned | 3 | 836 | 915 | 1295 | 1710 | 2250 | 2693 | 53 | 39.3 | |
| Thinned | 4 | - | 932 | 1414 | 1857 | 2396 | 2844 | 53 | 40.9 | |
| Pseudotsuga menziesii | Un-thinned | 1 | 1103 | 1882 | 2059 | 2211 | 2716 | 3175 | 48 | 47.7 |
| Un-thinned | 2 | - | 1767 | 1918 | 1512 | 2452 | 3120 | 48 | 31.4 | |
| Thinned | 3 | - | 1112 | 1421 | 2142 | 2590 | 3072 | 48 | 31.4 | |
| Thinned | 4 | 925 | 810 | 1065 | 1880 | 2200 | 2655 | 48 | 52.5 |
| No | RT | Compound | Main Fragments (m/z) | Label | Area Percent Range (%) |
|---|---|---|---|---|---|
| 1 | 4.42 | Acetaldehyde | 29, 43, 44 | C1 | 1.34–3.46 |
| 2 | 4.77 | Furan | 39, 68 | F1 | 0.16–0.64 |
| 3 | 4.97 | 2-Propenal | 27, 55, 56 | C2 | 1.06–3.13 |
| 4 | 5.14 | Propanal-2-one | 43, 72 | C3 | 4.36–8.92 |
| 5 | 5.73 | 2-Methylfurane | 82, 81, 53 | F2 | 0.29–1.17 |
| 6 | 6.25 | 2-Butenone | 55, 70 | C4 | 1.06–2.33 |
| 6.29 | 2,3-Butanedione | 43, 86 | |||
| 6.34 | 1,3-Dimethoxypropane | 45, 72 | |||
| 7 | 6.61 | 3-Pentanone | 29, 57 | C5 | 0.53–1.55 |
| 8 | 7.35 | Hydroxyacetaldehyde | 31, 60 | C6 | 2.96–10.37 |
| 9 | 7.60 | 2,5-Dimethylfurane | 95, 96 | F3 | 0.08–0.27 |
| 10 | 8.04 | 2-Butanol | 43, 45 | C7 | 0.02–0.52 |
| 11 | 8.34 | Acetic Acid | 43, 45, 60 | Acetic acid | 1.16–5.52 |
| 12 | 8.67 | 2,3-Pentanedione | 43, 57, 100 | C8 | 0.11–0.54 |
| 13 | 9.26 | Ethylpropylether | 29, 58, 86 | C9 | 0.16–0.60 |
| 14 | 9.35 | 1-Hydroxy-2-propanone | 43, 74 | C10 | 2.11–6.33 |
| 15 | 10.08 | Methyl formate | 31, 60 | C11 | 0.27–1.56 |
| 16 | 12.46 | 1,2-Ethanediolmonoacetate | 43, 73, 74 | C12 | 0.61–4.78 |
| 17 | 12.90 | Unknown furan compound | 55, 84 | F4 | 0.09–0.61 |
| 18 | 13.50 | 2-(5H)furanone | 54, 84 | F5 | 0.33–1.07 |
| 19 | 13.86 | Unknown compound | 43 | C13 | 1.66–6.76 |
| 20 | 14.39 | Furfural | 95, 96 | F6 | 0.93–3.38 |
| 21 | 15.64 | Unknown lactone derivative | 55, 98, 105 | C14 | 0.09–0.27 |
| 22 | 15.79 | Furfuryl alcohol | 69, 81, 98 | F7 | 0.06–0.37 |
| 23 | 15.87 | 1-(Acetyloxy)-2-propanone | 43, 86, 116 | C15 | 0.24–0.93 |
| 24 | 16.13 | Unknown compound | 43, 72, 96 | C16 | 0.27–0.89 |
| 25 | 16.57 | Acetylfuran | 95, 110 | F8 | 0.05–0.20 |
| 26 | 17.84 | 2-Hydroxycyclopent-2-en-1-one | 98 | C17 | 1.17–2.75 |
| 27 | 18.44 | 5-Methylfurfural | 55, 83, 112 | F9 | 0.08–0.59 |
| 28 | 19.90 | 4-Hydroxy-5,6-dihydropyran-(2H)-2-one | 58, 114 | C18 | 0.63–3.60 |
| 29 | 20.48 | 3-Methyl-1,2-cyclopentanedione | 83, 98, 112 | C19 | 0.18–1.88 |
| 30 | 20.80 | Unknown compound | 112, 128 | C20 | 0.12–0.25 |
| 31 | 21.19 | Phenol | 65, 66, 94 | H1 | 0.14–1.14 |
| 32 | 21.65 | Guaiacol | 81, 109, 124 | G1 | 1.73–5.78 |
| 33 | 22.37 | o-Cresol | 107, 108 | H2 | 0.15–0.49 |
| 34 | 23.44 | m-Cresol + p-Cresol | 107, 108 | H3 | 0.12–1.15 |
| 35 | 23.74 | Furanic compound | 85, 148 | F10 | 0.13–1.02 |
| 36 | 24.16 | Creosol | 123, 138 | G2 | 3.71–7.65 |
| 37 | 24.34 | 2,5-Dimethylphenol | 107, 122 | H4 | 0.21–1.27 |
| 38 | 24.36 | Unknown compound | 44, 57 | C21 | 0.15–2.60 |
| 39 | 25.62 | Isomer of 4-Methoxy-2,6-dimethylphenol | 109, 137, 152 | G3 | 0.12–0.39 |
| 40 | 26.08 | Ethylguaiacol | 122, 137, 152 | G4 | 0.97–1.76 |
| 41 | 26.34 | Unknown Anhydrosugar | 69 | A1 | 0.18–4.36 |
| 42 | 26.63 | Unknown Anhydrosugar | 71, 98 | A2 | 0.16–0.50 |
| 43 | 26.76 | Unknown Anhydrosugar | 71, 97 | A3 | 0.12–0.46 |
| 44 | 27.07 | Unknown Anhydrosugar | 69, 144 | A4 | 0.13–0.31 |
| 45 | 27.34 | Unknown Anhydrosugar | 57, 91, 120 | A5 | 0.14–0.96 |
| 46 | 27.39 | Vinylguaiacol | 135, 150 | G5 | 3.92–7.11 |
| 47 | 27.88 | Eugenol | 149, 164 | G6 | 1.35–2.51 |
| 48 | 27.93 | Propylguaiacol | 137, 166 | G7 | 0.14–0.94 |
| 49 | 28.42 | 5-Hydroxymethylfurfural | 69, 97, 126 | F11 | 0.07–1.37 |
| 50 | 29.09 | Cis-isoeugenol | 149, 164 | G8 | 0.90–1.67 |
| 51 | 29.70 | Allylphenol | 133, 134 | H5 | 0.09–1.03 |
| 52 | 30.02 | Unknown Anhydrosugar | 87, 144 | A6 | 0.05–2.27 |
| 53 | 30.18 | Trans-isoeugenol | 164 | G9 | 4.32–7.64 |
| 54 | 30.81 | Vanillin | 151, 152 | G10 | 1.57–3.22 |
| 55 | 31.01 | Cis-allenylguaiacol | 147, 162 | G11 | 0.13–0.50 |
| 56 | 31.23 | Trans-allenylguaiacol | 147, 162 | G12 | 0.17–0.48 |
| 57 | 31.92 | Homovanillin | 137, 166 | G13 | 0.91–2.46 |
| 58 | 32.25 | Propioguaiacone | 151, 180 | G14 | 0.15–0.74 |
| 59 | 32.41 | Acetoguaiacone | 151, 166 | G15 | 1.03–1.90 |
| 60 | 33.32 | Guaiacylacetone | 122, 137, 180 | G16 | 0.61–2.44 |
| 61 | 34.20 | 1′-Hydroxyeugenol | 137, 180 | G17 | 0.74–1.29 |
| 62 | 34.37 | Vanilloylacetyl | 123, 151, 194 | G18 | 0.08–0.30 |
| 63 | 35.74 | Levoglucosan | 60, 73 | LVG | 1.76–11.53 |
| 64 | 35.76 | Dihydroconiferyl alcohol | 137, 182 | G19 | 0.02–0.62 |
| 65 | 36.39 | Cis-coniferyl alcohol | 137, 180 | G20 | 0.01–0.30 |
| 66 | 37.32 | Unknown Anhydrosugar | 69, 73, 115 | A7 | 0.02–0.72 |
| 67 | 38.07 | Coniferaldehyde | 135, 178 | G21 | 0.07–2.24 |
| Species | Klason Lignin | Holocellulose | α-Cellulose | |||||||
|---|---|---|---|---|---|---|---|---|---|---|
| Bottom | Middle | Top | Bottom | Middle | Top | Bottom | Middle | Top | ||
| Stem- wood | Picea abies | 28.1 ± 1.2 | 26.6 ± 0.6 | 26.9 ± 0.5 | 72.7 ± 4.3 | 72.9 ± 0.8 | 75.7 ± 1.1 | 41.9 ± 4.0 | 41.6 ± 1.1 | 44.8 ± 1.3 |
| Abies alba | 29.9 ± 0.8 | 29.5 ± 1.3 | 31.0 ± 2.6 | 73.2 ± 2.1 | 74.5 ± 3.9 | 71.3 ± 3.9 | 42.2 4.6 | 43.1 ± 5.3 | 34.9 ± 5.6 | |
| Pseudotsuga menziesii | 27.6 ± 1.6 | 29.3 ± 1.2 | 29.5 ± 2.0 | 72.3 ± 1.5 | 70.5 ± 2.9 | 69.5 ± 1.2 | 41.0 ± 1.5 | 35.3 ± 5.5 | 37.9 ± 2.2 | |
| Knotwood | Picea abies | 32.0 ± 1.5 | 31.9 ± 0.9 | 30.1 ± 1.0 | 69.0 ± 6.9 | 72.7 ± 4.7 | 70.9 ± 2.5 | 34.0 ± 6.3 | 37.7 ± 2.5 | 36.8 ± 2.0 |
| Abies alba | 30.6 ± 1.2 | 30.9 ± 0.3 | 30.5 ± 0.6 | 73.7 ± 2.7 | 73.6 ± 0.8 | 72.3 ± 2.7 | 38.2 ± 1.8 | 37.5 ± 2.2 | 37.2 ± 3.3 | |
| Pseudotsuga menziesii | 30.7 ± 1.4 | 30.5 ± 2.4 | 29.9 ± 2.0 | 65.4 ± 1.6 | 65.1 ± 2.5 | 67.3 ± 2.4 | 36.1 ± 1.9 | 36.5 ± 4.0 | 38.3 ± 1.7 | |
| Tissue | Biopolymer | Species | Height | Trees | ||||
|---|---|---|---|---|---|---|---|---|
| Height Interaction | p-Value | Tree Interaction | p-Value | Tree Interaction | p-Value | |||
| Stemwood | Klason Lignin | Picea abies | Top–middle | 0.131 | 1–2 | <0.001 | 2–3 | <0.001 |
| Middle–bottom | 0.103 | 1–3 | 0.006 | 2–4 | <0.001 | |||
| Top–bottom | 0.989 | 1–4 | 0.481 | 3–4 | 0.079 | |||
| Abies alba | Top–middle | <0.001 | 1–2 | 0.649 | 2–3 | 0.028 | ||
| Middle–bottom | 0.207 | 1–3 | 0.205 | 2–4 | 0.086 | |||
| Top–bottom | 0.006 | 1–4 | 0.011 | 3–4 | <0.001 | |||
| Pseudotsuga menziesii | Top–middle | 0.059 | 1–2 | <0.001 | 2–3 | <0.001 | ||
| Middle–bottom | 0.943 | 1–3 | 0.588 | 2–4 | 0.102 | |||
| Top–bottom | 0.033 | 1–4 | <0.001 | 3–4 | <0.001 | |||
| Cellulose | Picea abies | Top–middle | 0.047 | 1–2 | NA | 2–3 | NA | |
| Middle–bottom | 0.444 | 1–3 | 0.942 | 2–4 | NA | |||
| Top–bottom | 0.314 | 1–4 | 0.622 | 3–4 | 0.439 | |||
| Abies alba | Top–middle | 0.001 | 1–2 | 0.325 | 2–3 | 0.064 | ||
| Middle–bottom | 0.881 | 1–3 | 0.733 | 2–4 | 0.005 | |||
| Top–bottom | 0.003 | 1–4 | 0.118 | 3–4 | 0.508 | |||
| Pseudotsuga menziesii | Top–middle | 0.062 | 1–2 | 0.178 | 2–3 | 0.807 | ||
| Middle–bottom | <0.001 | 1–3 | 0.041 | 2–4 | 0.694 | |||
| Top–bottom | 0.082 | 1–4 | 0.028 | 3–4 | 0.996 | |||
| Knotwood | Klason Lignin | Picea abies | Top–middle | 0.001 | 1–2 | 0.002 | 2–3 | 0.898 |
| Middle–bottom | 0.978 | 1–3 | <0.001 | 2–4 | 0.177 | |||
| Top–bottom | <0.001 | 1–4 | 0.101 | 3–4 | 0.056 | |||
| abies alba | Top–middle | 0.104 | 1–2 | 0.105 | 2–3 | 0.359 | ||
| Middle–bottom | 0.589 | 1–3 | 0.005 | 2–4 | 0.984 | |||
| Top–bottom | 0.456 | 1–4 | 0.058 | 3–4 | 0.544 | |||
| Pseudotsuga menziesii | Top–middle | 0.059 | 1–2 | <0.001 | 2–3 | <0.001 | ||
| Middle–bottom | 0.993 | 1–3 | 0.588 | 2–4 | 0.102 | |||
| Top–bottom | 0.033 | 1–4 | <0.001 | 3–4 | <0.001 | |||
| Cellulose | Picea abies | Top–middle | 0.297 | 1–2 | <0.001 | 2–3 | 0.819 | |
| Middle–bottom | <0.001 | 1–3 | <0.001 | 2–4 | 0.909 | |||
| Top–bottom | 0.003 | 1–4 | <0.001 | 3–4 | 0.996 | |||
| Abies alba | Top–middle | 0.964 | 1–2 | 0.579 | 2–3 | 0.997 | ||
| Middle–bottom | 0.277 | 1–3 | 0.684 | 2–4 | 0.469 | |||
| Top–bottom | 0.189 | 1–4 | 0.997 | 3–4 | 0.571 | |||
| Pseudotsuga menziesii | Top–middle | 0.336 | 1–2 | 0.594 | 2–3 | 0.921 | ||
| Middle–bottom | 0.969 | 1–3 | 0.277 | 2–4 | 0.299 | |||
| Top–bottom | 0.241 | 1–4 | 0.938 | 3–4 | 0.114 | |||
| Douglas fir | C1, C2, C3, C6, C8, C11, C18, F1, F2, F5, F9, F11, A1, A2, A4, A5, A6, LVG, H3, H4, H5, G2, G3, G4, G12, G13, G15, G16, G17, G18, G20 |
| Silver fir | C5, Acetic acid, C9, C12, C13, C16, C17, C19, F4, F7, F8, F10, H1, H2, G5, G6, G7, G8, G9, G10, G11, G19, G21 |
| Spruce | A3, A7, G1, G14 |
Disclaimer/Publisher’s Note: The statements, opinions and data contained in all publications are solely those of the individual author(s) and contributor(s) and not of MDPI and/or the editor(s). MDPI and/or the editor(s) disclaim responsibility for any injury to people or property resulting from any ideas, methods, instructions or products referred to in the content. |
© 2023 by the authors. Licensee MDPI, Basel, Switzerland. This article is an open access article distributed under the terms and conditions of the Creative Commons Attribution (CC BY) license (https://creativecommons.org/licenses/by/4.0/).
Share and Cite
Hentges, D.; Gérardin, P.; Vinchelin, P.; Dumarçay, S. Use of Pyrolysis–Gas Chromatography/Mass Spectrometry as a Tool to Study the Natural Variation in Biopolymers in Different Tissues of Economically Important European Softwood Species. Polymers 2023, 15, 4270. https://doi.org/10.3390/polym15214270
Hentges D, Gérardin P, Vinchelin P, Dumarçay S. Use of Pyrolysis–Gas Chromatography/Mass Spectrometry as a Tool to Study the Natural Variation in Biopolymers in Different Tissues of Economically Important European Softwood Species. Polymers. 2023; 15(21):4270. https://doi.org/10.3390/polym15214270
Chicago/Turabian StyleHentges, David, Philippe Gérardin, Pierre Vinchelin, and Stéphane Dumarçay. 2023. "Use of Pyrolysis–Gas Chromatography/Mass Spectrometry as a Tool to Study the Natural Variation in Biopolymers in Different Tissues of Economically Important European Softwood Species" Polymers 15, no. 21: 4270. https://doi.org/10.3390/polym15214270
APA StyleHentges, D., Gérardin, P., Vinchelin, P., & Dumarçay, S. (2023). Use of Pyrolysis–Gas Chromatography/Mass Spectrometry as a Tool to Study the Natural Variation in Biopolymers in Different Tissues of Economically Important European Softwood Species. Polymers, 15(21), 4270. https://doi.org/10.3390/polym15214270