
Study into the Fire and Explosion Characteristics of Polymer Powders Used in Engineering Production Technologies

 , , , ,
  , and
, and
Abstract
:1. Introduction
2. Materials and Methods
2.1. Polyamide (PA) 12
2.2. Polypropylene (PP)
2.3. Ultra-High Molecular Weight Polyethylene (UHMW-PE)
2.4. Granulometry, Topography (LSM, SEM), X-ray, FTIR and TGA of the Samples
2.4.1. Granulometry
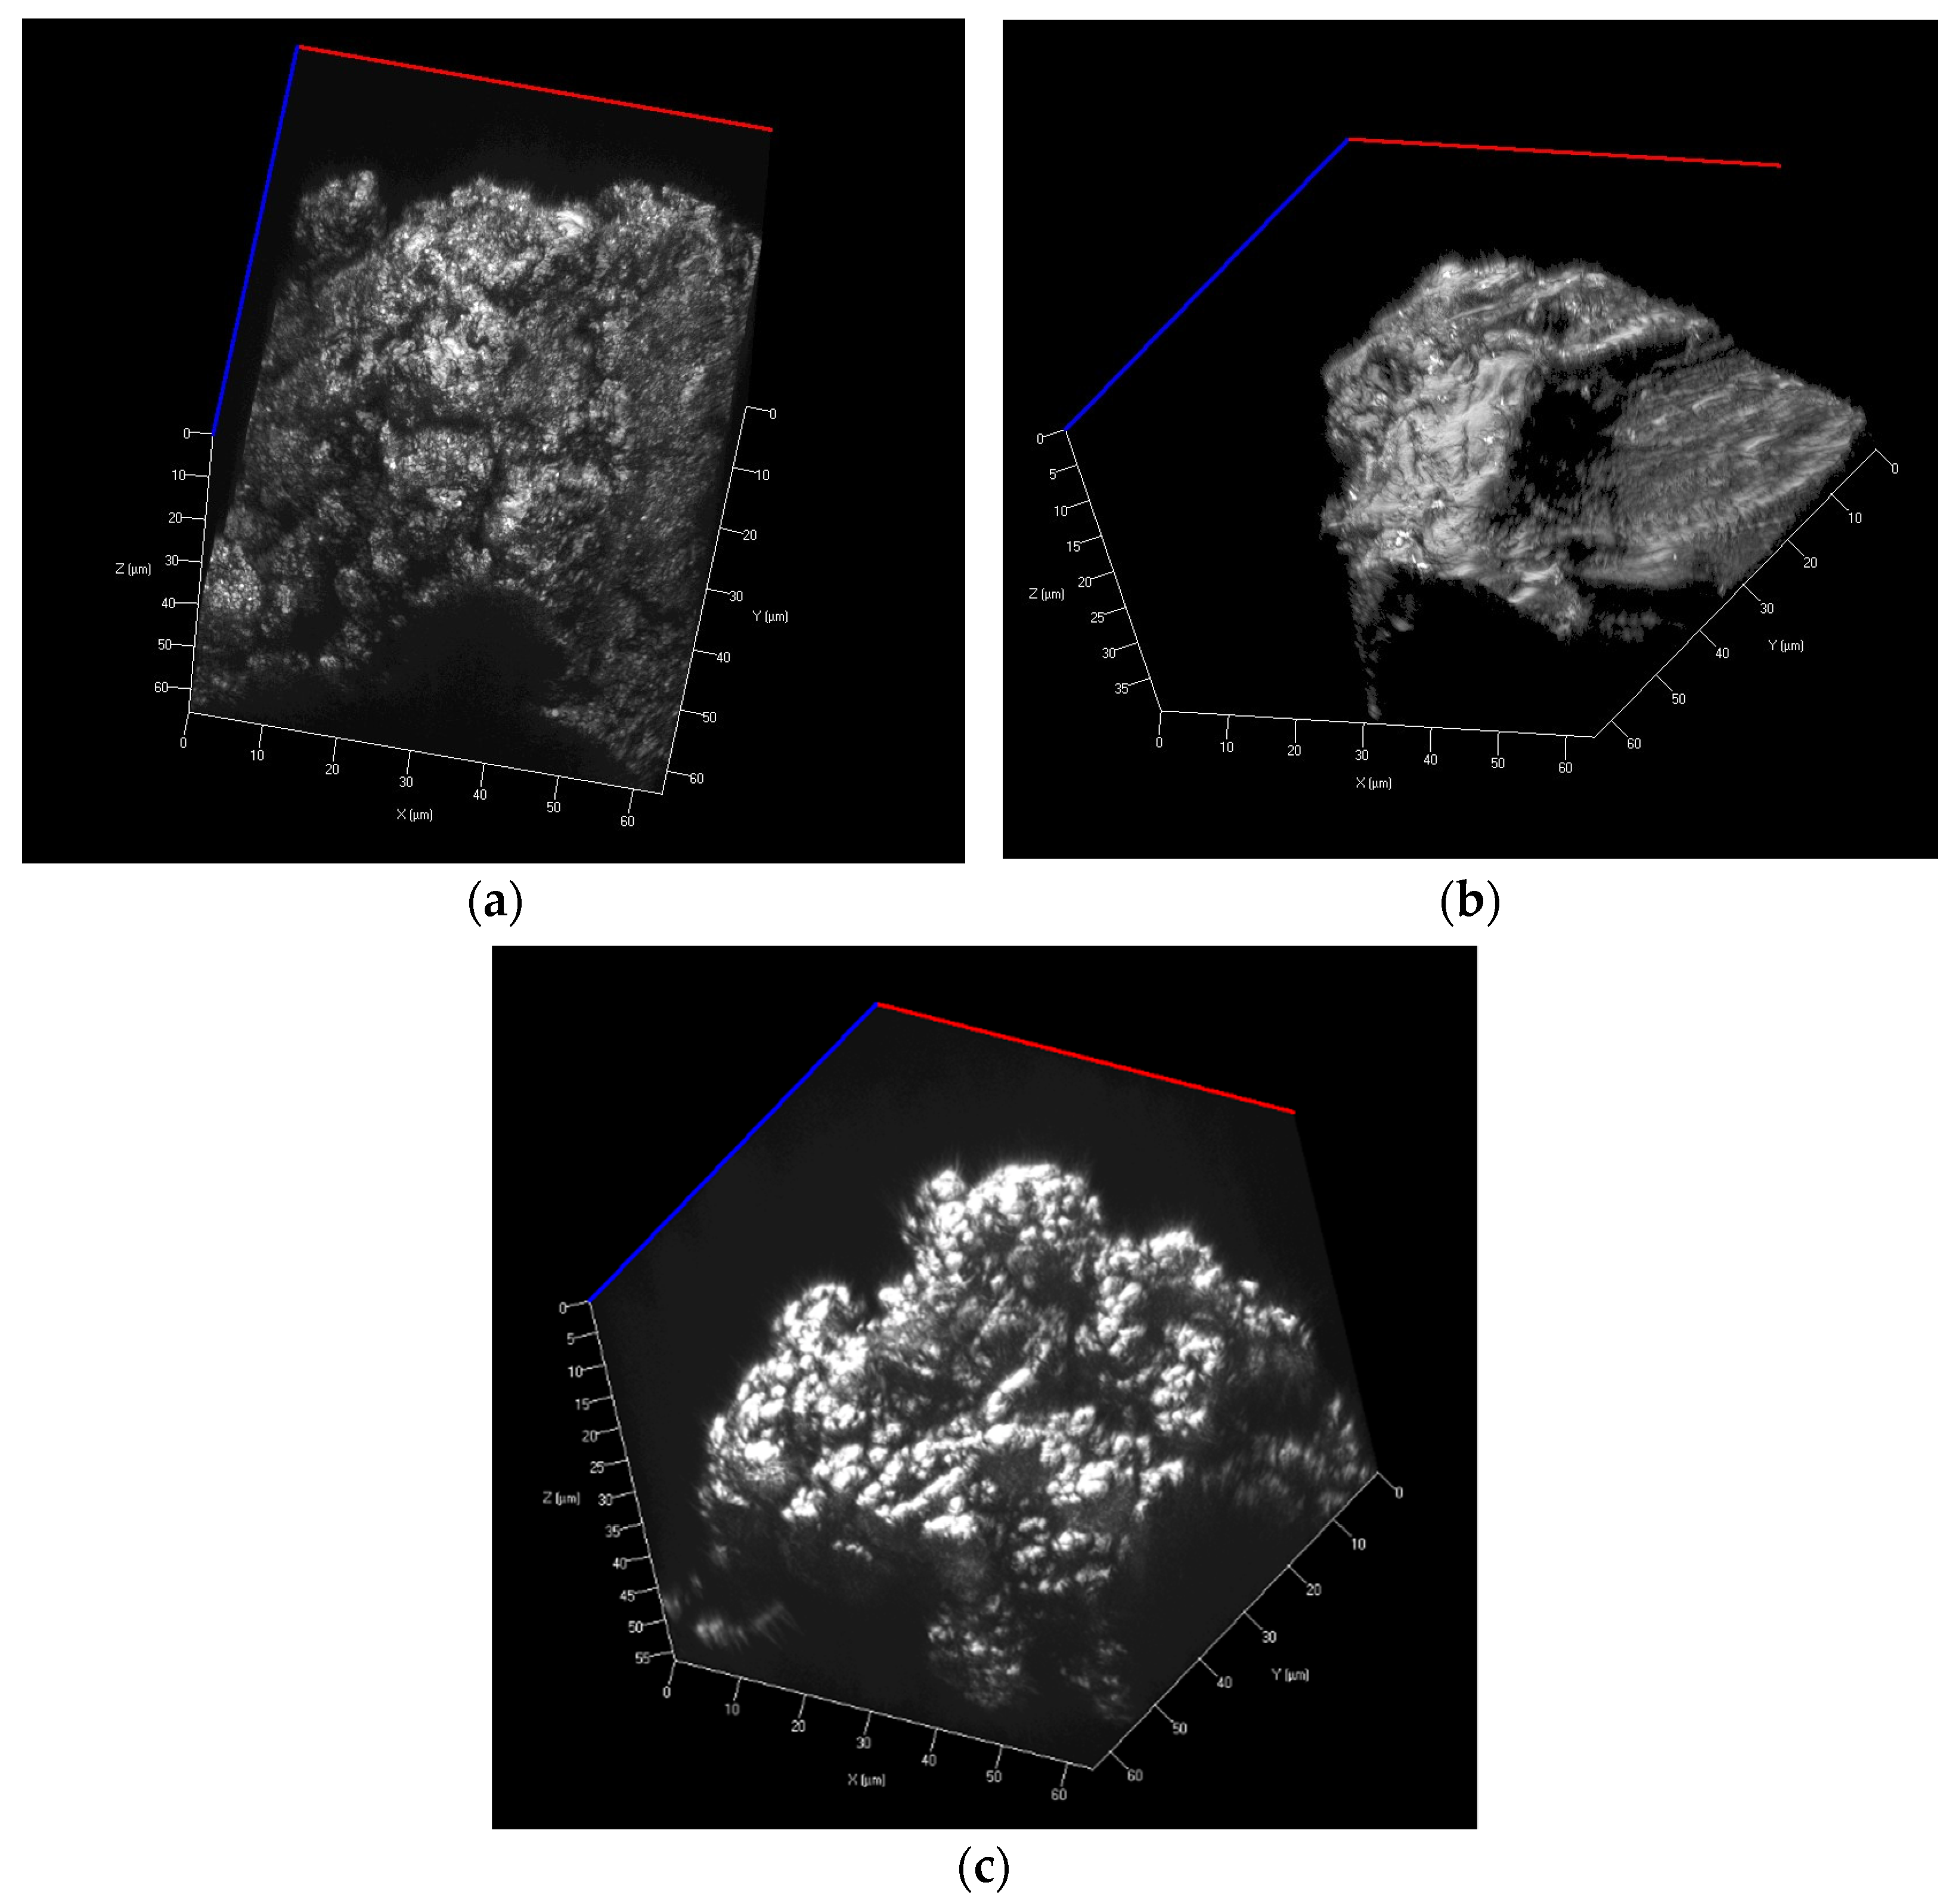
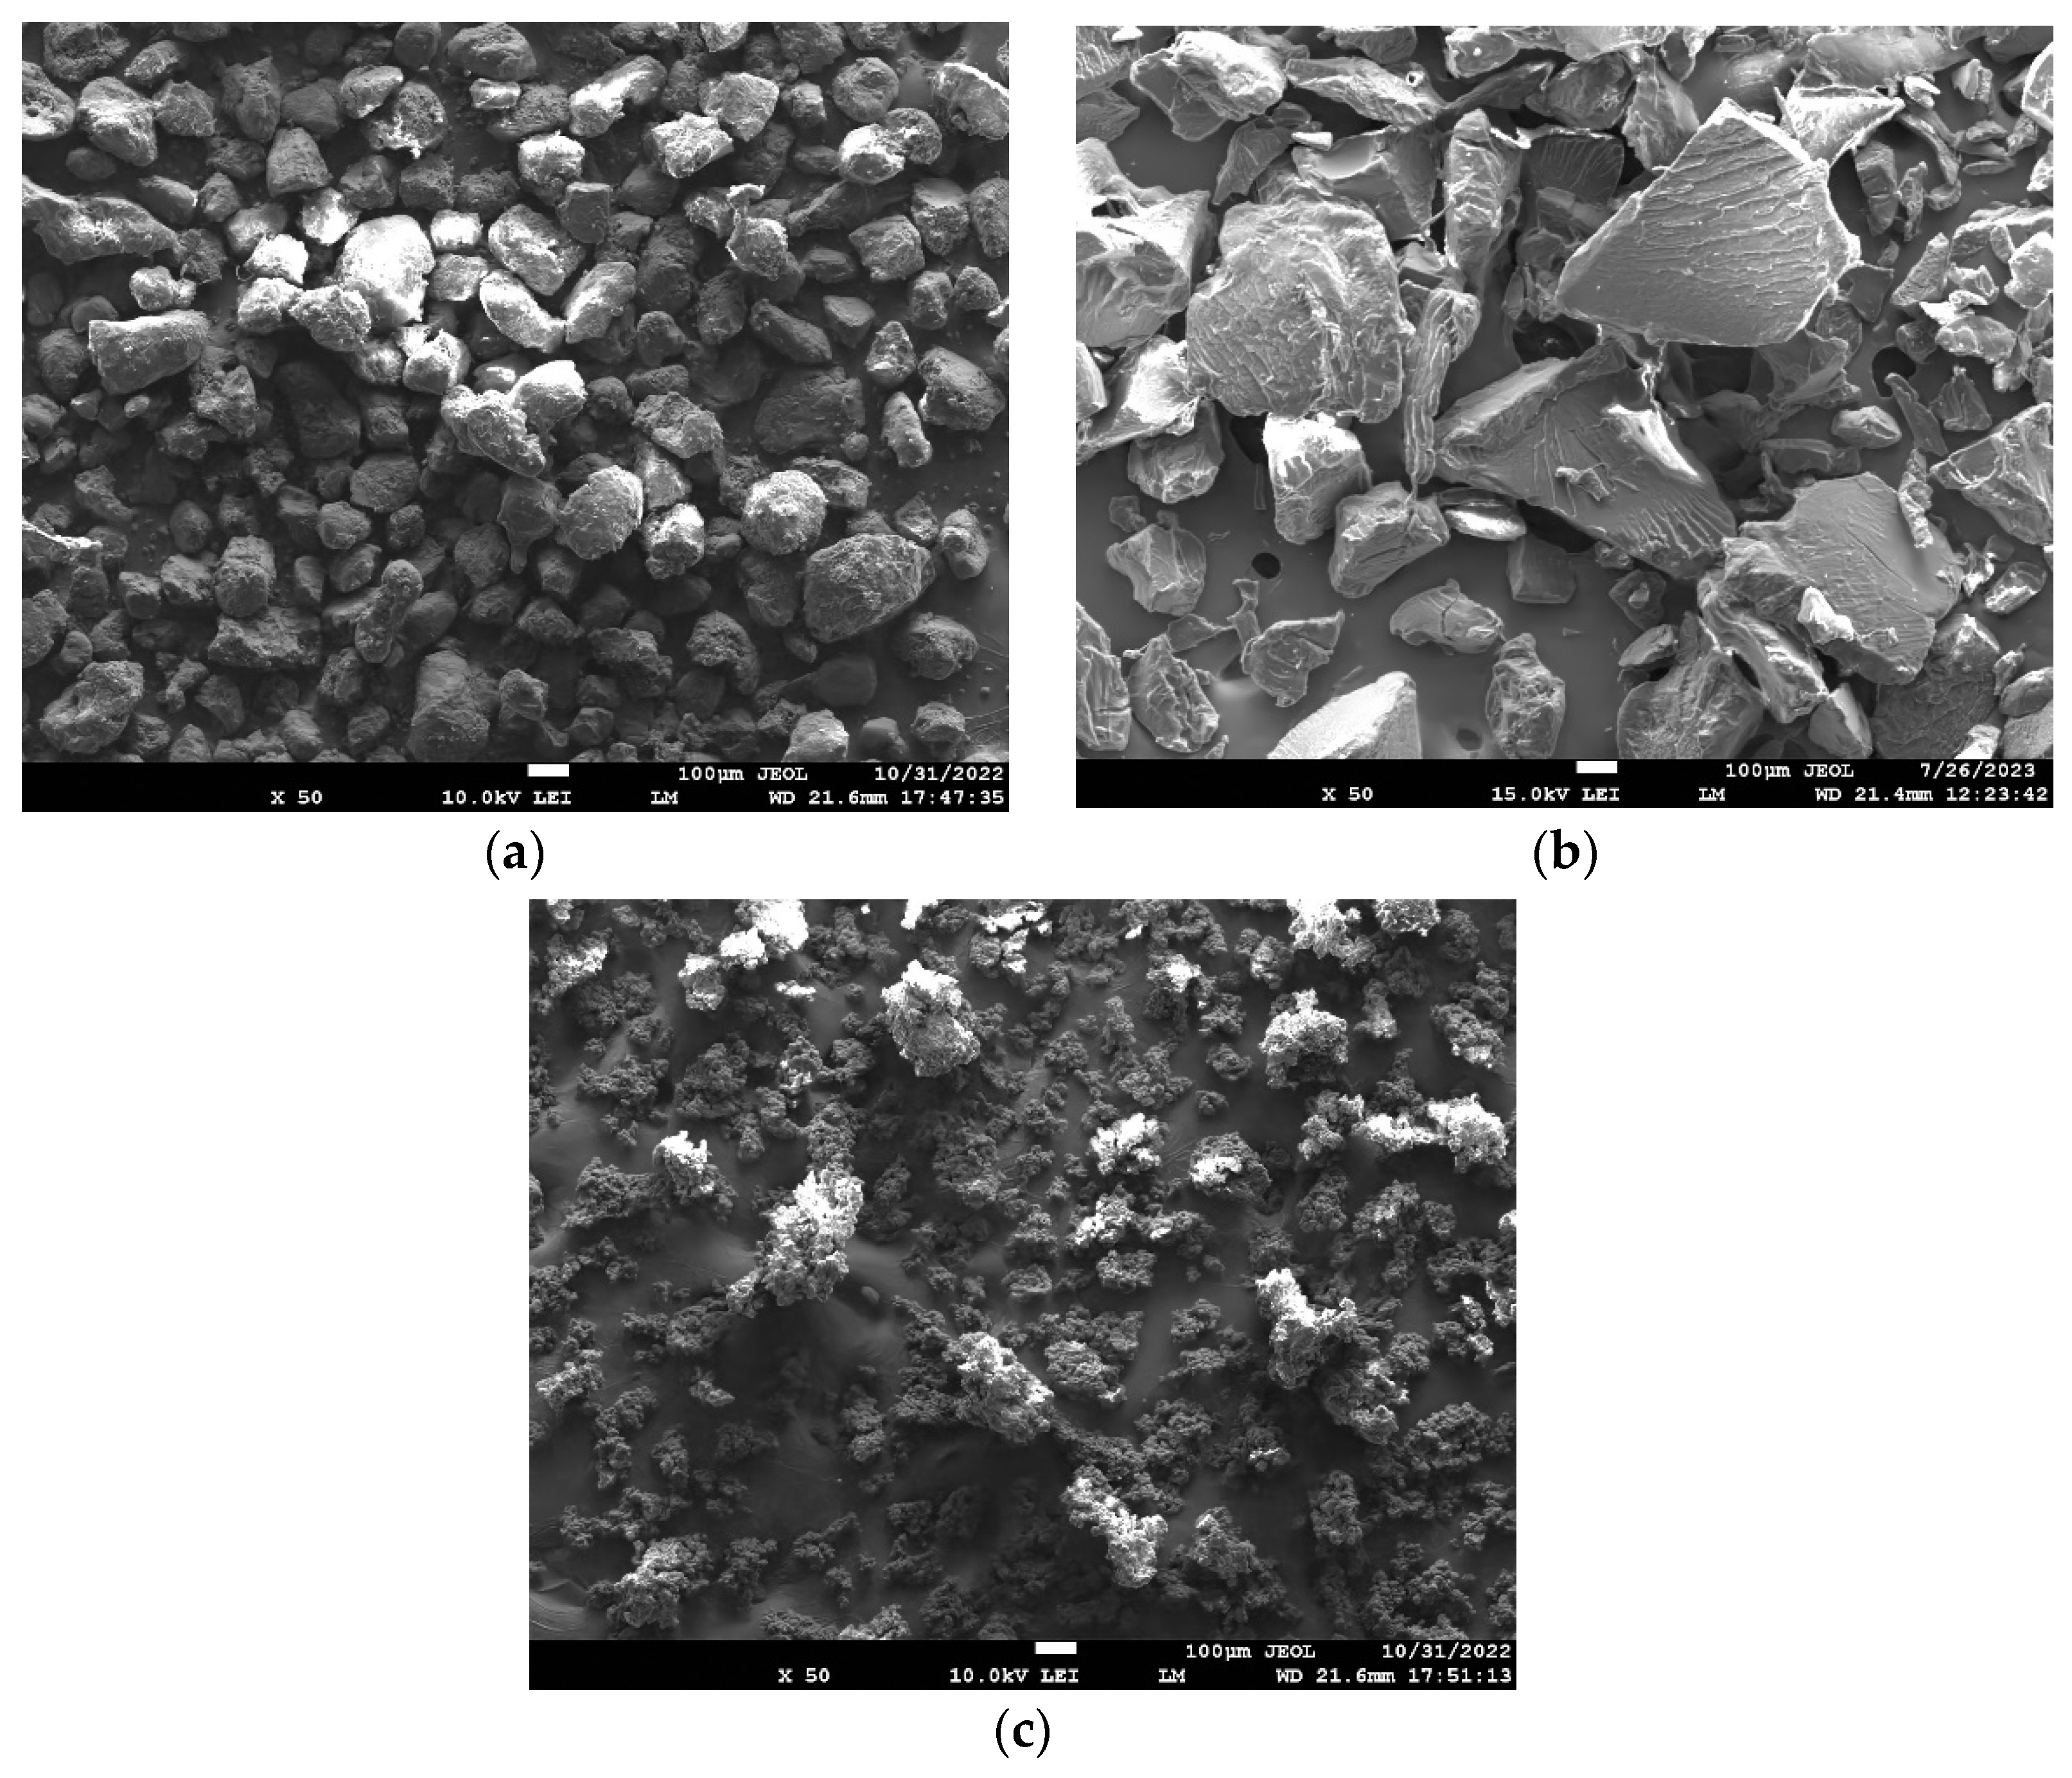
2.4.2. Topography
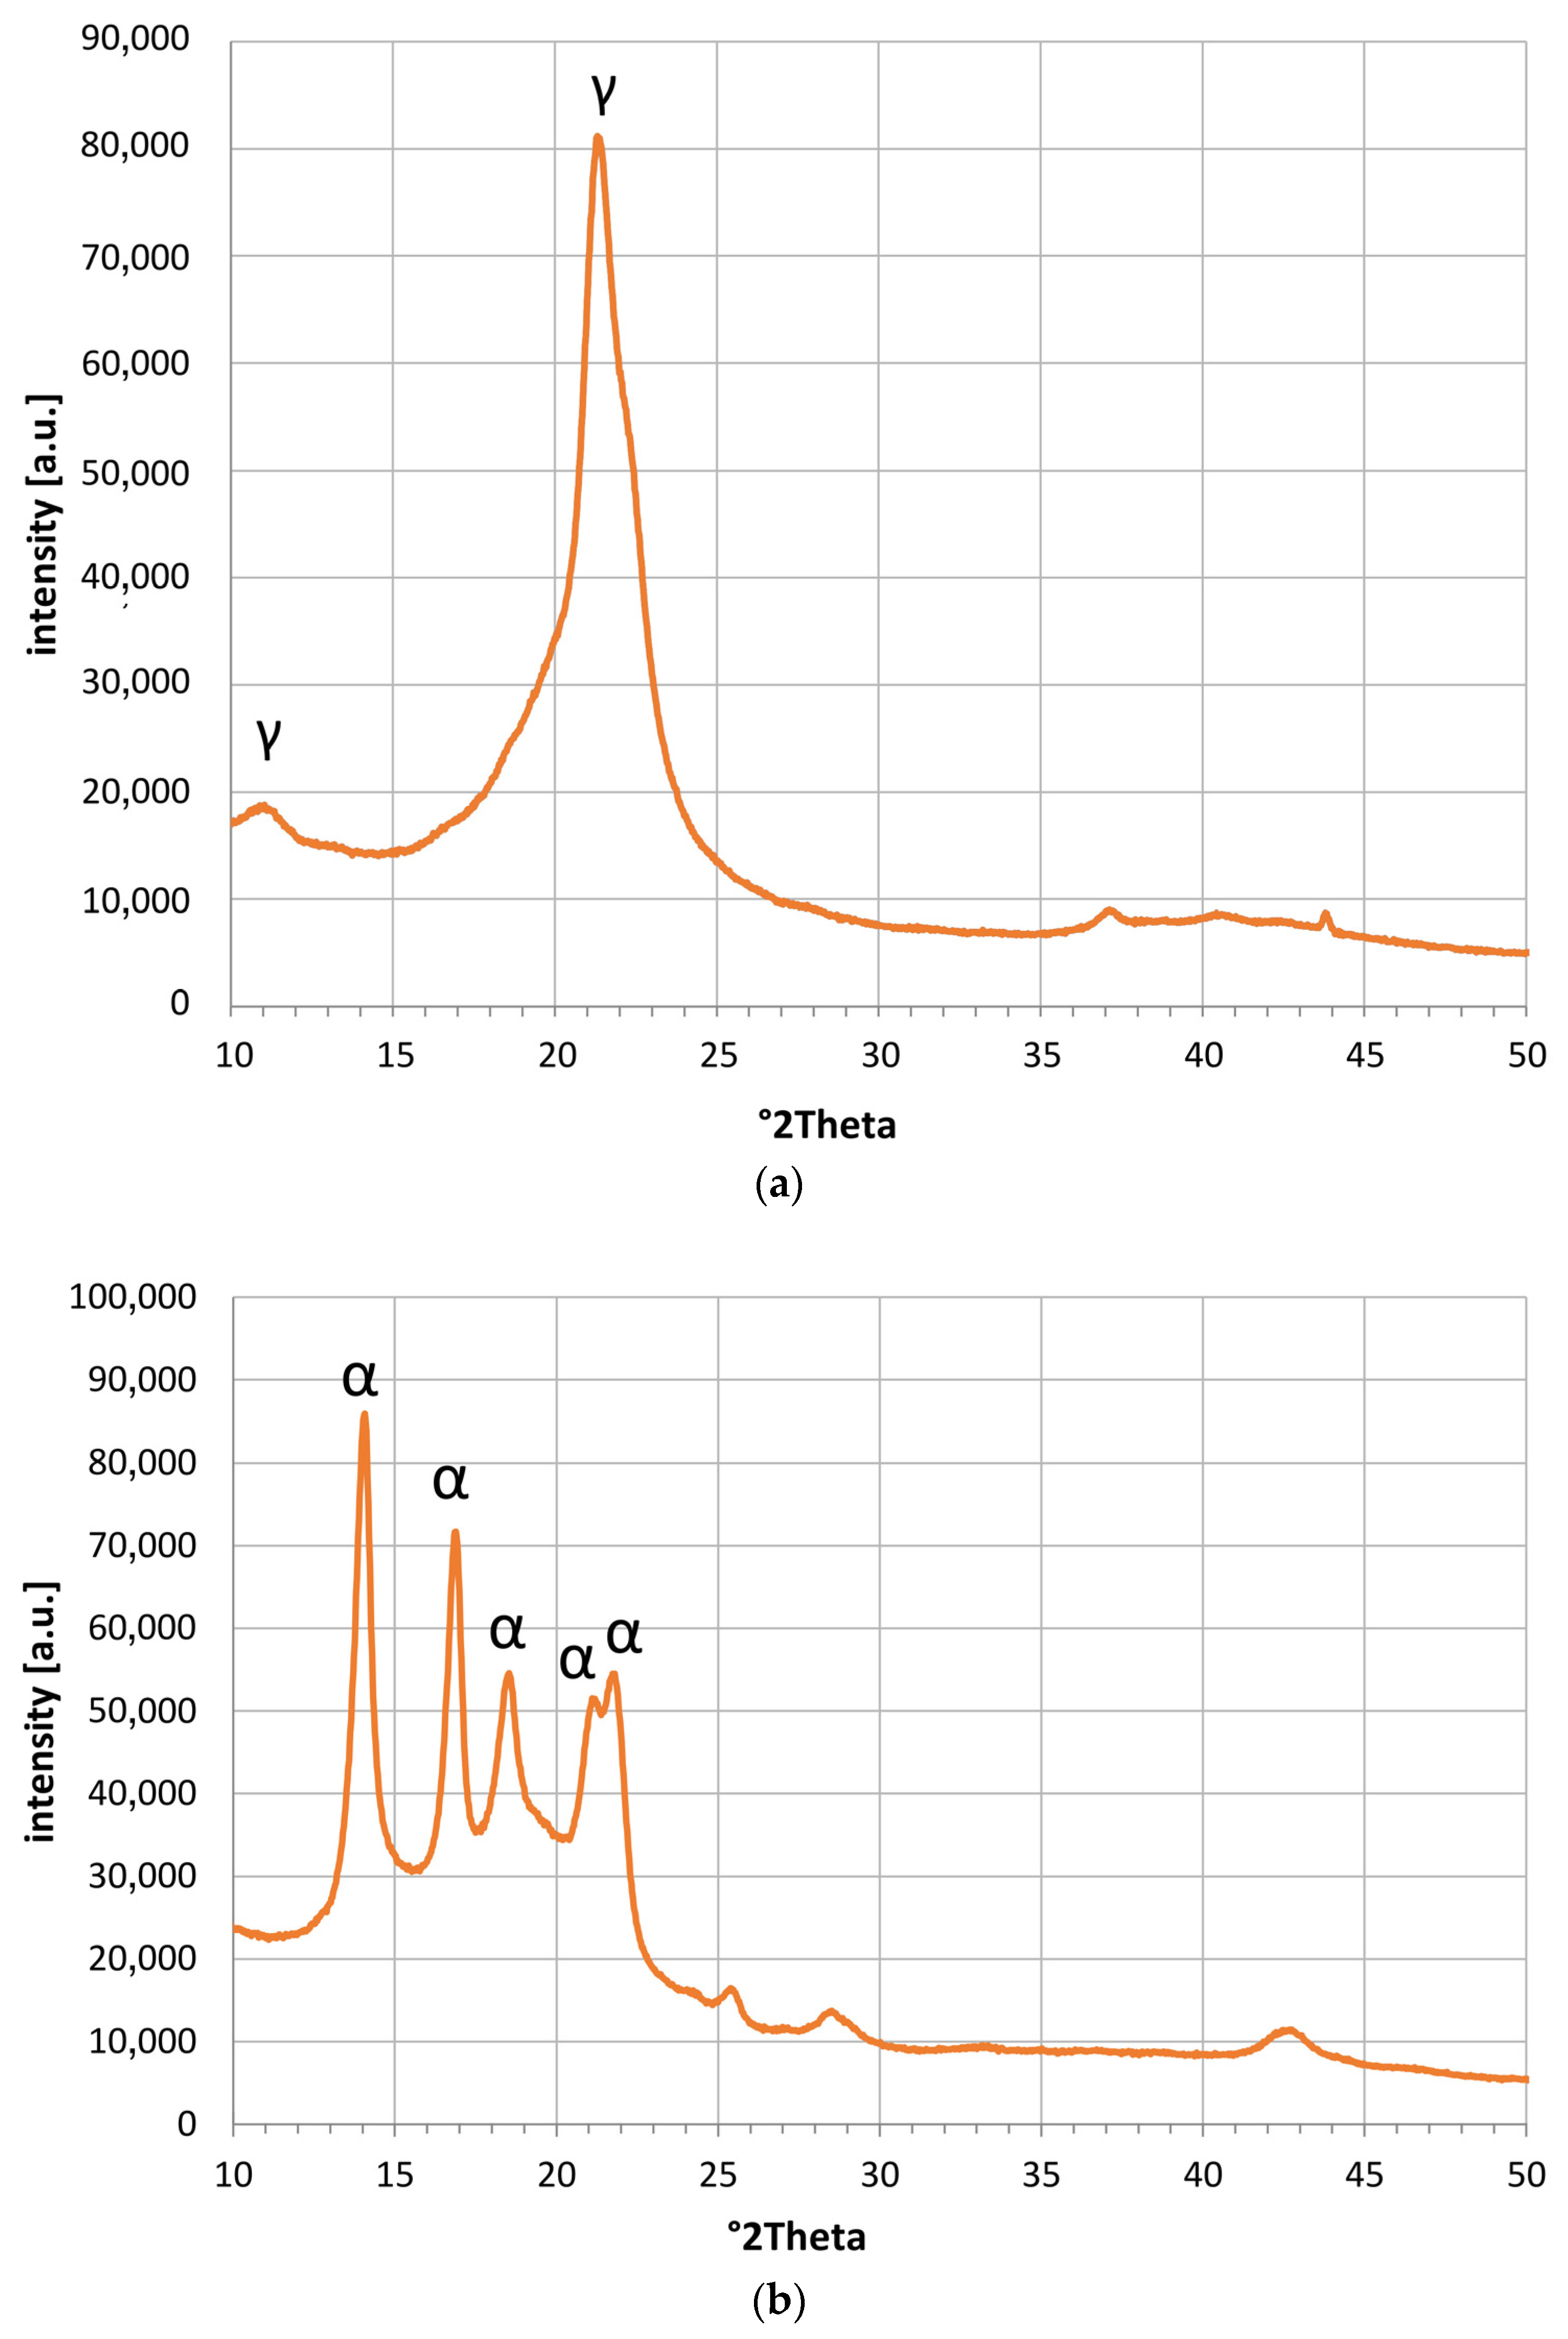
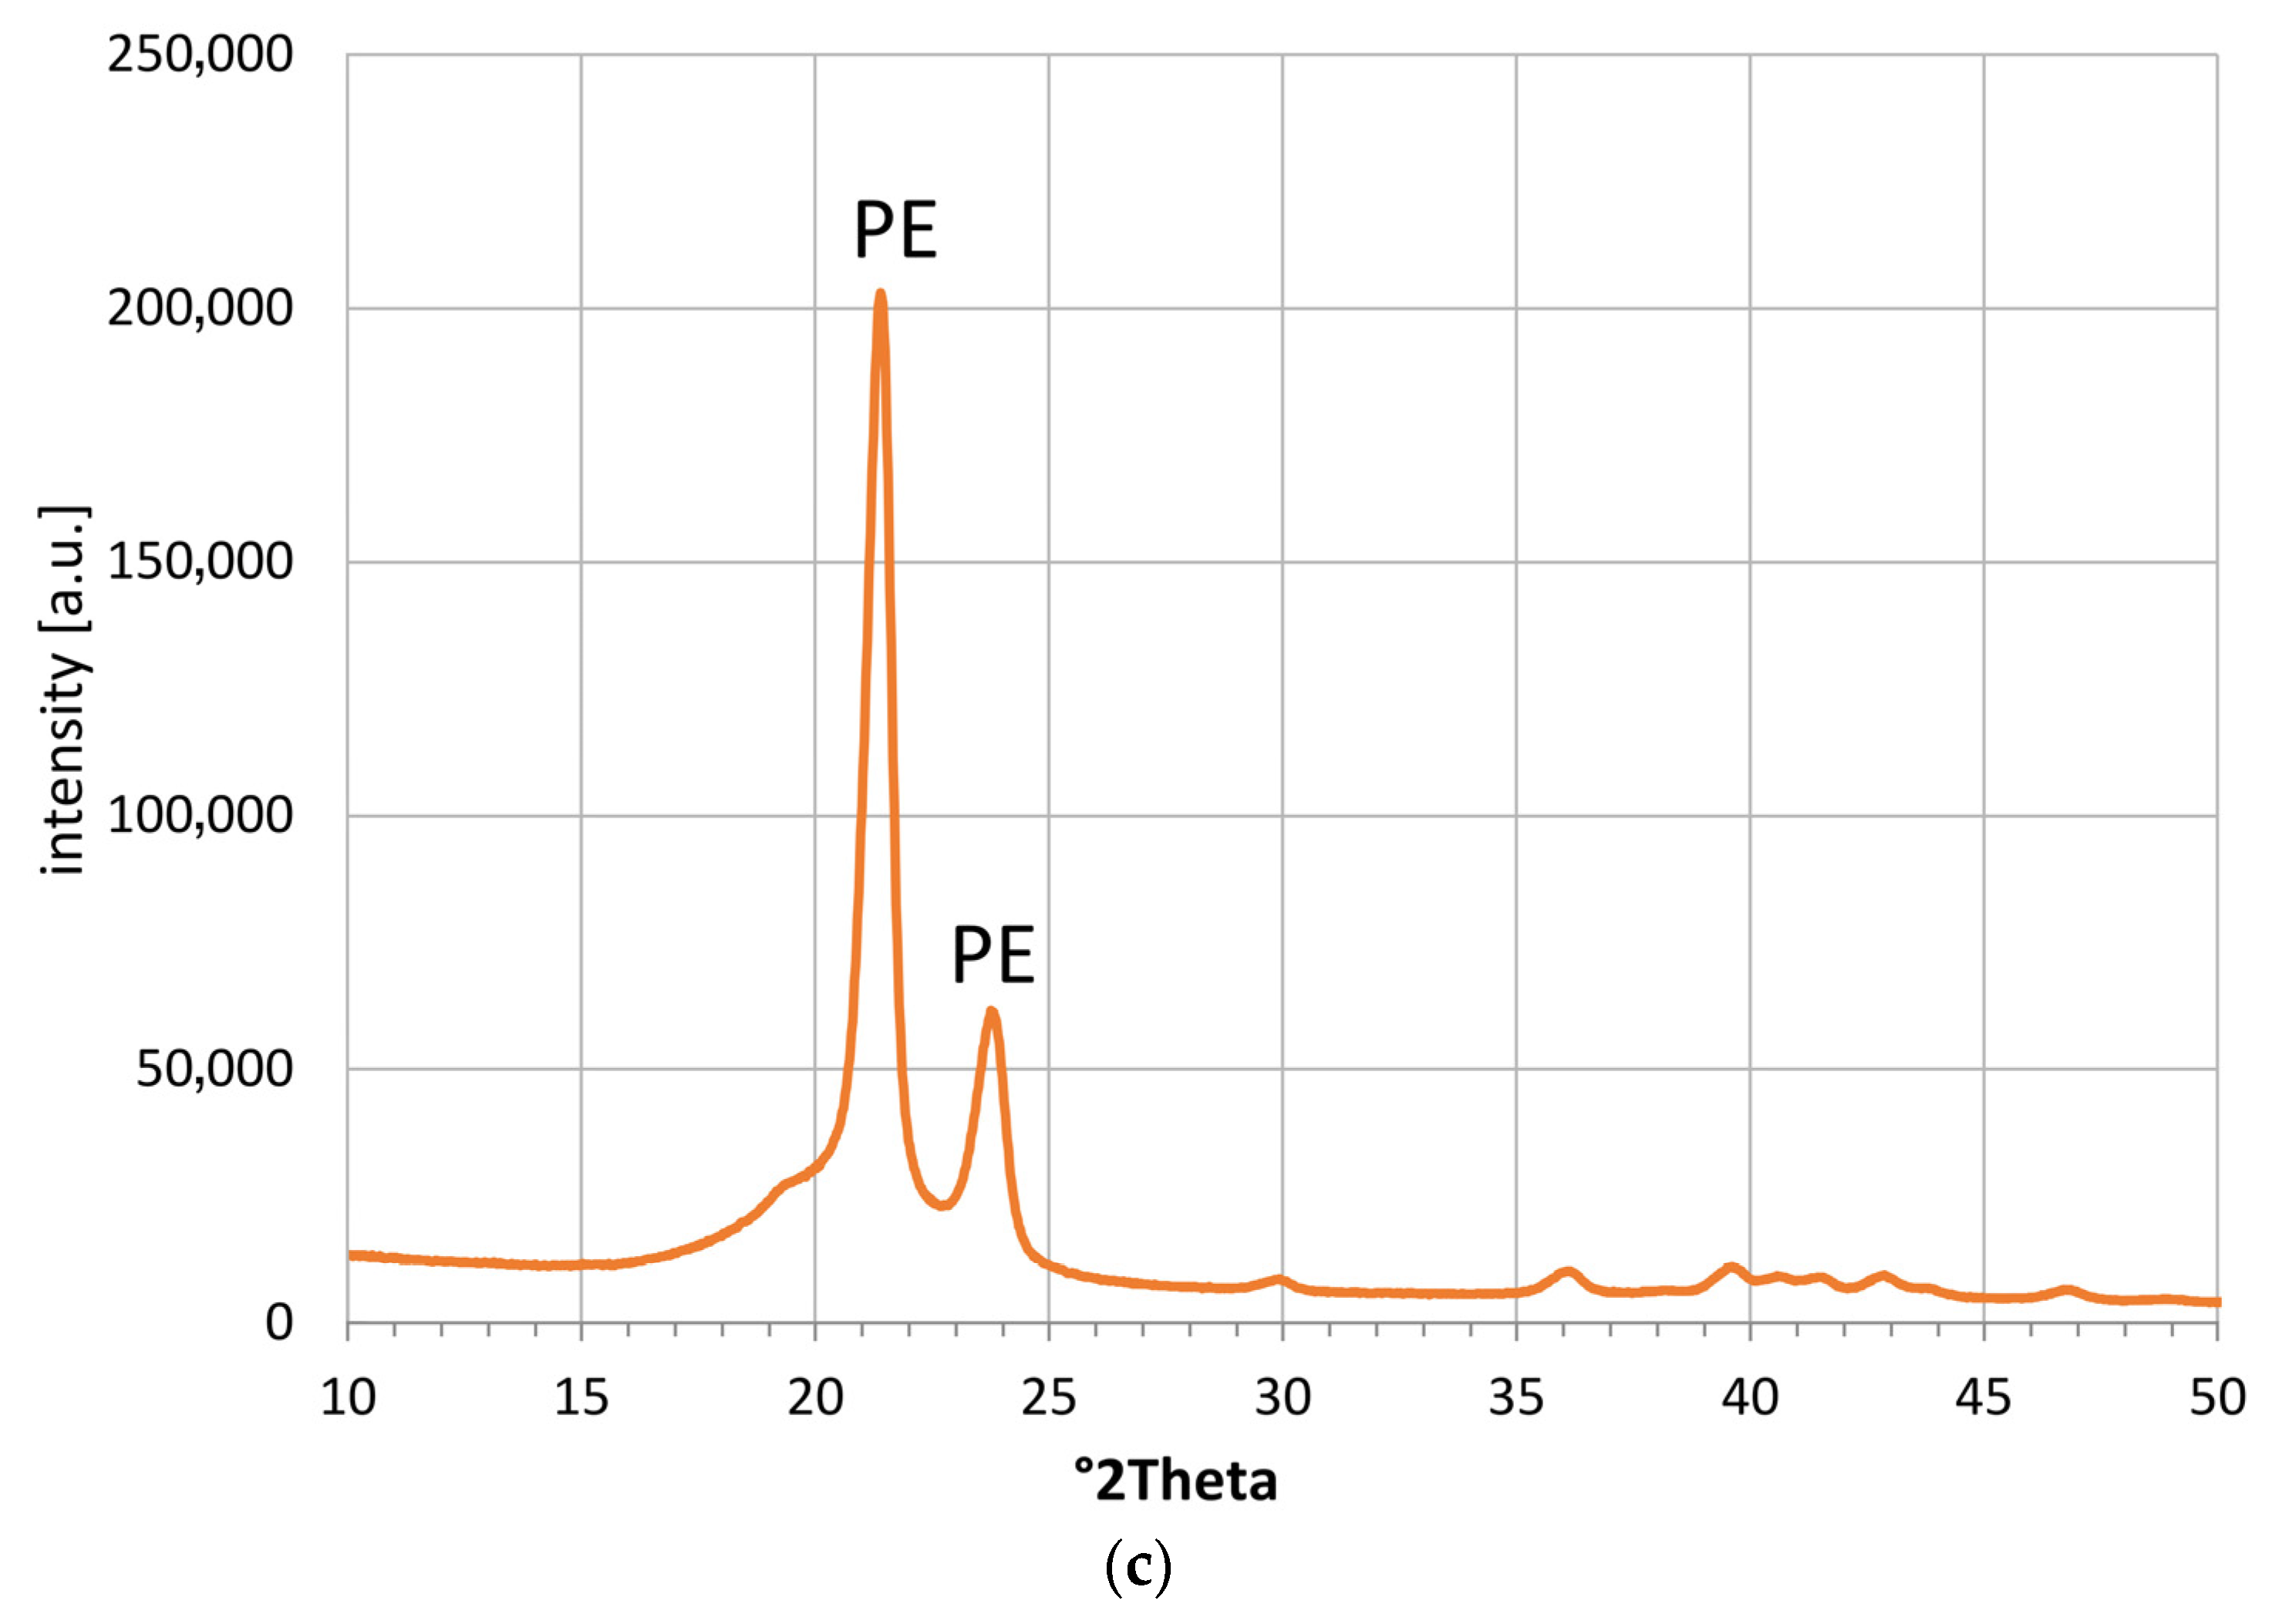
2.4.3. X-ray
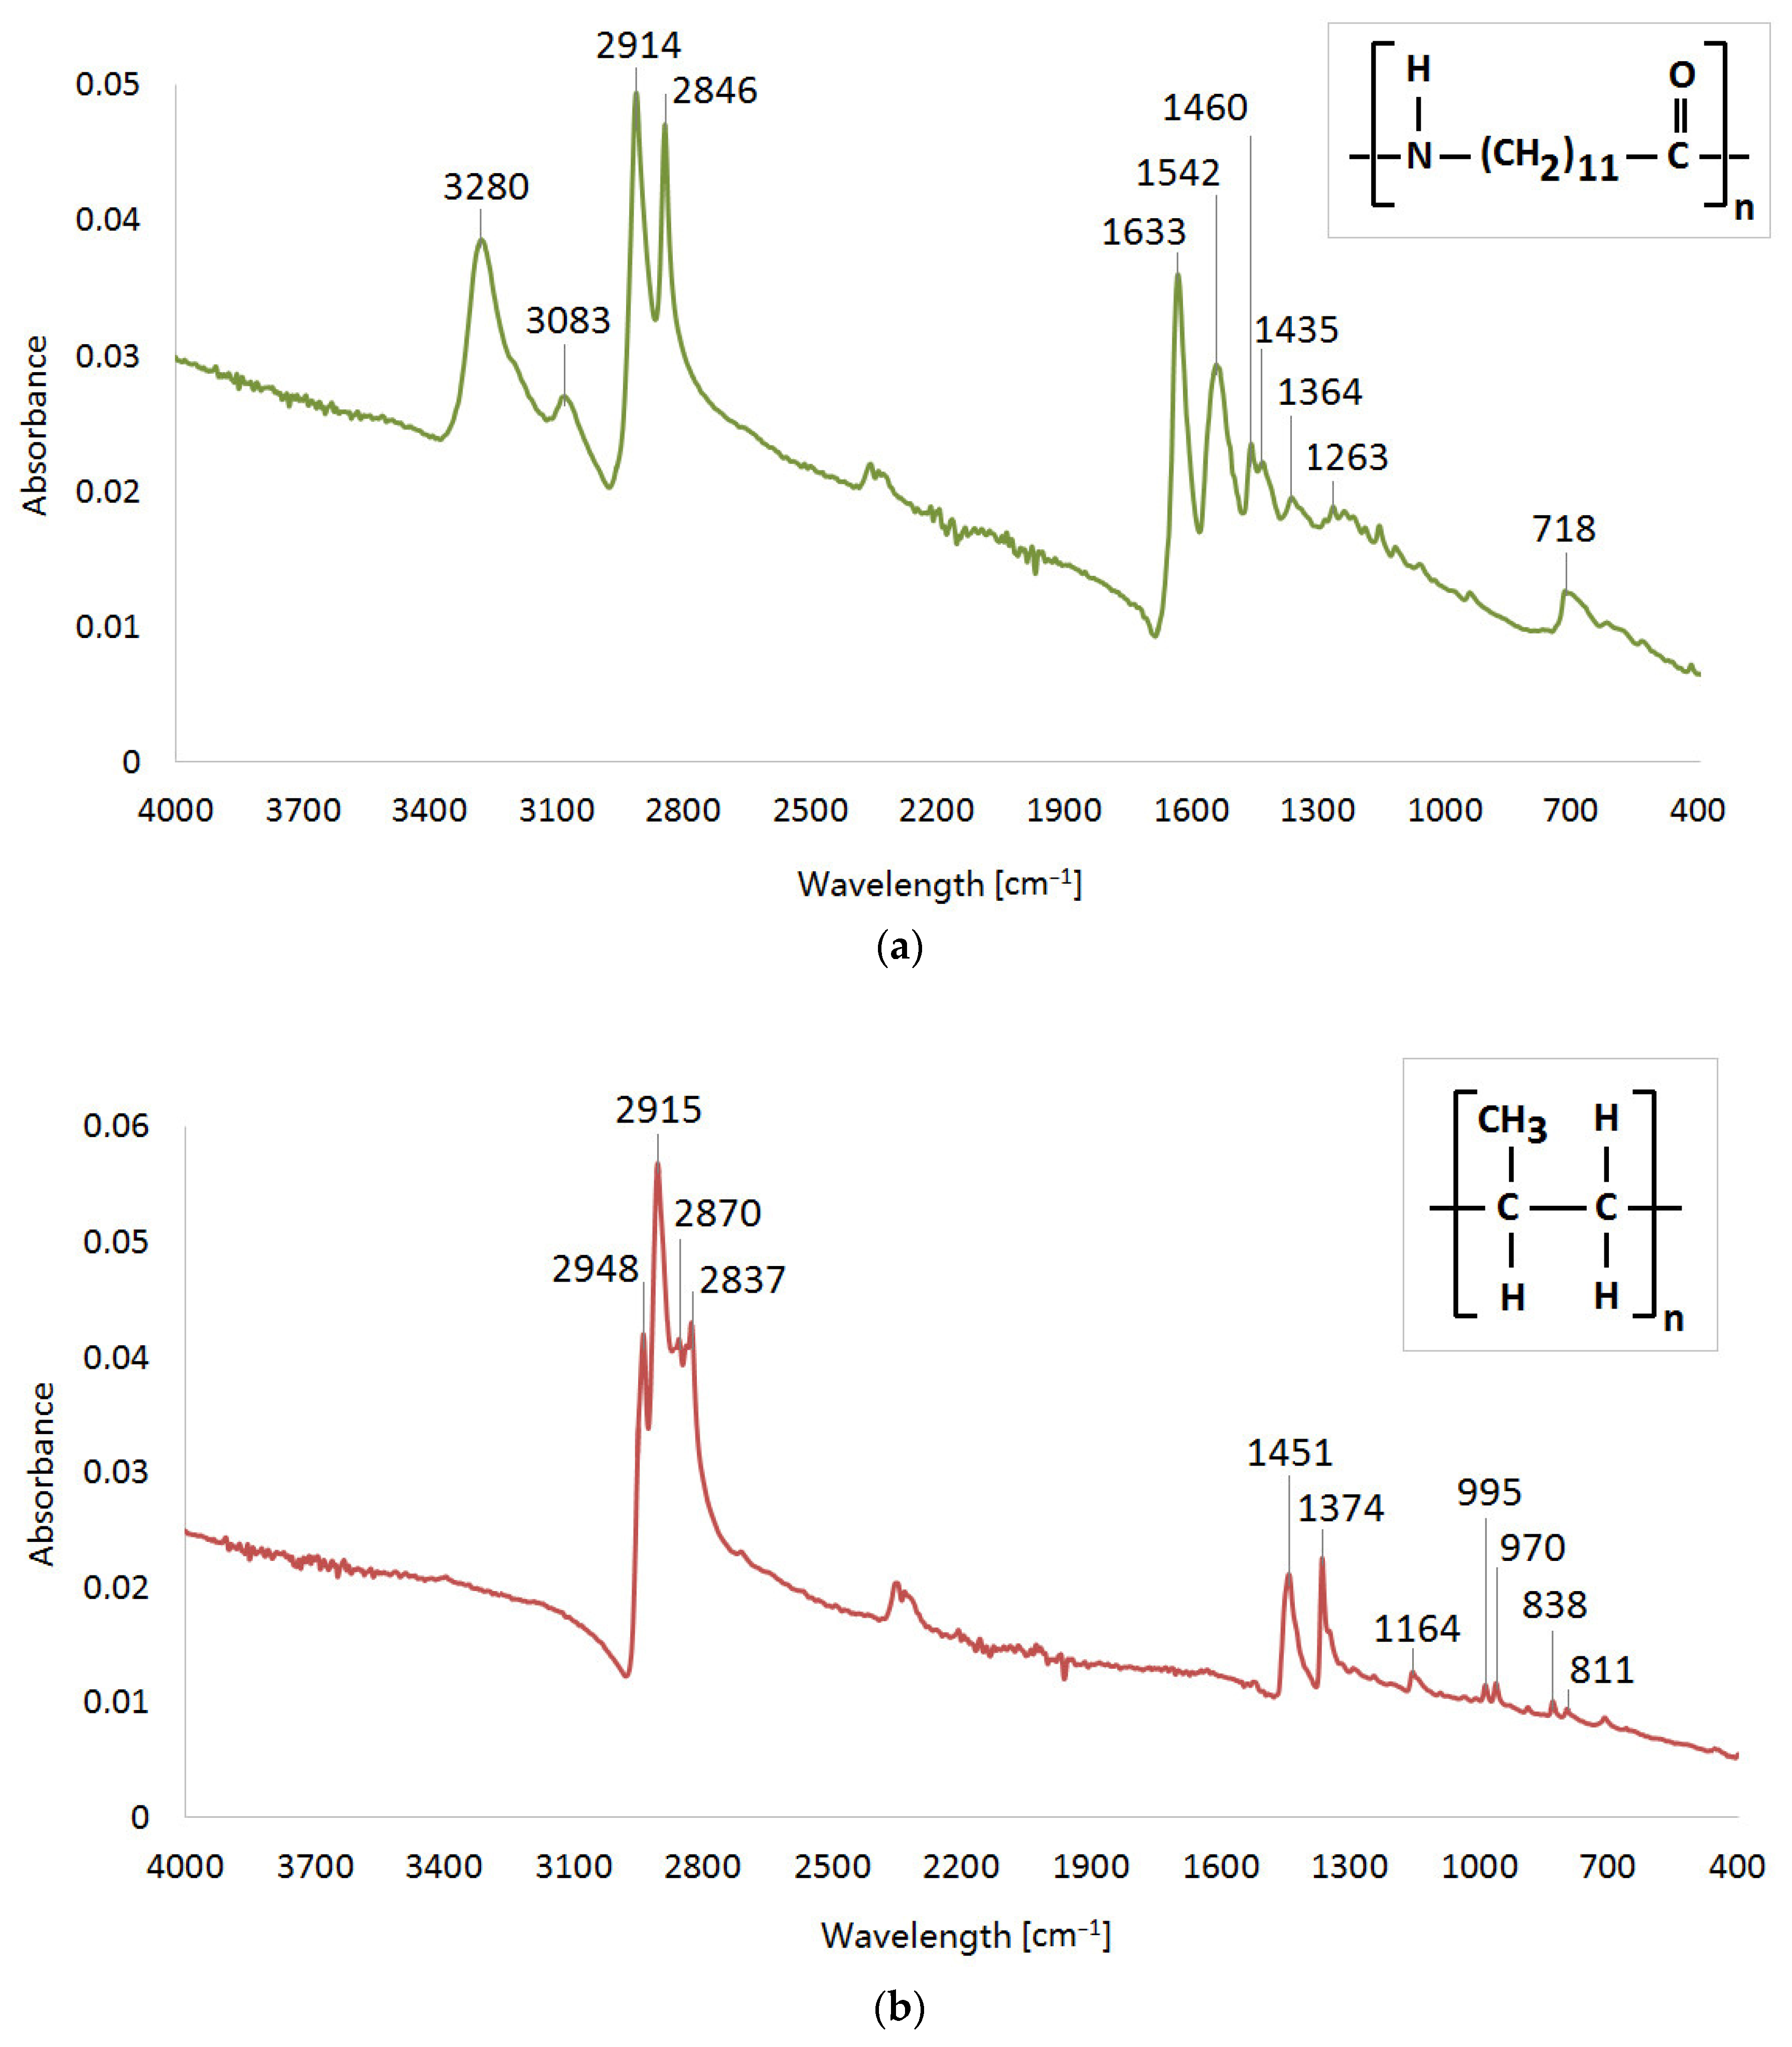
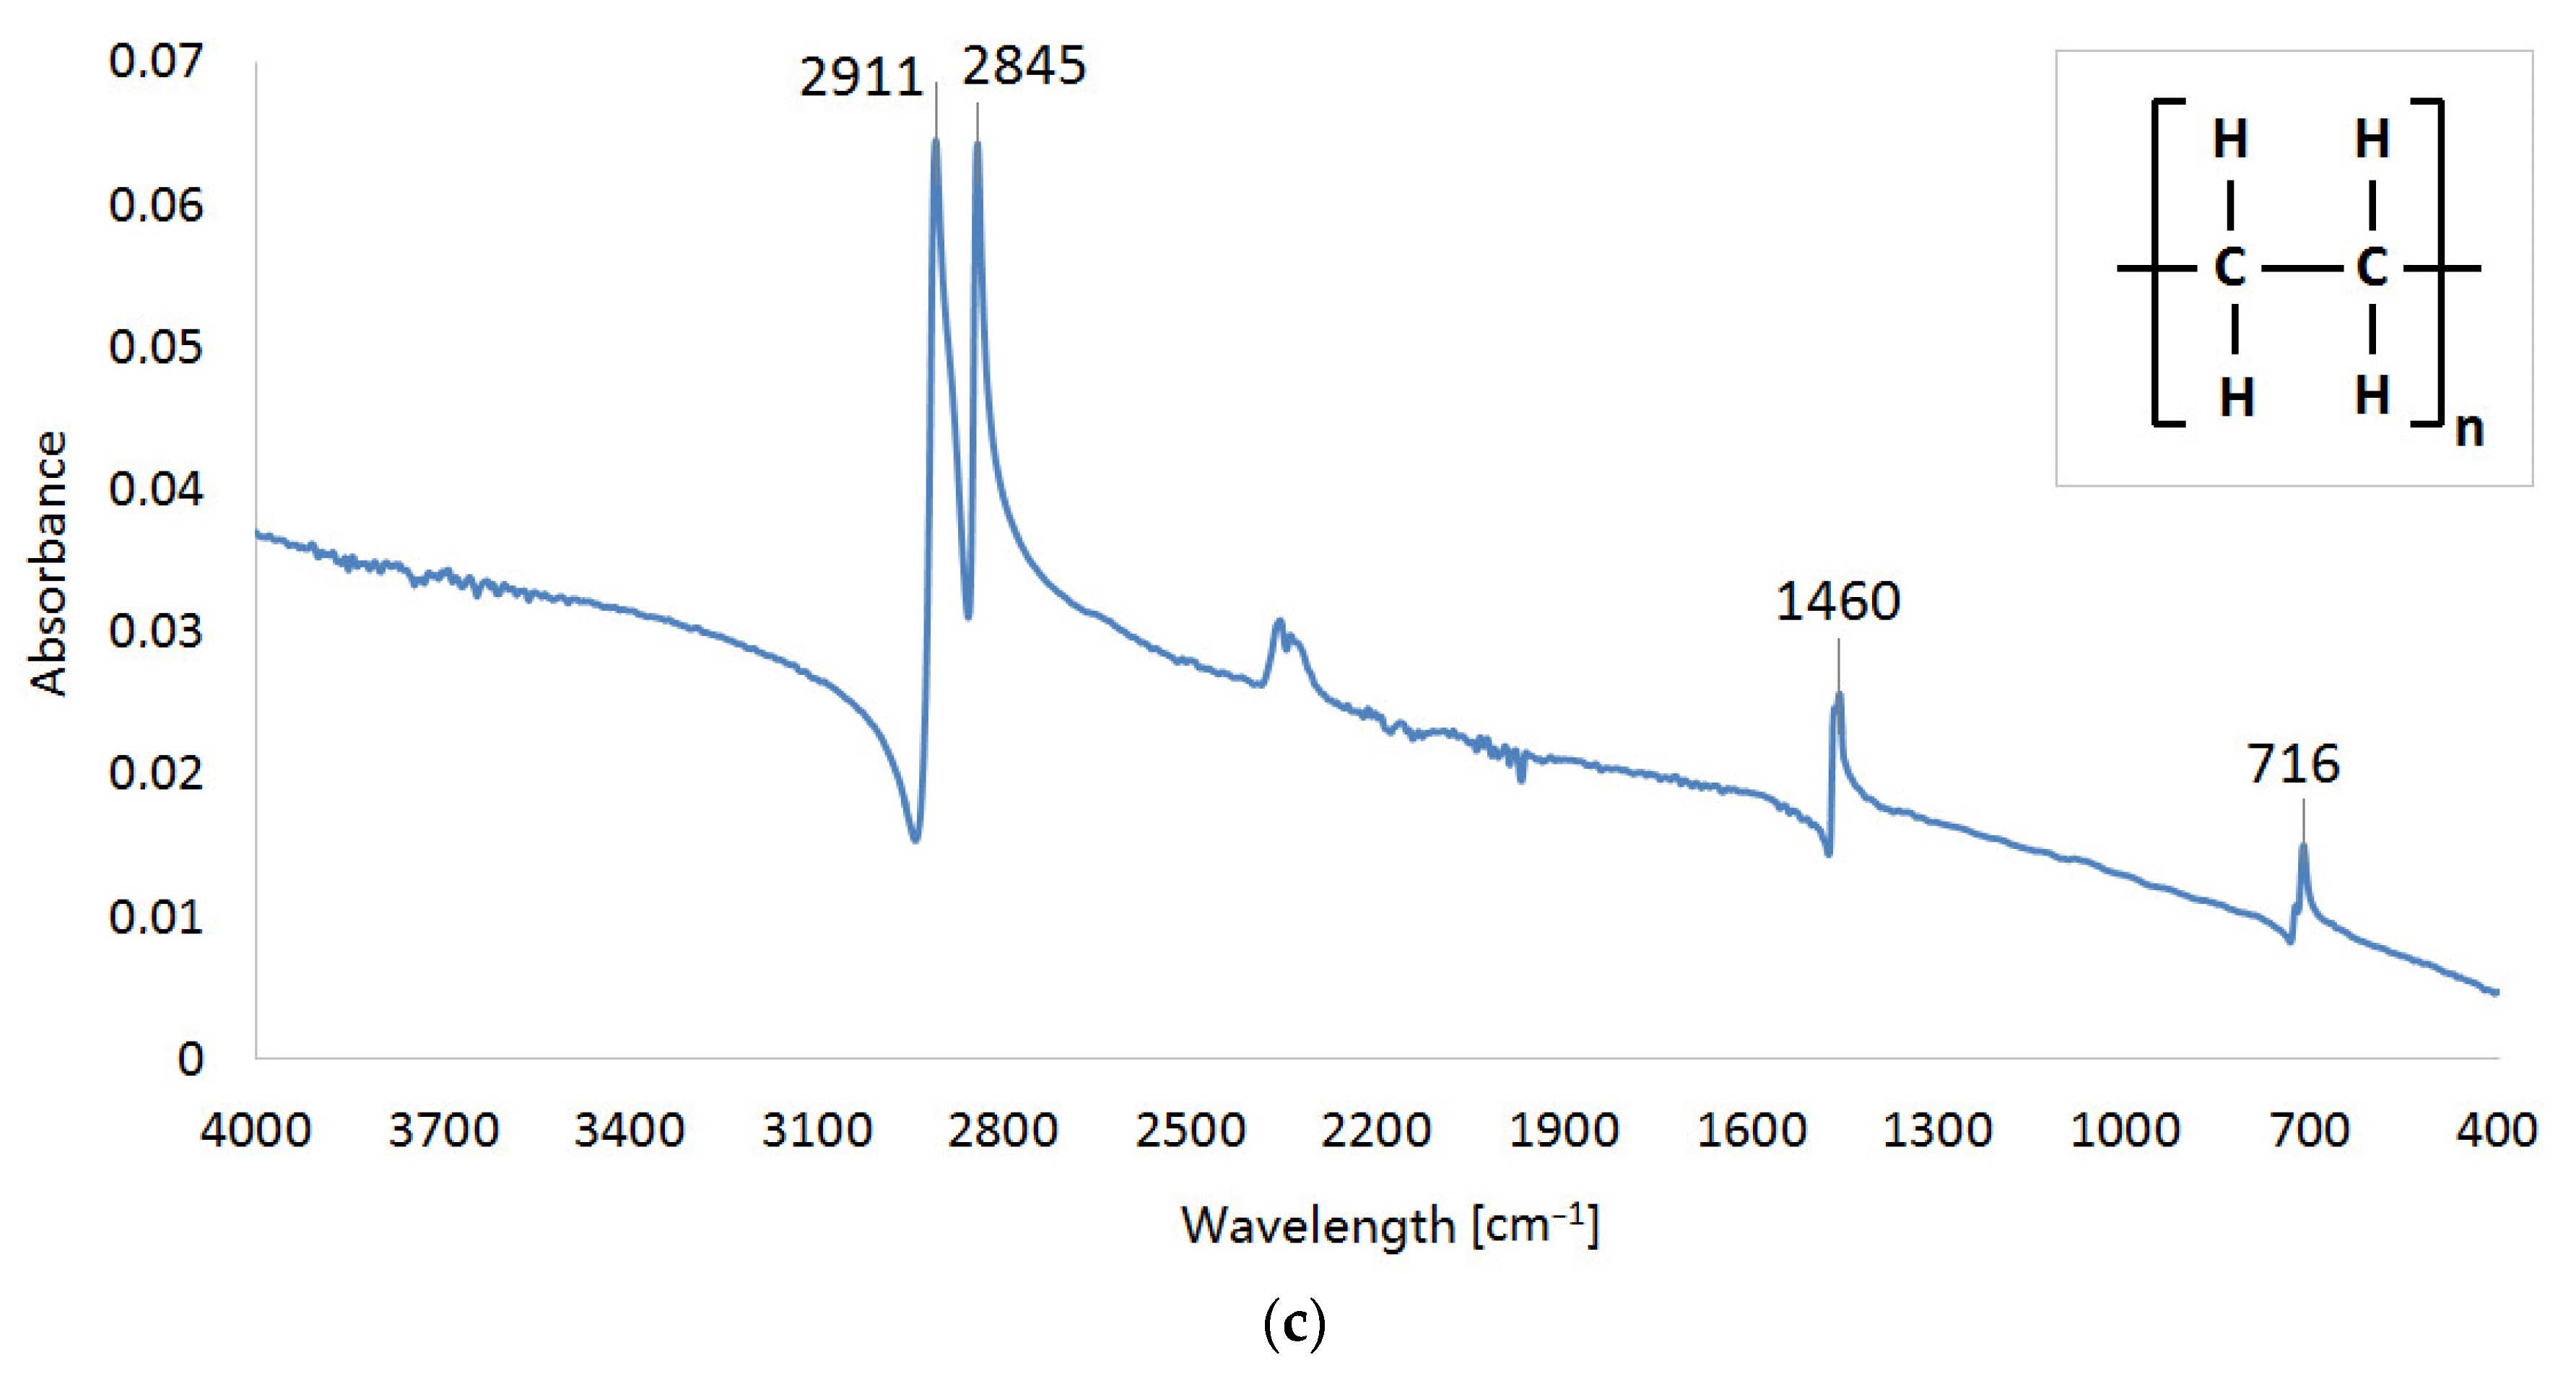
2.4.4. FTIR
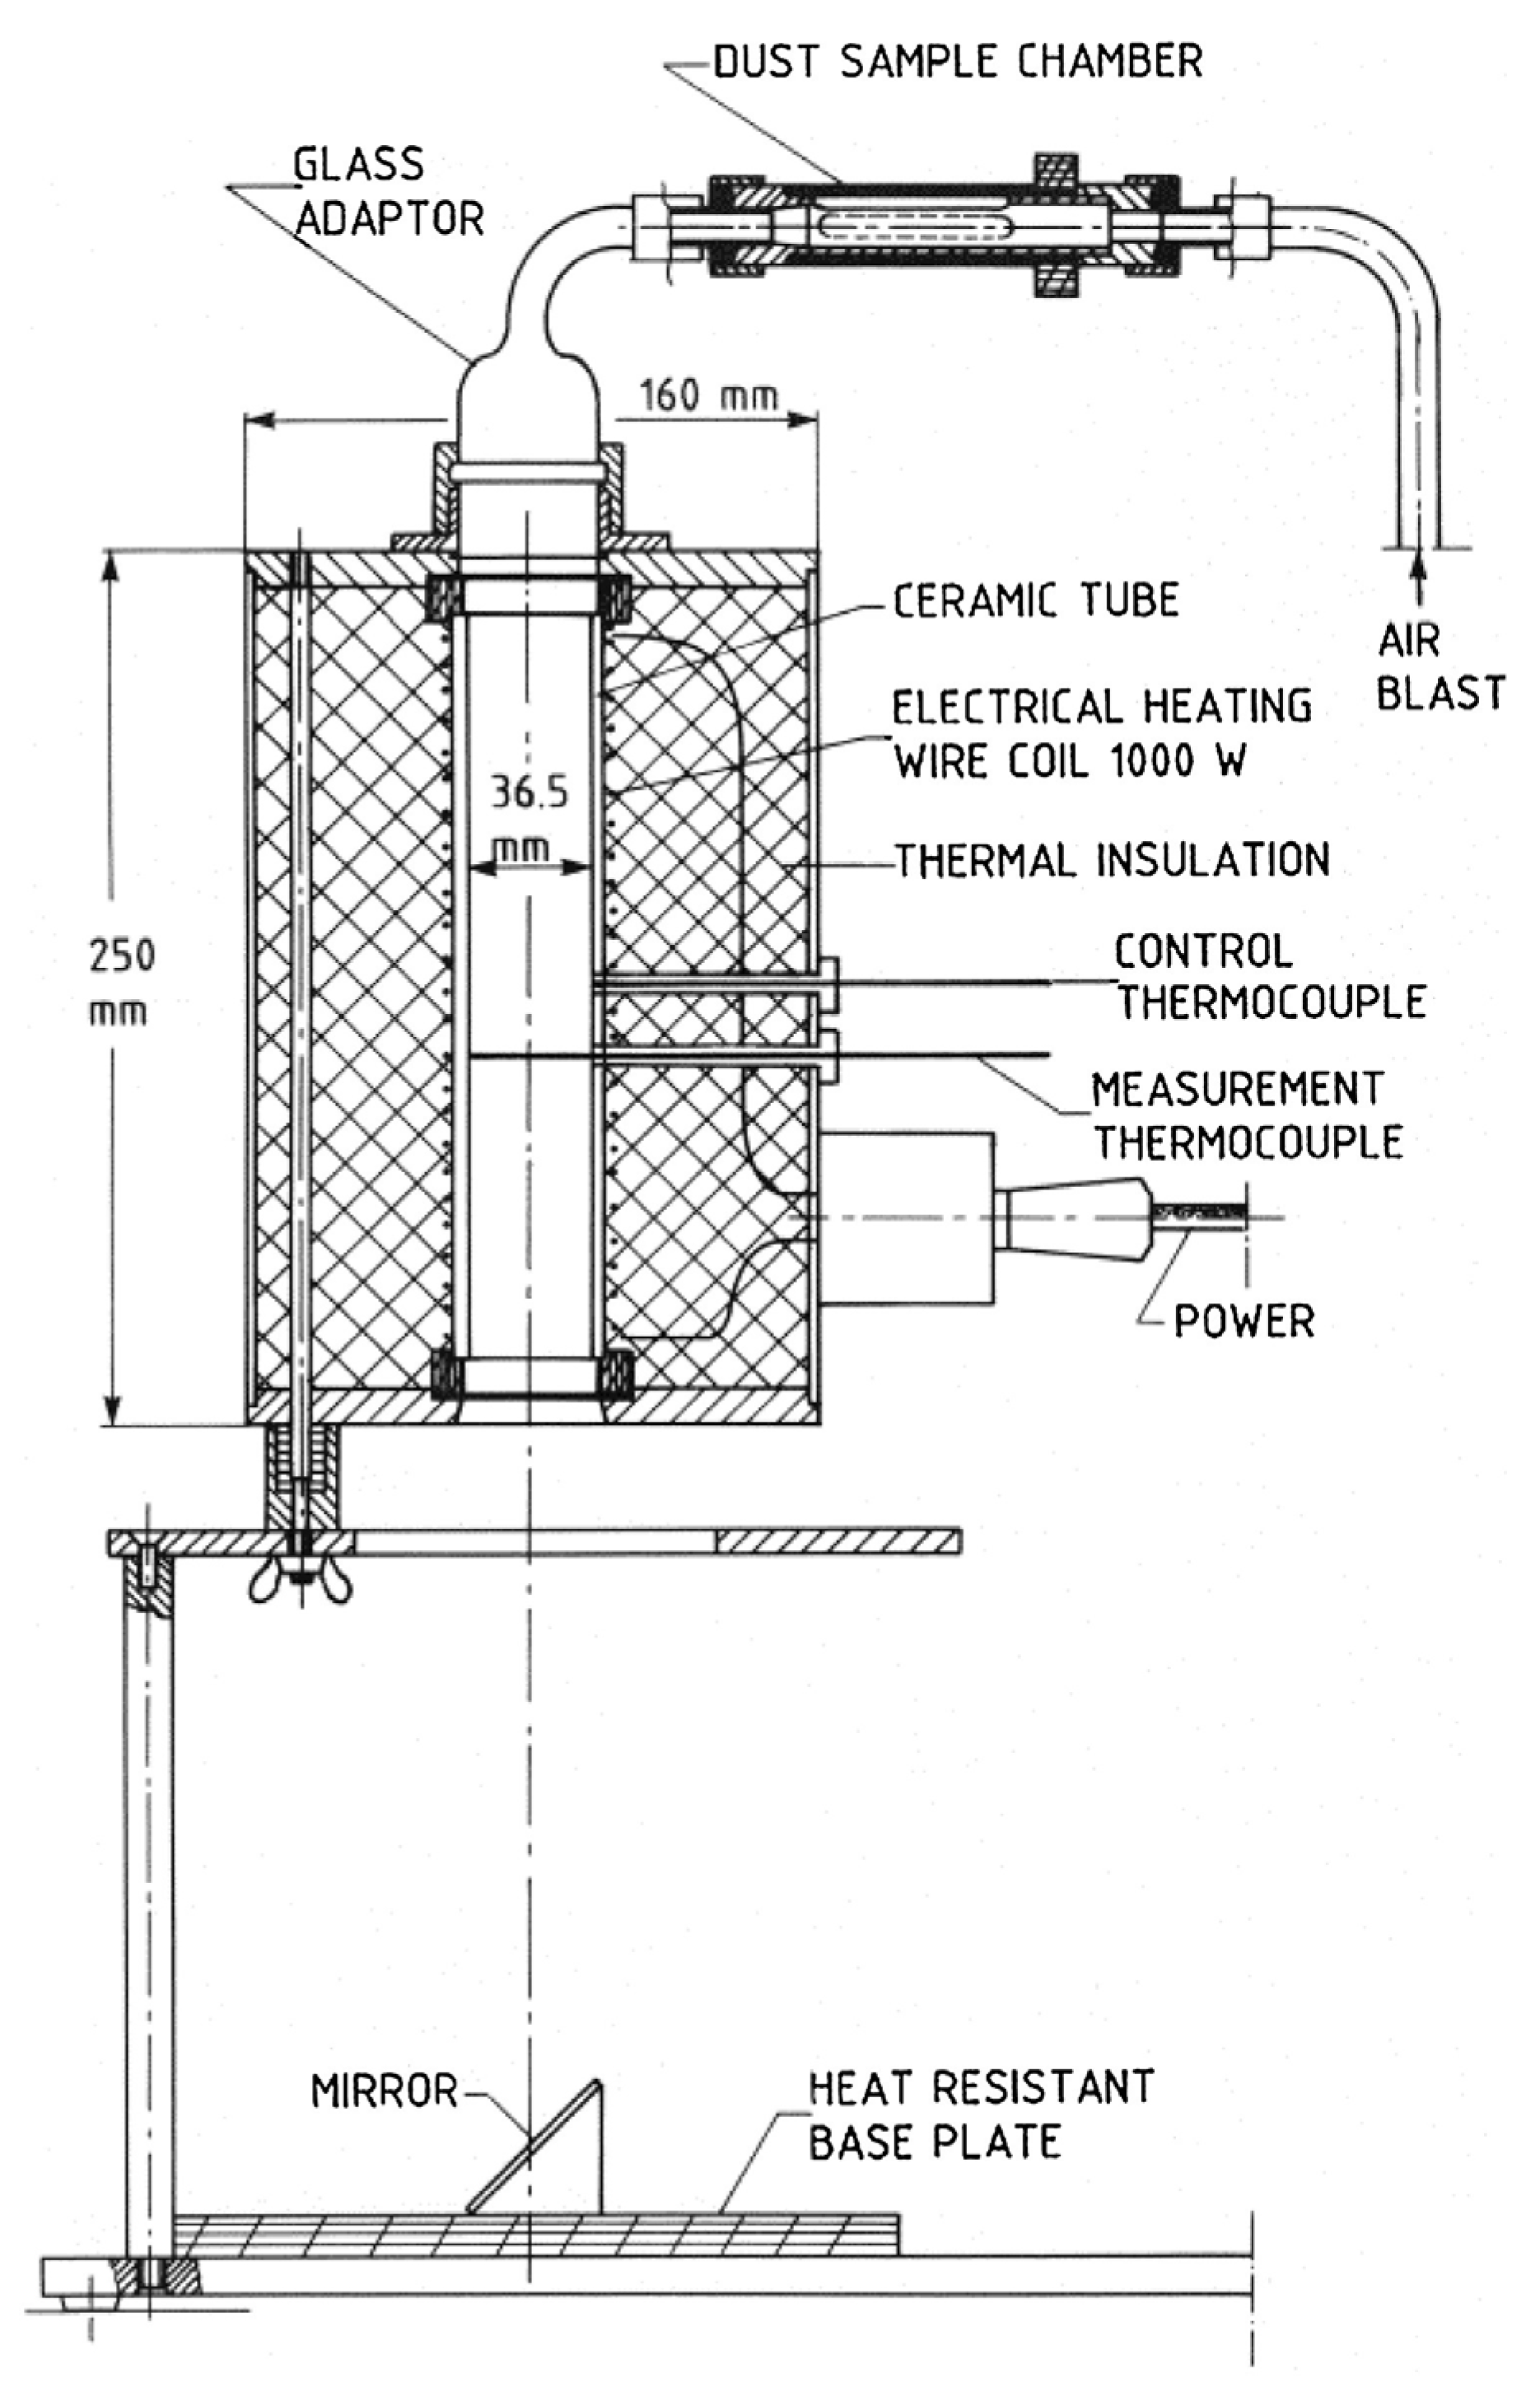
2.5. MIT of Dispersed Dust
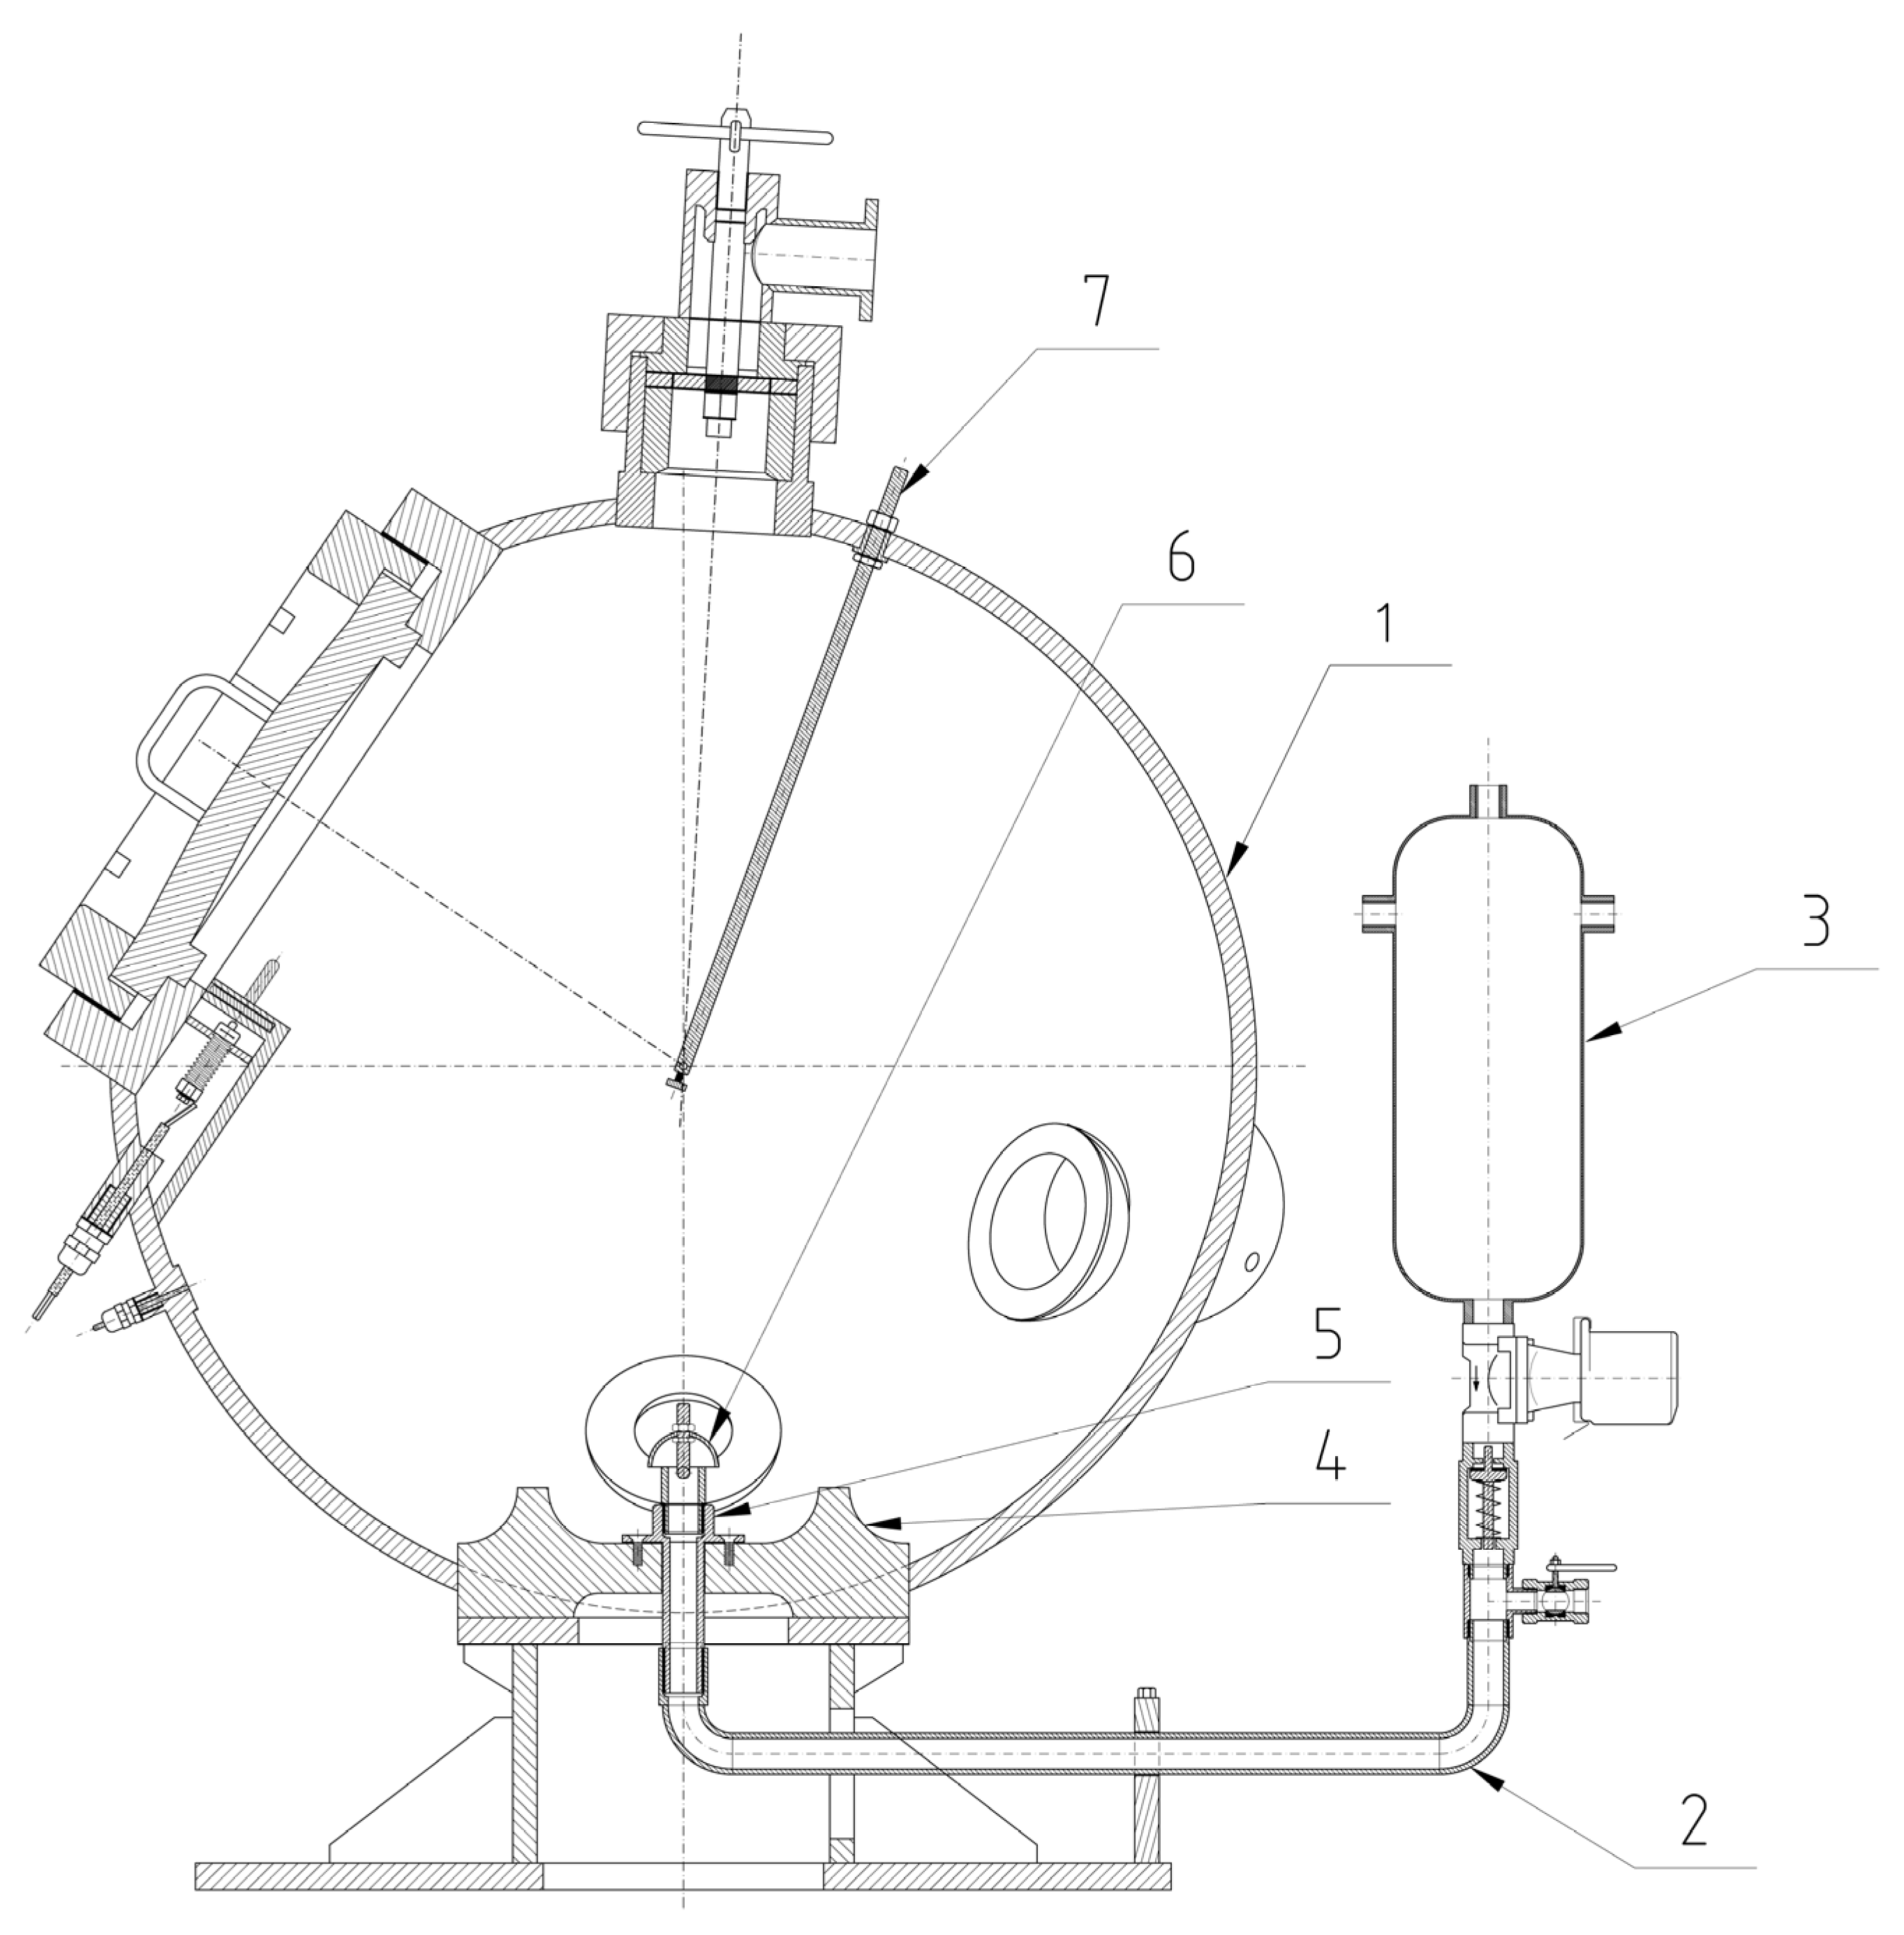
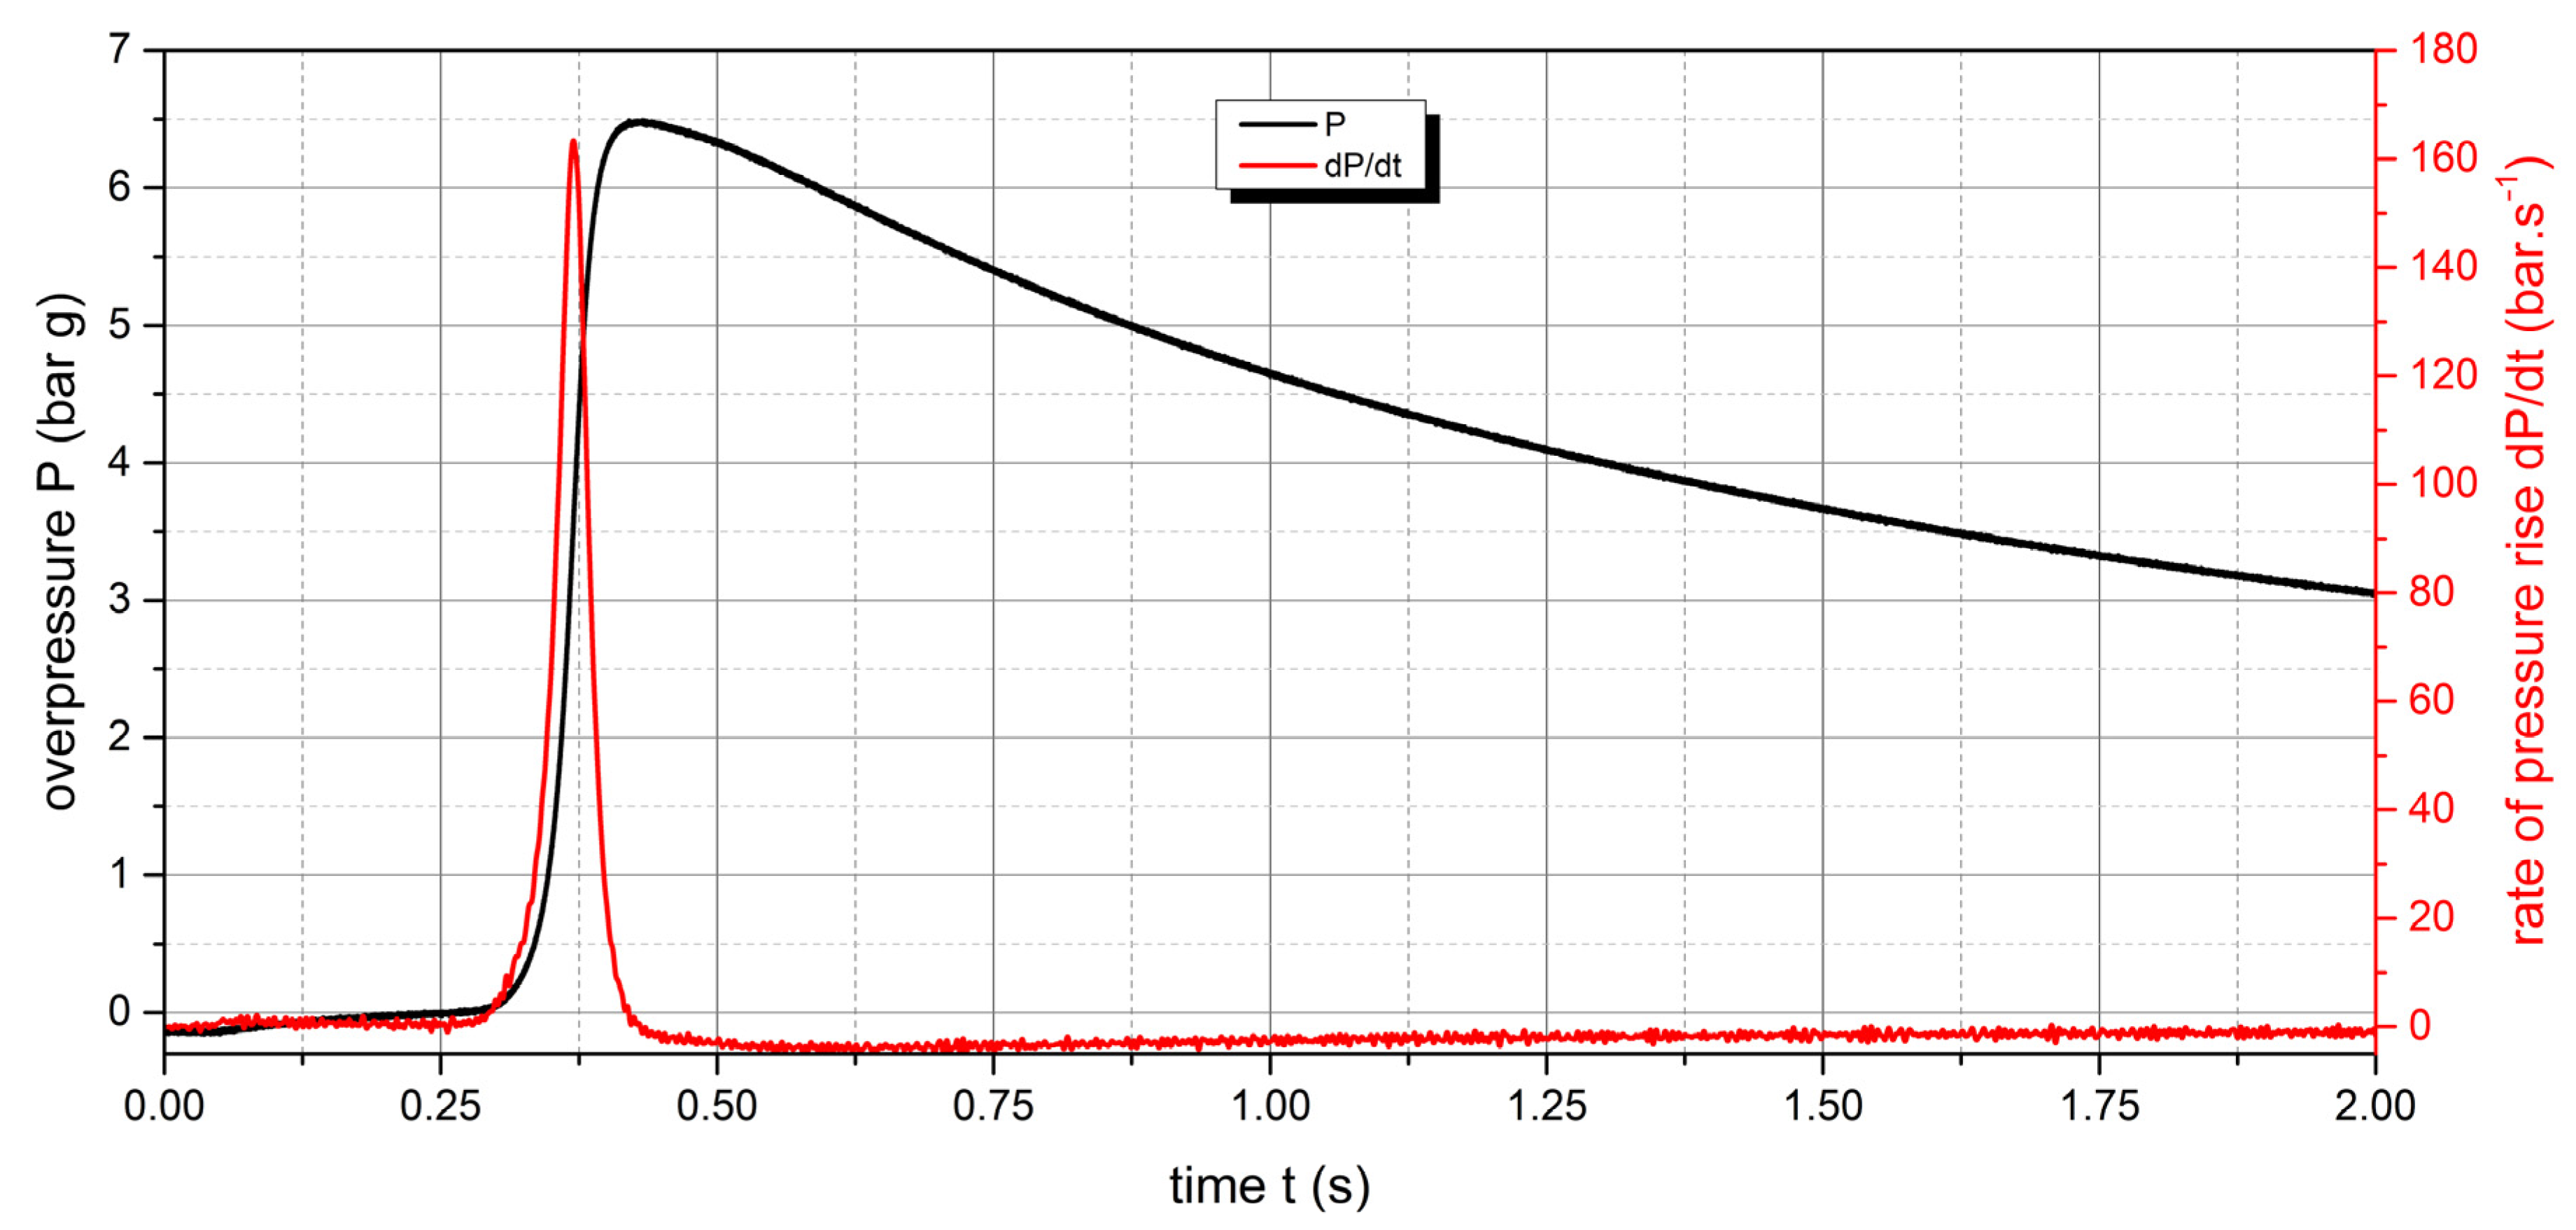
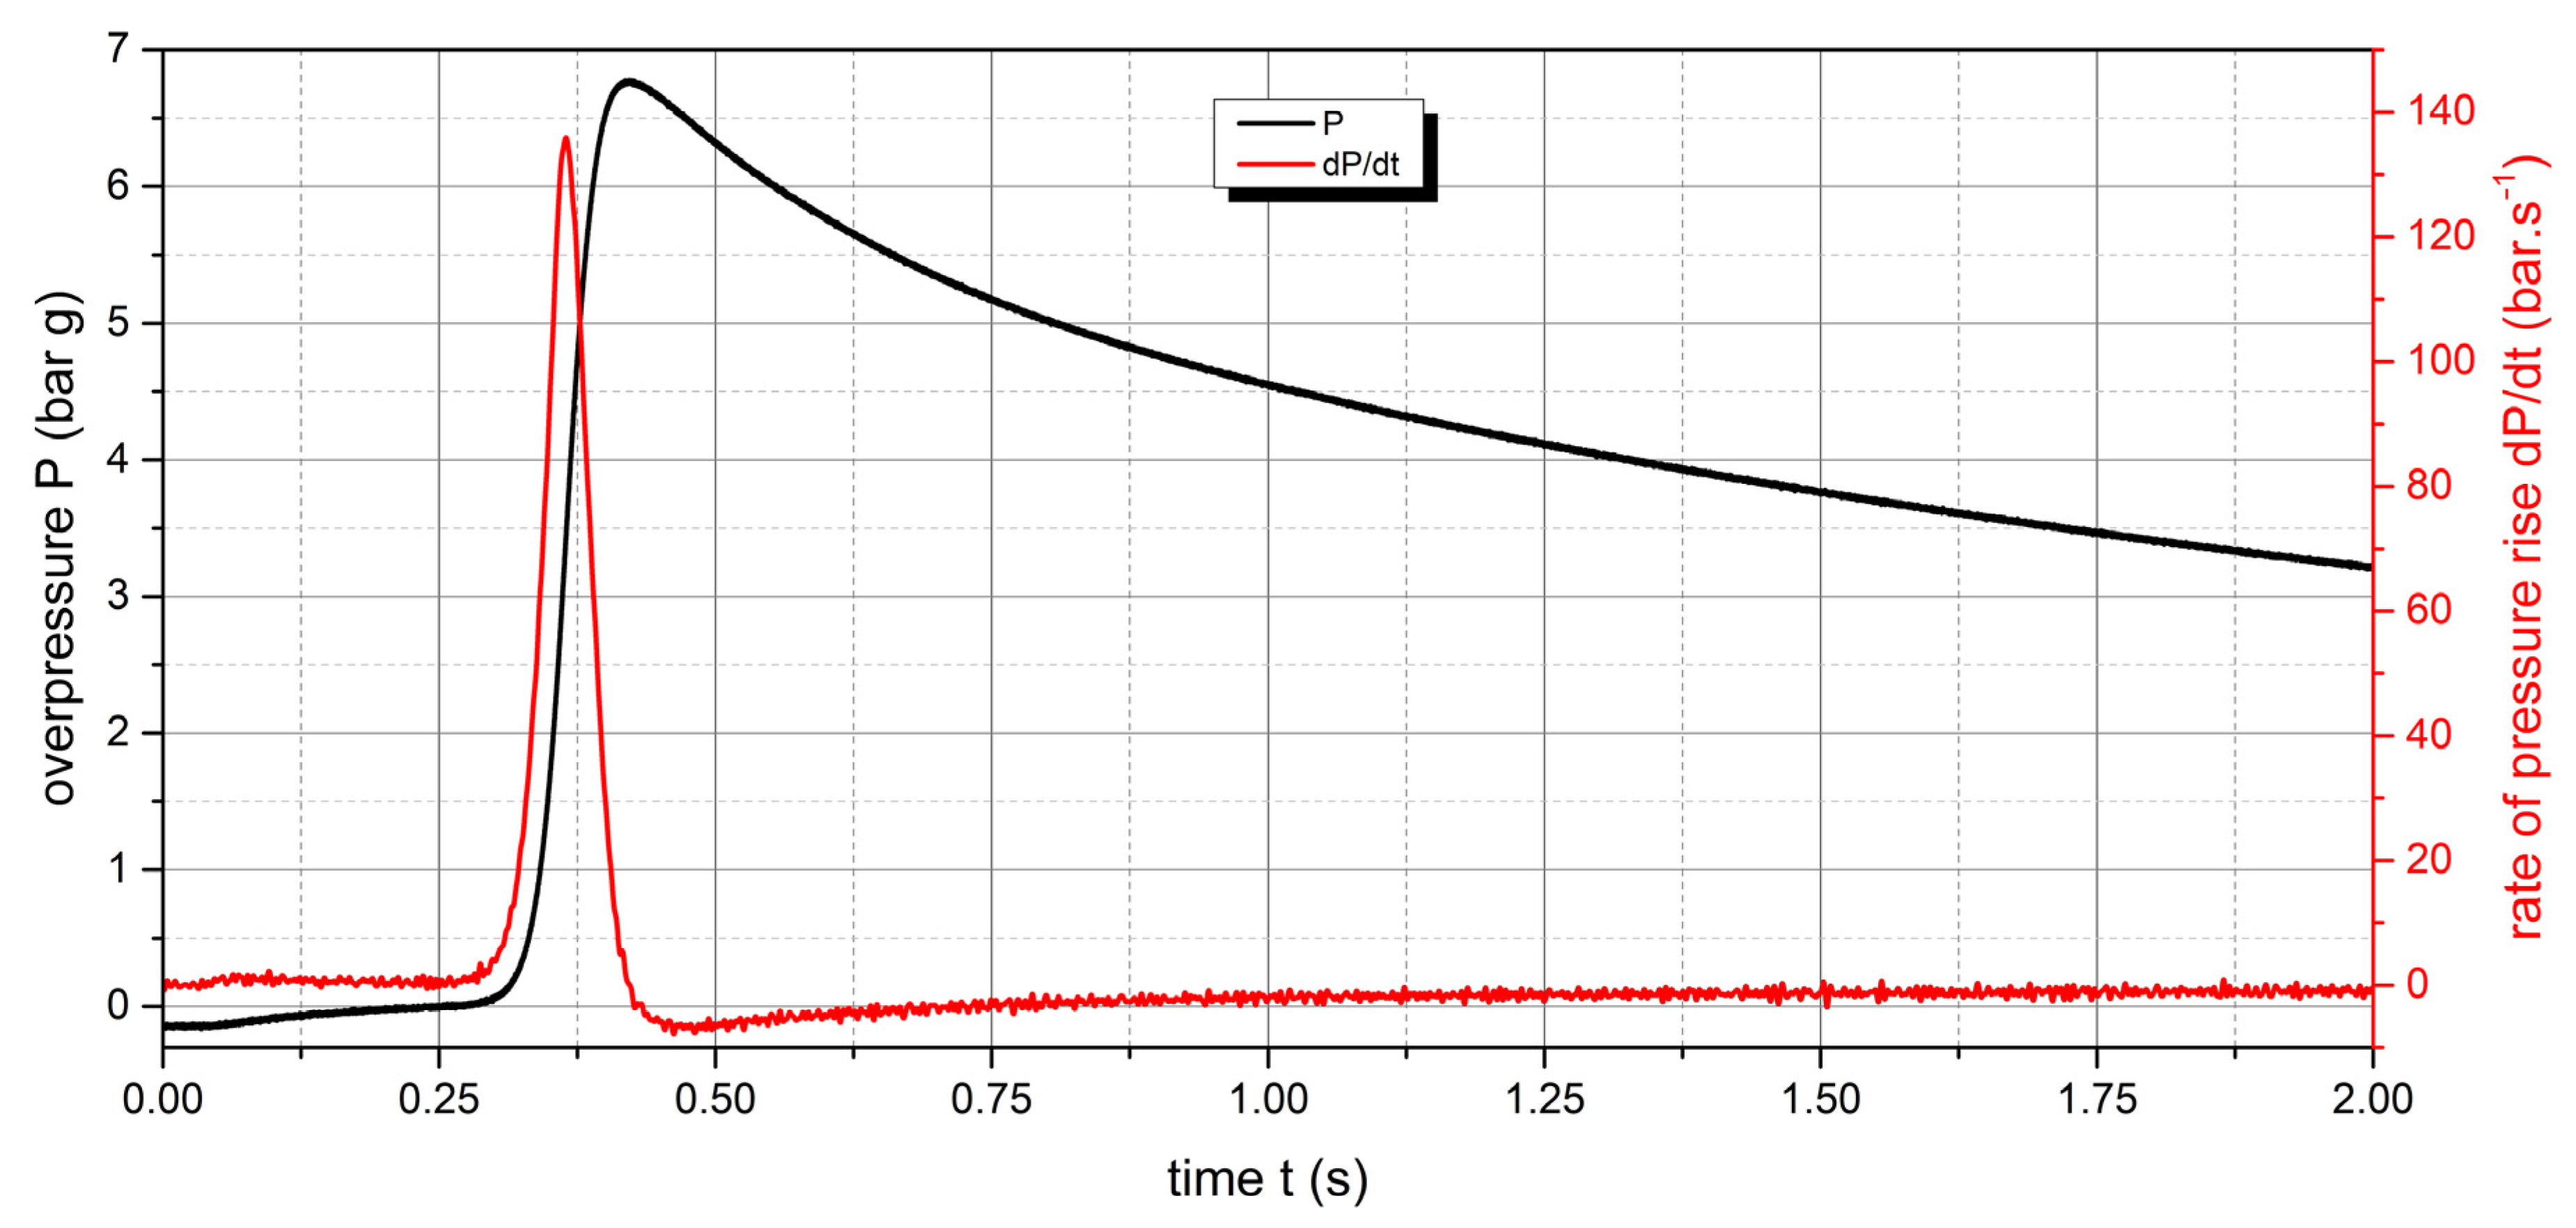
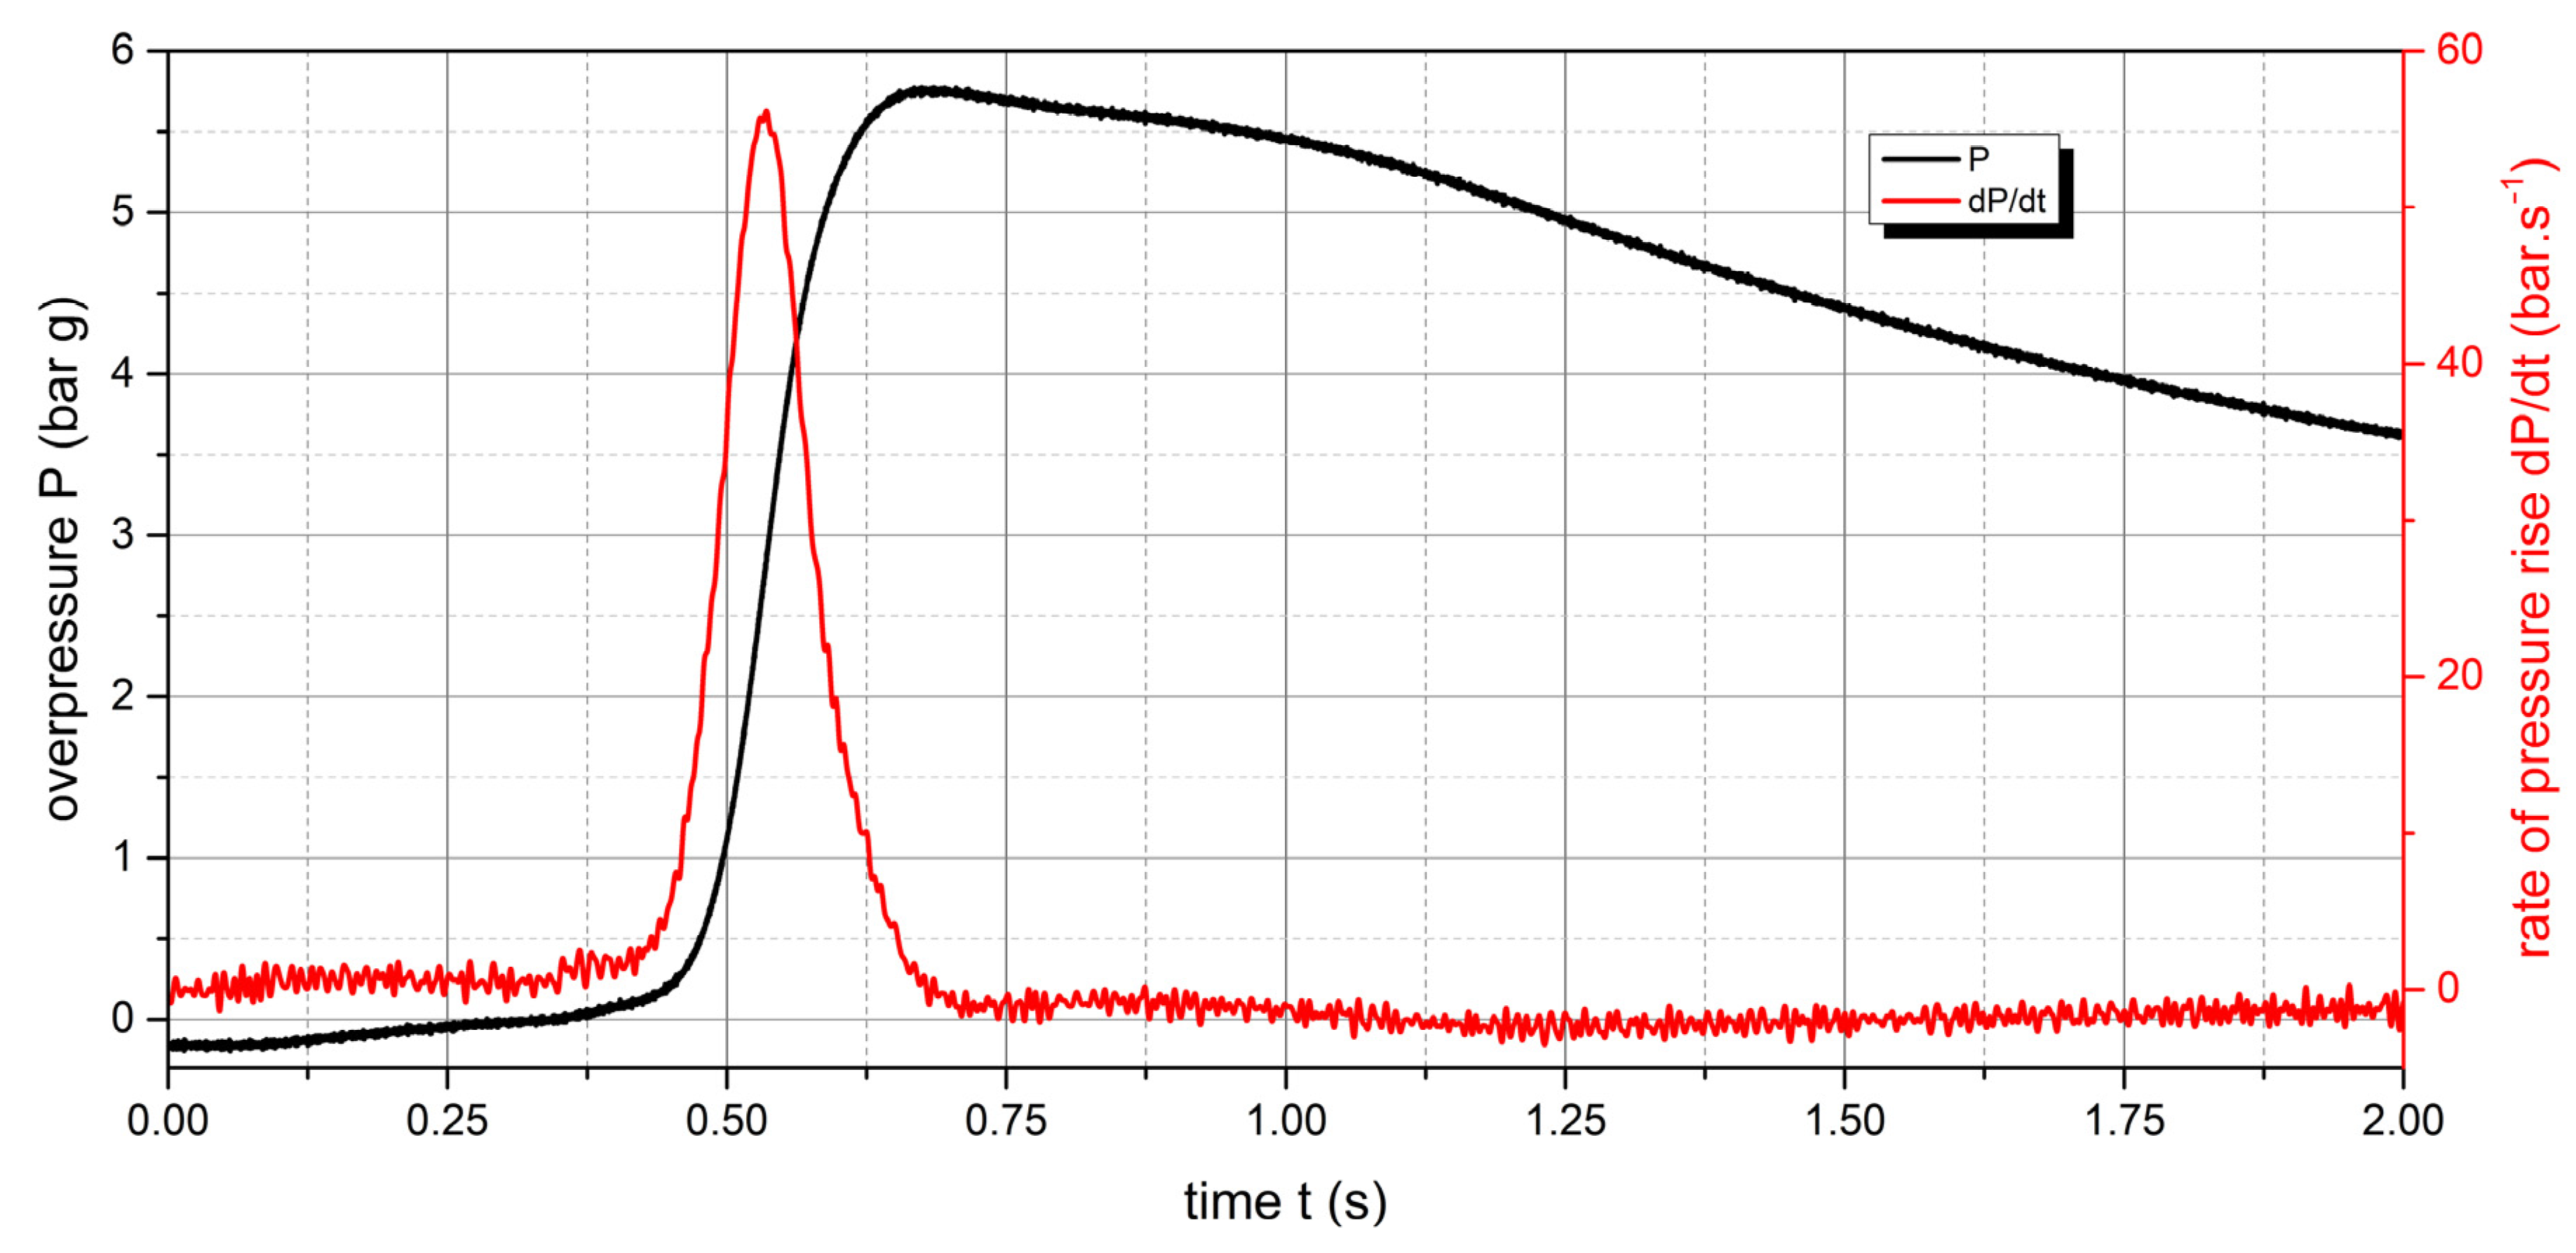
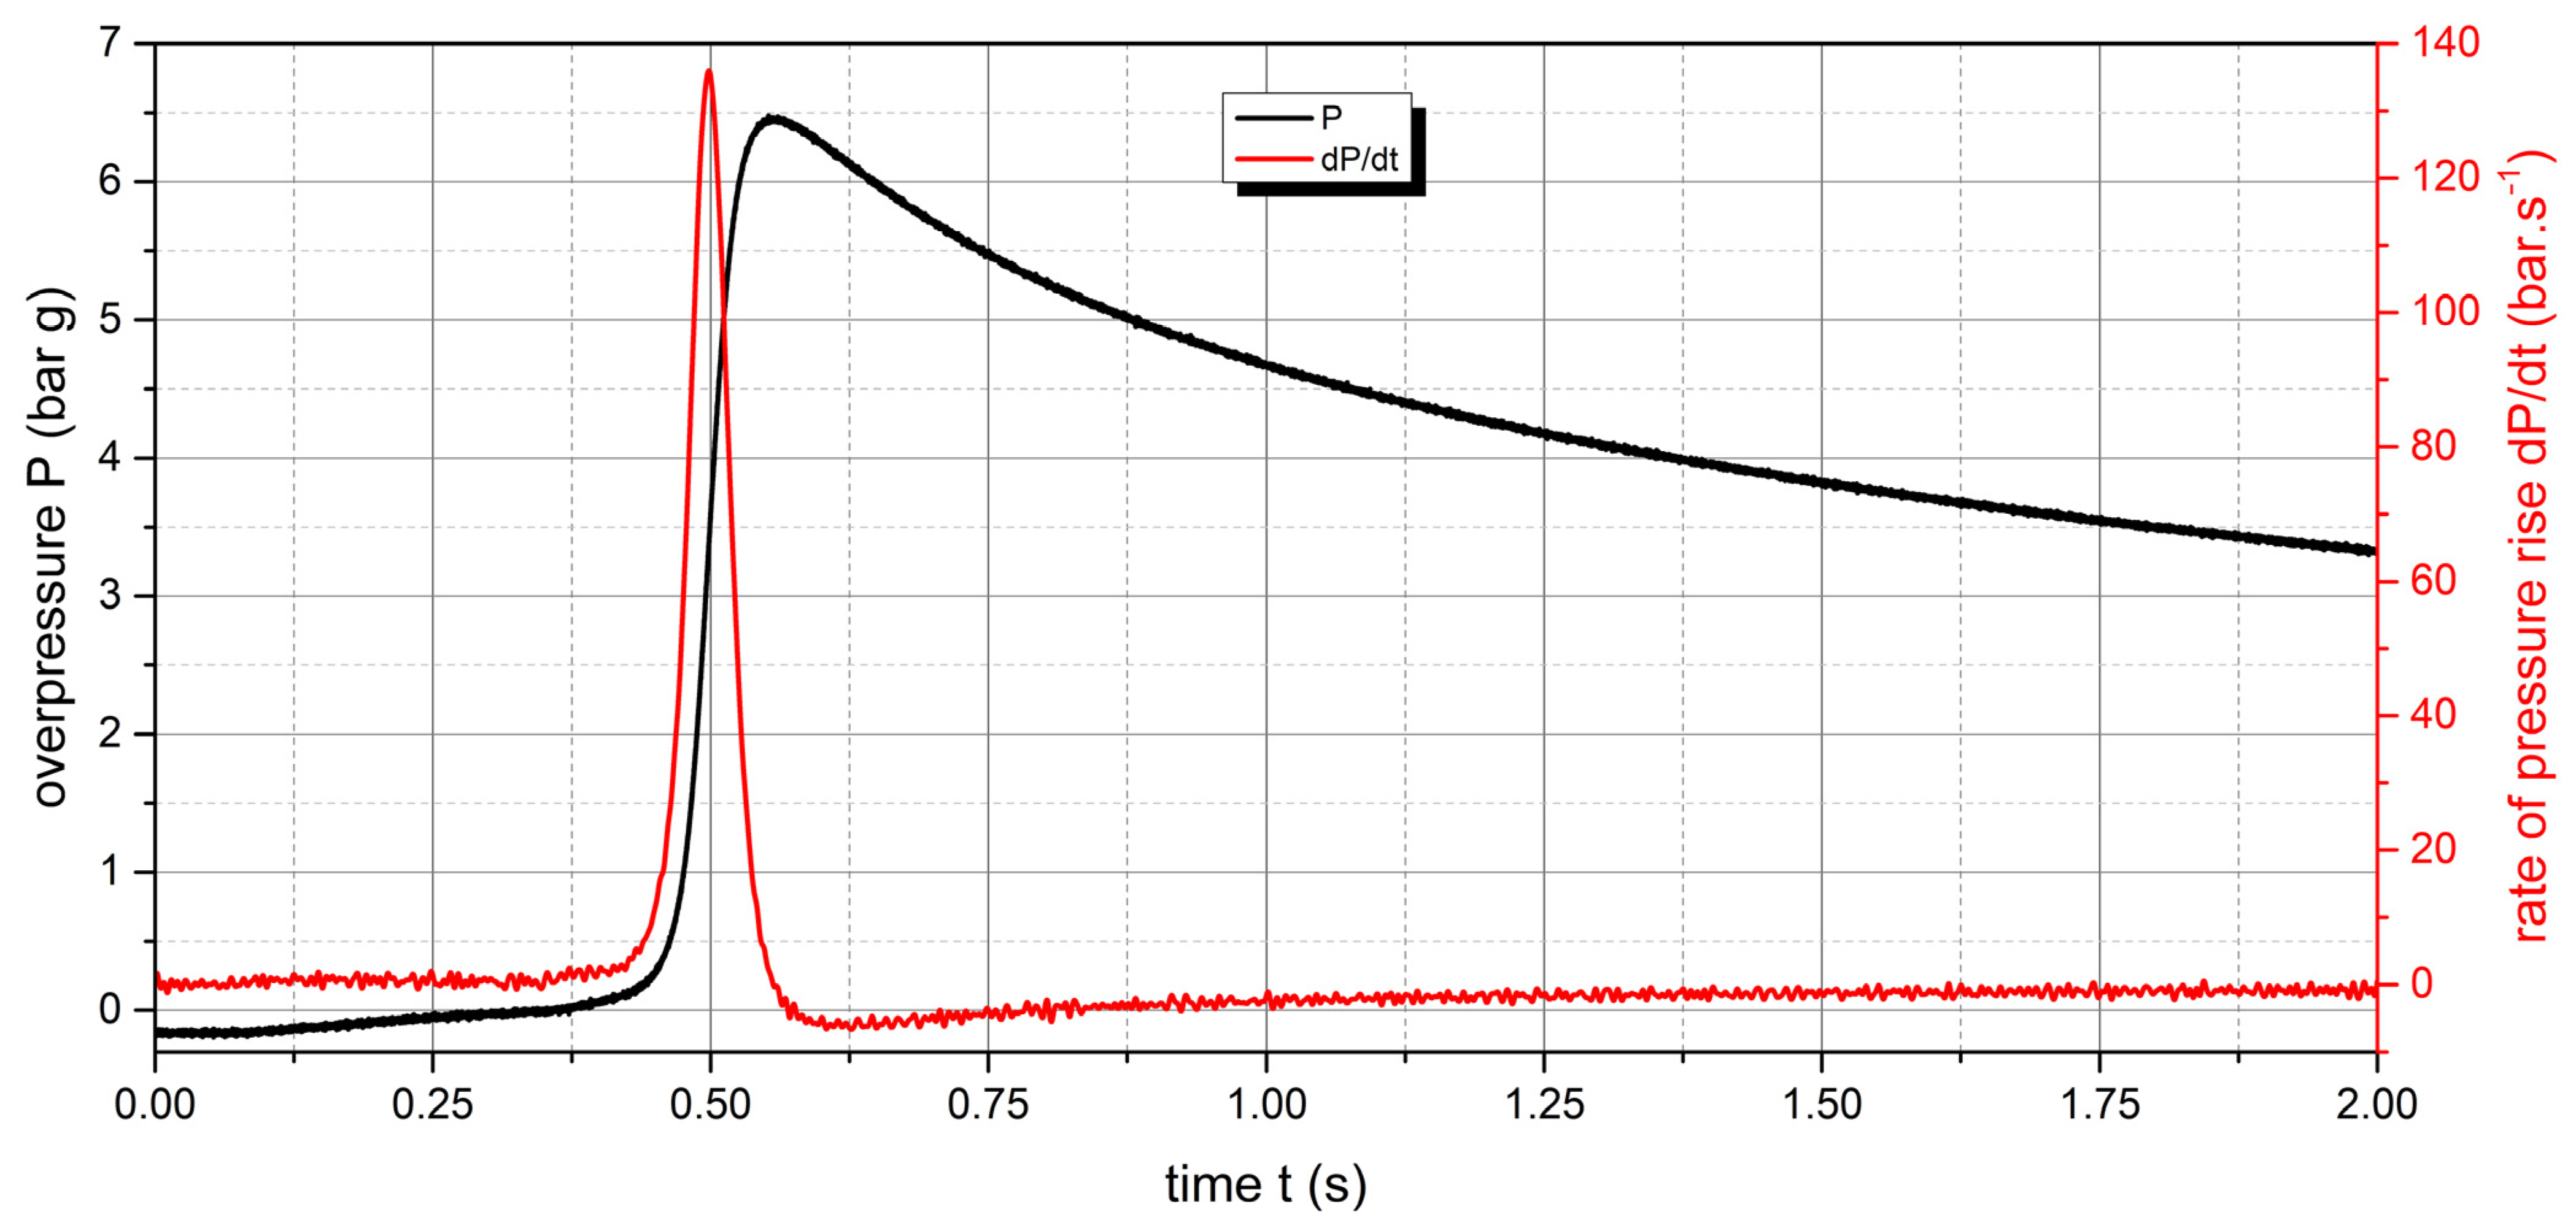
2.6. Explosion Parameters
3. Results and Discussion
4. Conclusions
Author Contributions
Funding
Institutional Review Board Statement
Data Availability Statement
Conflicts of Interest
References
- Vlachopoulos, J.; Strutt, D. Polymer processing. Mater. Sci. Technol. 2003, 19, 1161–1169. [Google Scholar] [CrossRef]
- Manju Kumari Thakur, E. Handbook of Sustainable Polymers: Processing and Applications; CRC Press: Boca Raton, FL, USA, 2016. [Google Scholar]
- González-Henríquez, C.M.; Sarabia-Vallejos, M.A.; Rodriguez-Hernandez, J. Polymers for additive manufacturing and 4D-printing: Materials, methodologies, and biomedical applications. Prog. Polym. Sci. 2019, 94, 57–116. [Google Scholar] [CrossRef]
- Abbasi, T.; Abbasi, S.A. Dust explosions—Cases, causes, consequences, and control. J. Hazard. Mater. 2007, 140, 7–44. [Google Scholar] [CrossRef]
- Eckhoff, R.K. Dust Explosions in the Process Industries, 3rd ed.; Gulf Professional Publishing: Houston, TX, USA, 2003. [Google Scholar]
- Wei, M.C.; Cheng, Y.C.; Lin, Y.Y.; Kuo, W.K.; Shu, C.M. Applications of dust explosion hazard and disaster prevention technology. J. Loss Prev. Process Ind. 2020, 68, 104304. [Google Scholar] [CrossRef]
- Jerdy, A.C.; Pham, T.; González-Borja, M.Á.; Atallah, P.; Soules, D.; Abbott, R.; Lobban, L.; Crossley, S. Impact of the presence of common polymer additives in thermal and catalytic polyethylene decomposition. Appl. Catal. B Environ. 2023, 325, 122348. [Google Scholar] [CrossRef]
- Babrauskas, V.; Fuoco, R.; Blum, A. Chapter 3—Flame Retardant Additives in Polymers: When Do the Fire Safety Benefits Outweigh the Toxicity Risks? Papaspyrides, C.D., Kiliaris, P., Eds.; Polymer Green Flame Retardants; Elsevier: Amsterdam, The Netherlands, 2014; pp. 87–118. ISBN 9780444538086. [Google Scholar] [CrossRef]
- Ao, X.; Vázquez-López, A.; Mocerino, D.; González, C.; Wang, D.Y. Flame retardancy and fire mechanical properties for natural fiber/polymer composite: A review. Compos. Part B Eng. 2023, 111069. [Google Scholar] [CrossRef]
- Vidlička, M.; Balog, K.; Dudáček, A.; Chudová, D. Explosion Supression of Combustible Polymer Dust in the Fabric Filter. Int. J. Environ. Sci. 2022, 8. [Google Scholar]
- Bernard, S.; Youinou, L.; Gillard, P. MIE determination and thermal degradation study of PA12 polymer powder used for laser sintering. J. Loss Prev. Process Ind. 2013, 26, 1493–1500. [Google Scholar] [CrossRef]
- Kuracina, R.; Szabová, Z.; Škvarka, M. Study into parameters of the dust explosion ignited by an improvised explosion device filled with organic peroxide. Process Saf. Environ. Prot. 2021, 155, 98–107. [Google Scholar] [CrossRef]
- STN EN 14034-A1; Determination of Properties of Combustible Dust during Explosion. Part 1: Determination of the Maximum Pressure Pmax during Combustible Dust Explosion. Slovak Standards Institute: Bratislava, Slovakia, 2011.
- ISO/IEC 80079-20-2; British and Institution Standards, Explosive Atmospheres—Part 20—2: Material Characteristics—Combustible Dusts Test Methods. ISO: London, UK, 2016.
- Kukfisz, B.; Dowbysz, A.; Samsonowicz, M.; Markowska, D.; Maranda, A. Comparative Analysis of Fire and Explosion Properties of Lycopodium Powder. Energies 2023, 16, 6121. [Google Scholar] [CrossRef]
- Amyotte, P. An Introduction to Dust Explosions. Understanding the Myths and Realities of Dust Explosions for a Safer Workplace; Elsevier: Amsterdam, The Netherlands, 2013; 280p, ISBN 9780123970077. [Google Scholar]
- Technical data sheet. Polyamide 12, Reichelt Chemietechnik—Web Page. 2023. Available online: https://www.rct-online.de/en/RctGlossar/detail/id/10 (accessed on 13 June 2023).
- Vestosint. Polyamide 12 Powders for Demanding Couting Applicatiobs. 2023. Available online: https://www.vestosint.com/en/download (accessed on 11 June 2023).
- Vasquez, M.; Haworth, B.; Hopkinson, N. Methods for Quantifying the Stable Sintering Region in Laser Sintered Polyamide-12. Polym. Eng. Sci. 2013, 53, 1131–1356. [Google Scholar] [CrossRef]
- Kuracina, R.; Szabová, Z.; Buranská, E.; Pastierová, A.; Gogola, P.; Buranský, I. Determination of fire parameters of polyamide 12 powder for additive technologies. Polymers 2021, 13, 3014. [Google Scholar] [CrossRef] [PubMed]
- Wholers Report. 3D Printing and Additive Manufacturing State of the Industry. 2020. Available online: https://wohlersassociates.com/2020report.htm (accessed on 15 August 2023).
- Özbay Kısasöz, B.; Serhatlı, I.E.; Bulduk, M.E. Selective Laser Sintering Manufacturing and Characterization of Lightweight PA 12 Polymer Composites with Different Hollow Microsphere Additives. J. Mater. Eng. Perform. 2022, 31, 4049–4059. [Google Scholar] [CrossRef]
- Plasty a Riešenie. Plastoplant SK. 2023. Available online: https://www.plastoplan.sk/ (accessed on 20 May 2023).
- Polypropylene SE523MO. Borealis. 2023. Available online: https://www.material-safety-sheet.com/companies/borealisgroup.html (accessed on 15 May 2023).
- Chen, X.S.; Yu, Z.Z.; Liu, W.; Zhang, S. Synergistic effect of decabromodiphenyl ethane and montmorillonite on flame retardancy of polypropylene. Polym. Degrad. Stab. 2009, 94, 1520–1525. [Google Scholar] [CrossRef]
- Yang, J.; Yu, Y.; Li, Y.; Zhang, Q.; Zheng, L.; Luo, T.; Suo, Y.; Jiang, J. Inerting effects of ammonium polyphosphate on explosion characteristics of polypropylene dust. Process Saf. Environ. Prot. 2019, 130, 221–230. [Google Scholar] [CrossRef]
- Pasquini, N. Polypropylene handbook. Choice Rev. Online 2006, 43, 43–2825. [Google Scholar] [CrossRef]
- Maddah, H.A. Polypropylene as a Promising Plastic: A Review. Am. J. Polym. Sci. 2016, 6, 1–11. [Google Scholar]
- Technical data sheet. Ultra-High Molecular Weight Polyethylene—Technical Data Sheet, Celanese—Web Page. 2023. Available online: https://materials.celanese.com/ (accessed on 1 June 2023).
- Kaya, N.; Oztarhan, A.M.; Urkac, E.S.; Ila, D.; Budak, S.; Oks, E.; Nikolaev, A.; Exdesir, A.; Tihminlioglu, F.; Tek, Z.; et al. Polymeric thermal analysis of C + H and C + H + Ar ion implanted UHMWPE samples. Nucl. Instrum. Methods Phys. Res. Sect. B Beam Interact. Mater. At. 2007, 261, 711–714. [Google Scholar] [CrossRef]
- Shtertser, A.; Zlobin, B.; Kiselev, V.; Shemelin, S.; Ukhina, A.; Dudina, D. Cyclic Impact Compaction of an Ultra High Molecular Weight Polyethylene (UHMWPE) Powder and Properties of the Compacts. Materials 2022, 15, 6706. [Google Scholar] [CrossRef]
- Jauffrès, D.; Lame, O.; Vigier, G.; Doré, F. Microstructural origin of physical and mechanical properties of ultra high molecular weight polyethylene processed by high velocity compaction. Polymer 2007, 48, 6374–6383. [Google Scholar] [CrossRef]
- EN 933-1:2012; Tests for Geometrical Properties of Aggregates. CEN: Brussels, Belgium, 2012.
- Simha Martynková, G.; Slíva, A.; Kratošová, G.; Čech Barabaszová, K.; Študentová, S.; Klusák, J.; Brožová, S.; Dokoupil, T.; Holešová, S. Polyamide 12 materials study of morpho-structural changes during laser sintering of 3d printing. Polymers 2021, 13, 810. [Google Scholar] [CrossRef]
- Salmoria, G.V.; Paggi, R.A.; Lago, A.; Beal, V.E. Microstructural and mechanical characterization of PA12/MWCNTs nanocomposite manufactured by selective laser sintering. Polym. Test. 2011, 30, 611–615. [Google Scholar] [CrossRef]
- Ishikawa, T.; Nagai, S.; Kasai, N. Effect of Casting Conditions on Polymorphism of Nylon-12. J. Polym. Sci. Part A-2 Polym. Phys. 1980, 18, 291–299. [Google Scholar] [CrossRef]
- Liu, Y.; Zhu, L.; Zhou, L.; Li, Y. Microstructure and mechanical properties of reinforced polyamide 12 composites prepared by laser additive manufacturing. Rapid Prototyp. J. 2019, 25, 1127–1134. [Google Scholar] [CrossRef]
- Androsch, R.; Stolp, M.; Radusch, H.J. Simultaneous X-ray diffraction and differential thermal analysis of polymers. Thermochim. Acta 1996, 271, 1–8. [Google Scholar] [CrossRef]
- Schmid, M.; Kleijnen, R.; Vetterli, M.; Wegener, K. Influence of the origin of polyamide 12 powder on the laser sintering process and laser sintered parts. Appl. Sci. 2017, 7, 462. [Google Scholar] [CrossRef]
- Nishino, T.; Matsumoto, T.; Nakamae, K. Surface structure of isotactic polypropylene by X-ray diffraction. Polym. Eng. Sci. 2000, 40, 336–343. [Google Scholar] [CrossRef]
- Clark, E.S. Physical Properties of Materials, 2nd ed.; CRC Press: Boca Raton, FL, USA, 2007. [Google Scholar]
- Andrić, Ž.; Dramićanin, M.D.; Jokanović, V.; Dramićanin, T.; Mitrić, M.; Viana, B. Luminescent properties of nano-SiO2:Eu3+/polypropylene composite. J. Optoelectron. Adv. Mater. 2006, 8, 829–834. [Google Scholar]
- Wang, S.; Ajji, A.; Guo, S.; Xiong, C. Preparation of microporous polypropylene/titanium dioxide composite membranes with enhanced electrolyte uptake capability via melt extruding and stretching. Polymers 2017, 9, 110. [Google Scholar] [CrossRef]
- Somani, R.H.; Hsiao, B.S.; Nogales, A.; Fruitwala, H.; Srinivas, S.; Tsou, A.H. Structure development during shear flow induced crystallization of i-PP: In situ wide-angle X-ray diffraction study. Macromolecules 2001, 34, 5902–5909. [Google Scholar] [CrossRef]
- Machado, G.; Denardin, E.L.G.; Kinast, E.J.; Gonçalves, M.C.; De Luca, M.A.; Teixeira, S.R.; Samios, D. Crystalline properties and morphological changes in plastically deformed isotatic polypropylene evaluated by X-ray diffraction and transmission electron microscopy. Eur. Polym. J. 2005, 41, 129–138. [Google Scholar] [CrossRef]
- Zhu, B.; Liu, J.; Wang, T.; Han, M.; Valloppilly, S.; Xu, S.; Wang, X. Novel Polyethylene Fibers of Very High Thermal Conductivity Enabled by Amorphous Restructuring. ACS Omega 2017, 2, 3931–3944. [Google Scholar] [CrossRef]
- Stojilovic, N.; Dordevic, S.V.; Stojadinovic, S. Effects of clinical X-ray irradiation on UHMWPE films. Nucl. Instrum. Methods Phys. Res. Sect. B Beam Interact. Mater. At. 2017, 410, 139–143. [Google Scholar] [CrossRef]
- Fejdyś, M.; Łandwijt, M.; Kucharska-Jastrzabek, A.; Struszczyk, M.H. The effect of processing conditions on the performance of UHMWPE-fibre reinforced polymer matrix composites. Fibres Text. East. Eur. 2016, 24, 112–120. [Google Scholar] [CrossRef]
- Smith, B.C. The Infrared Spectra of Polymers II: Polyethylene. Spectroscopy 2021, 36, 24–29. [Google Scholar] [CrossRef]
- Fang, J.; Zhang, L.; Sutton, D.; Wang, X.; Lin, T. Needleless melt-electrospinning of polypropylene nanofibers. J. Nanomater. 2012, 2012, 382639. [Google Scholar] [CrossRef]
- Smith, B.C. The Infrared Spectra of Polymers III: Hydrocarbon Polymers. Spectroscopy 2021, 36, 22–25. [Google Scholar] [CrossRef]
- Bahrami, M.; Abenojar, J.; Martínez, M.A. Comparative characterization of hot-pressed polyamide 11 and 12: Mechanical, thermal and durability properties. Polymers 2021, 13, 3553. [Google Scholar] [CrossRef]
- Schuman, Y.; Hang, L. Thermal Degradation Study of Nylon 66 using Hyphenation Techniques TGA-MS and TGA-FTIR-GC/MS. J. Therm. Anal. Calorim. 2000, 59, 385–394. [Google Scholar]
- Smith, B.C. Infrared Spectroscopy of Polymers, XI: Introduction to Organic Nitrogen Polymers. Spectroscopy 2023, 38, 14–18. [Google Scholar] [CrossRef]
- Eckhoff, R.K. Origin and development of the Godbert-Greenwald furnace for measuring minimum ignition temperatures of dust clouds. Process Saf. Environ. Prot. 2019, 129, 17–24. [Google Scholar] [CrossRef]
- Kuracina, R.; Szabová, Z.; Bachratý, M.; Mynarz, M.; Škvarka, M. A new 365-litre dust explosion chamber: Design and testing. Powder Technol. 2021, 386, 420–427. [Google Scholar] [CrossRef]
- Kuracina, R.; Szabová, Z.; Kosár, L.; Sahul, M. Study into influence of different types of igniters on the explosion parameters of dispersed nitrocellulose powder. J. Loss Prev. Process Ind. 2023, 83, 105017. [Google Scholar] [CrossRef]
- Richter, F.; Rein, G. The Role of Heat Transfer Limitations in Polymer Pyrolysis at the Microscale. Front. Mech. Eng. 2018, 4, 20. [Google Scholar] [CrossRef]
- Dubdub, I.; Al-Yaari, M. Pyrolysis of Low Density Polyethylene: Kinetic Study Using TGA Data and ANN Prediction. Polymers 2020, 12, 891. [Google Scholar] [CrossRef] [PubMed]
- Awad, S.A.; Khalaf, E.M. Investigation of improvement of properties of polypropylene modified by nano silica composites. Compos. Commun. 2019, 12, 59–63. [Google Scholar] [CrossRef]
- Jiang, L.; Zhou, Z.; Xiang, H.; Yang, Y.; Tian, H.; Wang, J. Characteristics and synergistic effects of co-pyrolysis of microalgae with polypropylene. Fuel 2022, 314, 122765. [Google Scholar] [CrossRef]


| Sieve Size (µm) | Sample | |||||
|---|---|---|---|---|---|---|
| Polyamide 12 | UMHW Polyethylene | Polypropylene | ||||
| % w/w | Cumulative % | % w/w | Cumulative % | % w/w | Cumulative % | |
| 500 | 0.08 | 100 | 32.64 | 100 | 0 | 100 |
| 355 | 0.14 | 99.92 | 29.34 | 67.36 | 1.61 | 100 |
| 250 | 0.58 | 99.78 | 21.18 | 38.02 | 8.11 | 98.39 |
| 180 | 12.11 | 99.2 | 7.42 | 16.84 | 14.86 | 90.28 |
| 125 | 43.62 | 87.09 | 6.04 | 9.42 | 19.98 | 75.42 |
| 90 | 35.12 | 43.47 | 1.47 | 3.38 | 24.09 | 55.44 |
| 63 | 7.23 | 8.35 | 1.29 | 1.91 | 17.81 | 31.35 |
| 45 | 0.91 | 1.12 | 0.53 | 0.62 | 11.62 | 13.54 |
| <45 | 0.21 | 0.21 | 0.09 | 0.09 | 1.92 | 1.92 |
| median | 95 µm | 293 µm | 84 µm | |||
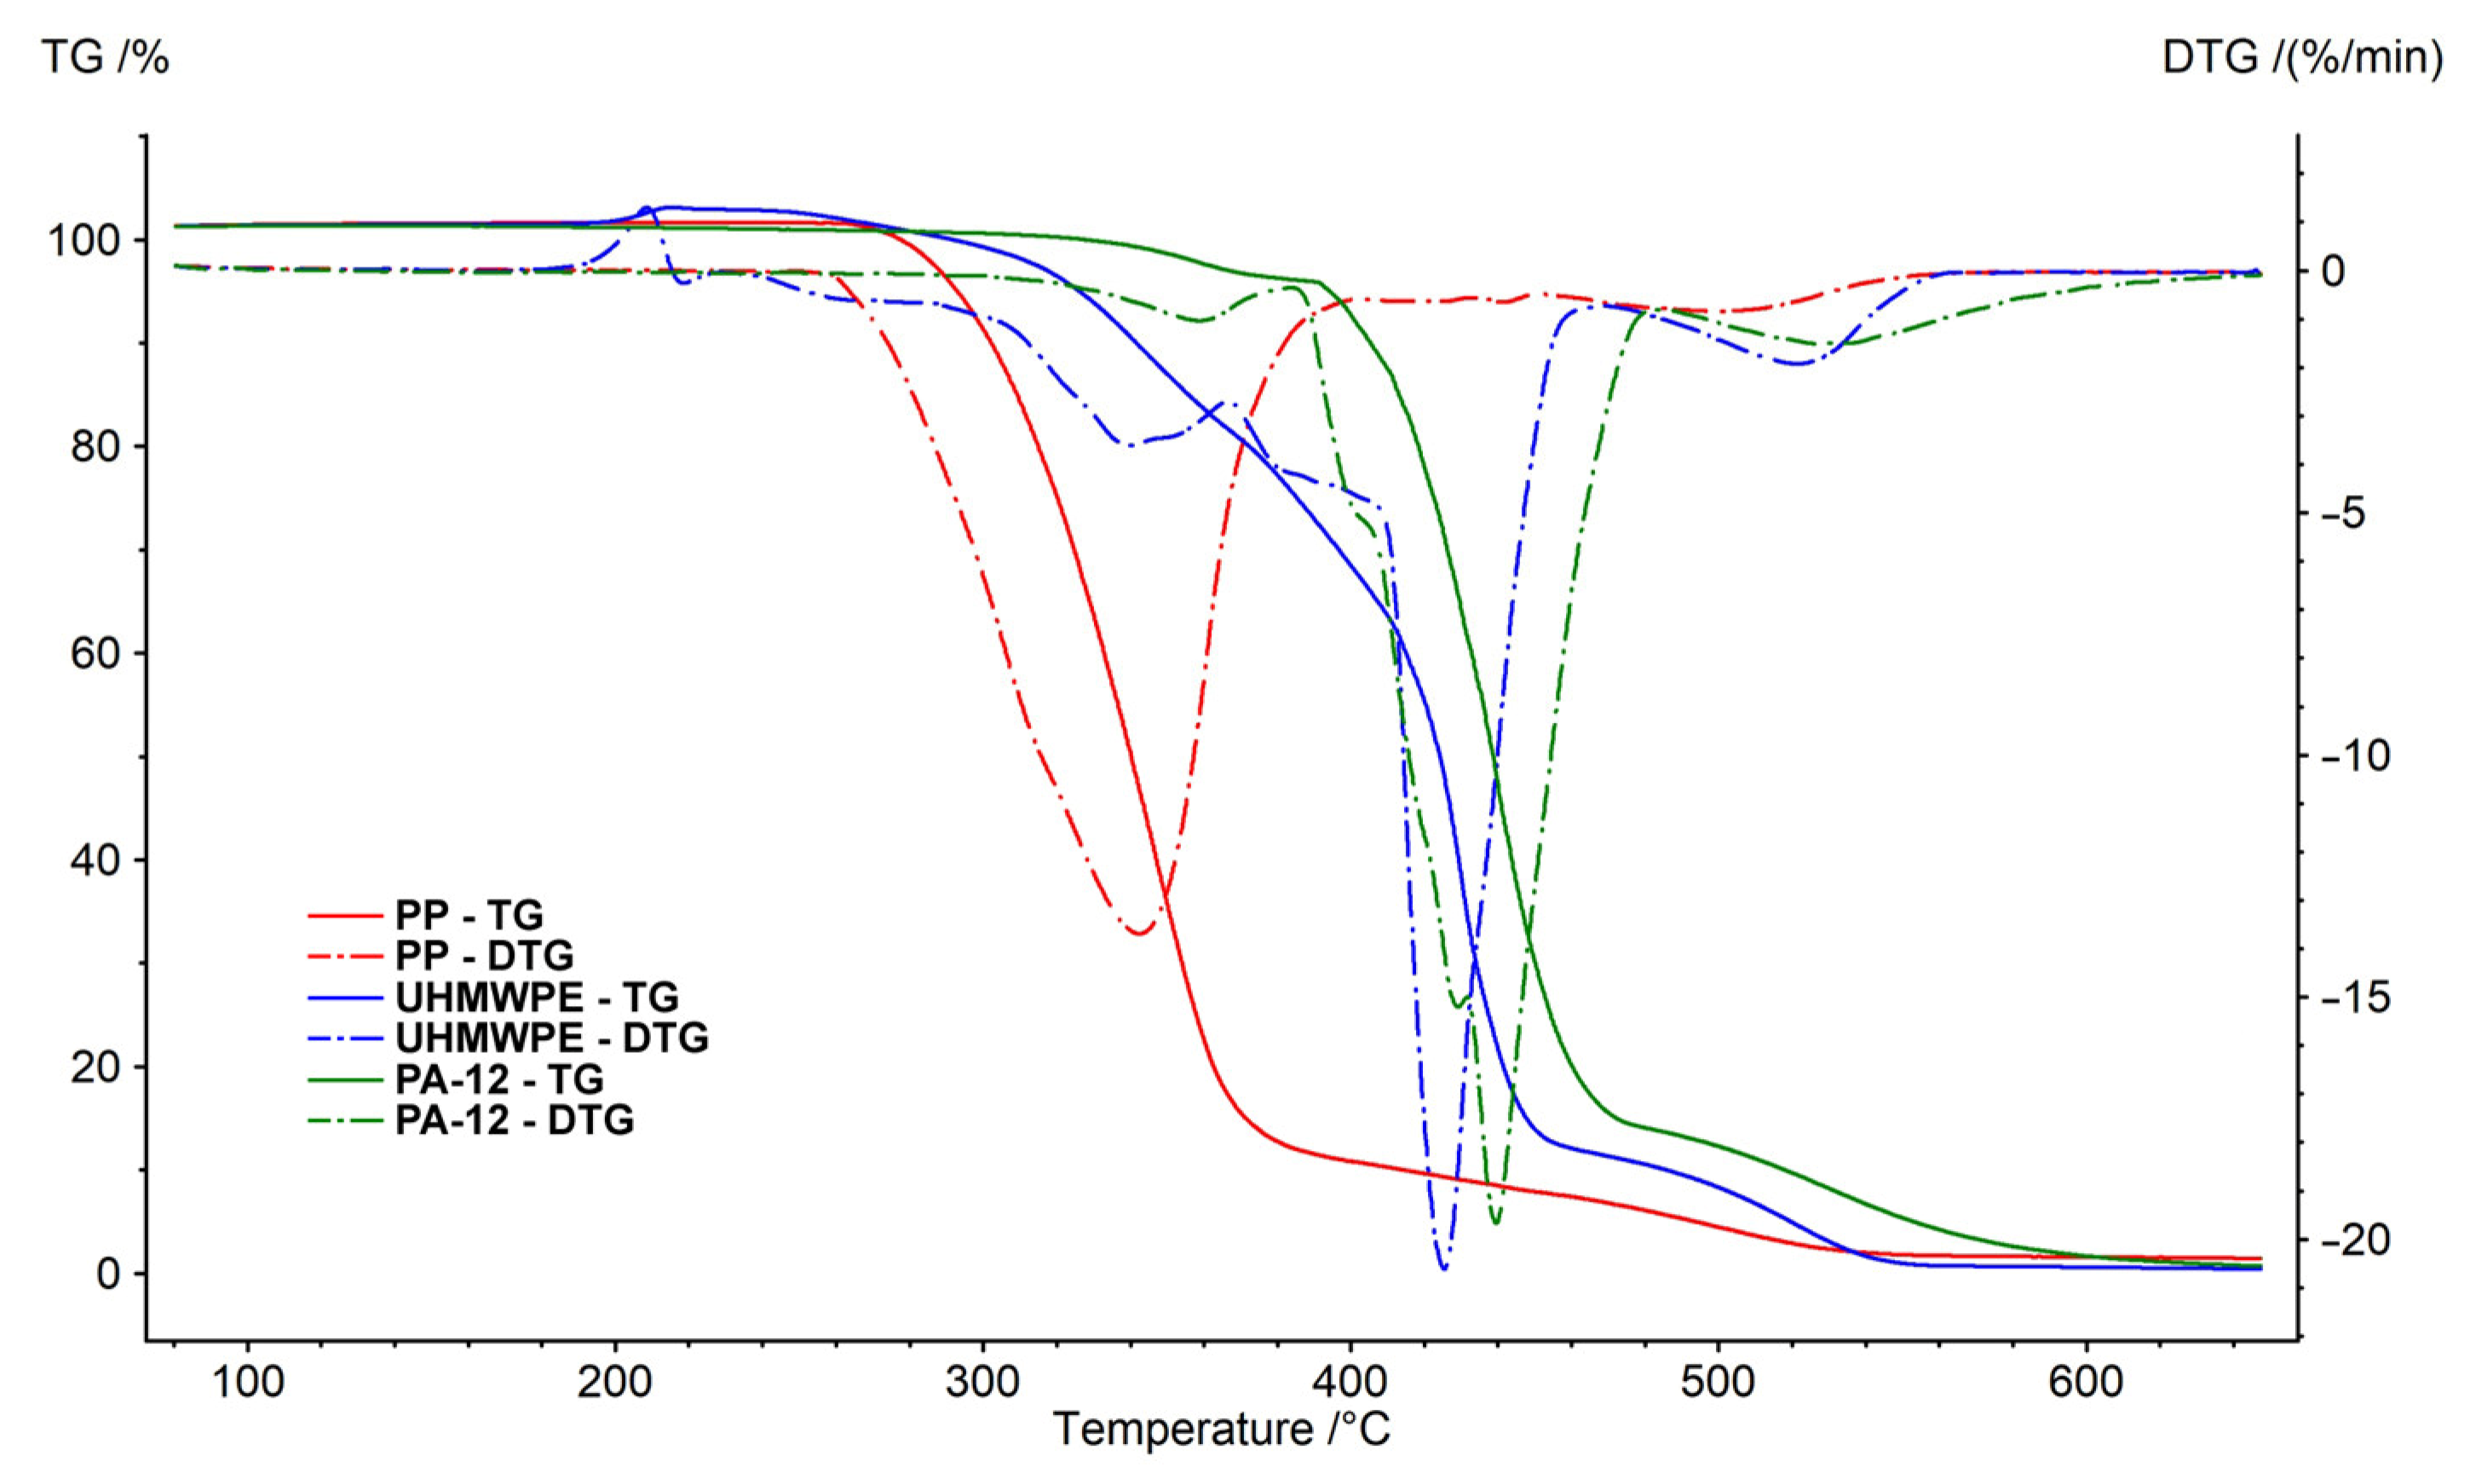
| Polymer | Polypropylene | UHMW Polyethylene | Polyamide 12 | |
|---|---|---|---|---|
| Step 1 | Range (°C) | 218.5–450.8 | 185.8–214.5 | 124.4–384.1 |
| Peak (°C) | 342.4 | 208.5 | 358.7 | |
| Weight loss (%) | 92.3 | −1.6 | 5.2 | |
| Step 2 | Range (°C) | 450.8–650.0 | 214.5–366.4 | 384.1–484.0 |
| Peak (°C) | 498.9 | 339.8 | 439.5 | |
| Weight loss (%) | 6.3 | 21.1 | 81.2 | |
| Step 3 | Range (°C) | - | 366.4–469.1 | 484.0–650.0 |
| Peak (°C) | - | 425.4 | 526.8 | |
| Weight loss (%) | - | 69.3 | 12.9 | |
| Step 4 | Range (°C) | - | 469.1–650.0 | - |
| Peak (°C) | - | 521.3 | - | |
| Weight loss (%) | - | 10.8 | - | |
| Residue at 650 °C (%) | 1.4 | 0.4 | 0.7 | |
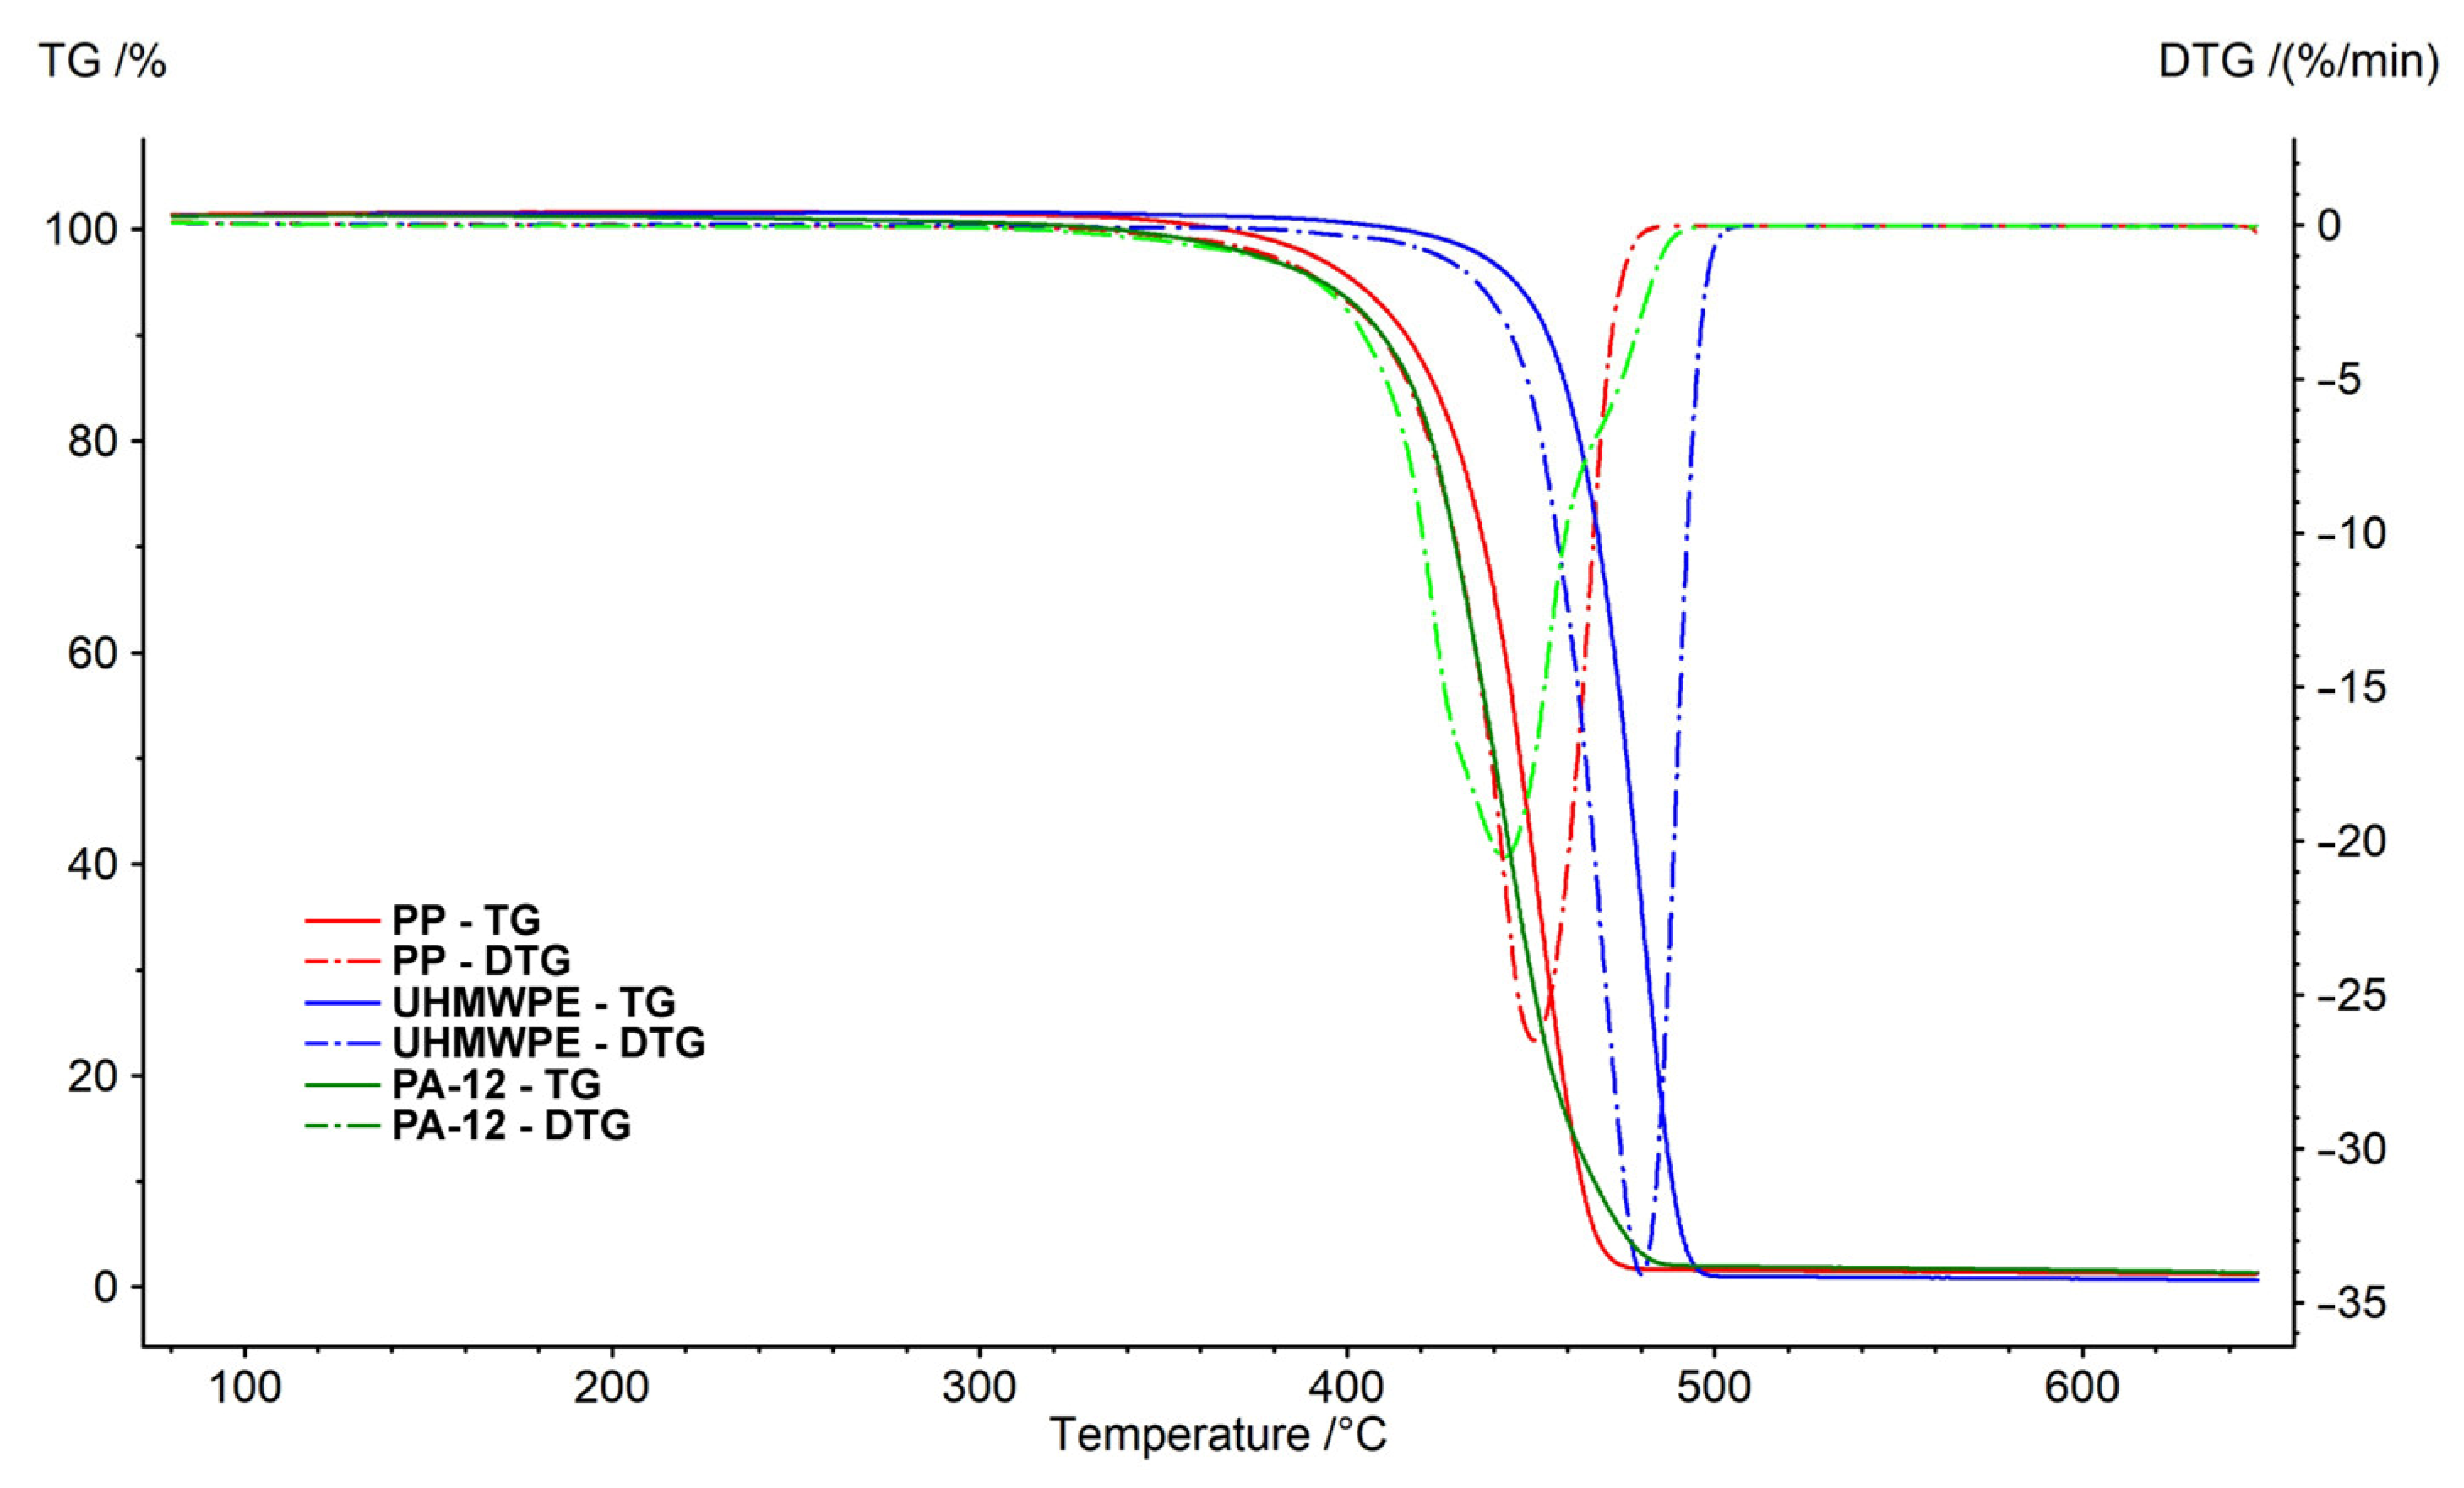
| Polymer | Polypropylene | UHMW Polyethylene | Polyamide 12 | |
|---|---|---|---|---|
| Step 1 | Range (°C) | 221.4–650.0 | 287.1–650.0 | 126.3–650.0 |
| Peak (°C) | 450.9 | 480.1 | 442.7 | |
| Weight loss (%) | 98.8 | 99.3 | 98.7 | |
| Residue at 650 °C (%) | 1.2 | 0.7 | 1.3 | |
| Sample | Polyamide 12 | UHMW Polyethylene | Polypropylene | ||
|---|---|---|---|---|---|
| Concentration (g·m−3) | Pmax (bar g) | dP/dt (bar·s−1) | Pmax (bar g) | dP/dt (bar·s−1) | |
| 30 | 0.75 (0.73 ± 0.02) | 5.6 (5.4 ± 0.2) | – | – | NO EXPLOSION |
| 60 | 2.51 (2.49 ± 0.02) | 24.5 (24.2 ± 0.3) | 1.81 (1.75 ± 0.06) | 12.6 (12.2 ± 0.3) | |
| 125 | 4.29 (4.21 ± 0.07) | 56.5 (55.0 ± 1.3) | 4.14 (4.11 ± 0.03) | 34.9 (33.9 ± 0.9) | |
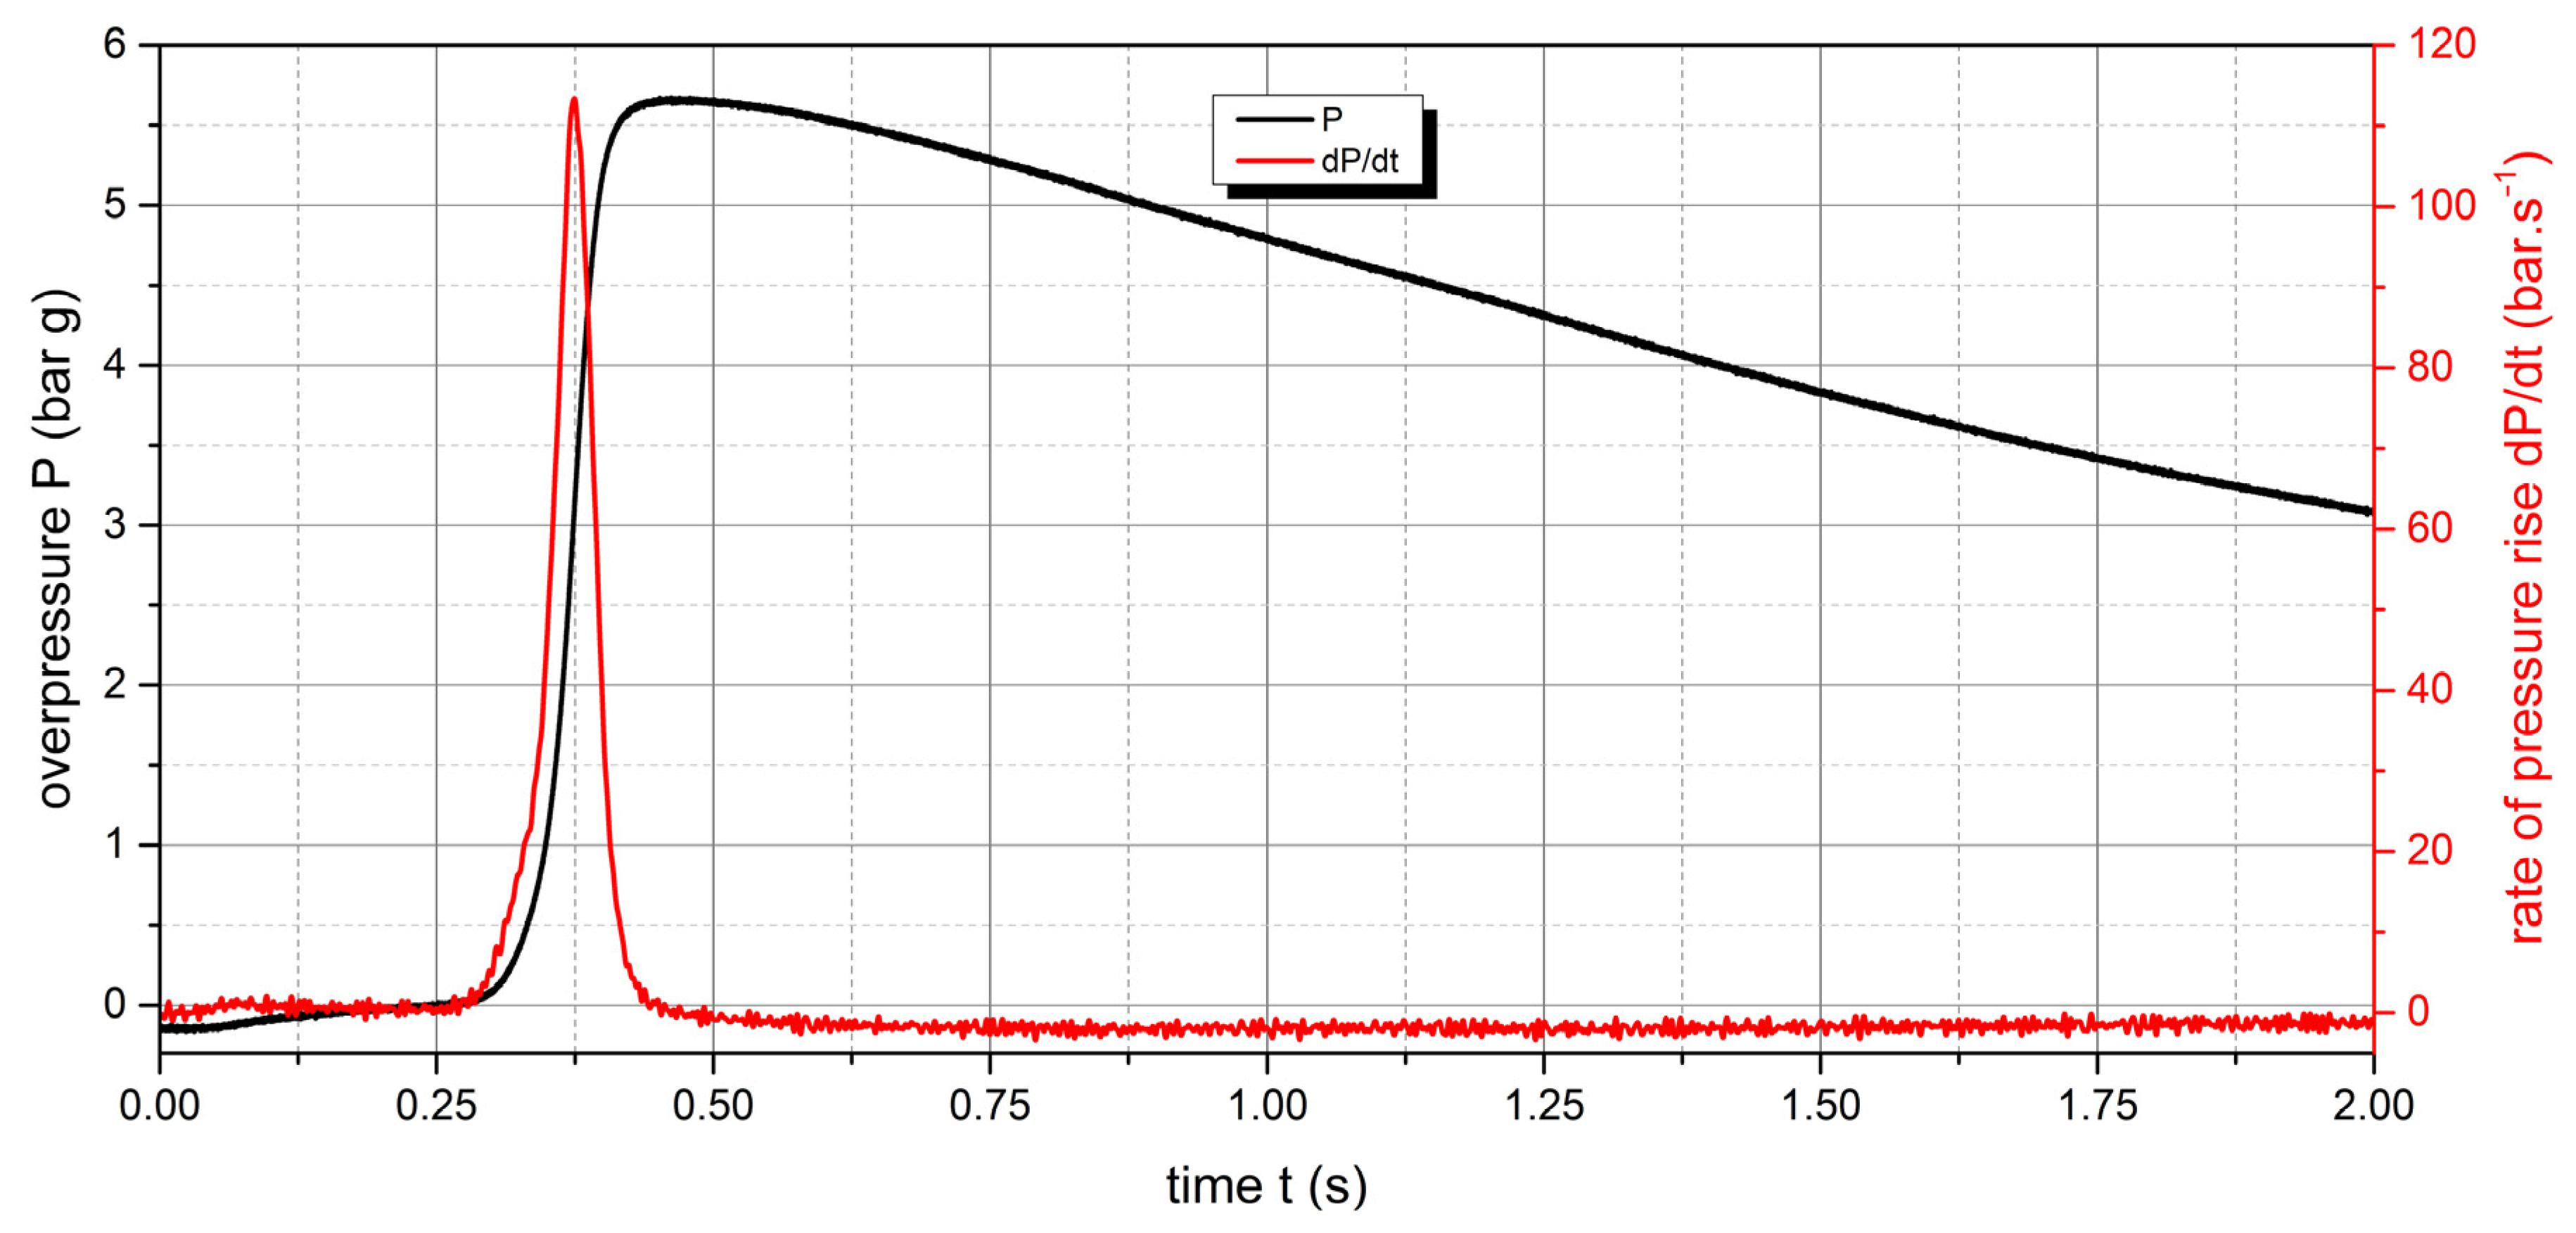
| 250 | 5.66 (5.62 ± 0.04) | 113.3 (111.6 ± 1.5) | 5.77 (5.73 ± 0.04) | 56.2 (55.5 ± 1.0) | |
| 500 | 6.48 (6.41 ± 0.07) | 163.2 (161.6 ± 1.7) | 6.47 (6.45 ± 0.02) | 135.9 (134.5 ± 1.5) | |
| 750 | 6.76 (6.65 ± 0.10) | 135.8 (133.9 ± 1.7) | 5.97 (5.92 ± 0.04) | 124.2 (123.4 ± 0.7) | |
| 1000 | 6.33 (6.27 ± 0.06) | 111.5 (109.8 ± 1.6) | 5.67 (5.65 ± 0.03) | 87.3 (85.9 ± 1.6) | |
| Sample Weight (g) | Air Pressure (kPa) | Temperature (°C) | Results |
|---|---|---|---|
| 0.2 | 50 | 450 | YES |
| 440 | YES | ||
| 430 | YES | ||
| 420 | YES | ||
| 410 | YES | ||
| 400 | YES | ||
| 390 | YES | ||
| 380 | YES | ||
| 370 | NO | ||
| 0.11 | 50 | 370 | NO |
| 380 | YES | ||
| 370 | NO |
| Sample Weight (g) | Air Pressure (kPa) | Temperature (°C) | Results |
|---|---|---|---|
| 0.11 | 50 | 370 | YES |
| 360 | YES | ||
| 350 | YES | ||
| 340 | NO |
Disclaimer/Publisher’s Note: The statements, opinions and data contained in all publications are solely those of the individual author(s) and contributor(s) and not of MDPI and/or the editor(s). MDPI and/or the editor(s) disclaim responsibility for any injury to people or property resulting from any ideas, methods, instructions or products referred to in the content. |
© 2023 by the authors. Licensee MDPI, Basel, Switzerland. This article is an open access article distributed under the terms and conditions of the Creative Commons Attribution (CC BY) license (https://creativecommons.org/licenses/by/4.0/).
Share and Cite
Kuracina, R.; Szabová, Z.; Buranská, E.; Kosár, L.; Rantuch, P.; Blinová, L.; Měřínská, D.; Gogola, P.; Jurina, F. Study into the Fire and Explosion Characteristics of Polymer Powders Used in Engineering Production Technologies. Polymers 2023, 15, 4203. https://doi.org/10.3390/polym15214203
Kuracina R, Szabová Z, Buranská E, Kosár L, Rantuch P, Blinová L, Měřínská D, Gogola P, Jurina F. Study into the Fire and Explosion Characteristics of Polymer Powders Used in Engineering Production Technologies. Polymers. 2023; 15(21):4203. https://doi.org/10.3390/polym15214203
Chicago/Turabian StyleKuracina, Richard, Zuzana Szabová, Eva Buranská, László Kosár, Peter Rantuch, Lenka Blinová, Dagmar Měřínská, Peter Gogola, and František Jurina. 2023. "Study into the Fire and Explosion Characteristics of Polymer Powders Used in Engineering Production Technologies" Polymers 15, no. 21: 4203. https://doi.org/10.3390/polym15214203
APA StyleKuracina, R., Szabová, Z., Buranská, E., Kosár, L., Rantuch, P., Blinová, L., Měřínská, D., Gogola, P., & Jurina, F. (2023). Study into the Fire and Explosion Characteristics of Polymer Powders Used in Engineering Production Technologies. Polymers, 15(21), 4203. https://doi.org/10.3390/polym15214203