
Design of Experiments-Based Fire Performance Optimization of Epoxy and Carbon-Fiber-Reinforced Epoxy Polymer Composites

 ,
,  and
and
Abstract
:
1. Introduction
2. Materials and Methods
2.1. Materials
2.1.1. Epoxy
2.1.2. Carbon Fibers
2.1.3. Fire Retardants
2.2. Test Procedure and Characterization
2.3. Design of Experiments
2.4. Production of Fire-Retarded Epoxy Polymer and CFRP-Samples
2.5. Test Methodology
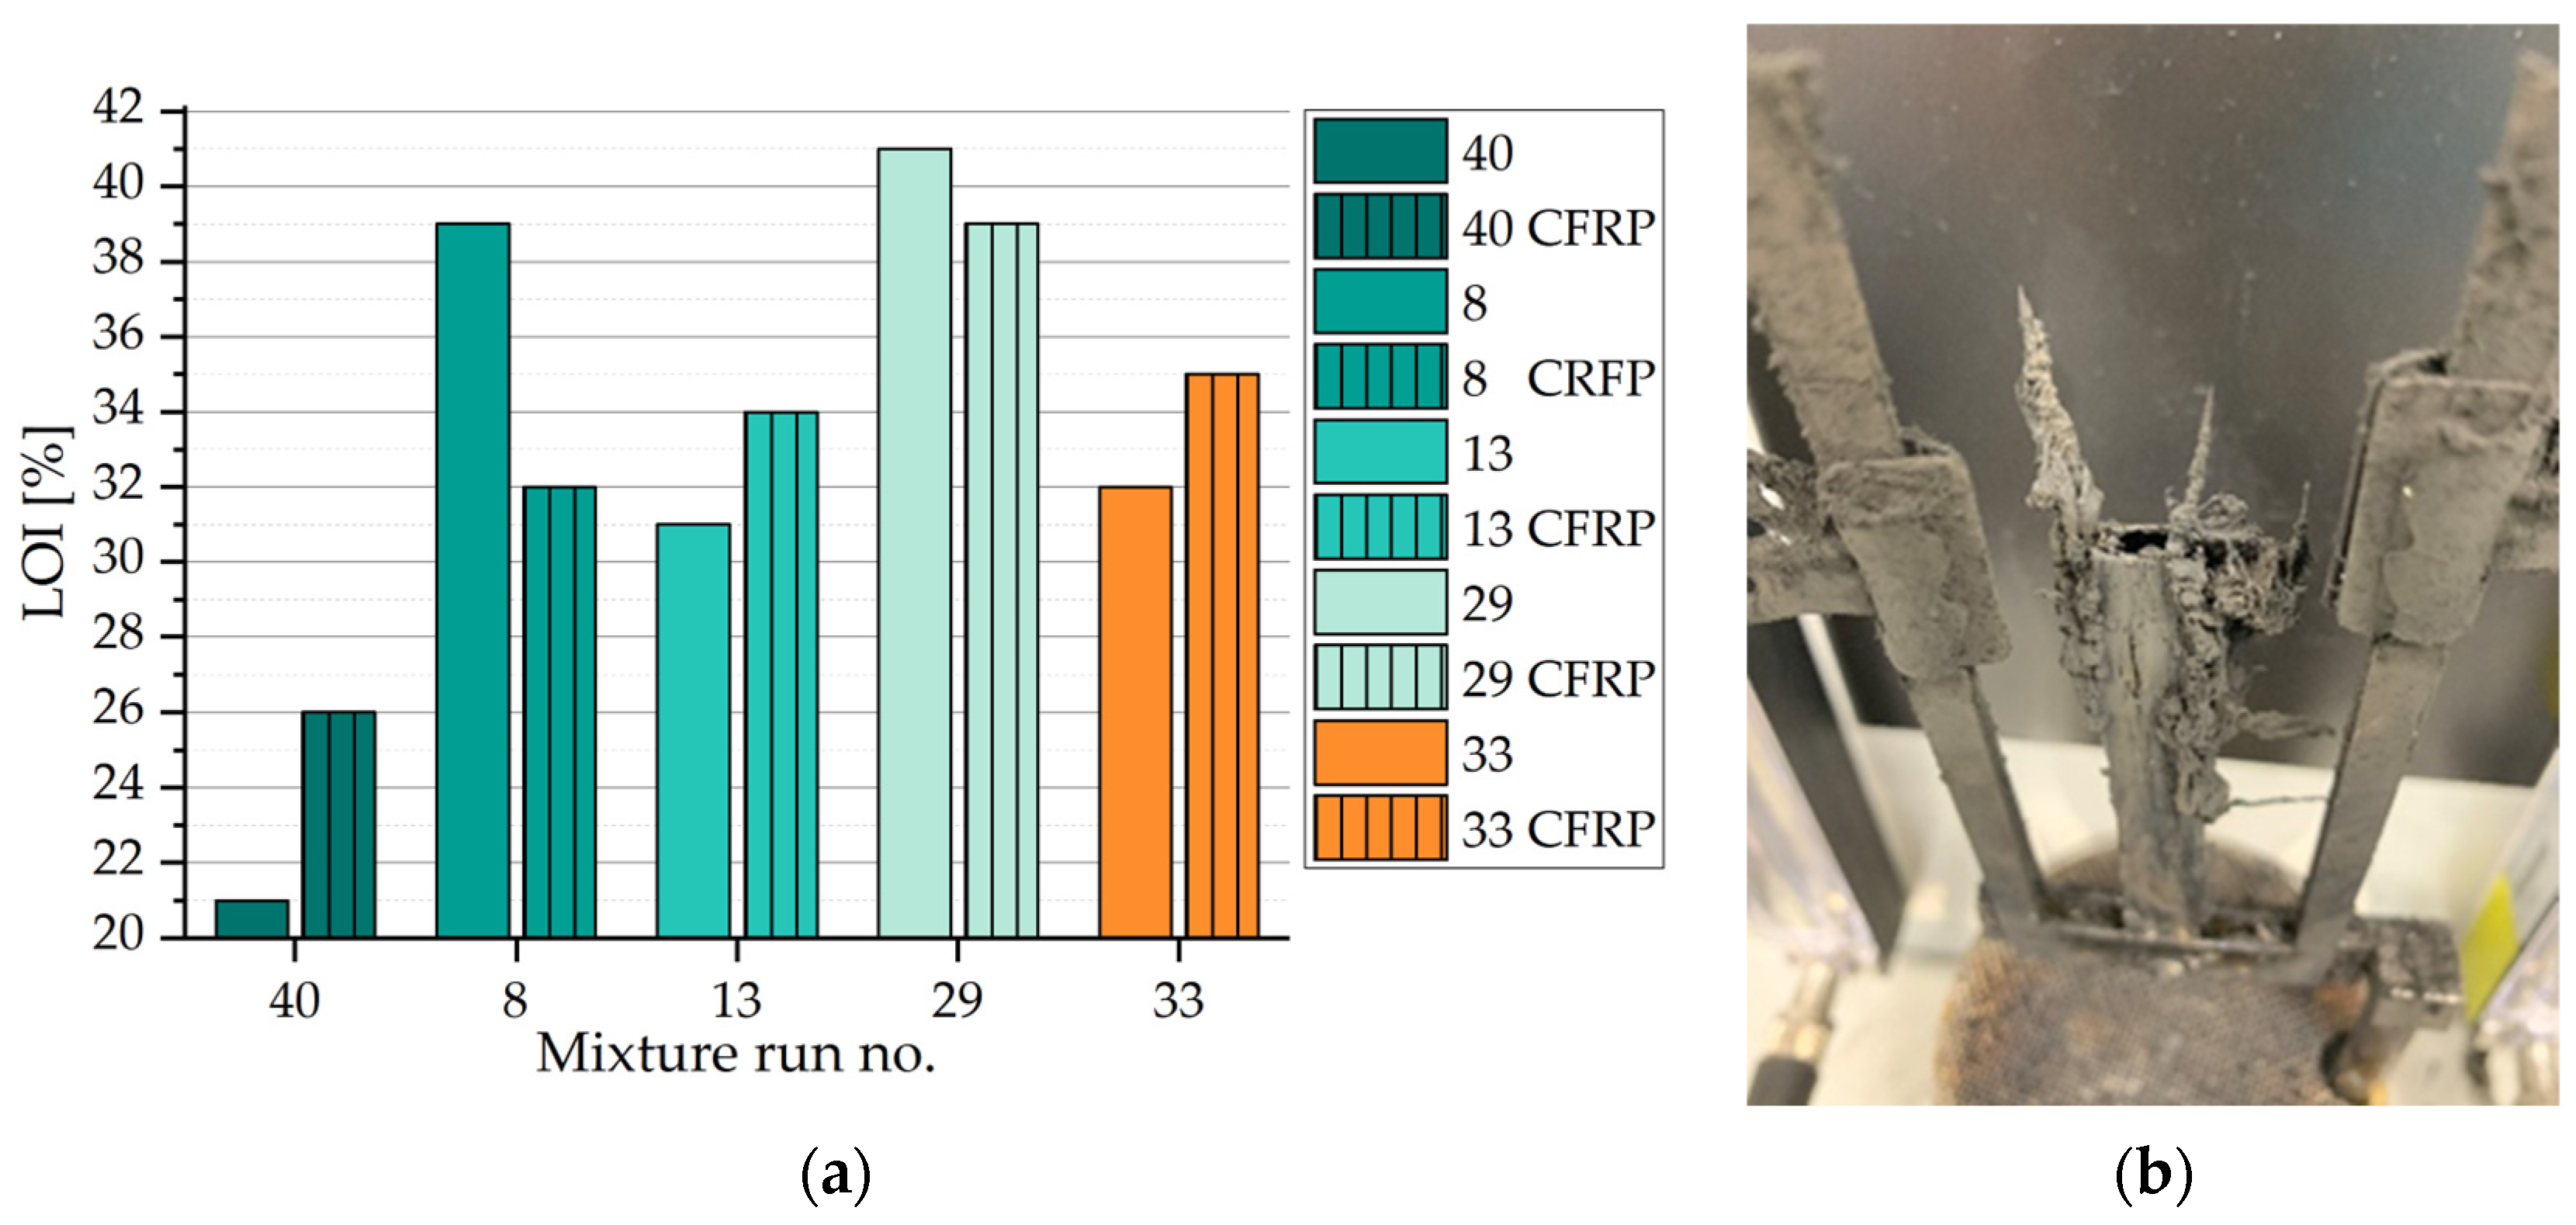
2.5.1. Limiting Oxygen Index (LOI) Test
2.5.2. Thermogravimetric Analysis
2.5.3. Cone Calorimetry
2.5.4. Test Sequence
3. Results and Discussion
3.1. Pre-Screening of Fire Retardants
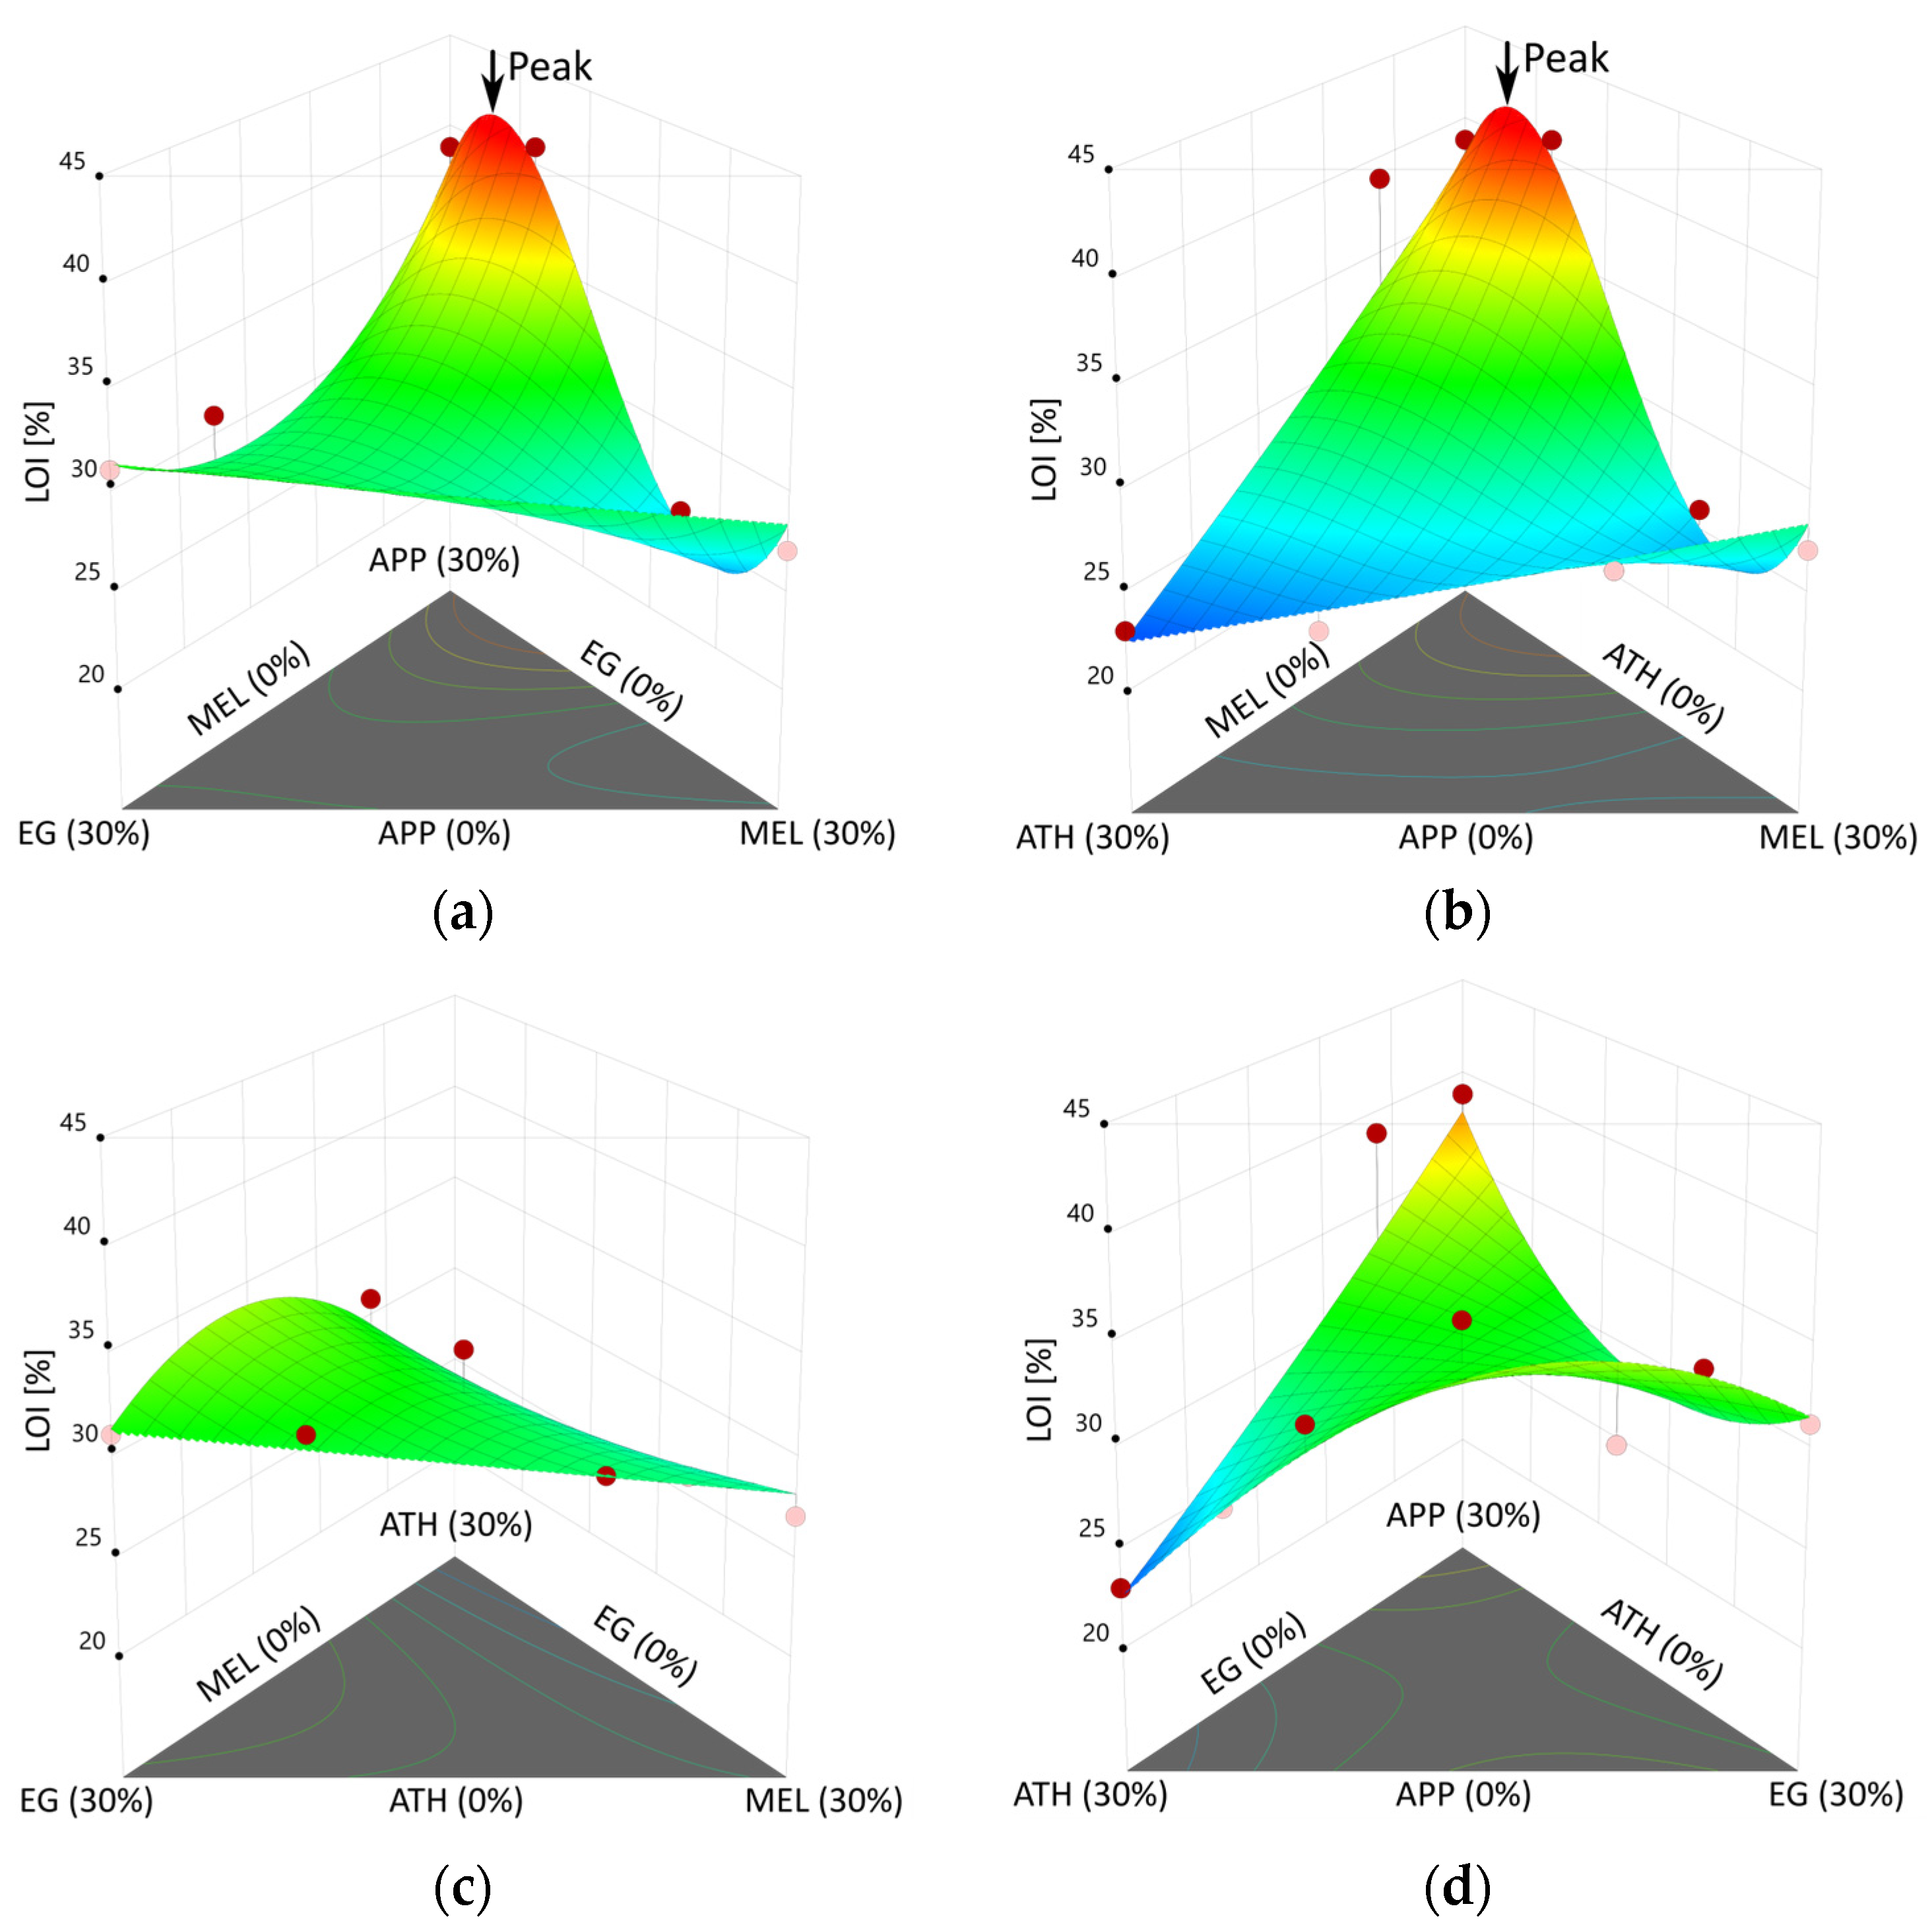
3.2. Design of Experiments
3.3. Limiting Oxygen Index
3.4. Thermogravimetric Analyis
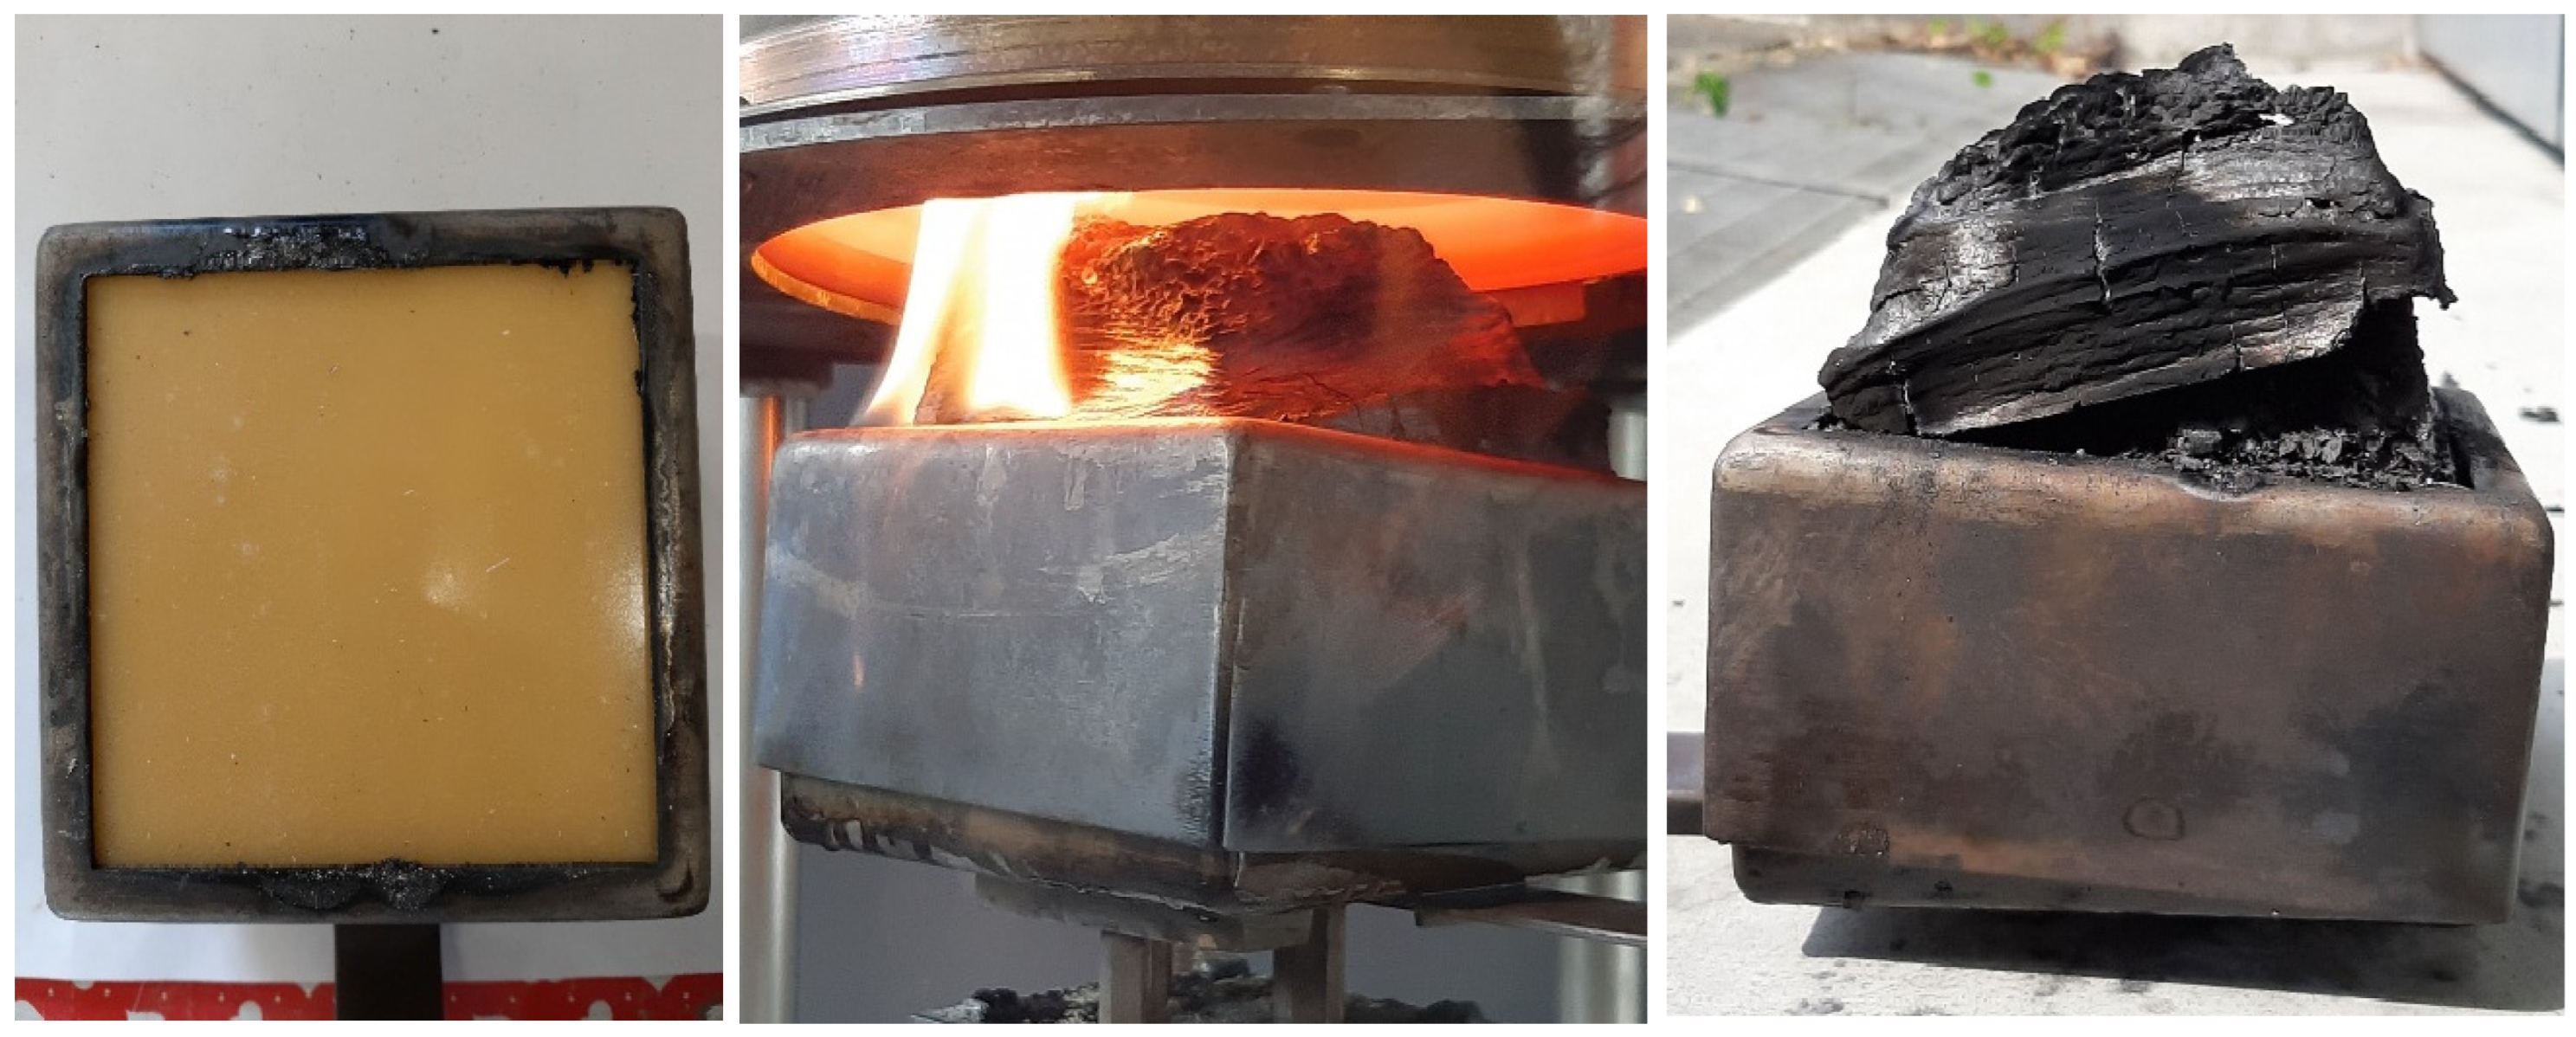
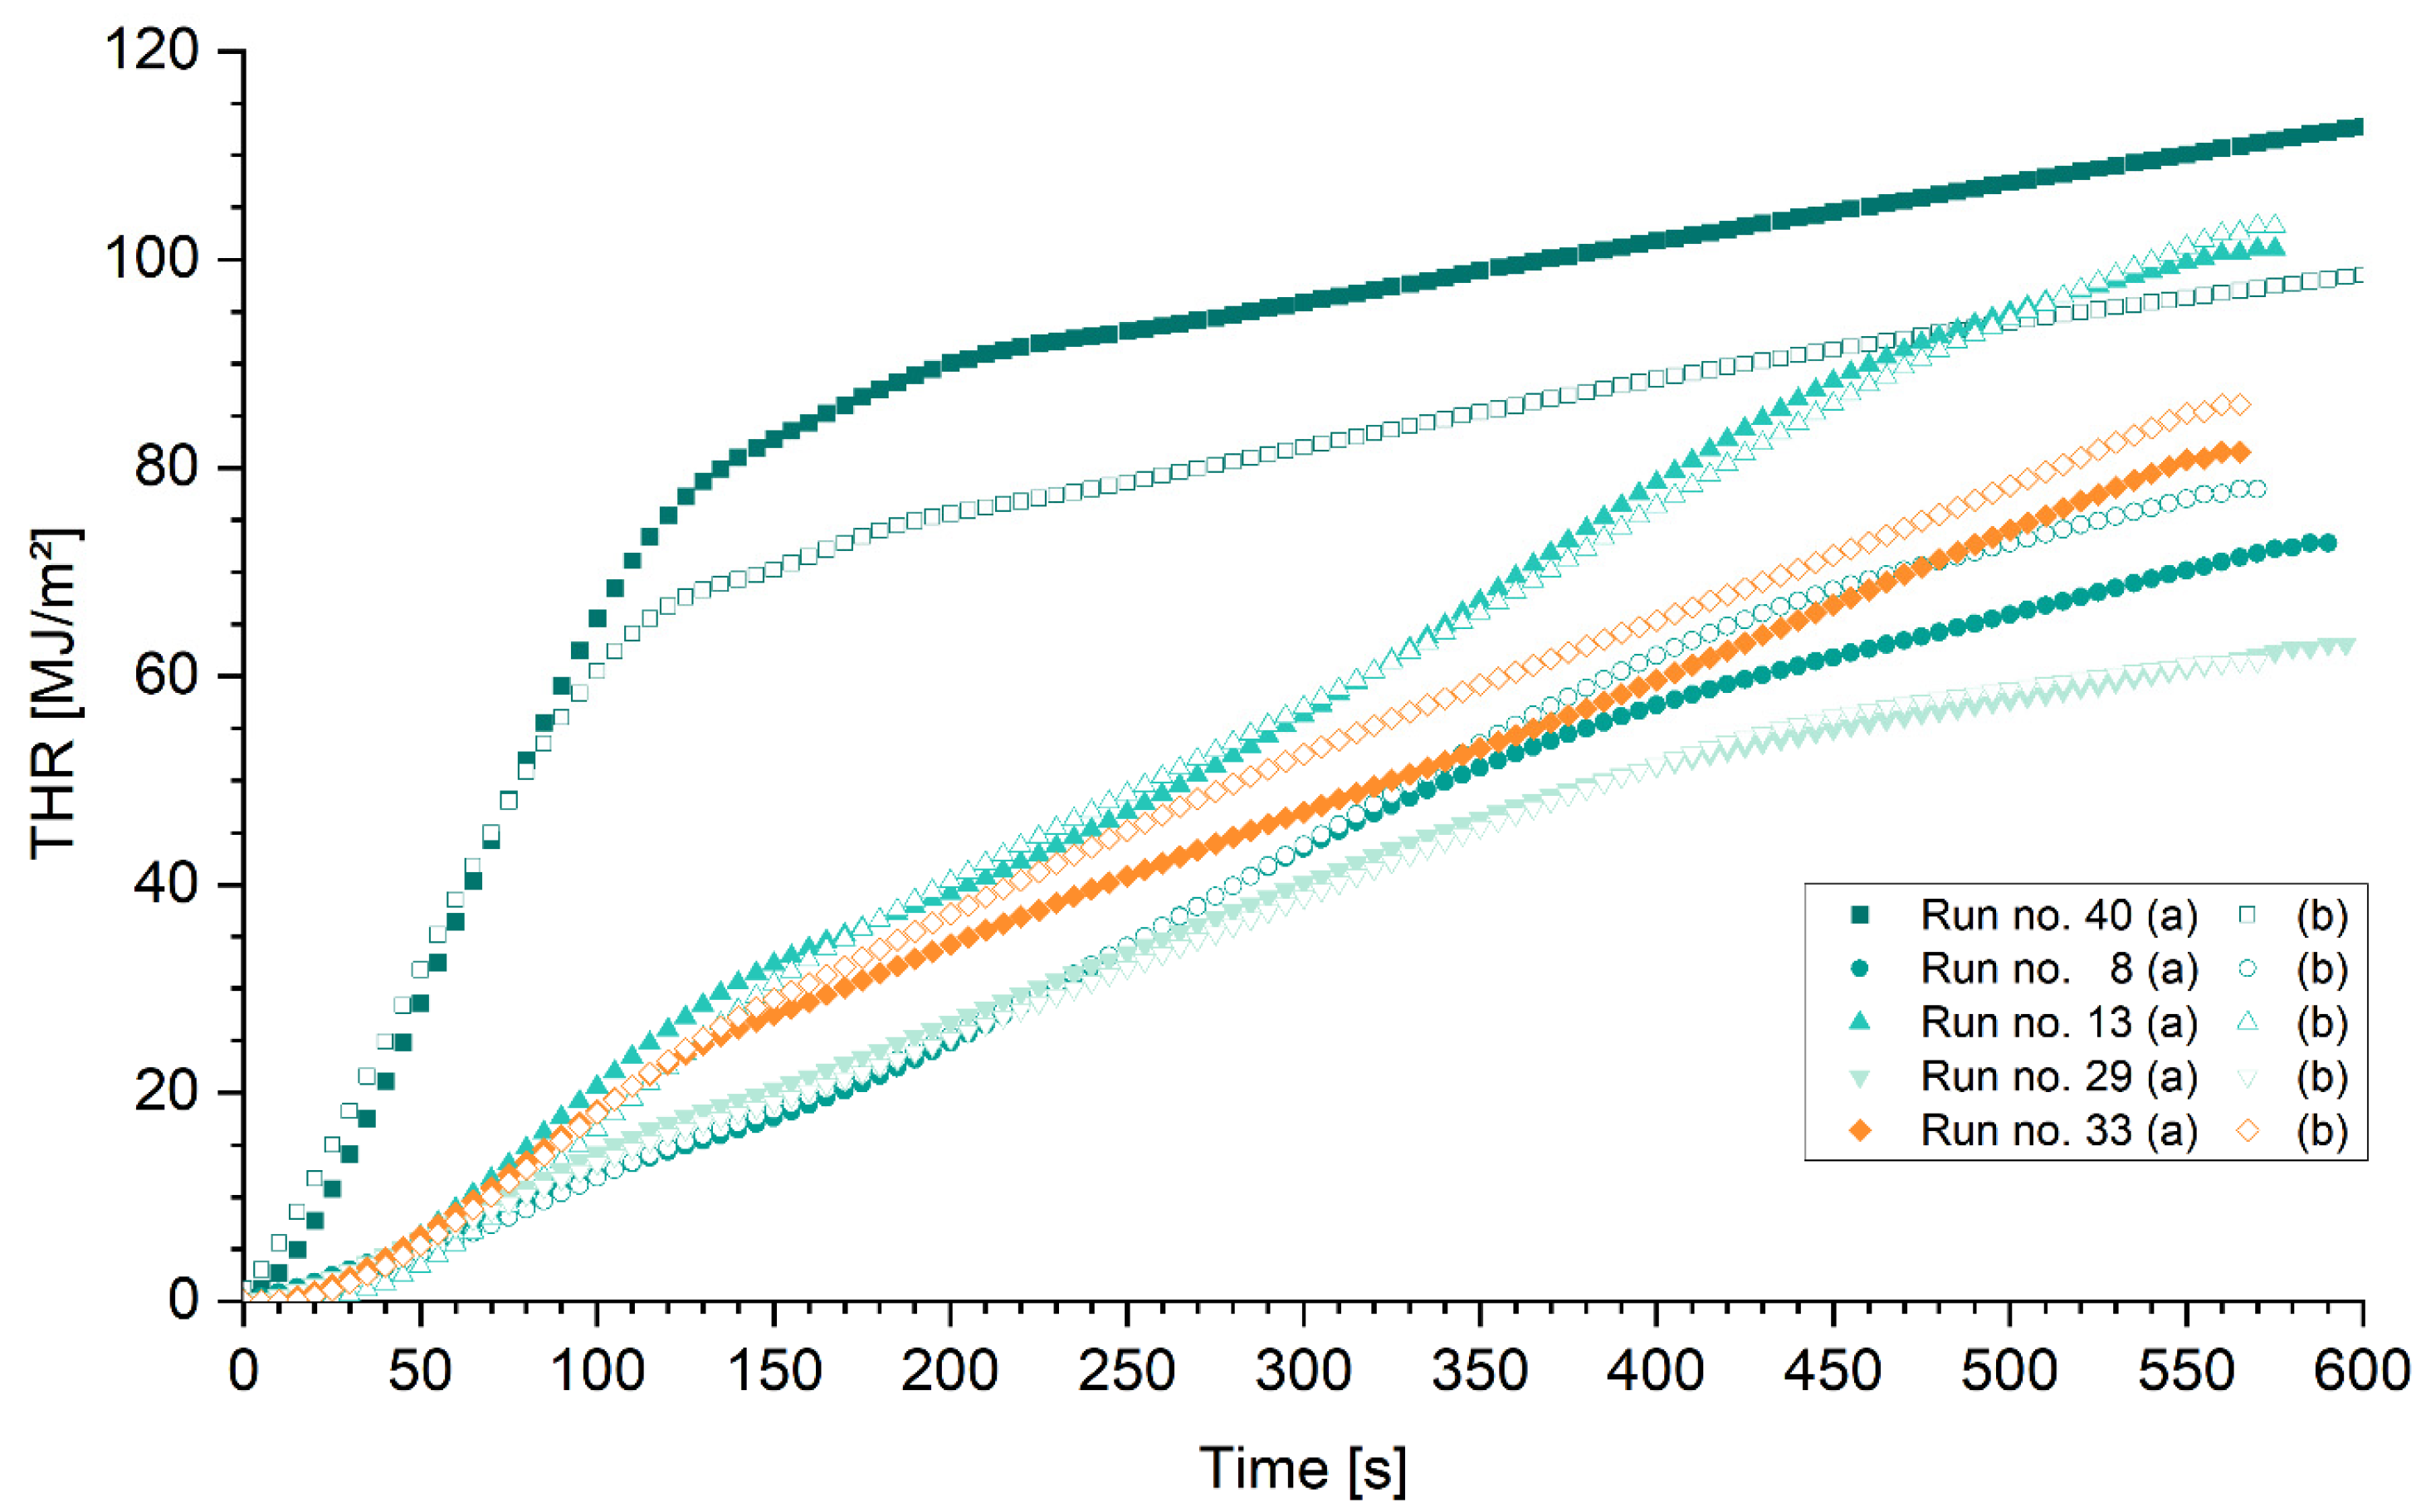
3.5. Cone Calorimetry
4. Conclusions
Author Contributions
Funding
Data Availability Statement
Conflicts of Interest
References
- Zigler, R.; Pokorný, M. Fire protection of timber structures strengthened with FRP materials. Civ. Eng. J. 2015, 24, 1–8. [Google Scholar] [CrossRef]
- DIN 4102-1:1998-05; Brandverhalten von Baustoffen und Bauteilen_—Teil_1: Baustoffe; Begriffe, Anforderungen und Prüfungen. Beuth Verlag GmbH: Berlin, Germany, 1998. [CrossRef]
- DIN EN 13501-2:2016-12; Klassifizierung von Bauprodukten und Bauarten zu ihrem Brandverhalten_—Teil_2: Klassifizierung mit den Ergebnissen aus den Feuerwiderstandsprüfungen, mit Ausnahme von Lüftungsanlagen. Beuth Verlag GmbH: Berlin, Germany, 2016. [CrossRef]
- DIN EN 13381-8:2013-08; Prüfverfahren zur Bestimmung des Beitrages zum Feuerwiderstand von tragenden Bauteilen_-Teil_8: Reaktive Ummantelung von Stahlbauteilen. Beuth Verlag GmbH: Berlin, Germany, 2013. [CrossRef]
- Alongi, J.; Han, Z.; Bourbigot, S. Intumescence: Tradition versus novelty. A comprehensive review. Prog. Polym. Sci. 2015, 51, 28–73. [Google Scholar] [CrossRef]
- Carlos, T.B.; Rodrigues, J.P.C.; de Lima, R.C.; Dhima, D. Experimental analysis on flexural behaviour of RC beams strengthened with CFRP laminates and under fire conditions. Compos. Struct. 2018, 189, 516–528. [Google Scholar] [CrossRef]
- Jimenez, M.; Duquesne, S.; Bourbigot, S. Characterization of the performance of an intumescent fire protective coating. Surf. Coatings Technol. 2006, 201, 979–987. [Google Scholar] [CrossRef]
- Weil, E.D.; Levchik, S. A Review of Current Flame Retardant Systems for Epoxy Resins. J. Fire Sci. 2004, 22, 25–40. [Google Scholar] [CrossRef]
- Bachtiar, E.V.; Kurkowiak, K.; Yan, L.; Kasal, B.; Kolb, T. Thermal Stability, Fire Performance, and Mechanical Properties of Natural Fibre Fabric-Reinforced Polymer Composites with Different Fire Retardants. Polymers 2019, 11, 699. [Google Scholar] [CrossRef] [PubMed]
- Gao, T.-Y.; Wang, F.-D.; Xu, Y.; Wei, C.-X.; Zhu, S.-E.; Yang, W.; Lu, H.-D. Luteolin-based epoxy resin with excep-tional heat resistance, mechanical and flame retardant properties. Chem. Eng. J. 2022, 428, 131173. [Google Scholar] [CrossRef]
- Xu, Y.; Yang, W.-J.; Zhou, Q.-K.; Gao, T.-Y.; Xu, G.-M.; Tai, Q.-L.; Zhu, S.-E.; Lu, H.-D.; Yuen, R.K.; Yang, W.; et al. Highly thermo-stable resveratrol-based flame retardant for enhancing mechanical and fire safety properties of epoxy resins. Chem. Eng. J. 2022, 450, 138475. [Google Scholar] [CrossRef]
- Hurley, M.J.; Gottuk, D.T.; Hall, J.R., Jr.; Harada, K.; Kuligowski, E.D.; Puchovsky, M.; Torero, J.L.; Watts, J.M., Jr.; Wieczorek, C.J. SFPE Handbook of Fire Protection Engineering; Springer: New York, NY, USA, 2016. [Google Scholar]
- Camino, G.; Costa, L.; Di Luda Cortemiglia, M.P. Overview of fire retardant mechanisms. Polym. Degrad. Stab. 1991, 33, 131–154. [Google Scholar] [CrossRef]
- Bourbigot, S.; Duquesne, S. Fire retardant polymers: Recent developments and opportunities. J. Mater. Chem. 2007, 17, 2283–2300. [Google Scholar] [CrossRef]
- Green, J. An overview of the fire retardant chemicals industry, past? present? future. Fire Mater. 1995, 19, 197–204. [Google Scholar] [CrossRef]
- Pöhler, C.; Bachtiar, E.V.; Yan, L.; Kasal, B. Composites for structural strengthening, repair, rehabilitation, and retrofit. In Composite Materials: Manufacturing, Properties and Applications, 1st ed.; Deans, M., Ed.; Elsevier: Amsterdam, The Netherlands, 2021; pp. 205–226. [Google Scholar]
- Sen, A.K.; Mukherjee, B.; Bhattacharya, A.S.; Sanghi, L.K.; De, P.P.; Bhowmick, A.K. Preparation and characterization of low-halogen and nonhalgoen fire-resistant low-smoke (FRLS) cable sheathing compound from blends of functionalized polyolefins and PVC. J. Appl. Polym. Sci. 1991, 43, 1673–1684. [Google Scholar] [CrossRef]
- J. M. Huber Corporation. Micral® 855 Alumina Trihydrate. Available online: https://www.hubermaterials.com/userfiles/files/product-finder/spec/Micral%20855.pdf (accessed on 13 May 2022).
- Clariant International AG. Exolit® AP 422 Datasheet. Available online: https://www.clariant.com/de/Solutions/Products/2014/03/18/16/31/Exolit-AP-422?p=1 (accessed on 5 April 2022).
- OCI Nitrogen, B.V. Melafine: The Blowing Agent for Intumescent Coatings. Available online: https://www.oci.nl/media/1850/melamine-documentation-website-october-2020.pdf (accessed on 13 May 2022).
- Perstorp Holding AG. Charmor™ PM15. Available online: https://www.perstorp.com/en/products/charmor_pm15 (accessed on 13 May 2022).
- Georg, H. Luh GmbH. Technisches Datenblatt-Blähgraphit: GHL PX 96/-1; Georg H. Luh GmbH: Walluf, Germany, 2019. [Google Scholar]
- Georg, H. Luh GmbH. Technisches Datenblatt-Blähgraphit: GHL PX 95N; Georg H. Luh GmbH: Walluf, Germany, 2019. [Google Scholar]
- Fisher, R.A. The Design of Experiments, 5th ed.; Oliver & Boyd: Oxford, UK, 1949. [Google Scholar]
- Ma, Z.; Zhao, W.; Liu, Y.; Shi, J. Synthesis and properties of intumescent, phosphorus-containing, flame-retardant polyesters. J. Appl. Polym. Sci. 1997, 63, 1511–1515. [Google Scholar] [CrossRef]
- Weil, E.D. Additivity, synergism, and antagonism in flame retardancy. Flame Retard. Polym. Mater. 1975, 3, 185–243. [Google Scholar]
- Piepel, G.F.; Szychowski, J.M.; Loeppky, J.L. Augmenting Scheffé Linear Mixture Models with Squared and/or Crossproduct Terms. J. Qual. Technol. 2002, 34, 297–314. [Google Scholar] [CrossRef]
- Bozdogan, H. Model selection and Akaike’s Information Criterion (AIC): The general theory and its analytical extensions. Psychometrika 1987, 52, 345–370. [Google Scholar] [CrossRef]
- Gurit Services, A.G. Full General Datasheet AMPREG™ 30: Low Viscosity Epoxy Wet Laminating System. Available online: https://www.gurit.com/-/media/Gurit/Datasheets/Ampreg-30.pdf (accessed on 12 May 2022).
- DIN EN ISO 4589-2:2017-11; Kunststoffe_-Bestimmung des Brennverhaltens durch den Sauerstoff-Index_-Teil_2: Prüfung bei Umgebungstemperatur (ISO_4589-2:2017); Deutsche Fassung EN_ISO_4589-2:2017. Beuth Verlag: Berlin, Germany, 2019. [CrossRef]
- International Organization for Standardization. Prüfungen zum Brandverhalten von Baustoffen—Wärmefreisetzungs-Rauchentwicklungs-und Masseverlustrate—Teil 1: Wärmefreisetzungsrate (Cone Calorimeter-Verfahren) und Rauchentwicklungsrate (dynamische Messung), 3rd ed.; 13.220.50(ISO 5660-1:2015-03); Beuth Verlag GmbH: Berlin, Germany, 2015; Available online: https://www.iso.org/standard/57957.html (accessed on 27 March 2022).
- Schartel, B.; Bartholmai, M.; Knoll, U. Some comments on the use of cone calorimeter data. Polym. Degrad. Stab. 2005, 88, 540–547. [Google Scholar] [CrossRef]
- Mouritz, A.P. Fire Properties of Polymer Composite Materials; Springer: Dordrecht, The Netherlands, 2006. [Google Scholar] [CrossRef]
- Frost, J. Regression Analysis: An Intuitive Guide for Using and Interpreting Linear Models; Statisics by Jim Publishing: State College, PA, USA, 2019. [Google Scholar]
- Camino, G.; Luda, M.P. Mechanistic study on intumescence. In Fire Retardancy of Polymers: The Use of Intumescence, 1st ed.; Le Bras, M., Bourbigot, S., Camino, G., Delobel, R., Eds.; The Royal Society of Chemistry: Cambridge, UK, 1998; pp. 48–63. [Google Scholar] [CrossRef]


| Component | Name | Abbreviation/Subscript in Equation (2) | Product | Range (wt.-%) |
|---|---|---|---|---|
| A | Epoxy resin incl. Hardener | EP/ | Ampreg 31+3X | 70–90 |
| B | Ammonium polyphosphate | APP/ | AP 422 | 0–30 |
| C | Expandable graphite | EG/ | PX 96/-1 | 0–30 |
| D | Melamine | MEL/ | Melafine | 0–30 |
| E | Aluminum trihydroxide | ATH/ | Micral 855 | 0–30 |
| ∑ 100 |
| Type of Fire Retardant | Weight of Epoxy Resin [g] | Weight Ratio of Additive [g/g Epoxy] |
|---|---|---|
| APP | 30.20 | >30% |
| PER | 30.35 | >30% |
| MEL | 30.40 | >30% |
| EG PX 95-N | 31.20 | >30% |
| EG PX 96/-1 | 30.82 | <10% |
| ATH | 30.26 | >30% |
| Std. Order | Run Order | Design Point (Type) | EP (wt.-%) | APP (wt.-%) | EG (wt.-%) | MEL (wt.-%) | ATH (wt.-%) |
|---|---|---|---|---|---|---|---|
| 14 | 1 | Replicate | 80% | 10% | 0% | 10% | 0% |
| 1 | 2 | Model | 80% | 10% | 10% | 0% | 0% |
| 37 | 3 | Model | 70% | 8% | 0% | 0% | 22% |
| 13 | 4 | Model | 80% | 10% | 0% | 10% | 0% |
| 21 | 5 | Model | 90% | 10% | 0% | 0% | 0% |
| 31 | 6 | Model | 90% | 0% | 0% | 0% | 10% |
| 35 | 7 | Model | 70% | 0% | 0% | 9% | 21% |
| 26 | 8 | Model | 70% | 22% | 0% | 0% | 8% |
| 10 | 9 | Model | 70% | 0% | 30% | 0% | 0% |
| 7 | 10 | Model | 70% | 30% | 0% | 0% | 0% |
| 8 | 11 | Model | 70% | 22% | 8% | 0% | 0% |
| 15 | 12 | Model | 80% | 0% | 10% | 10% | 0% |
| 36 | 13 | Model | 70% | 0% | 8% | 0% | 22% |
| 25 | 14 | Model | 70% | 10% | 10% | 10% | 0% |
| 33 | 15 | Lack of Fit | 70% | 10% | 10% | 0% | 10% |
| 28 | 16 | Model | 70% | 0% | 0% | 22% | 8% |
| 18 | 17 | Model | 70% | 0% | 8% | 22% | 0% |
| 23 | 18 | Replicate | 90% | 0% | 10% | 0% | 0% |
| 27 | 19 | Model | 70% | 0% | 22% | 0% | 8% |
| 3 | 20 | Model | 77% | 7% | 7% | 9% | 0% |
| 5 | 21 | Model | 90% | 0% | 0% | 10% | 0% |
| 6 | 22 | Model | 78% | 22% | 0% | 0% | 0% |
| 17 | 23 | Model | 70% | 9% | 0% | 21% | 0% |
| 34 | 24 | Lack of Fit | 80% | 10% | 0% | 0% | 10% |
| 38 | 25 | Model | 78% | 0% | 0% | 0% | 22% |
| 20 | 26 | Model | 70% | 0% | 0% | 30% | 0% |
| 24 | 27 | Model | 78% | 0% | 22% | 0% | 0% |
| 39 | 28 | Model | 70% | 0% | 0% | 0% | 30% |
| 11 | 29 | Model | 70% | 22% | 0% | 8% | 0% |
| 29 | 30 | Lack of Fit | 70% | 10% | 0% | 10% | 10% |
| 16 | 31 | Replicate | 80% | 0% | 10% | 10% | 0% |
| 19 | 32 | Model | 78% | 0% | 0% | 22% | 0% |
| 30 | 33 | Lack of Fit | 70% | 0% | 10% | 10% | 10% |
| 4 | 34 | Replicate | 77% | 7% | 7% | 9% | 0% |
| 12 | 35 | Model | 70% | 0% | 21% | 9% | 0% |
| 2 | 36 | Replicate | 80% | 10% | 10% | 0% | 0% |
| 9 | 37 | Model | 70% | 8% | 22% | 0% | 0% |
| 22 | 38 | Model | 90% | 0% | 10% | 0% | 0% |
| 32 | 39 | Lack of Fit | 80% | 0% | 0% | 10% | 10% |
| 40 | 40 | Additional | 100% | 0% | 0% | 0% | 0% |
| 41 | 41 | Verification | 75% | 21% | 0% | 4% | 0% |
| 42 | 42 | Verification | 70% | 25% | 0% | 5% | 0% |
| Source | Sum of Squares | df | Mean Square | F-Value | p-Value | Statistical Significance |
|---|---|---|---|---|---|---|
| Model | 5.44 | 8 | 0.68 | 18.05 | <0.0001 | significant |
| Linear mixture | 4.21 | 4 | 1.05 | 27.95 | <0.0001 | significant |
| APP·EG | 0.29 | 1 | 0.29 | 7.72 | 0.0092 | significant |
| APP·MEL | 0.01 | 1 | 0.01 | 0.25 | 0.6215 | not significant |
| EG·ATH | 0.38 | 1 | 0.38 | 10.01 | 0.0035 | significant |
| APP·MEL (APP-MEL) | 0.40 | 1 | 0.40 | 10.73 | 0.0026 | significant |
| Residual | 1.17 | 31 | 0.04 | |||
| Lack of Fit | 1.01 | 26 | 0.04 | 1.23 | 0.4504 | not significant |
| Pure Error | 0.16 | 5 | 0.03 | |||
| Cor Total | 6.61 | 39 |
| Mean | 5.28 | R2 | 0.823 |
| Standard deviation | 0.194 | Adjusted R2 | 0.777 |
| CoV % | 3.68 | Predicted R2 | 0.651 |
| Adequate Precision | 18.565 |
| Epoxy | APP | ATH | EG | MEL | CF | |
|---|---|---|---|---|---|---|
| 1st Peak in MLR (Temp./mass loss) | 366 °C/70.9% | 335 °C/17.7% | 290 °C/29.2% | 245 °C/16.2% | 340 °C/100% | 761 °C/95.6% |
| 2nd Peak in MLR (Temp./mass loss) | 535 °C/28.8% | 624 °C/58.9% | - | 794 °C/80.0% | - | - |
| Residue (weight) | 0.1% | 17.4% | 65.5% | 3.8% | 0.0% | 0.7% |
| Peak in MLR | EP CF | 8 | 8 CF | 13 | 13 CF | 29 | 29 CF | 33 | 33 CF |
|---|---|---|---|---|---|---|---|---|---|
| 1st Peak (Temp./mass loss) | 363 °C 39.3% | 325 °C 32.4% | 324 °C 23.4% | 301 °C 14.1% | 300 °C 10.1% | 337 °C 47.5% | 338 °C 24.7% | 297 °C 23.7% | 278 °C 12.5% |
| 2nd Peak (Temp./mass loss) | 535 °C 15.9% | 354 °C 17.1% | 356 °C 4.6% | 377 °C 41.6% | 379 °C 23.4% | 619 °C 46.8% | 580 °C 19.0% | 375 °C 28.0% | 380 °C 16.5% |
| 3rd Peak (Temp./mass loss) | 759 °C 44.8% | 422 °C 7.6% | 525 °C 17.0% | 519 °C 25.5% | 512 °C 18.2% | n/a | 885 °C 53.0% | 519.5 °C 33.9% | 519 °C 13.9% |
| 4th Peak (Temp./mass loss) | n/a | 638 °C 27.0% | 860 °C 49.5% | 768 °C 6.1% | 778 °C 38.1% | n/a | n/a | n/a | 761 °C 53.3% |
| Residue (weight) | 0.0% | 15.9% | 5.9% | 13.8% | 6.9% | 0.0% | 0.0% | 6.9% | 3.2% |
| Polymer Mixtures | ||||||||||
| Run No. 40 | Run No. 8 | Run No. 13 | Run No. 29 | Run No. 33 | ||||||
| (a) | (b) | (a) | (b) | (a) | (b) | (a) | (b) | (a) | (b) | |
| THR100s [MJ/m2] | 65.5 | 60.5 | 12.0 | 11.9 | 20.6 | 16.3 | 14.2 | 13.2 | 18.3 | 18.0 |
| THR600s [MJ/m2] | 114.3 | 98.6 | 72.3 | 77.5 | 100.7 | 102.6 | 62.8 | 61.3 | 80.9 | 85.4 |
| Average HRR180s | 339 | 332 | 96 | 99 | 168 | 166 | 107 | 100 | 139 | 153 |
| pHRR | 659 | 571 | 164 | 165 | 249 | 252 | 141 | 129 | 210 | 224 |
| Mass [g] | 46.11 | 40.13 | 55.44 | 54.62 | 50.50 | 54.99 | 52.5 | 56.55 | 53.14 | 54.70 |
| Spec. THR600s [MJ/m2·g] | 2.48 | 2.46 | 1.31 | 1.42 | 1.99 | 1.86 | 1.20 | 1.08 | 1.52 | 1.56 |
| TTI [s] | 26 | 32 | 32 | 32 | 37 | 43 | 35 | 35 | 39 | 40 |
| pCOP [ppm] | 536 | 523 | 199 | 197 | 143 | 130 | 197 | 173 | 152 | 138 |
| pCO2P [ppm] | 26,947 | 28,931 | 3326 | 3656 | 9500 | 8441 | 5810 | 6045 | 9730 | 9065 |
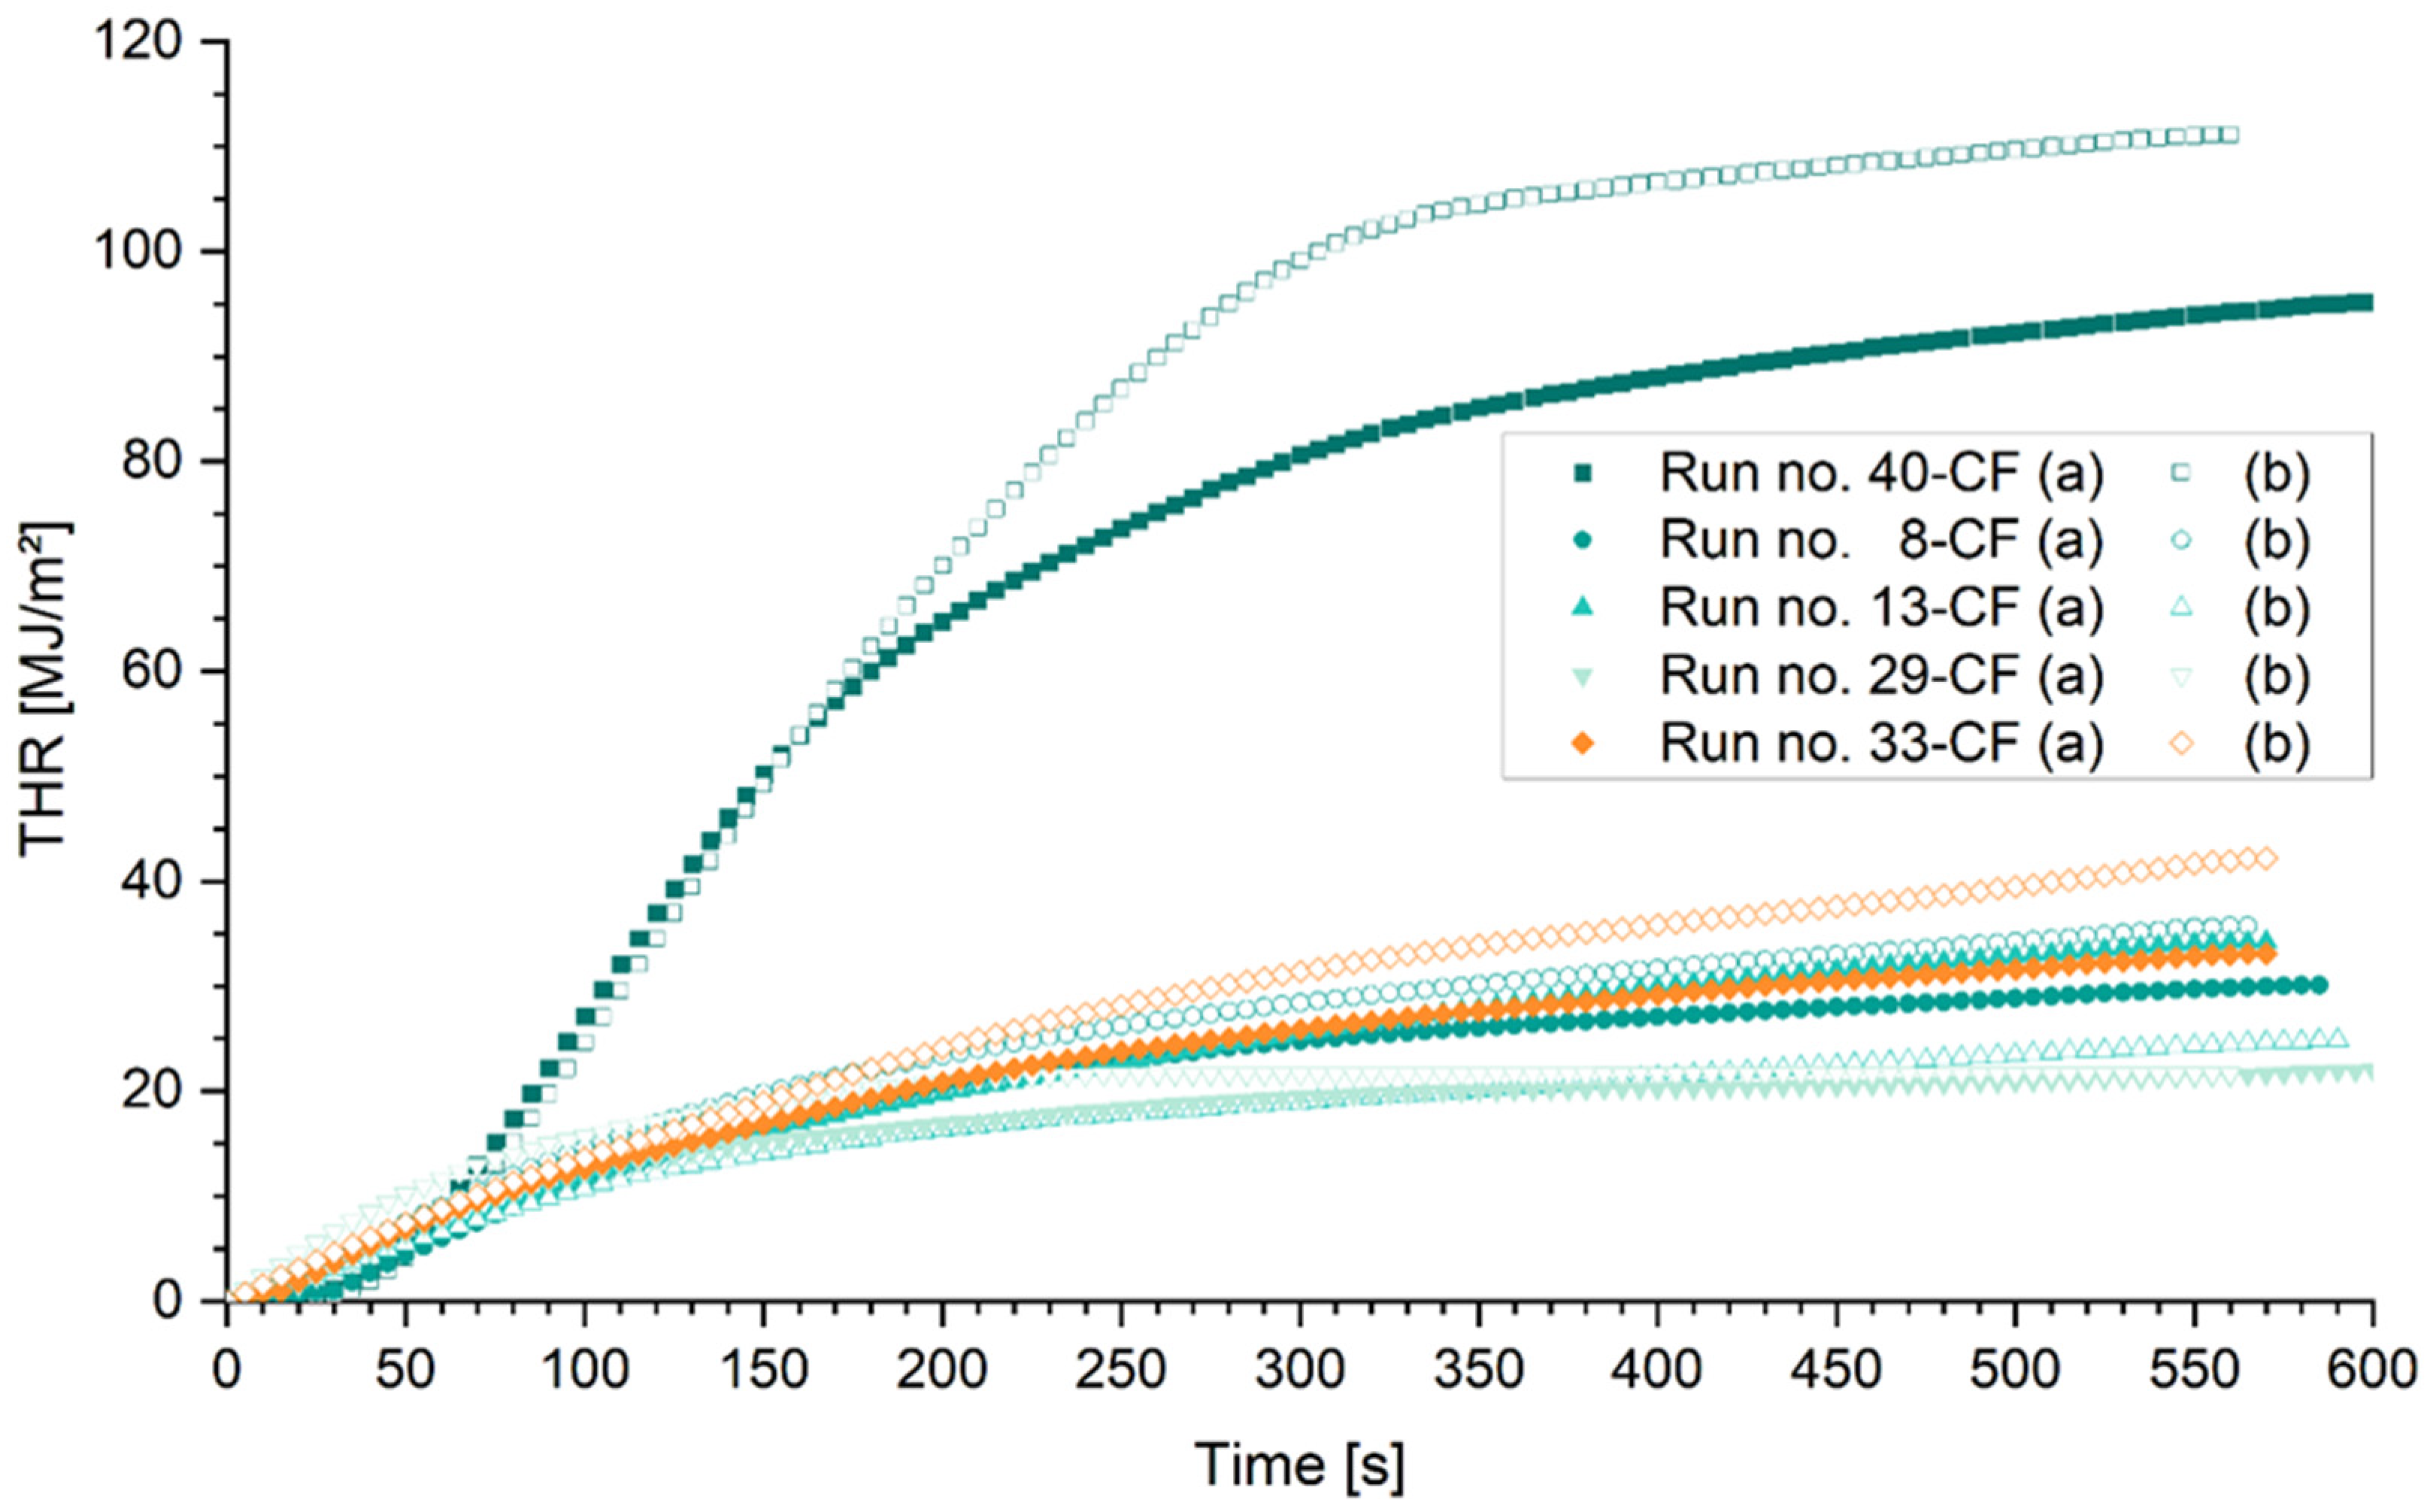
| CFRP Mixtures | ||||||||||
| Run No. 40 CF | Run No. 8 CF | Run No. 13 CF | Run No. 29 CF | Run No. 33 CF | ||||||
| (a) | (b) | (a) | (b) | (a) | (b) | (a) | (b) | (a) | (b) | |
| THR100s [MJ/m2] | 27.1 | 24.6 | 11.5 | 14.6 | 11.8 | 10.7 | 12.2 | 15.7 | 12.65 | 13.6 |
| THR600s [MJ/m2] | 95.0 | 111.0 | 30.0 | 35.6 | 34.1 | 24.7 | 21.9 | 21.7 | 33.0 | 41.9 |
| Average HRR180s [kW/m2] | 289 | 273 | 95 | 97 | 80 | 69 | 76 | 97 | 91 | 98 |
| pHRR [kW/m2] | 537 | 416 | 153 | 135 | 110 | 99 | 139 | 191 | 155 | 134 |
| Mass [g] | 58.06 | 57.87 | 39.39 | 43.75 | 42.5 | 40.2 | 40.35 | 41.05 | 44.38 | 44.70 |
| Spec. THR600s [MJ/m2·g] | 1.63 | 1.92 | 0.76 | 0.81 | 0.8 | 0.62 | 0.54 | 0.53 | 0.74 | 0.94 |
| TTI [s] | 38 | 37 | 28 | 26 | 29 | 28 | 27 | 22 | 27 | 24 |
| pCOP [ppm] | 151 | 181 | 102 | 143 | 53 | 88 | 99 | 135 | 73 | 56 |
| pCO2P [ppm] | 9506 | 11509 | 2285 | 2636 | 3474 | 3643 | 2809 | 3262 | 3283 | 3886 |
| Mean (CoV) Differences between Polymer to CFRP Samples 1 | ||||||||||
| ∆Spec. THR600s | 28.1% (31.0%) | 42.5% (1.6%) | 63.2% (7.7%) | 53.0% (5.4%) | 45.5% (18%) | |||||
| ∆Avg. HHR180s | 16.3% (13.1%) | 1.5% (45.2%) | 55.4% (7.7%) | 16.0% (114.9%) | 35.2% (3.2%) | |||||
| ∆pHHR | 22.8% (26.7%) | 12.4% (65.22%) | 58.3% (5.9%) | −23.3% (150%) | 33.2% (29.8%) | |||||
| ∆TTI | −29.3% (8.3%) | 15.6% (2.6%) | 28.8% (6.5%) | 30.0% (7.2%) | 35.4% (5.1%) | |||||
| ∆pCOP | 68.6% (7.3%) | 38.1% (12.2%) | 48.4% (20.9%) | 36.8% (15.5%) | 55.5% (12.7%) | |||||
| ∆pCO2P | 62.4% (9.3%) | 29.5% (8.4%) | 60.3% (5.9%) | 48.8% (6.7%) | 61.9% (8.4%) | |||||
Disclaimer/Publisher’s Note: The statements, opinions and data contained in all publications are solely those of the individual author(s) and contributor(s) and not of MDPI and/or the editor(s). MDPI and/or the editor(s) disclaim responsibility for any injury to people or property resulting from any ideas, methods, instructions or products referred to in the content. |
© 2023 by the authors. Licensee MDPI, Basel, Switzerland. This article is an open access article distributed under the terms and conditions of the Creative Commons Attribution (CC BY) license (https://creativecommons.org/licenses/by/4.0/).
Share and Cite
Pöhler, C.M.; Hamza, M.; Kolb, T.; Bachtiar, E.V.; Yan, L.; Kasal, B. Design of Experiments-Based Fire Performance Optimization of Epoxy and Carbon-Fiber-Reinforced Epoxy Polymer Composites. Polymers 2023, 15, 4096. https://doi.org/10.3390/polym15204096
Pöhler CM, Hamza M, Kolb T, Bachtiar EV, Yan L, Kasal B. Design of Experiments-Based Fire Performance Optimization of Epoxy and Carbon-Fiber-Reinforced Epoxy Polymer Composites. Polymers. 2023; 15(20):4096. https://doi.org/10.3390/polym15204096
Chicago/Turabian StylePöhler, Christoph M., Marwa Hamza, Torsten Kolb, Erik V. Bachtiar, Libo Yan, and Bohumil Kasal. 2023. "Design of Experiments-Based Fire Performance Optimization of Epoxy and Carbon-Fiber-Reinforced Epoxy Polymer Composites" Polymers 15, no. 20: 4096. https://doi.org/10.3390/polym15204096
APA StylePöhler, C. M., Hamza, M., Kolb, T., Bachtiar, E. V., Yan, L., & Kasal, B. (2023). Design of Experiments-Based Fire Performance Optimization of Epoxy and Carbon-Fiber-Reinforced Epoxy Polymer Composites. Polymers, 15(20), 4096. https://doi.org/10.3390/polym15204096