


Examining the Quasi-Static Uniaxial Compressive Behaviour of Commercial High-Performance Epoxy Matrices

 , , and
Abstract
:1. Introduction
2. Materials and Methods
2.1. Cured Epoxy Materials
2.2. Simultaneous Thermal Analysis (STA)
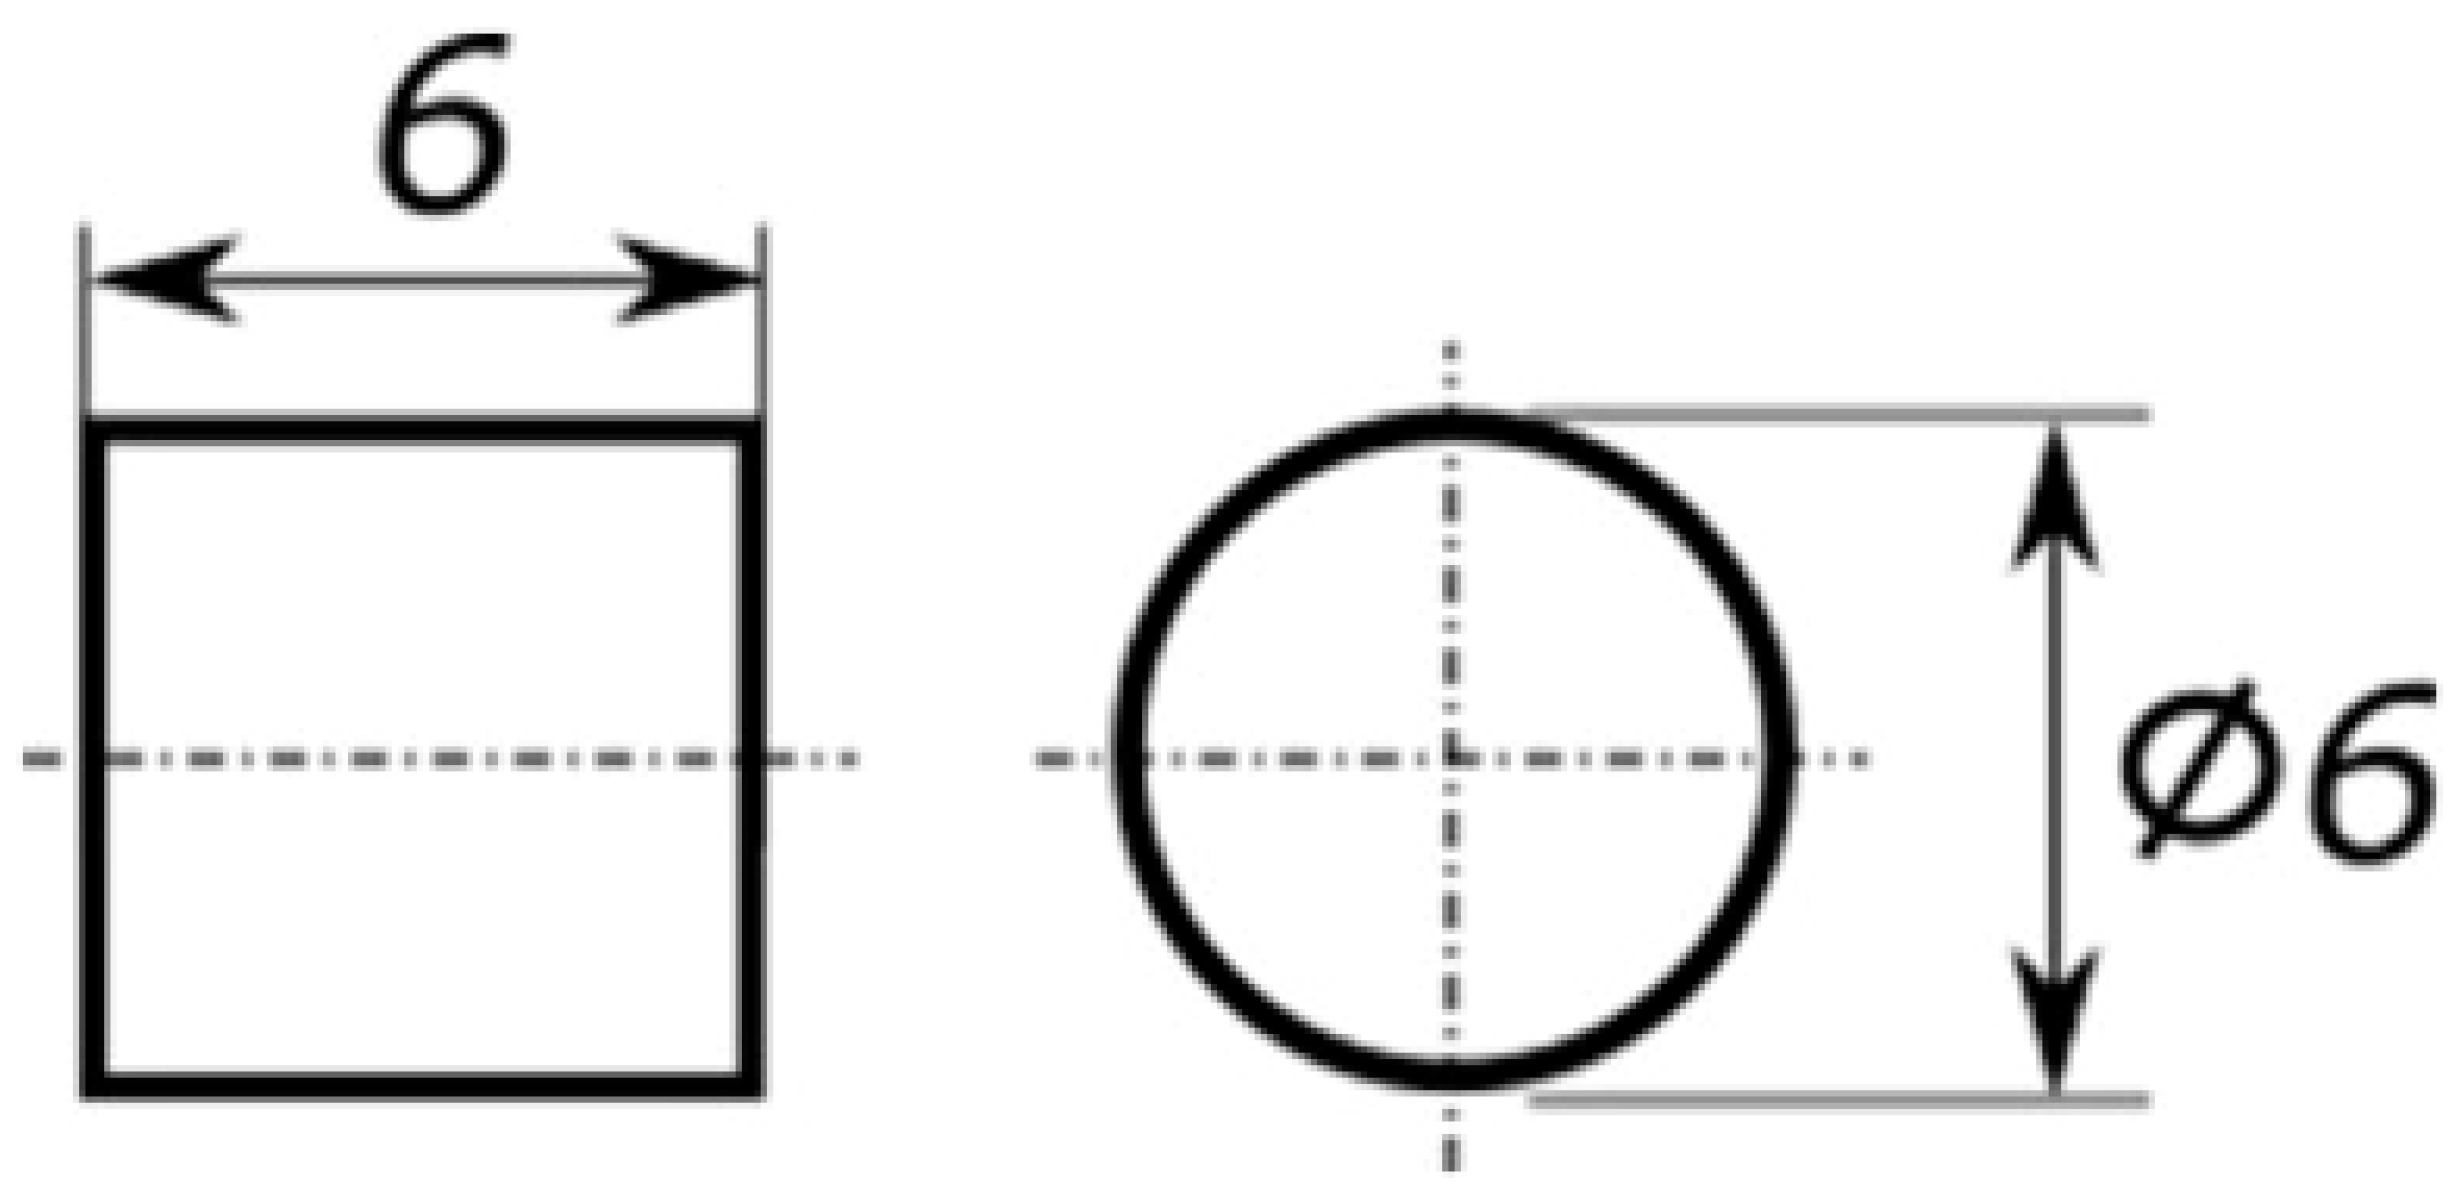
2.3. Preparation of Compression Test Specimens
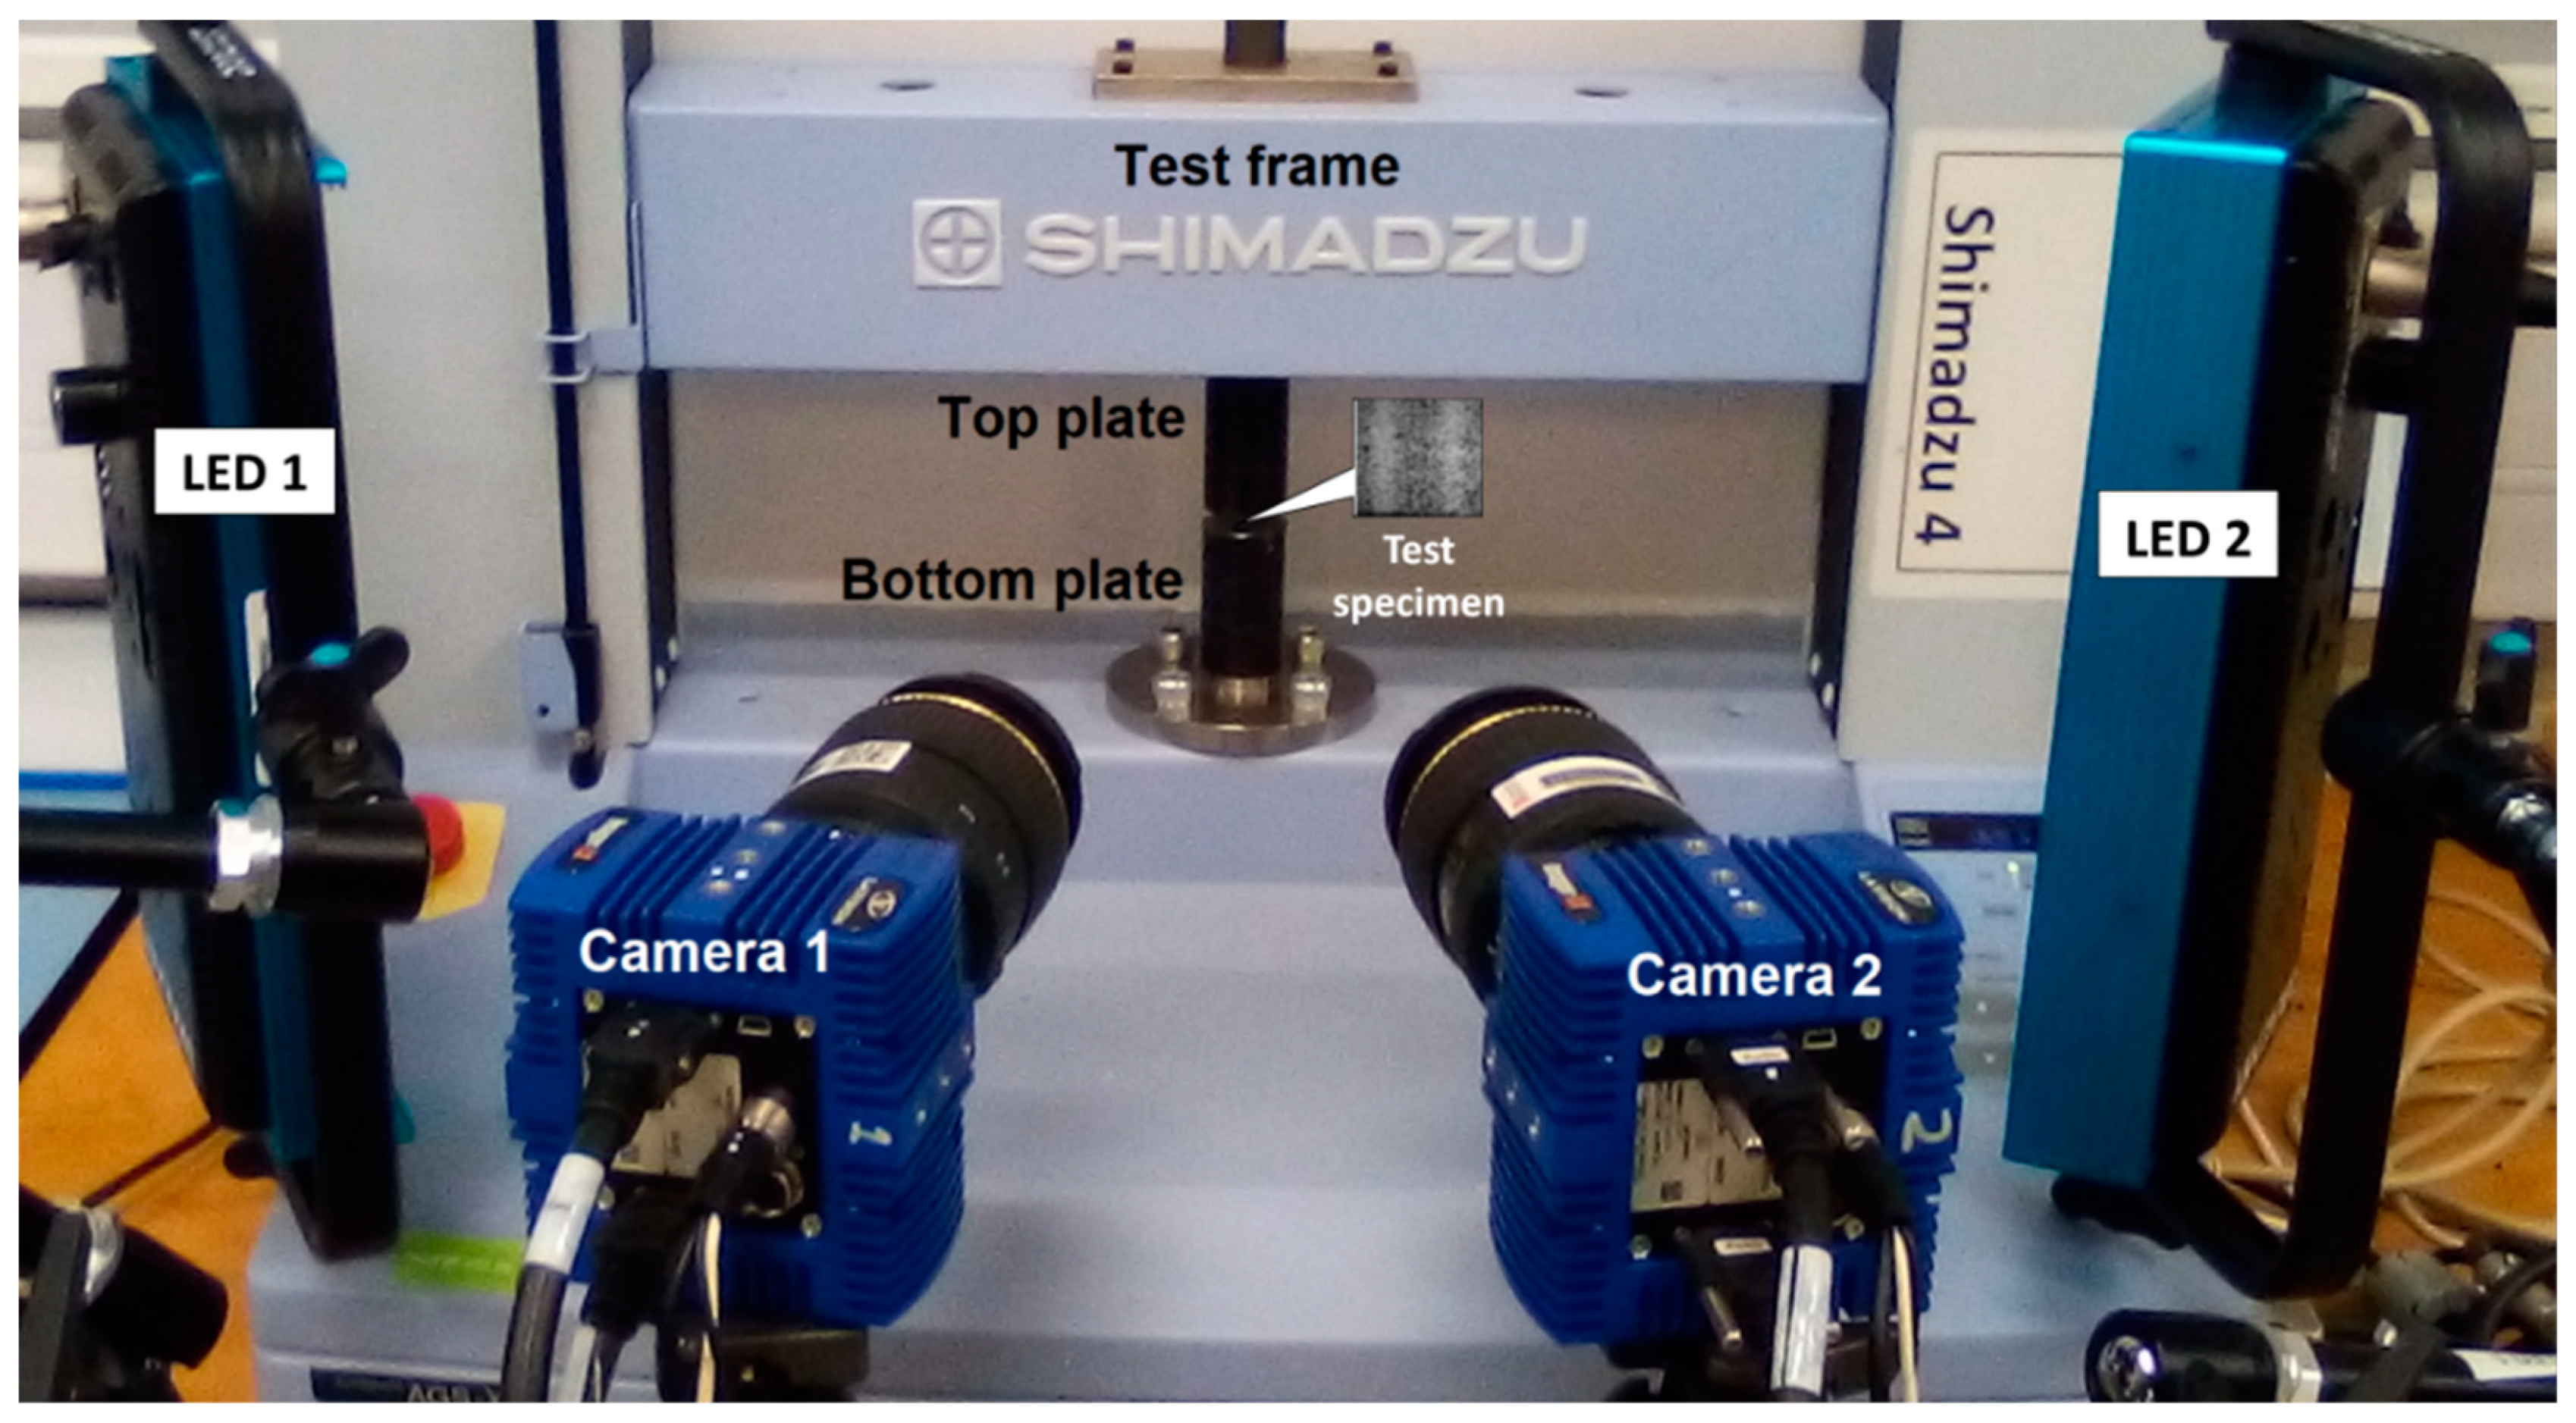
2.4. Quasi-Static Uniaxial Compression Testing
2.5. Digital Image Correlation
2.6. Data Reduction
3. Results and Discussion
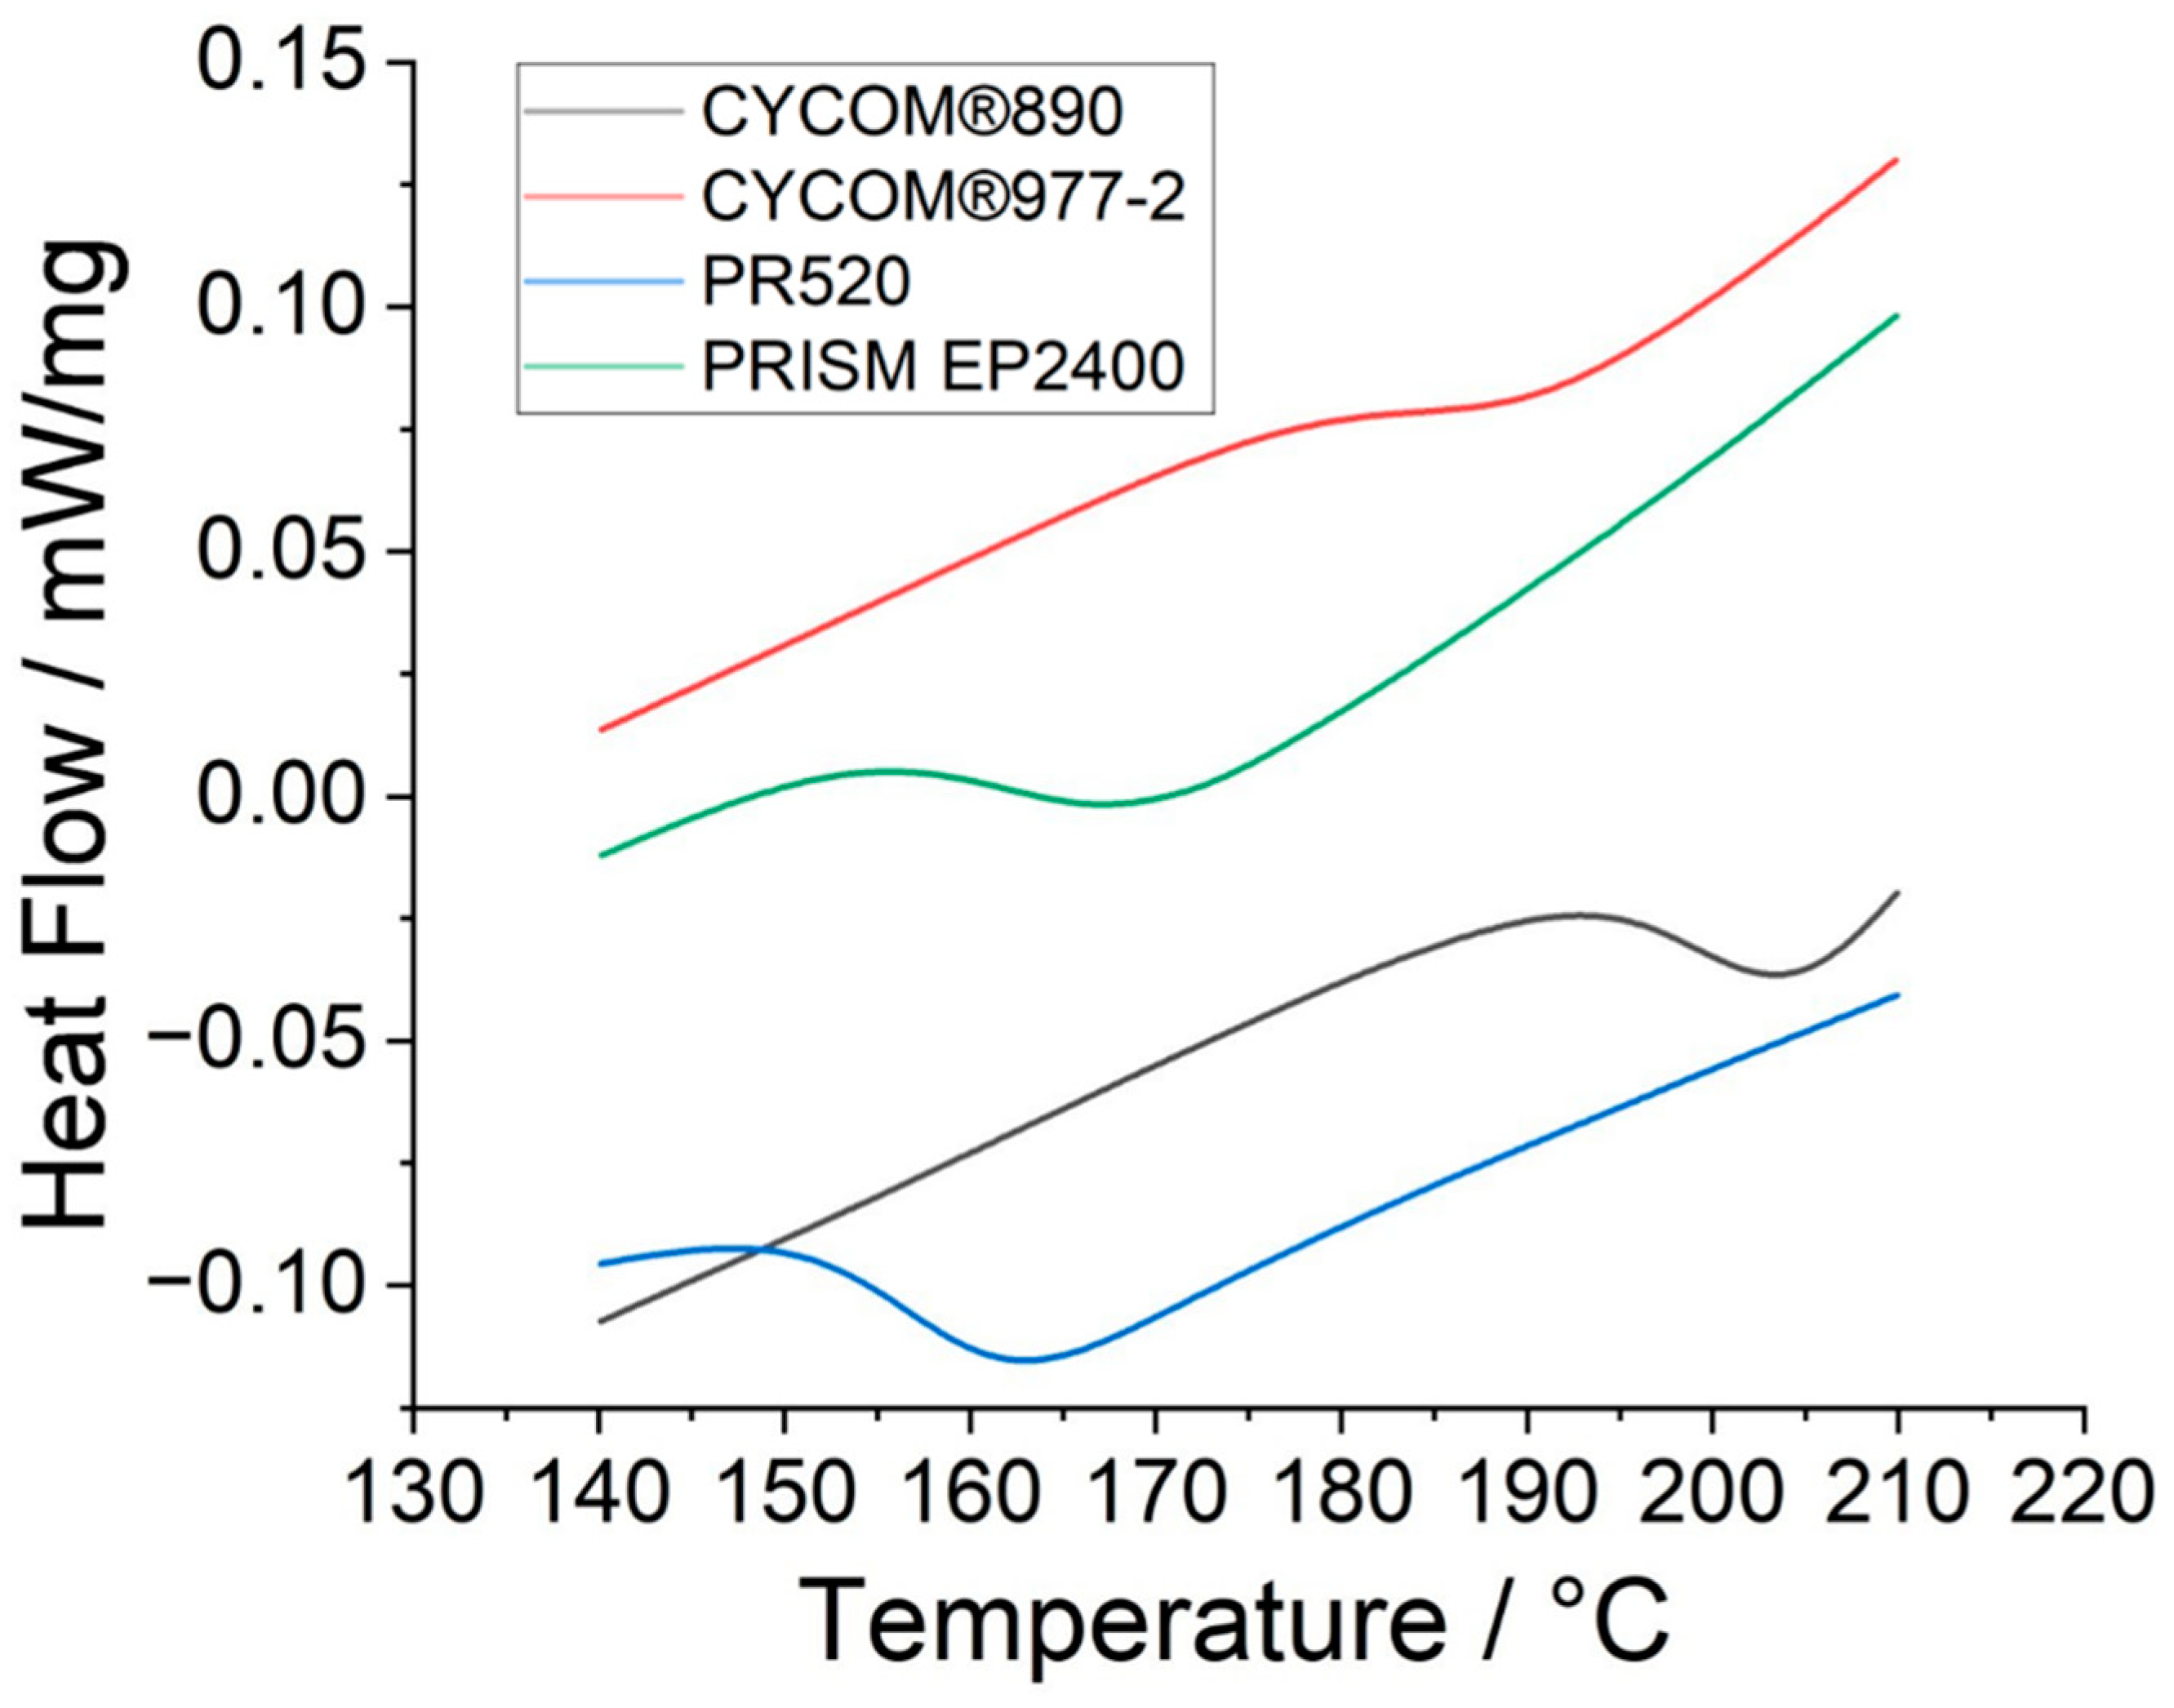
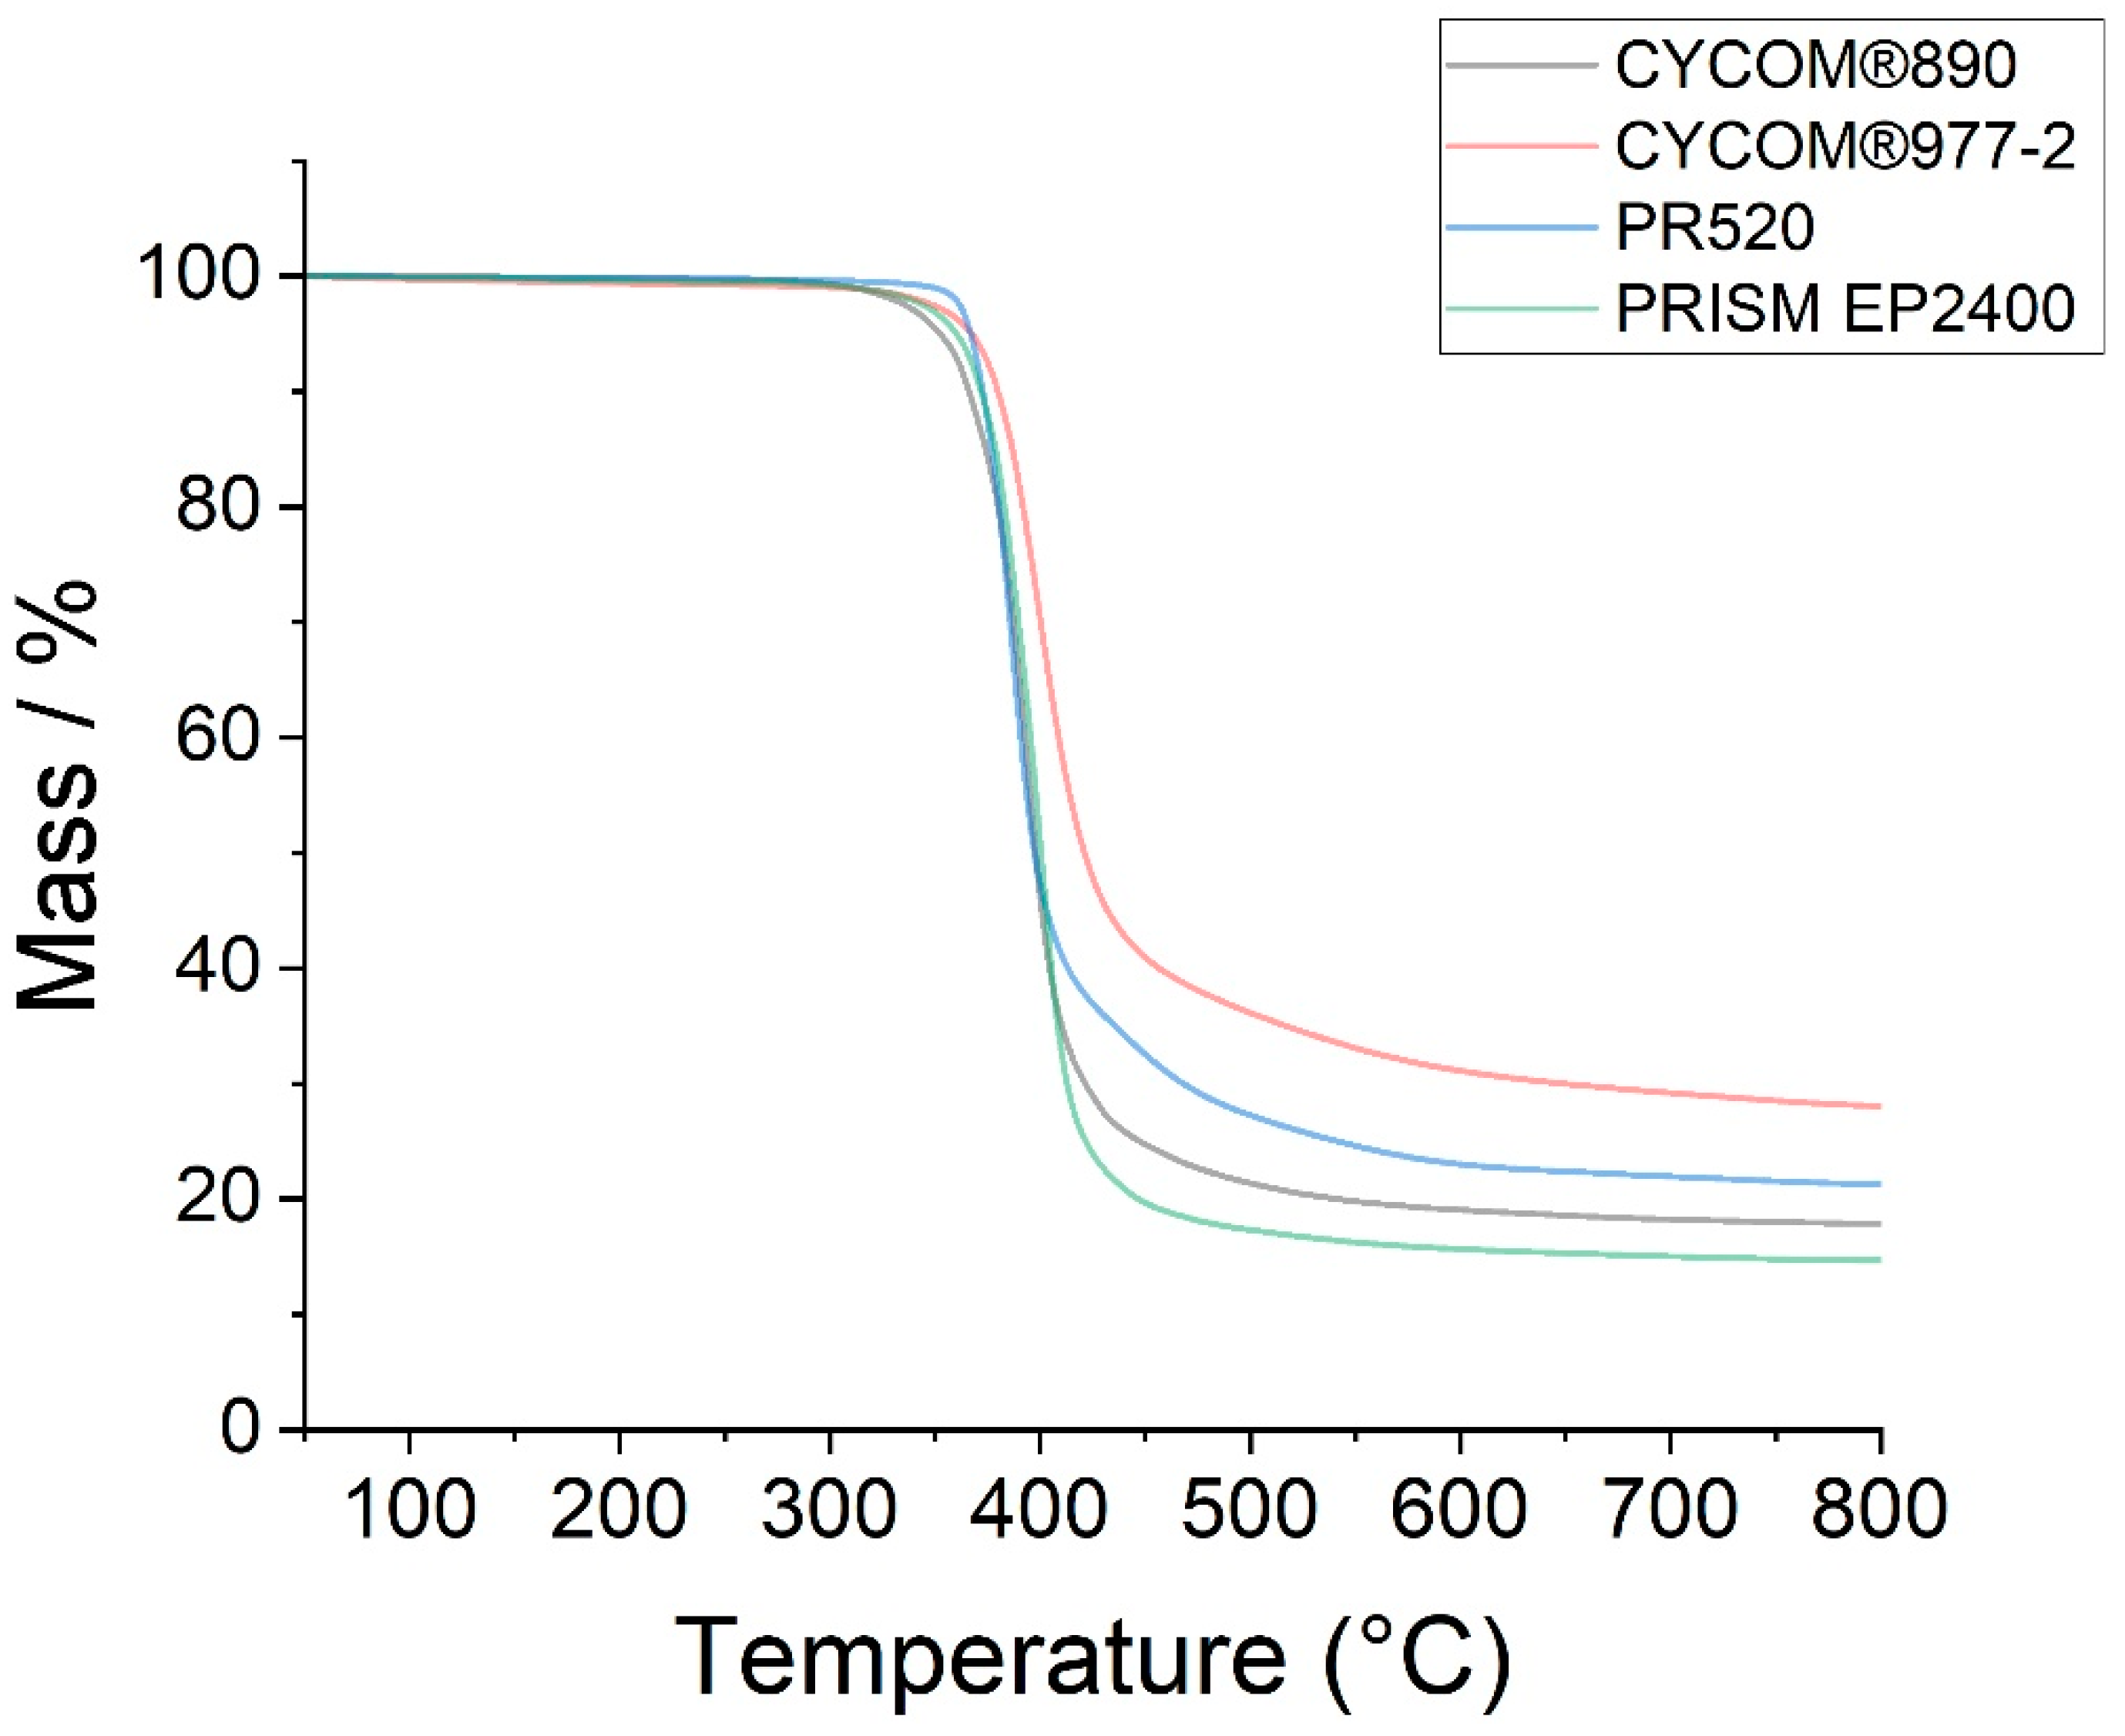
3.1. Simultaneous Thermal Analysis (STA)
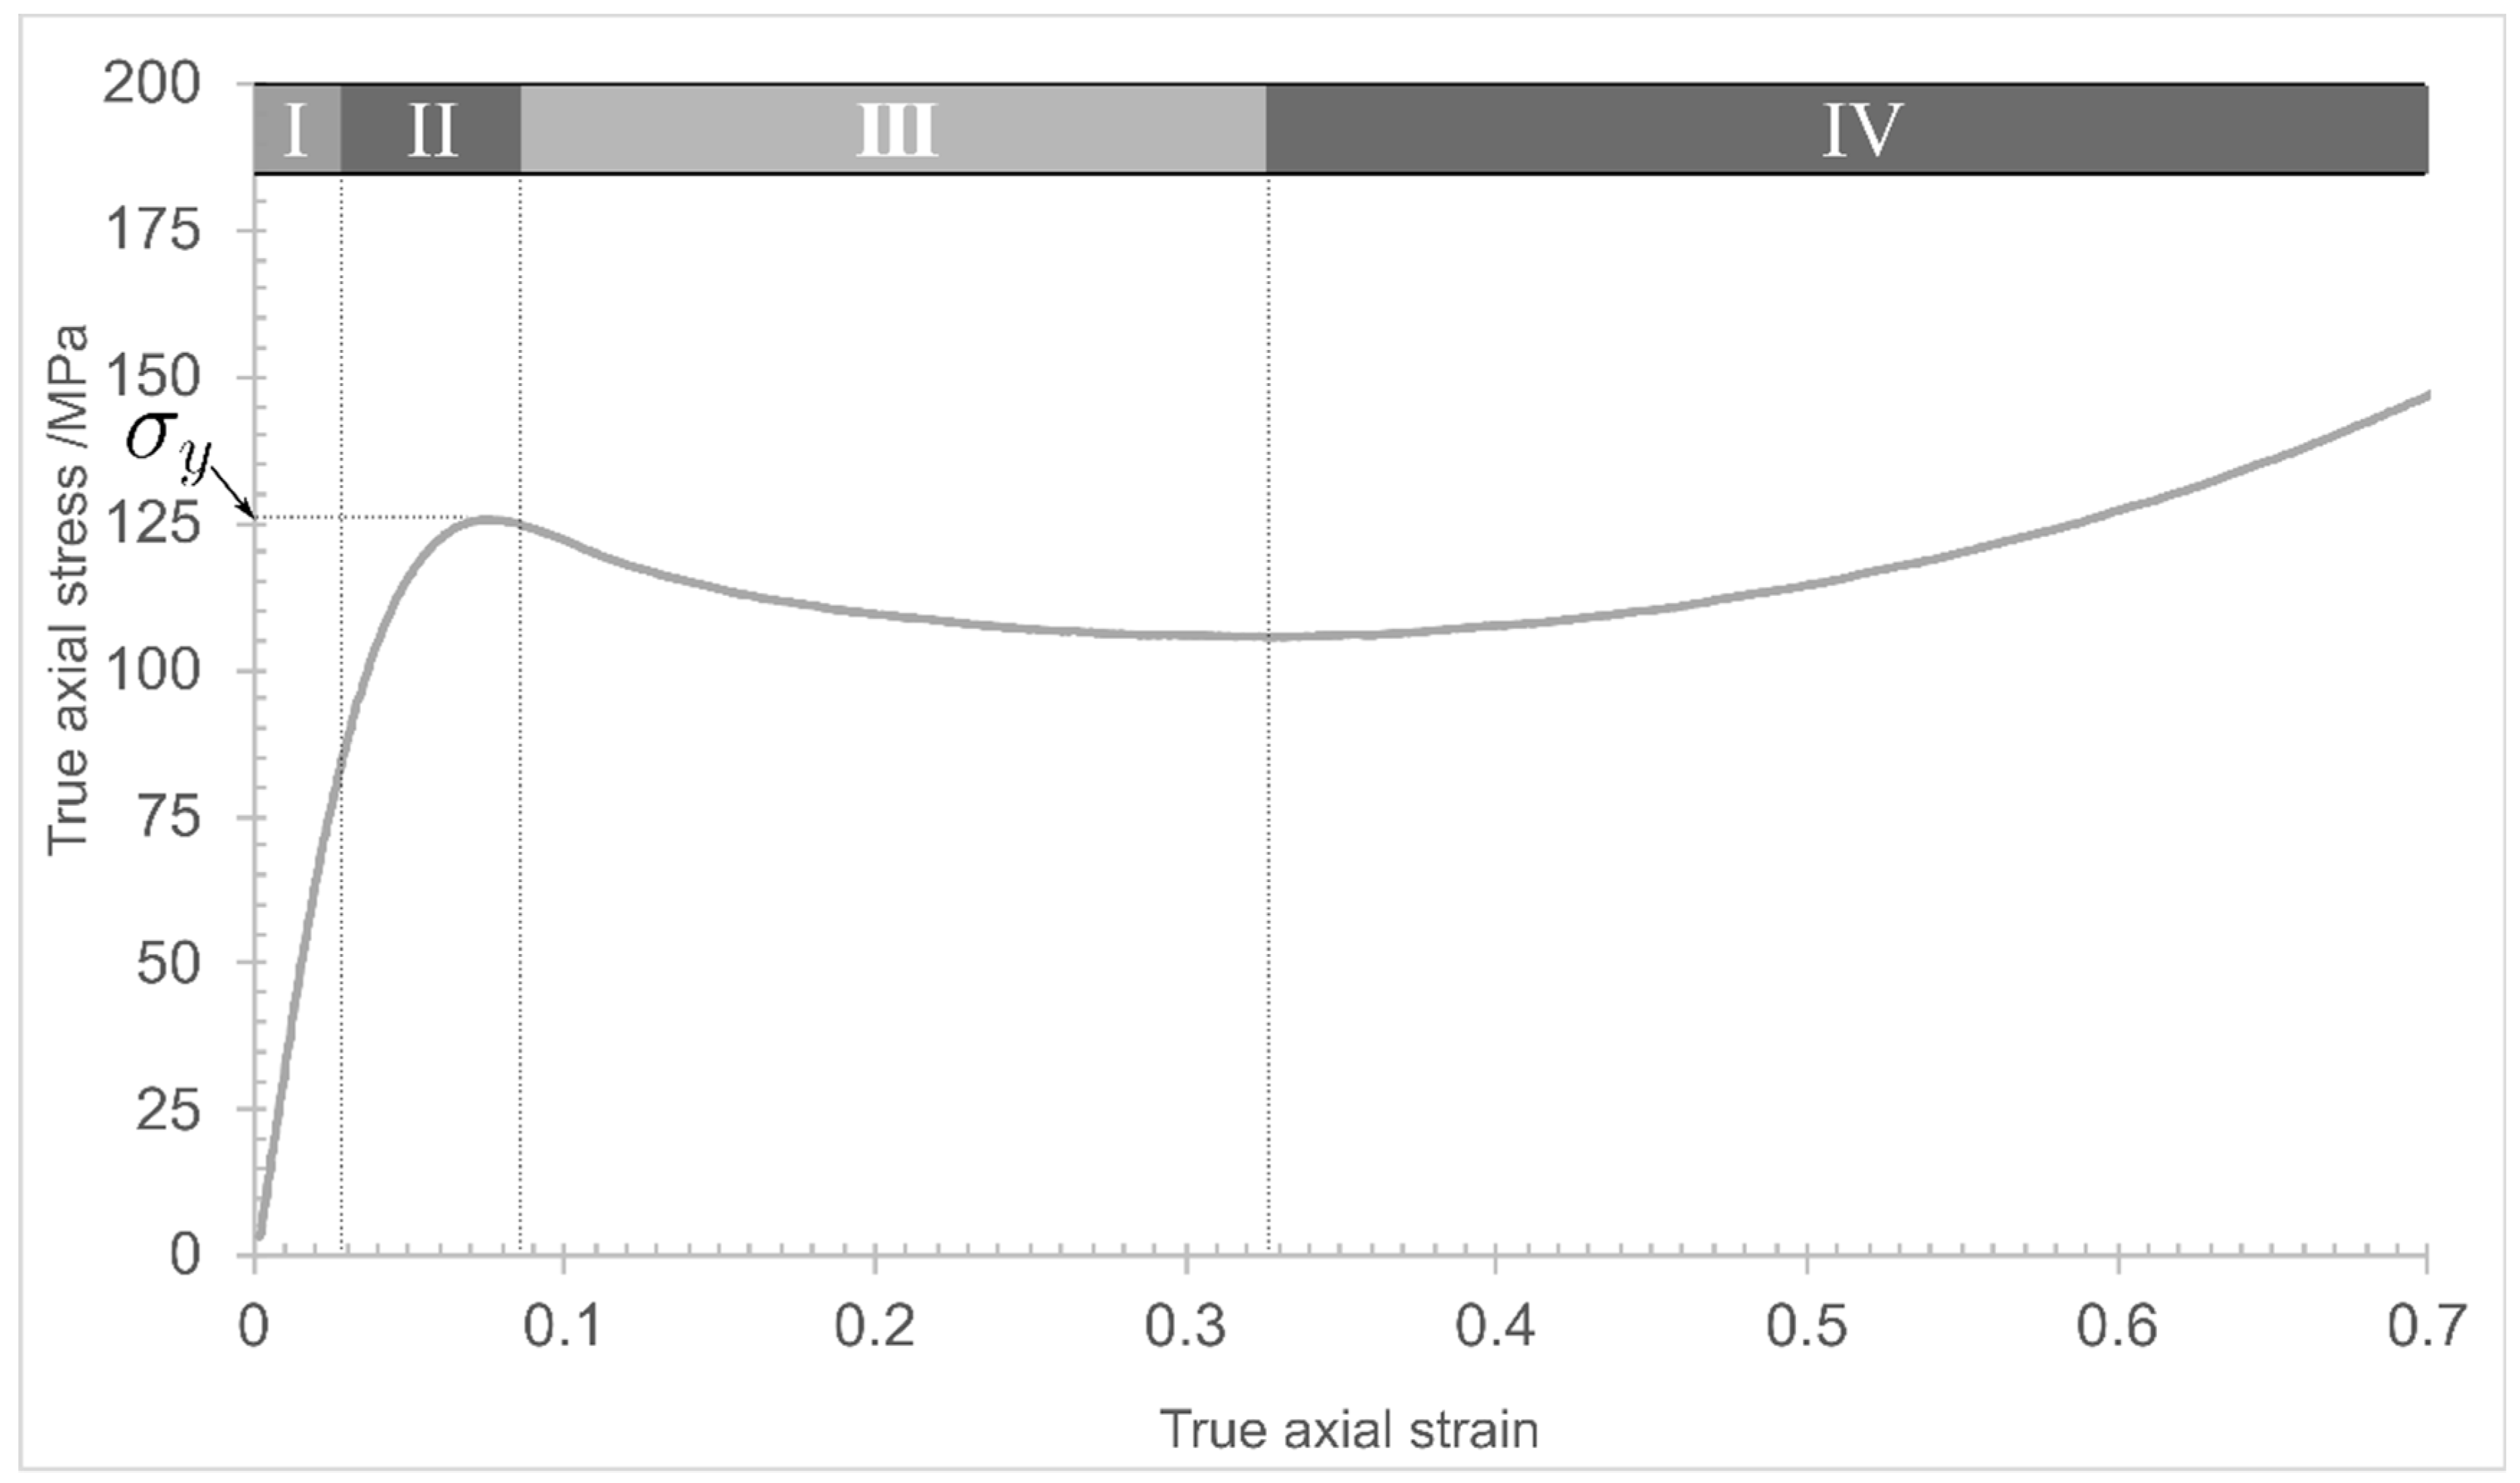
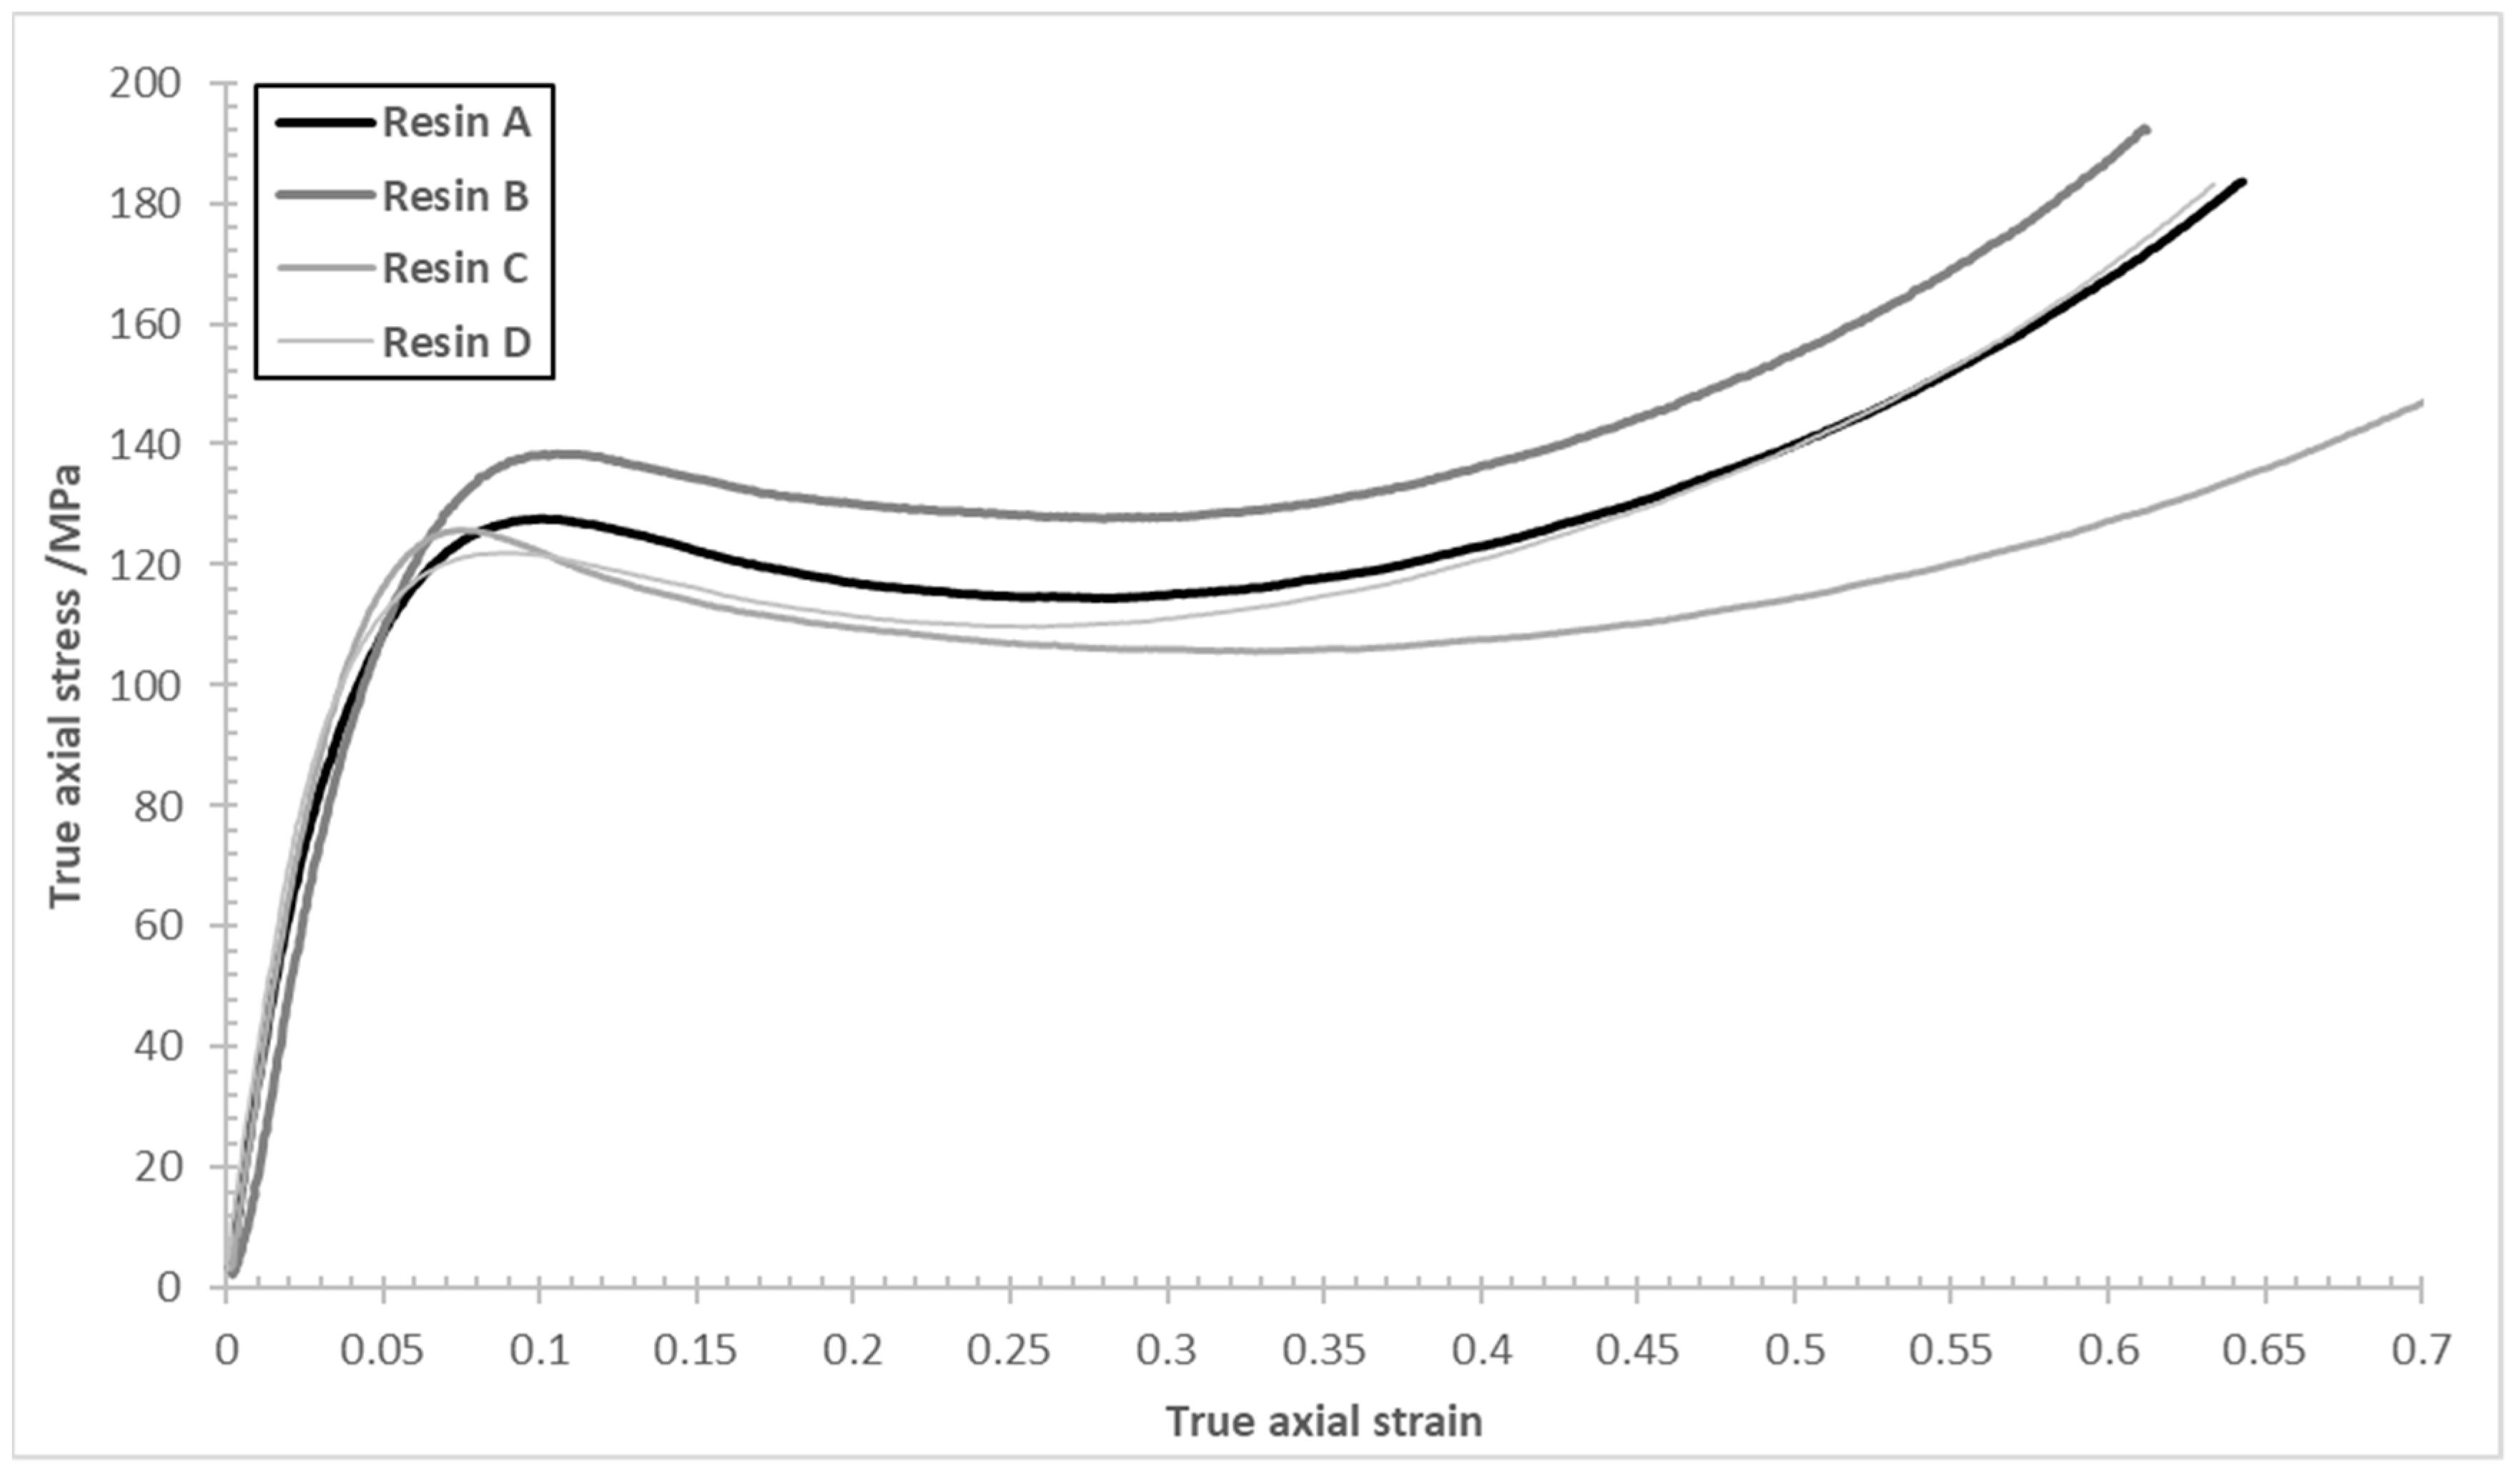
3.2. Quasi-Static Uniaxial Compression Tests
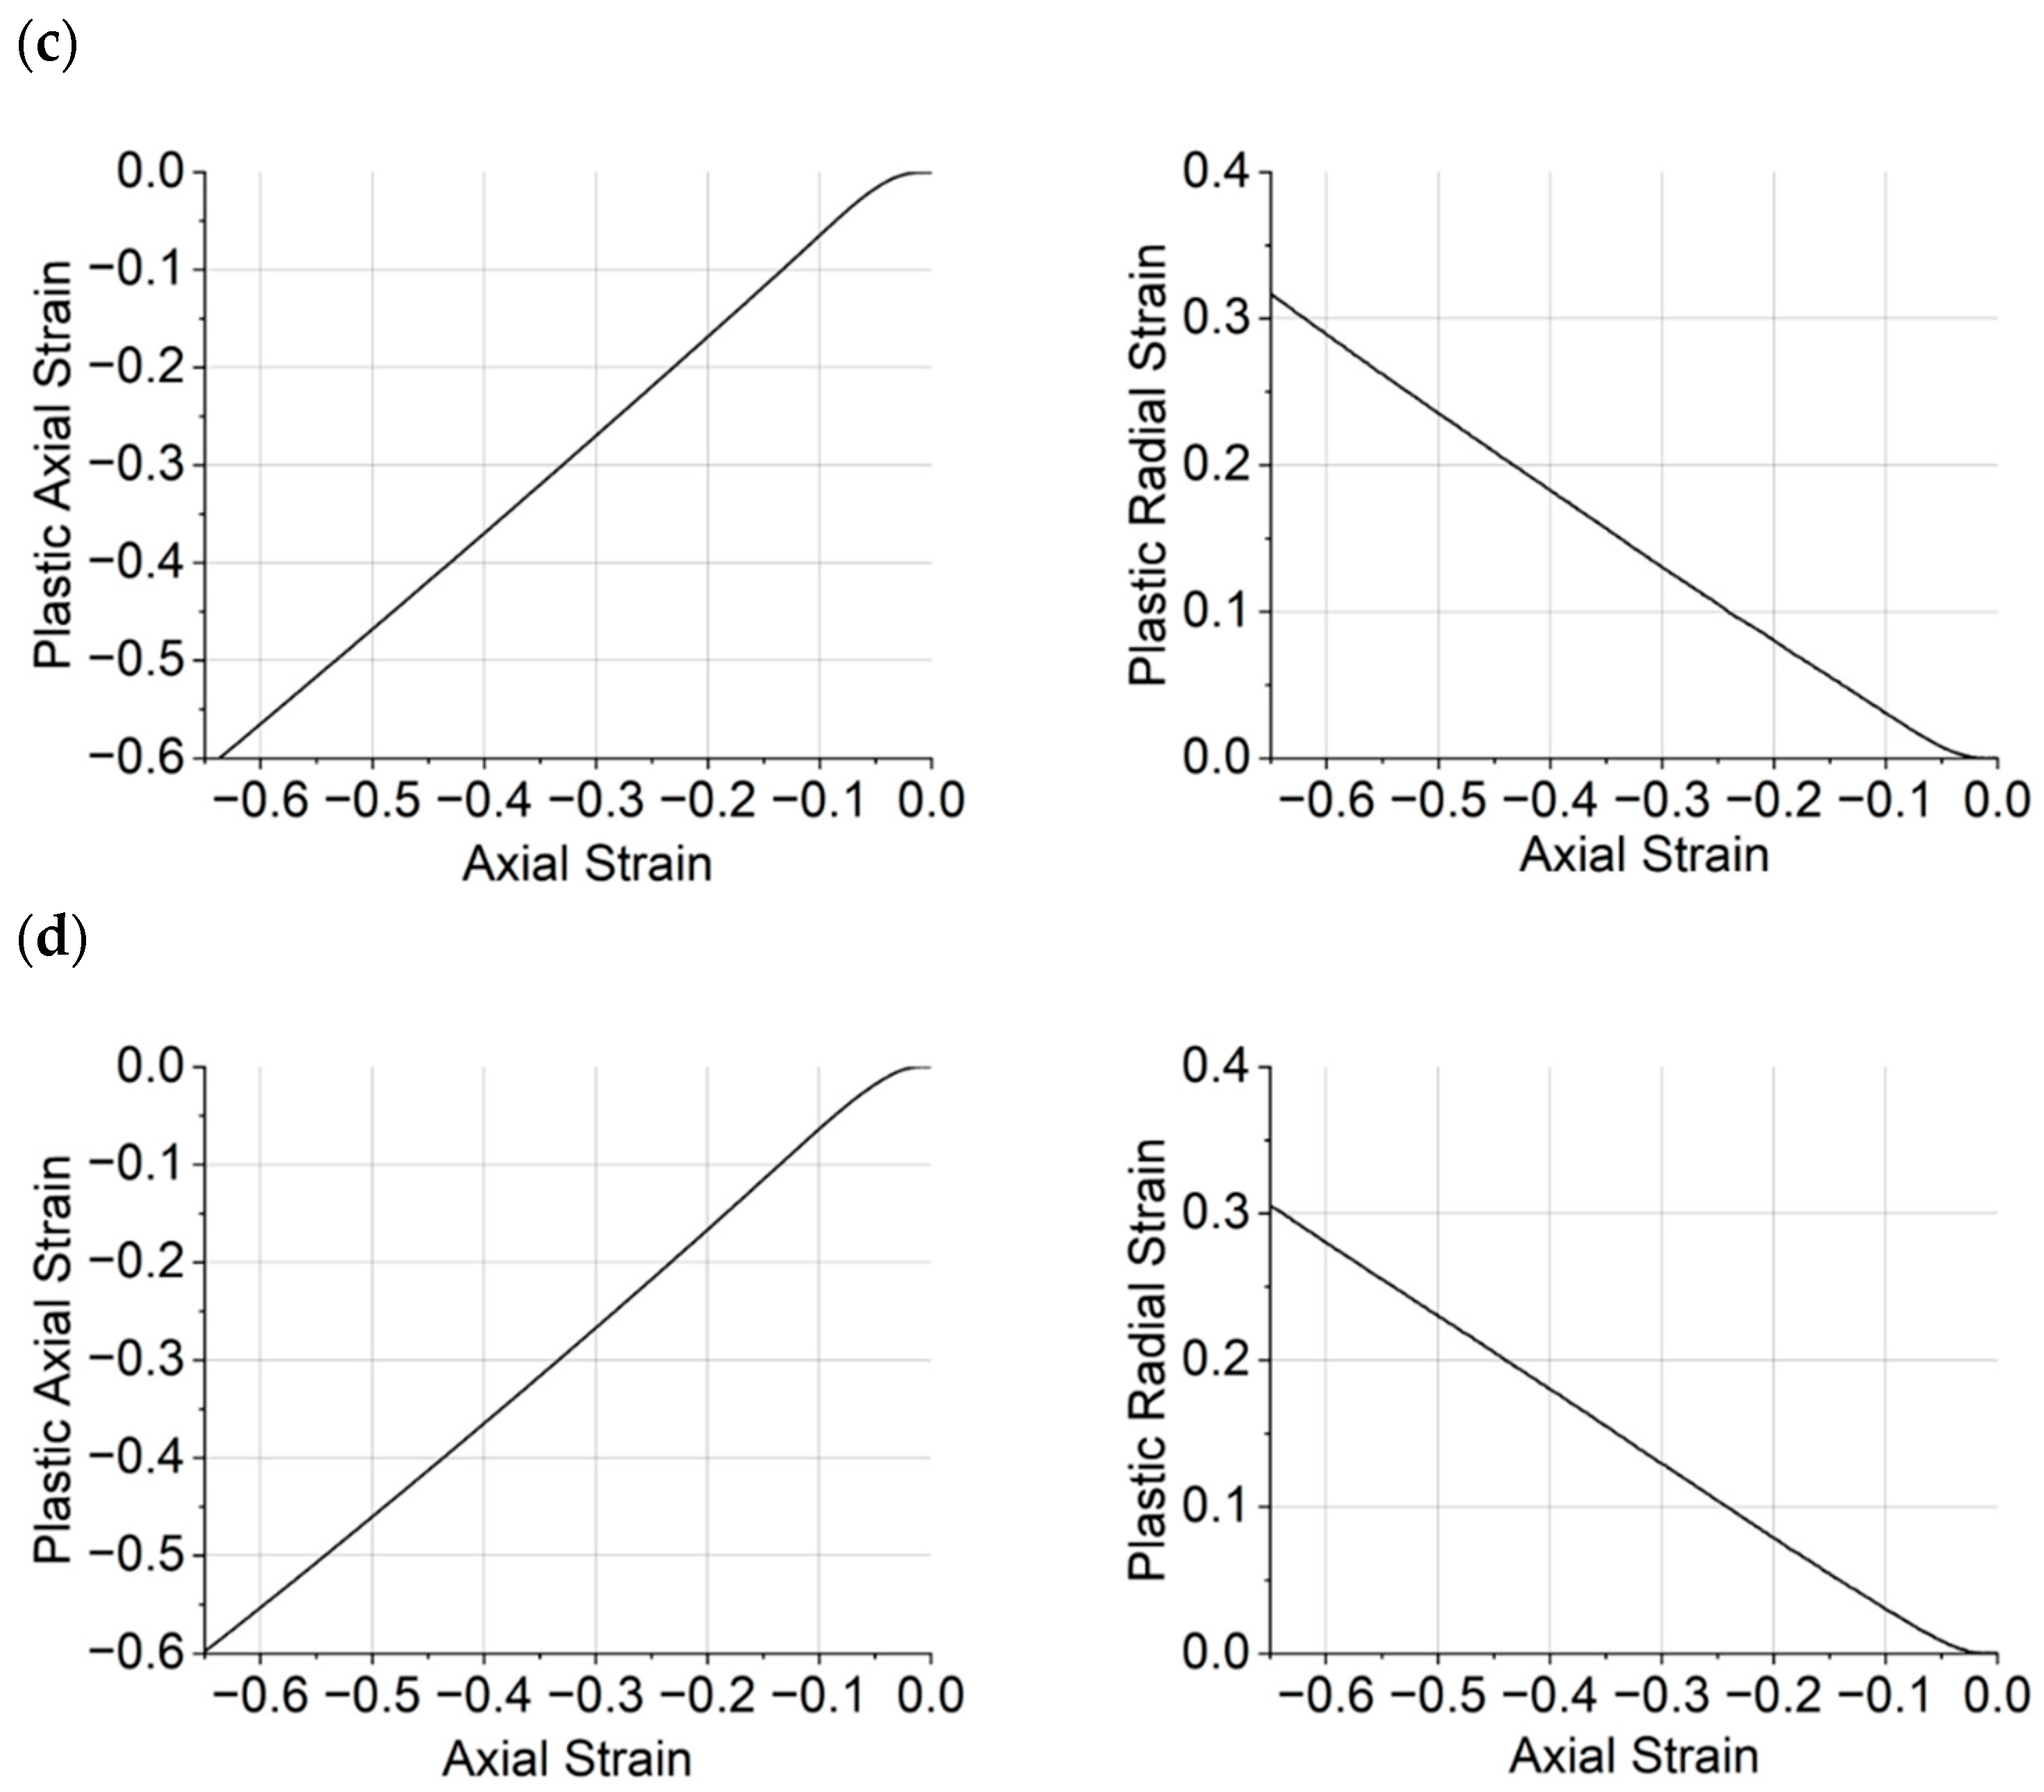
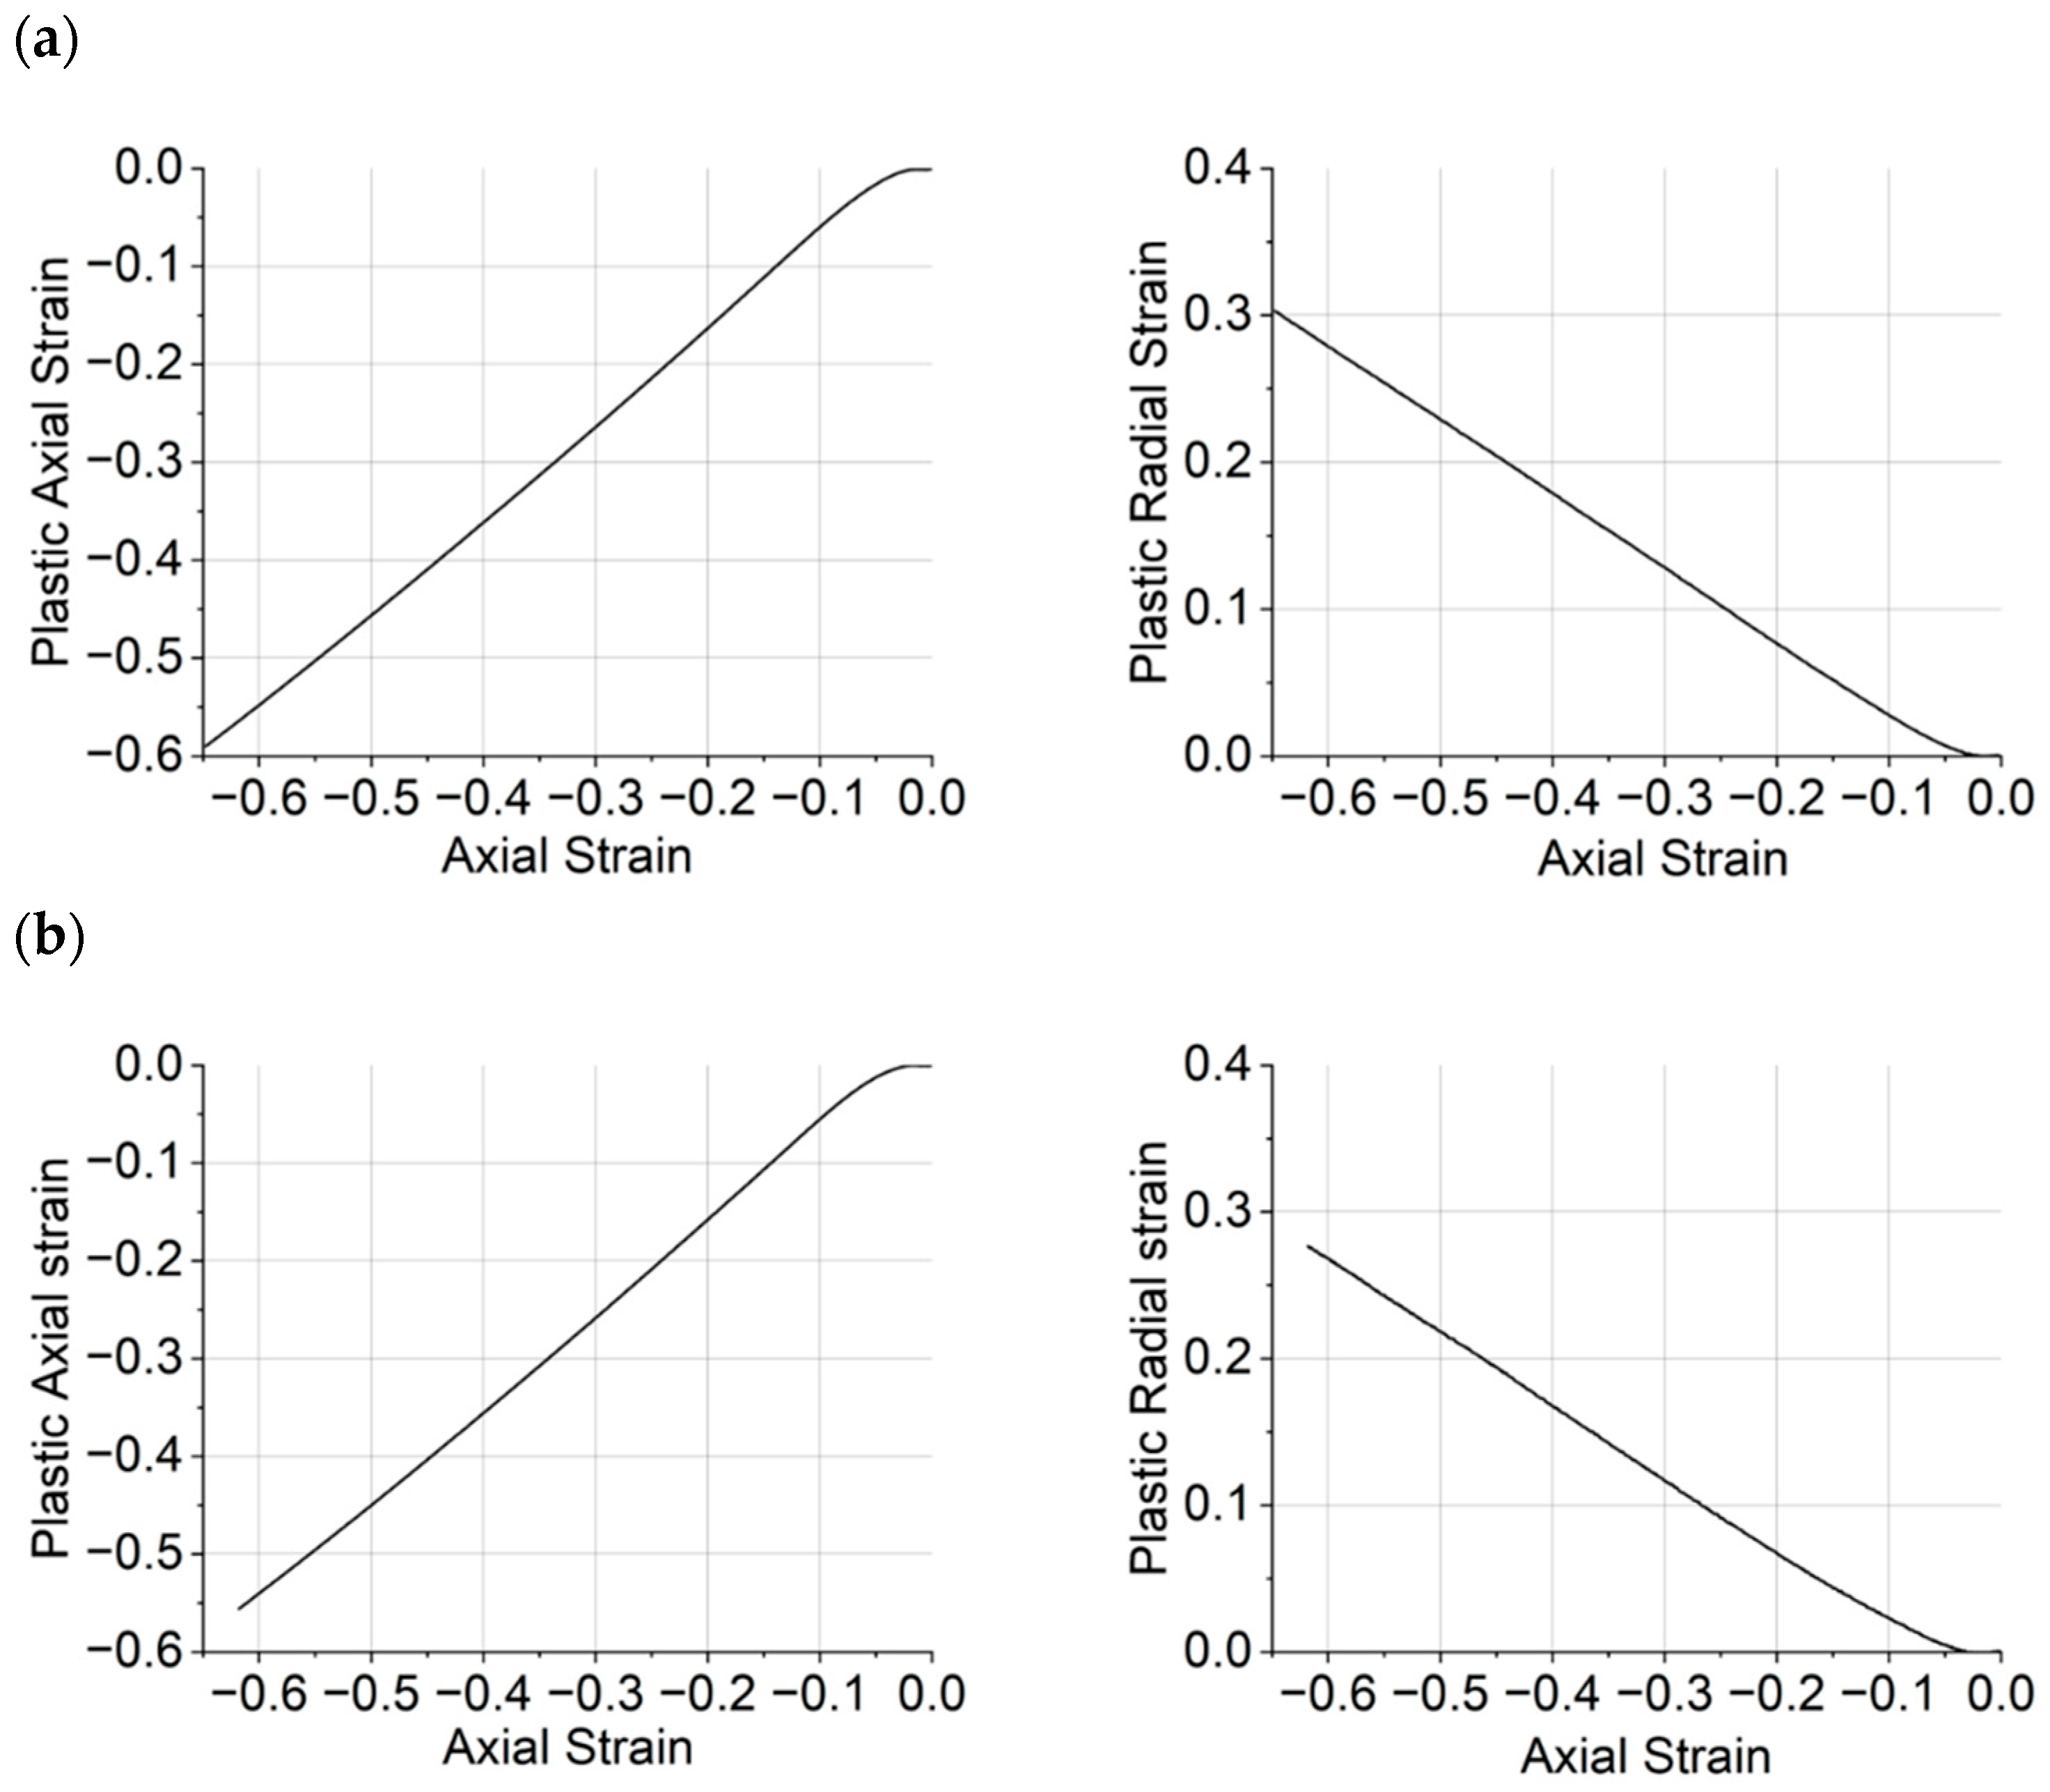
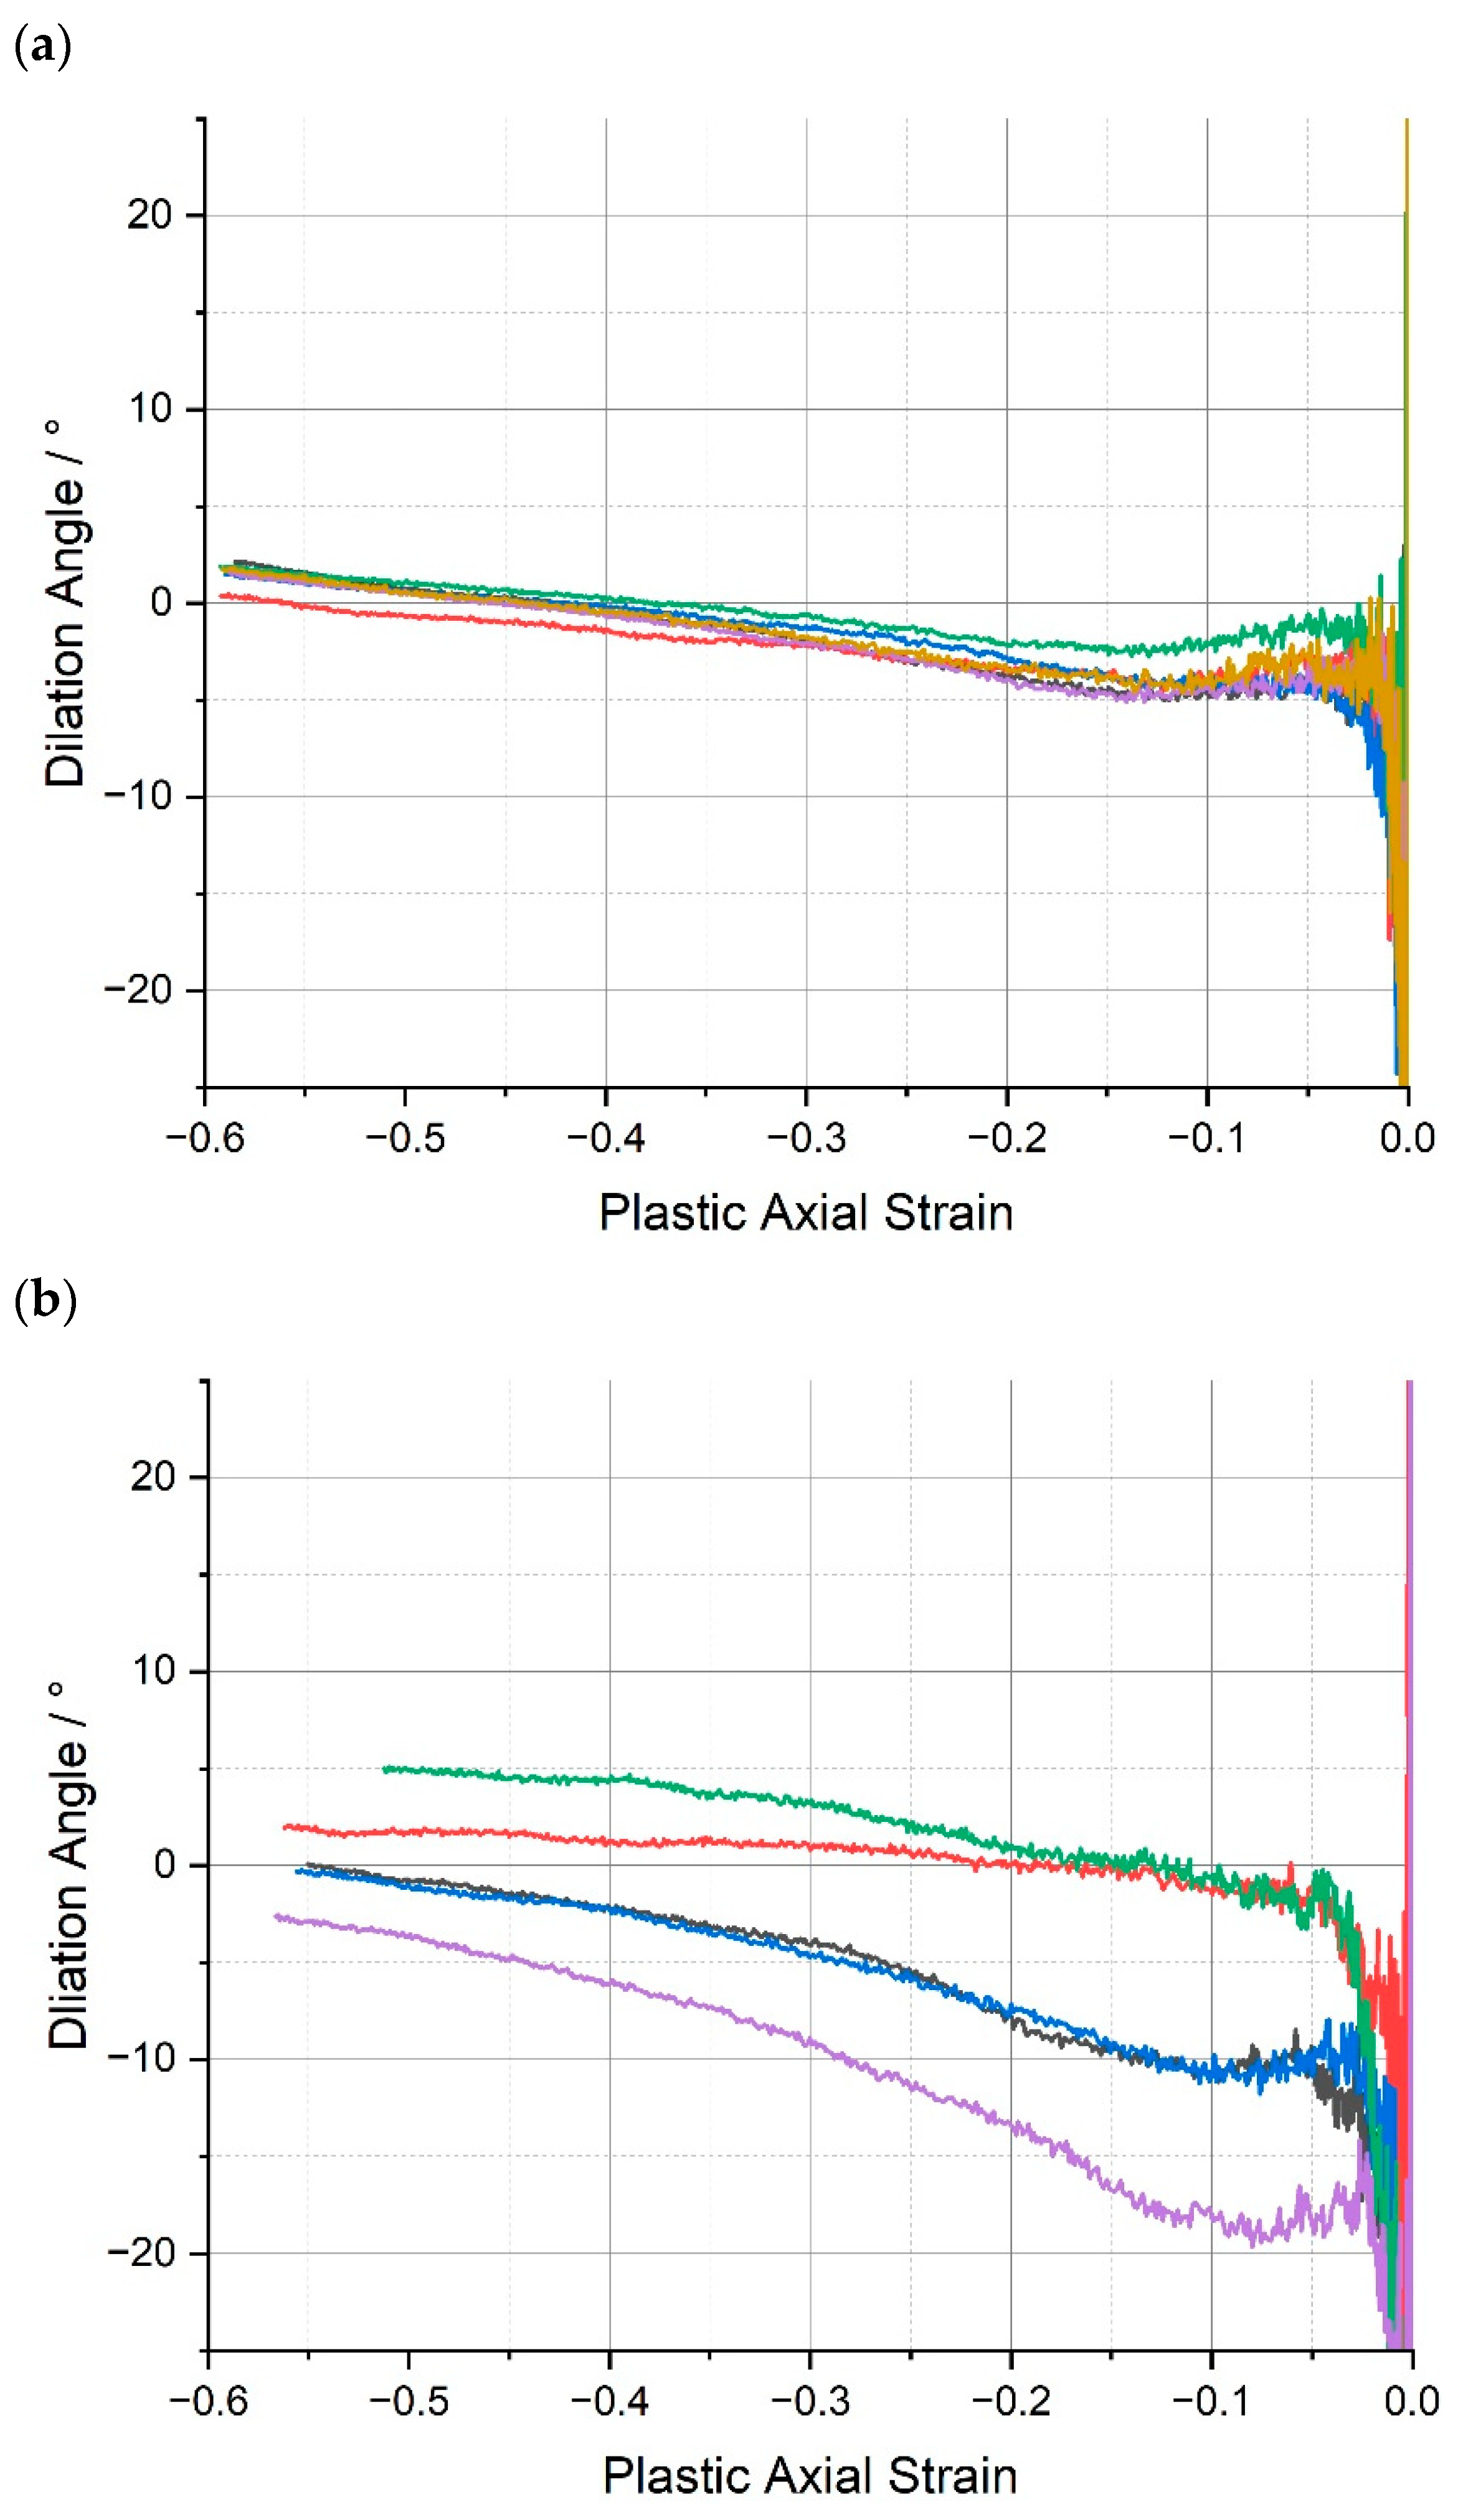
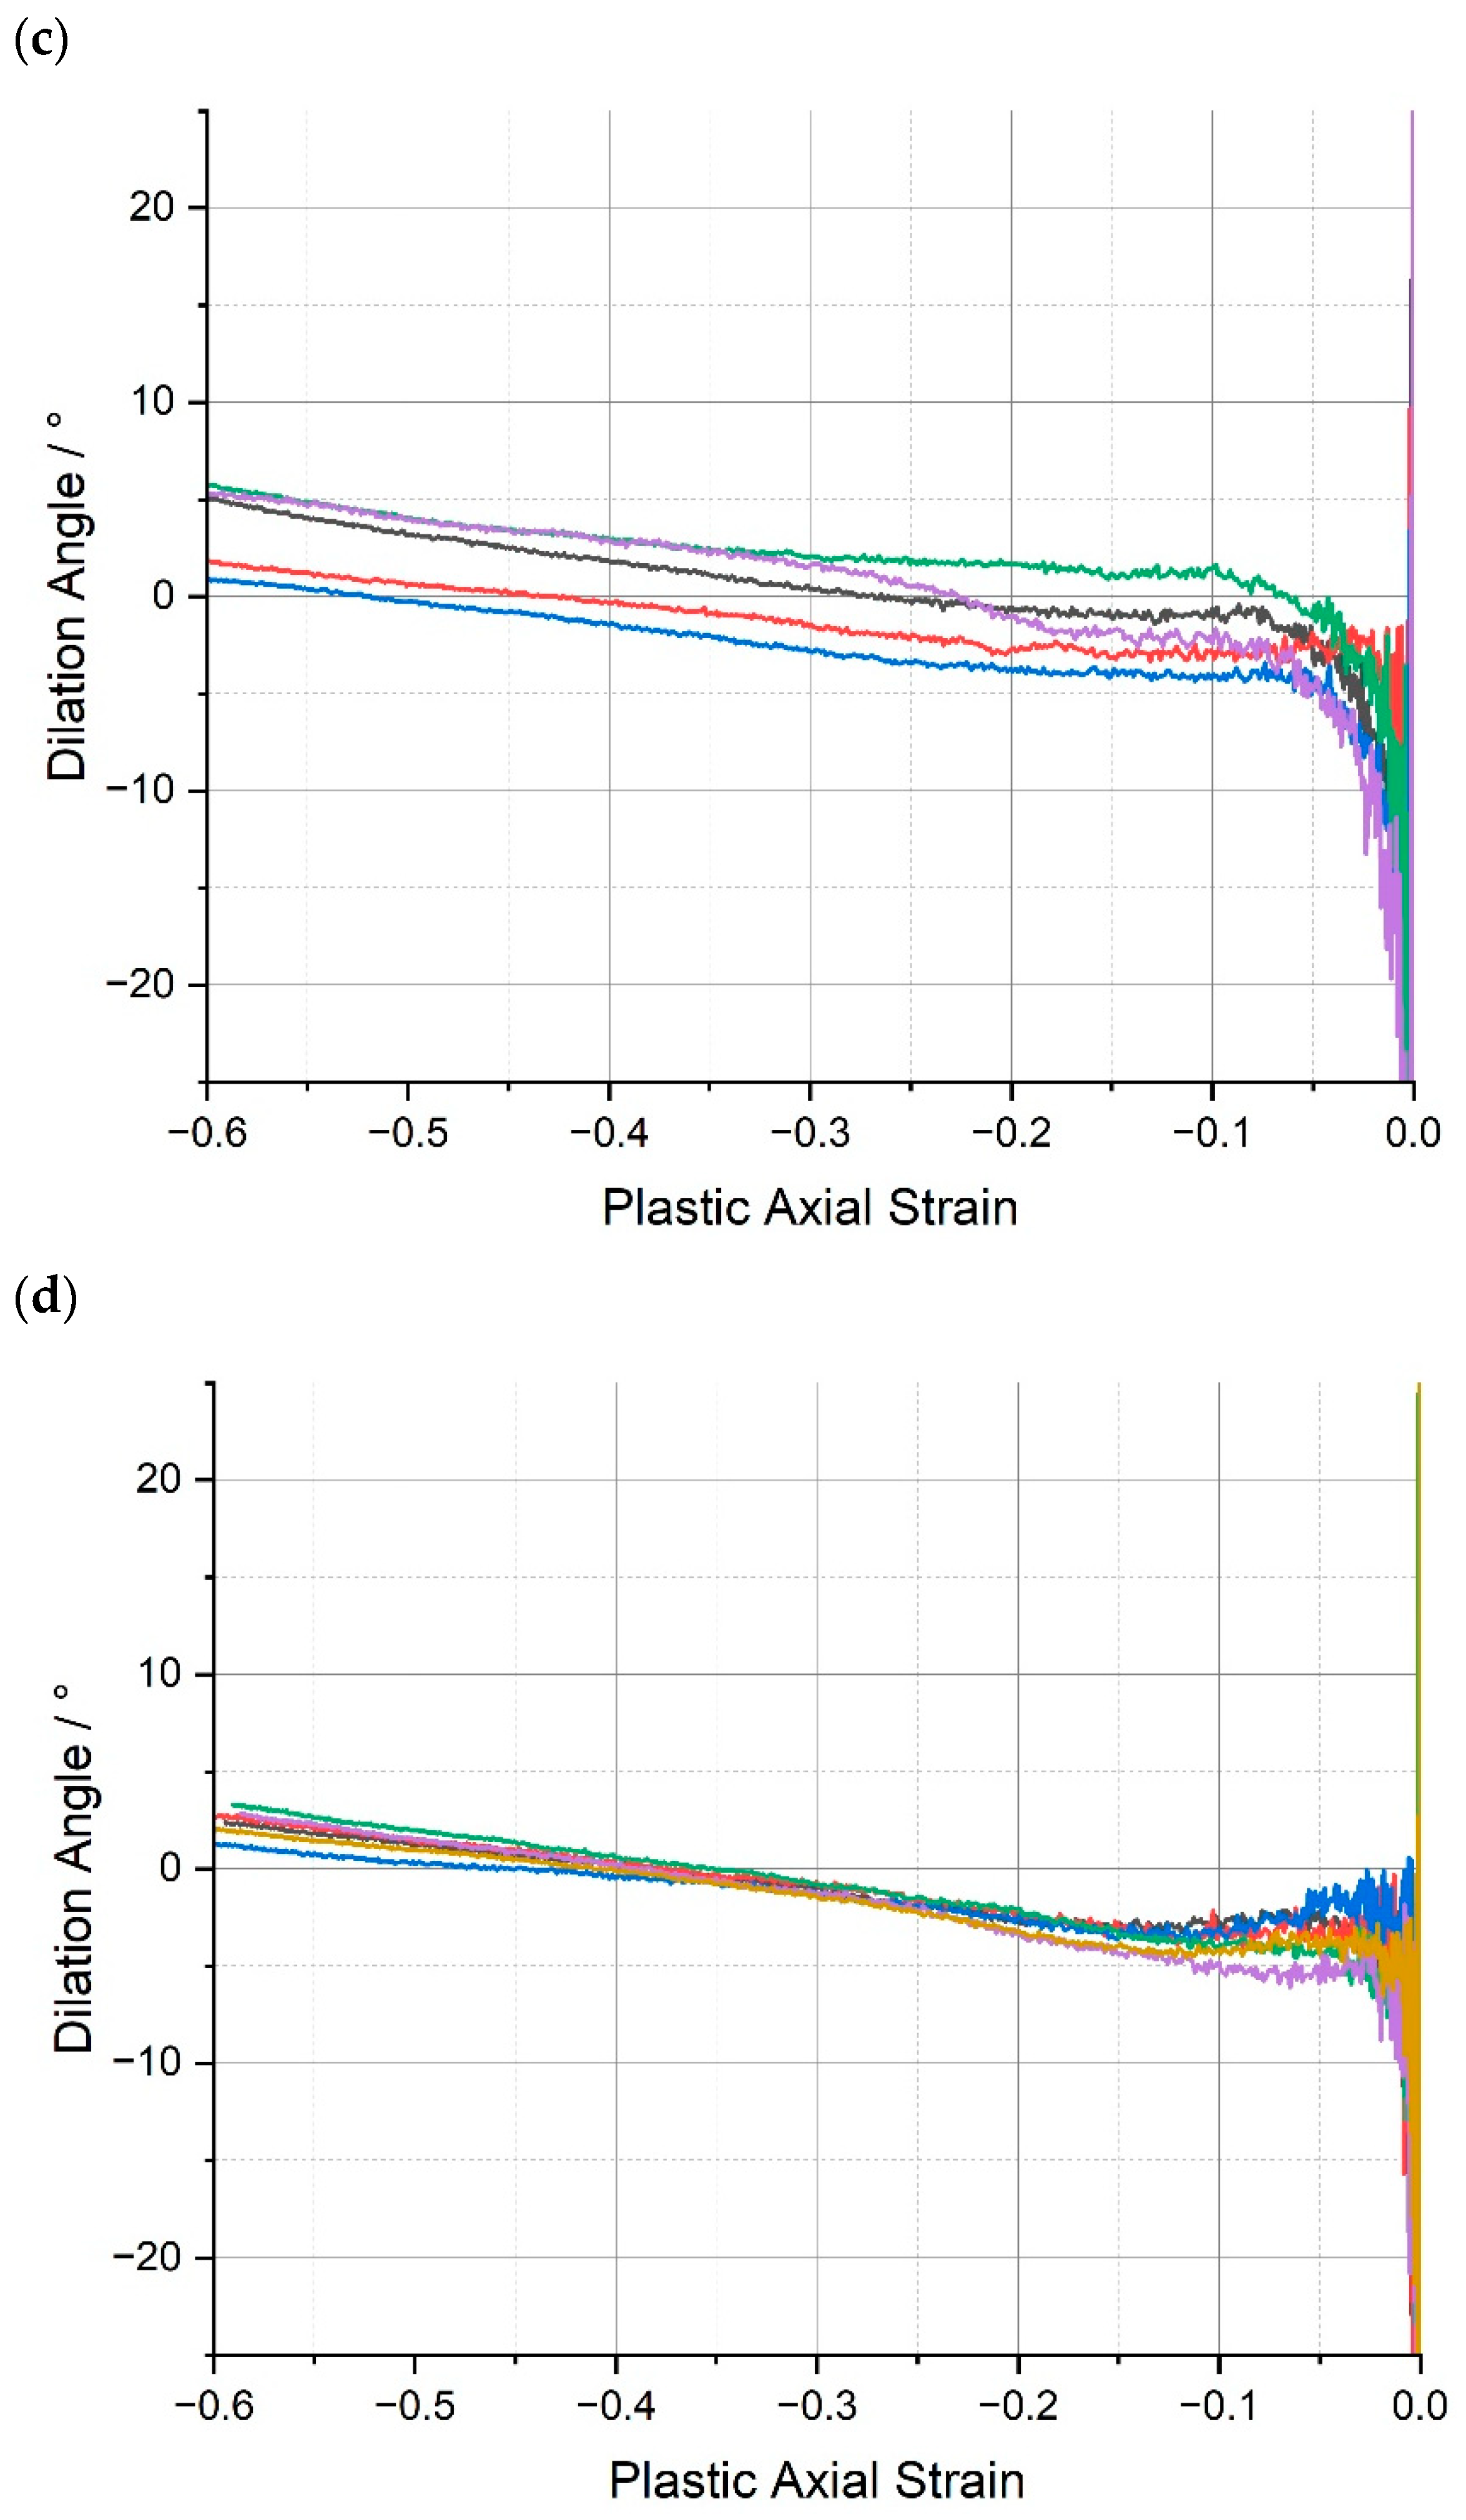
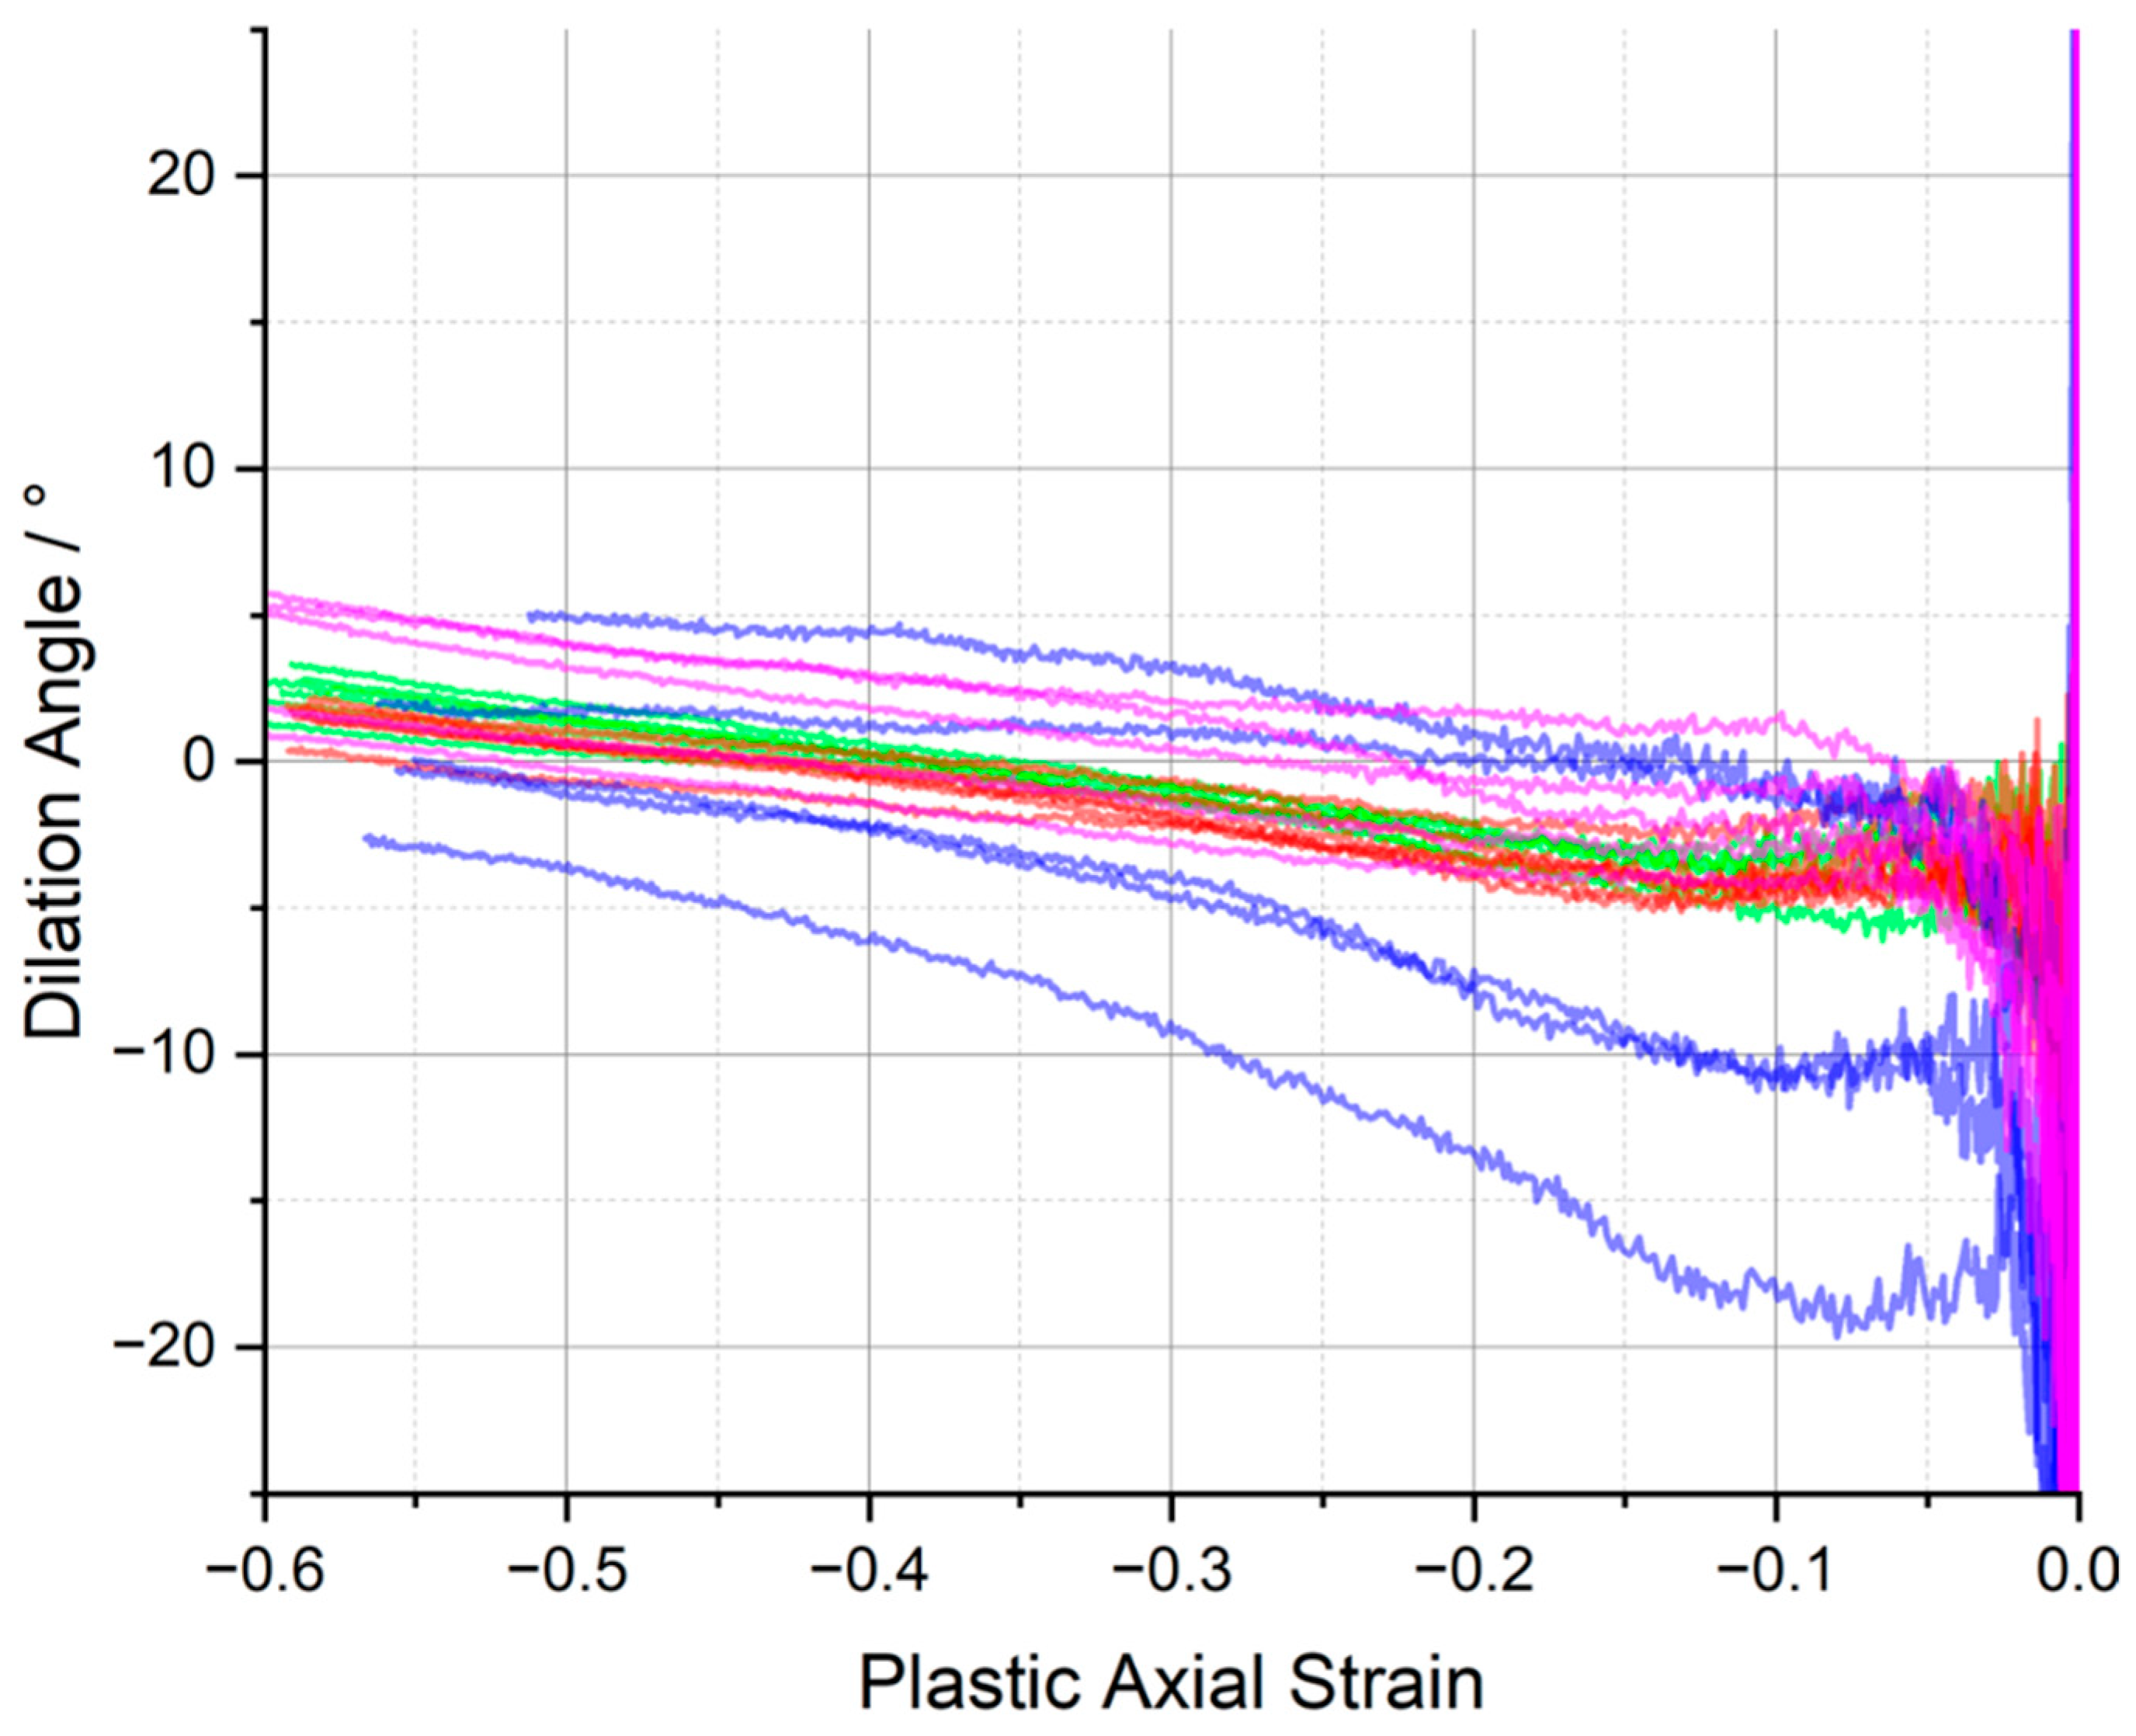
3.3. Dilation Angle
4. Conclusions
Supplementary Materials
Author Contributions
Funding
Institutional Review Board Statement
Informed Consent Statement
Data Availability Statement
Acknowledgments
Conflicts of Interest
References
- Li, A.-J.; Zhang, J.-J.; Zhang, F.-Z.; Li, L.; Zhu, S.-P.; Yang, Y.-H. Effects of fiber and matrix properties on the compression strength of carbon fiber reinforced polymer composites. New Carbon Mater. 2020, 35, 752–761. [Google Scholar] [CrossRef]
- Chen, W.; Liu, Y.; Jiang, Z.; Tang, L.; Liu, Z.; Zhou, L. Modeling of compressive strength for unidirectional fiber reinforced composites with nanoparticle modified epoxy matrix. Materials 2019, 12, 3897. [Google Scholar] [CrossRef] [PubMed]
- Huang, Y.; Hunston, D.L.; Kinloch, A.J.; Riew, C.K. Mechanisms of Toughening Thermoset Resins. In Toughened Plastics I: Science and Engineering; Advances in Chemistry; American Chemical Society: Washington, DC, USA, 1993; Chapter 1; pp. 1–35. [Google Scholar] [CrossRef]
- Van Velthem, P.; Gabriel, S.; Pardoen, T.; Bailly, C.; Ballout, W. Synergy between phenoxy and CSR tougheners on the fracture toughness of highly crosslinked epoxy-based composites. Polymers 2021, 13, 2477. [Google Scholar] [CrossRef] [PubMed]
- Le, Q.-H.; Kuan, H.-C.; Dai, J.-B.; Zaman, I.; Luong, L.; Ma, J. Structure-property relations of 55 nm particle-toughened epoxy. Polymer 2010, 51, 4867–4879. [Google Scholar] [CrossRef]
- Wang, F.; Drzal, L.T.; Qin, Y.; Huang, Z. Enhancement of fracture toughness, mechanical and thermal properties of rubber/epoxy composites by incorporation of graphene nanoplatelets. Compos. A Appl. Sci. Manuf. 2016, 87, 10–22. [Google Scholar] [CrossRef]
- Domun, N.; Hadavinia, H.; Zhang, T.; Sainsbury, T.; Liaghat, G.H.; Vahid, S. Improving the fracture toughness and the strength of epoxy using nanomaterials—A review of the current status. Nanoscale 2015, 7, 10294–10329. [Google Scholar] [CrossRef]
- Bajpai, A.; Alapati, A.K.; Klingler, A.; Wetzel, B. Tensile properties, fracture mechanics properties and toughening mechanisms of epoxy systems modified with soft block copolymers, rigid TiO2 nanoparticles and their hybrids. J. Compos. Sci. 2018, 2, 72. [Google Scholar] [CrossRef]
- Jumahat, A.; Soutis, C.; Jones, R.F.; Hodzic, A. Effect of silica nanoparticles on compressive properties of an epoxy polymer. J. Mater. Sci. 2010, 45, 5973–5983. [Google Scholar] [CrossRef]
- Morelle, X.P.; Chevalier, J.; Bailly, C.; Pardoen, T.; Lani, F. Mechanical characterization and modeling of the deformation and failure of the highly crosslinked RTM6 epoxy resin. Mech. Time-Depend. Mater. 2017, 21, 419–454. [Google Scholar] [CrossRef]
- Zotti, A.; Elmahdy, A.; Zuppolini, S.; Borriello, A.; Verleysen, P.; Zarrelli, M. Aromatic hyperbranched Polyester/RTM6 epoxy resin for extreme dynamic loading aeronautical applications. Nanomaterials 2020, 10, 188. [Google Scholar] [CrossRef]
- Hsieh, T.H.; Kinloch, A.J.; Masania, K.; Taylor, A.C.; Sprenger, S. The mechanisms and mechanics of the toughening of epoxy polymers modified with silica nanoparticles. Polymer 2010, 51, 6284–6294. [Google Scholar] [CrossRef]
- Elmahdy, A.; Zotti, A.; Zuppolini, S.; Zarrelli, M.; Borriello, A.; Verleysen, P. Effect of strain rate and silica filler content on the compressive behavior of RTM6 epoxy-based nanocomposites. Polymers 2021, 13, 3735. [Google Scholar] [CrossRef] [PubMed]
- Quino, G.; Pellegrino, A.; Tagarielli, V.L.; Petrinic, N. Measurements of the effects of pure and salt water absorption on the rate-dependent response of an epoxy matrix. Compos. B Eng. 2018, 146, 213–221. [Google Scholar] [CrossRef]
- Peng, Q.; Deng, B.; Utz, M. Reduced plastic dilatancy in polymer glasses. Macromol. Theory Simul. 2020, 30, 2000063. [Google Scholar] [CrossRef]
- Schanz, T.; Vermeer, P.A. Angles of friction and dilatancy of sand. Geotechnique 1996, 46, 145–151. [Google Scholar] [CrossRef]
- Alejano, L.R.; Alonso, E. Considerations of the dilatancy angle in rocks and rock masses. Int. J. Rock Mech. Min. Sci. 2005, 42, 481–507. [Google Scholar] [CrossRef]
- Richeton, J.; Ahzi, S.; Vecchio, K.S.; Jiang, F.C.; Adharapurapu, R.R. Influence of temperature and strain rate on the mechanical behavior of three amorphous polymers: Characterization and modeling of the compressive yield stress. Int. J. Solids Struct. 2006, 43, 2318–2335. [Google Scholar] [CrossRef]
- Banerjee, J.K. Barreling of solid cylinders under axial compression. J. Eng. Mater. Technol. 1985, 107, 138–144. [Google Scholar] [CrossRef]
- Jerabek, M.; Major, Z.; Lang, R.W. Uniaxial compression testing of polymeric materials. Polym. Test. 2010, 29, 302–309. [Google Scholar] [CrossRef]
- ASTM Standard D695-15; Standard Test Method for Compressive Properties of Rigid Plastics. ASTM International: West Conshohocken, PA, USA, 2015. [CrossRef]
- ASTM Standard D618-21; Standard Practice for Conditioning Plastics for Testing. ASTM International: West Conshohocken, PA, USA, 2021. [CrossRef]
- ASTM Standard D5045; Standard Test Methods for Plane-Strain Fracture Toughness and Strain Energy Release Rate of Plastic Materials. ASTM International: West Conshohocken, PA, USA, 2022.
- Technical Data Sheets, Solvay. Available online: https://www.solvay.com/en/product/ (accessed on 26 August 2023).
- Quino, G.; El Yagoubi, J.; Lubineau, G. Characterizing the toughness of an epoxy resin after wet aging using compact tension specimens with non-uniform moisture content. Polym. Degrad. Stab. 2014, 109, 319–326. [Google Scholar] [CrossRef]
- Unnikrishnan, K.P.; Thachil, E.T. Toughening of epoxy resins. Des. Monomers Polym. 2006, 9, 129–152. [Google Scholar] [CrossRef]
- Rosetti, Y.; Alcouffe, P.; Pascault, J.-P.; Gérard, J.-F.; Lortie, F. Polyether Sulfone-Based Epoxy Toughening: From Micro- to Nano-Phase Separation via PES End-Chain Modification and Process Engineering. Materials 1960, 11, 1960. [Google Scholar] [CrossRef]
- DHeflin, G.; Mansson, J.-A.E. Mechanisms for combining polyamide and epoxy and their effects on mechanical performance—A review. Polym. Polym. Compos. 2022, 30. [Google Scholar] [CrossRef]
- Ranade, R.A.; Ding, J.; Wunder, S.L.; Baran, G.R. UHMWPE as interface toughening agent in glass particle filled composites. Compos. Part A Appl. Sci. 2006, 37, 2017–2028. [Google Scholar]
- Pittman, E.; Koumlis, S.; Aung, H.N.; Bellafatto, A.; Lamberson, L. Rate-dependent fracture behavior of aerospace epoxies: PR-520 and 3502. J. Aerosp. Eng. 2021, 35. [Google Scholar] [CrossRef]
- Gilat, A.; Goldberg, R.K.; Roberts, G.D. Strain Rate Sensitivity of Epoxy Resin in Tensile and Shear Loading; NASA/TM—2005-213595; NASA: Hanover, MD, USA, 2005.
- Quino, G.; Gargiuli, J.; Pimenta, S.; Hamerton, I.; Robinson, P.; Trask, R.S. Experimental characterisation of the dilation angle of polymers. Polym. Test. 2023, 125, 108137. [Google Scholar]
- Sorini, C.; Chattopadhyay, A.; Goldberg, R.K. An improved plastically dilatant unified viscoplastic constitutive formulation for multiscale analysis of polymer matrix composites under high strain rate loading. Compos. B Eng. 2020, 184, 107669. [Google Scholar] [CrossRef]


| Name | Tg, °C | Tdec, °C | Mass Loss, % |
|---|---|---|---|
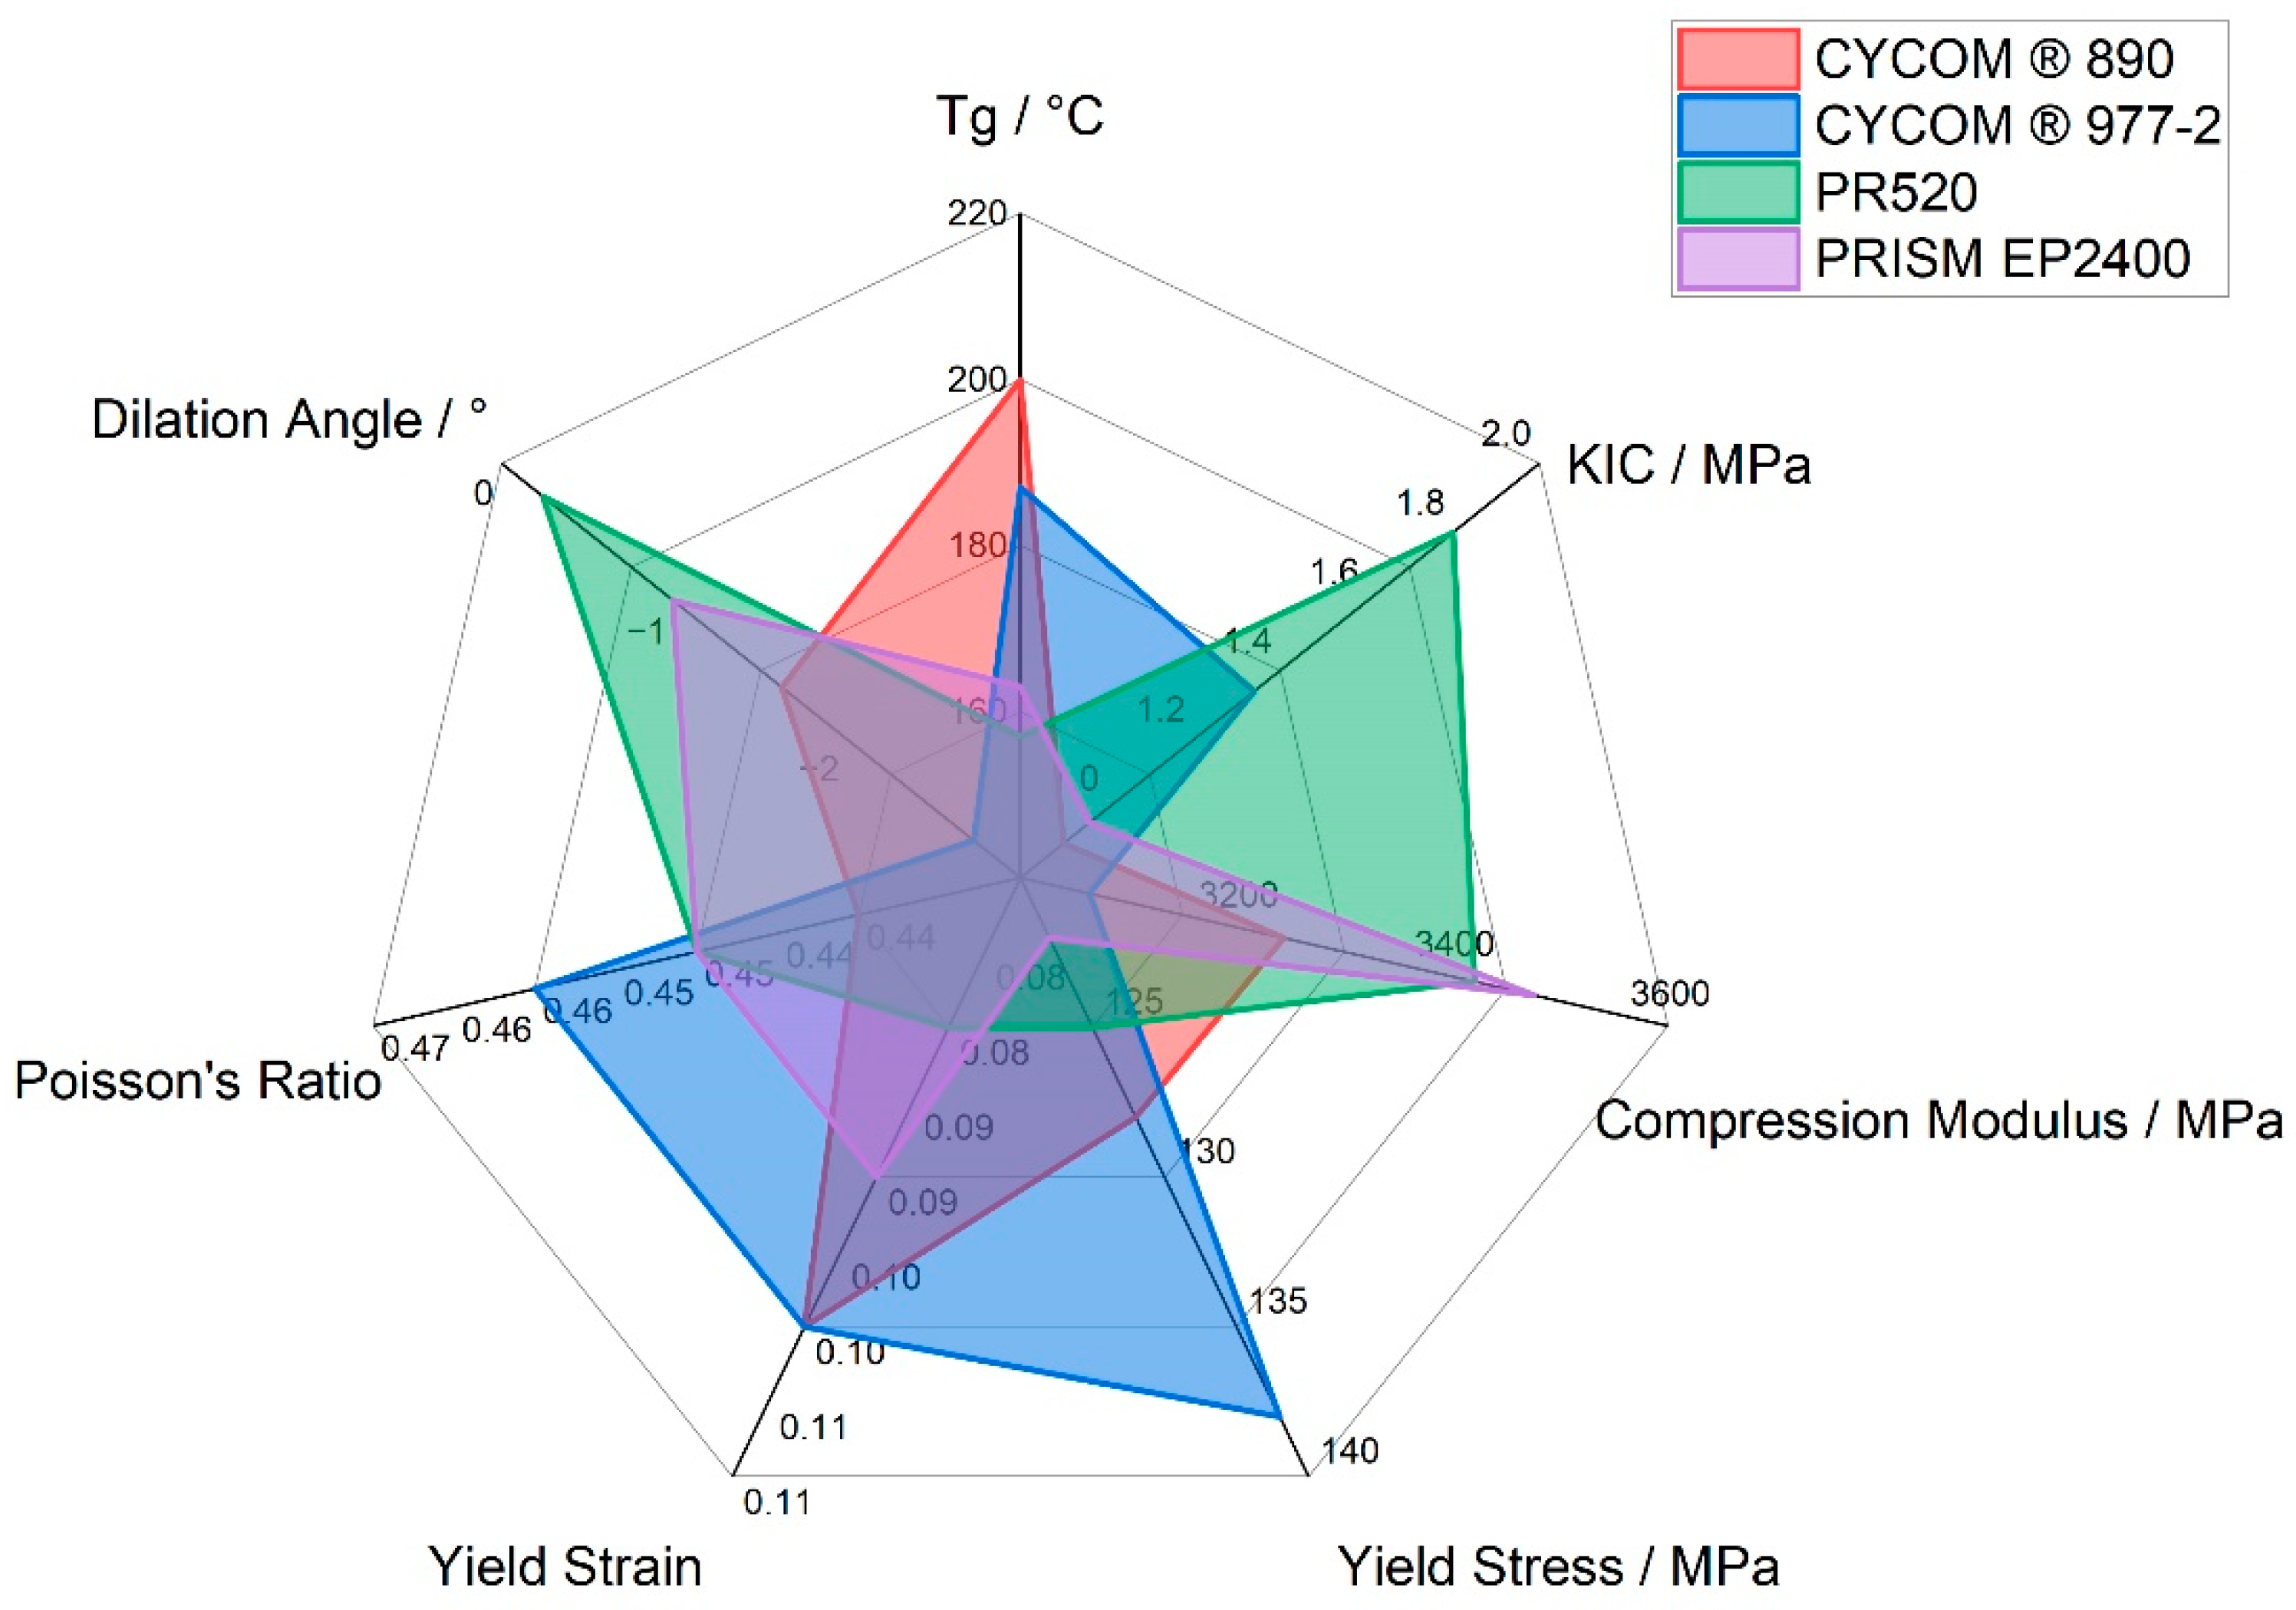
| CYCOM®890 (A) | 200 | 373 | 82 |
| CYCOM®977-2 (B) | 187 | 377 | 72 |
| PR520 (C) | 157 | 372 | 79 |
| PRISM EP2400 (D) | 163 | 377 | 85 |
| Compression Modulus | Yield Stress | Yield Strain | |
|---|---|---|---|
| Name | E, MPa | sy, MPa | ey |
| CYCOM®890 | 3244 ± 74 | 128 ± 1 | 0.102 ± 0.002 |
| CYCOM®977-2 | 3064 ± 36 | 138 ± 1 | 0.101 ± 0.006 |
| PR520 | 3421 ± 99 | 125 ± 1 | 0.076 ± 0.003 |
| PRISM EP2400 | 3476 ± 97 | 122 ± 1 | 0.092 ± 0.002 |
| Poisson’s Ratio | Dilation Angle | |
|---|---|---|
| Name | ν | , ° |
| CYCOM®890 | 0.44 ± 0.01 | −1.62 ± 0.59 |
| CYCOM®977-2 | 0.46 ± 0.01 | −2.73 ± 4.8 |
| PR520 | 0.45 ± 0.01 | −0.24 ± 2.05 |
| PRISM EP2400 | 0.45 ± 0.01 | −0.99 ± 0.26 |
Disclaimer/Publisher’s Note: The statements, opinions and data contained in all publications are solely those of the individual author(s) and contributor(s) and not of MDPI and/or the editor(s). MDPI and/or the editor(s) disclaim responsibility for any injury to people or property resulting from any ideas, methods, instructions or products referred to in the content. |
© 2023 by the authors. Licensee MDPI, Basel, Switzerland. This article is an open access article distributed under the terms and conditions of the Creative Commons Attribution (CC BY) license (https://creativecommons.org/licenses/by/4.0/).
Share and Cite
Gargiuli, J.F.; Quino, G.; Board, R.; Griffith, J.C.; Shaffer, M.S.P.; Trask, R.S.; Hamerton, I. Examining the Quasi-Static Uniaxial Compressive Behaviour of Commercial High-Performance Epoxy Matrices. Polymers 2023, 15, 4022. https://doi.org/10.3390/polym15194022
Gargiuli JF, Quino G, Board R, Griffith JC, Shaffer MSP, Trask RS, Hamerton I. Examining the Quasi-Static Uniaxial Compressive Behaviour of Commercial High-Performance Epoxy Matrices. Polymers. 2023; 15(19):4022. https://doi.org/10.3390/polym15194022
Chicago/Turabian StyleGargiuli, J. F., G. Quino, R. Board, J. C. Griffith, M. S. P. Shaffer, R. S. Trask, and I. Hamerton. 2023. "Examining the Quasi-Static Uniaxial Compressive Behaviour of Commercial High-Performance Epoxy Matrices" Polymers 15, no. 19: 4022. https://doi.org/10.3390/polym15194022
APA StyleGargiuli, J. F., Quino, G., Board, R., Griffith, J. C., Shaffer, M. S. P., Trask, R. S., & Hamerton, I. (2023). Examining the Quasi-Static Uniaxial Compressive Behaviour of Commercial High-Performance Epoxy Matrices. Polymers, 15(19), 4022. https://doi.org/10.3390/polym15194022