
Foaming Properties of Lignosulfonates in the Flotation Process


Abstract
:1. Introduction
2. Materials and Methods
2.1. Samples and Reagents
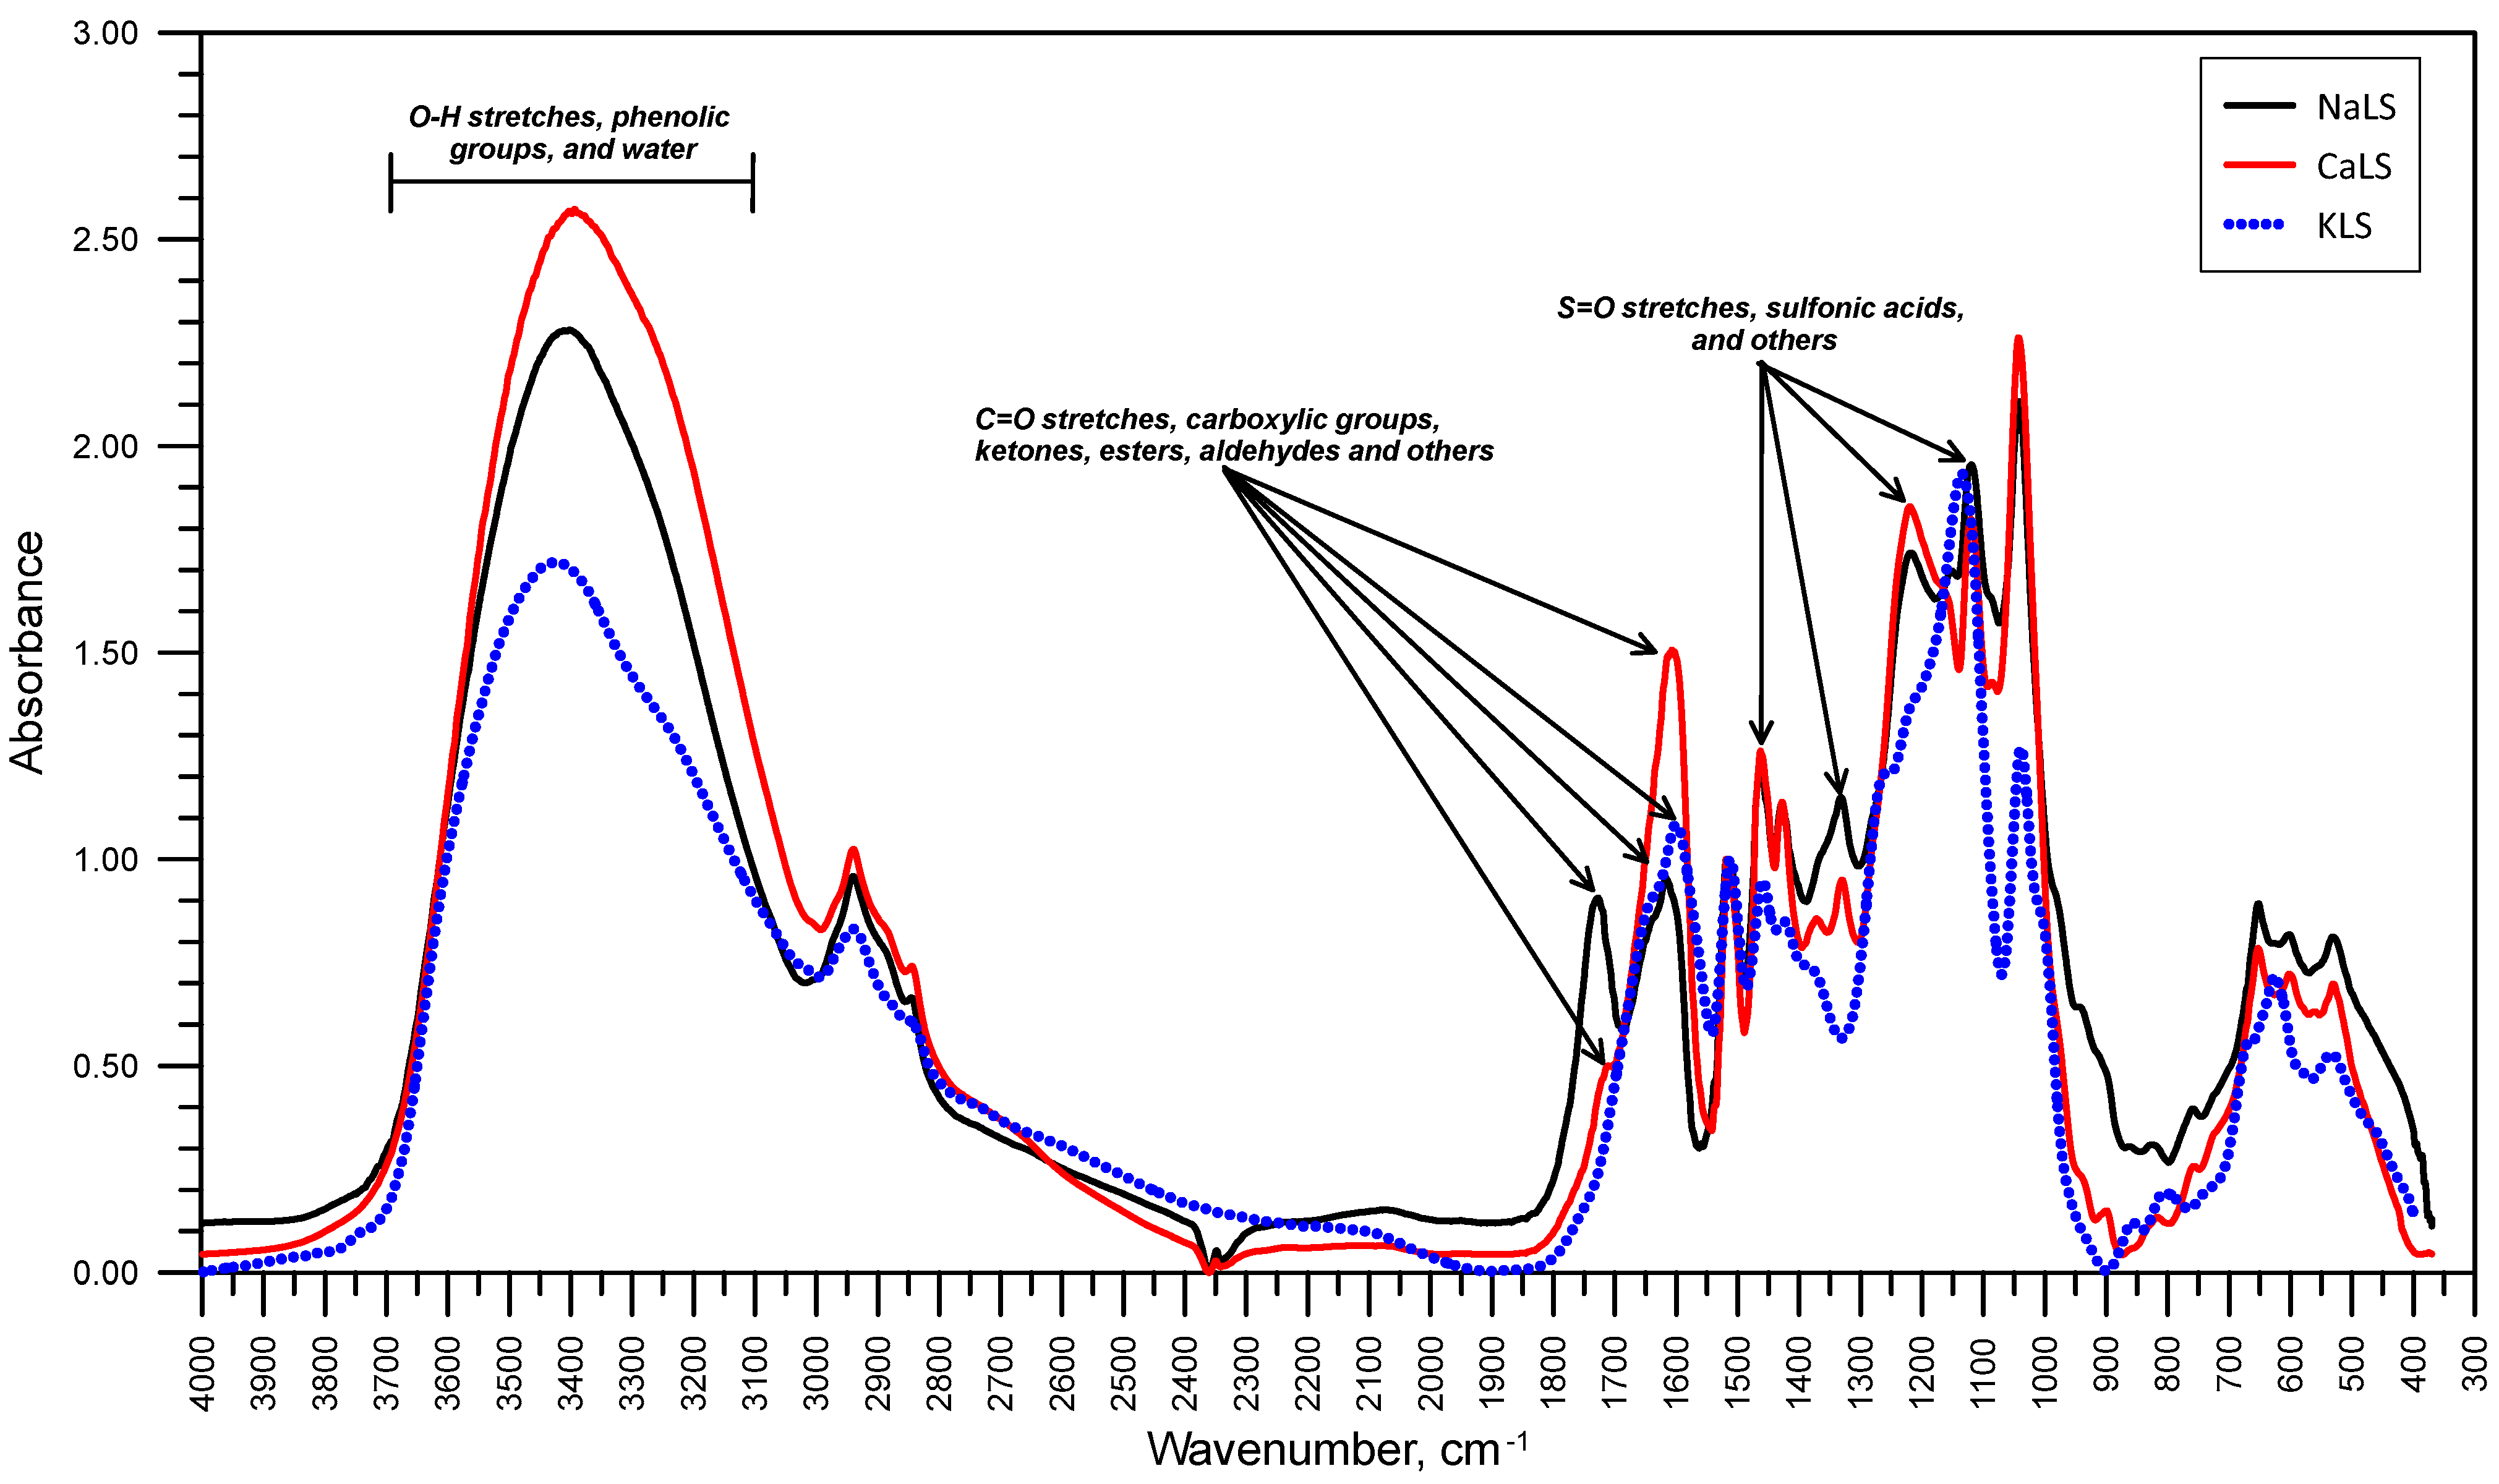
Lignosulfonates Characterization
2.2. Surface Tension Measurements
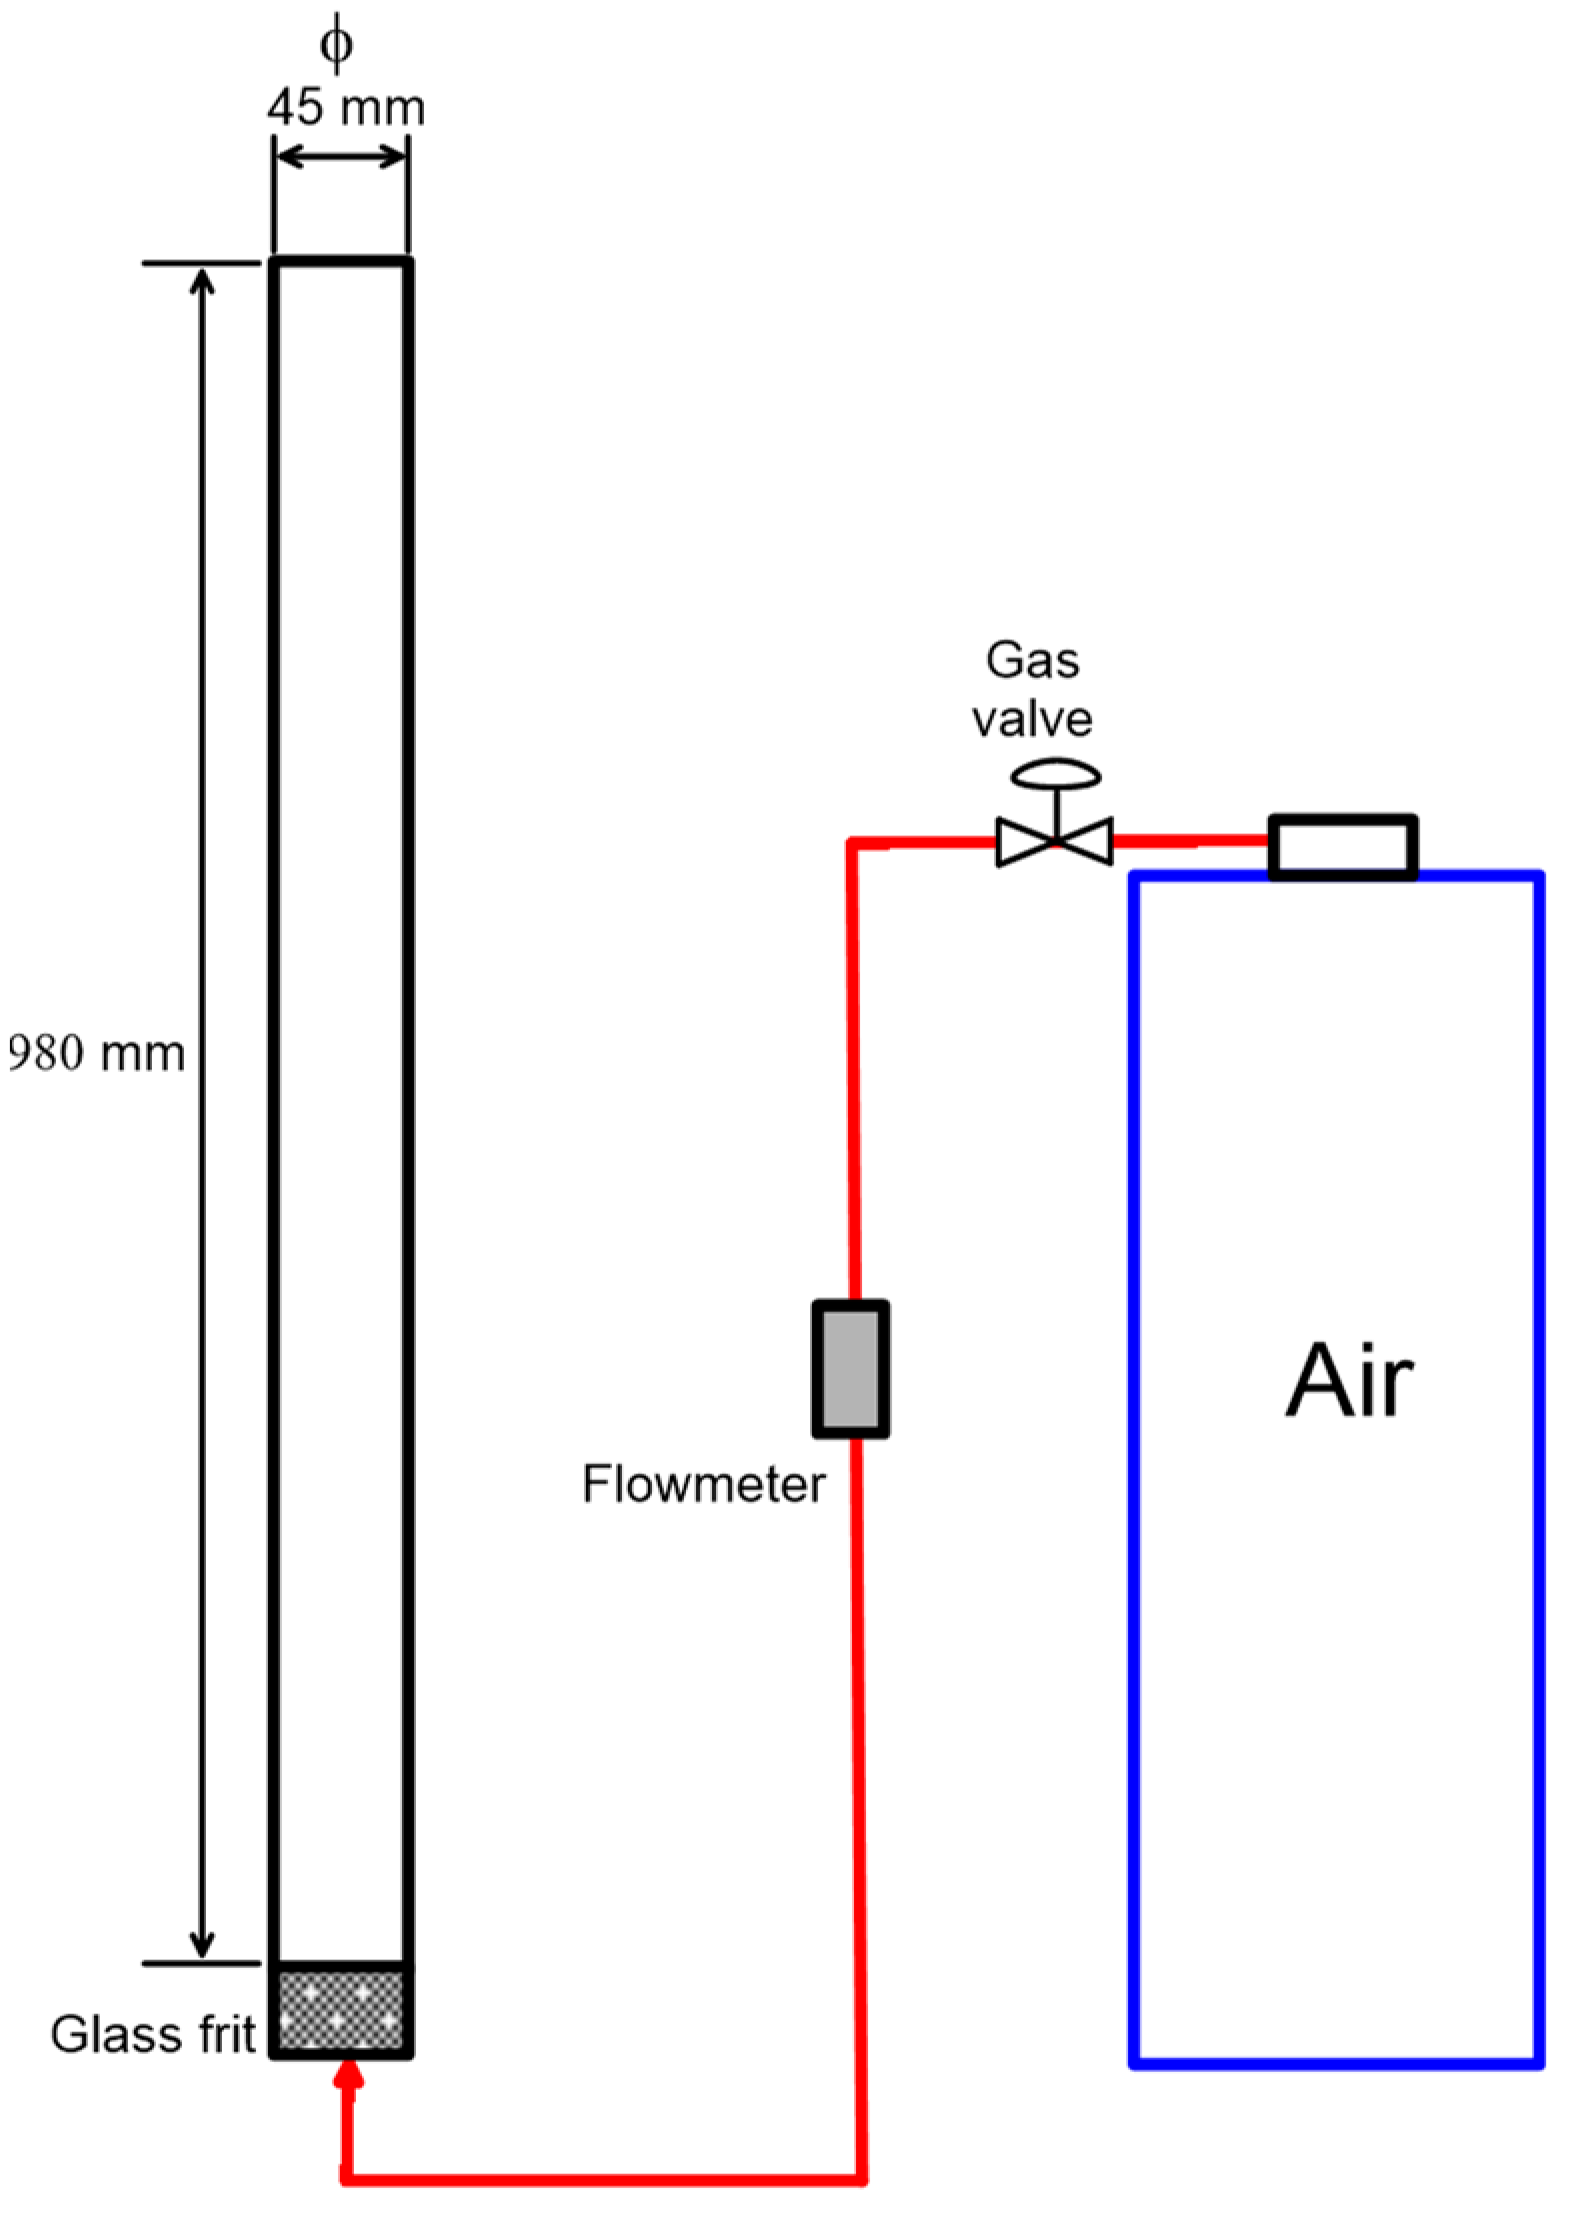
2.3. Foamability Tests
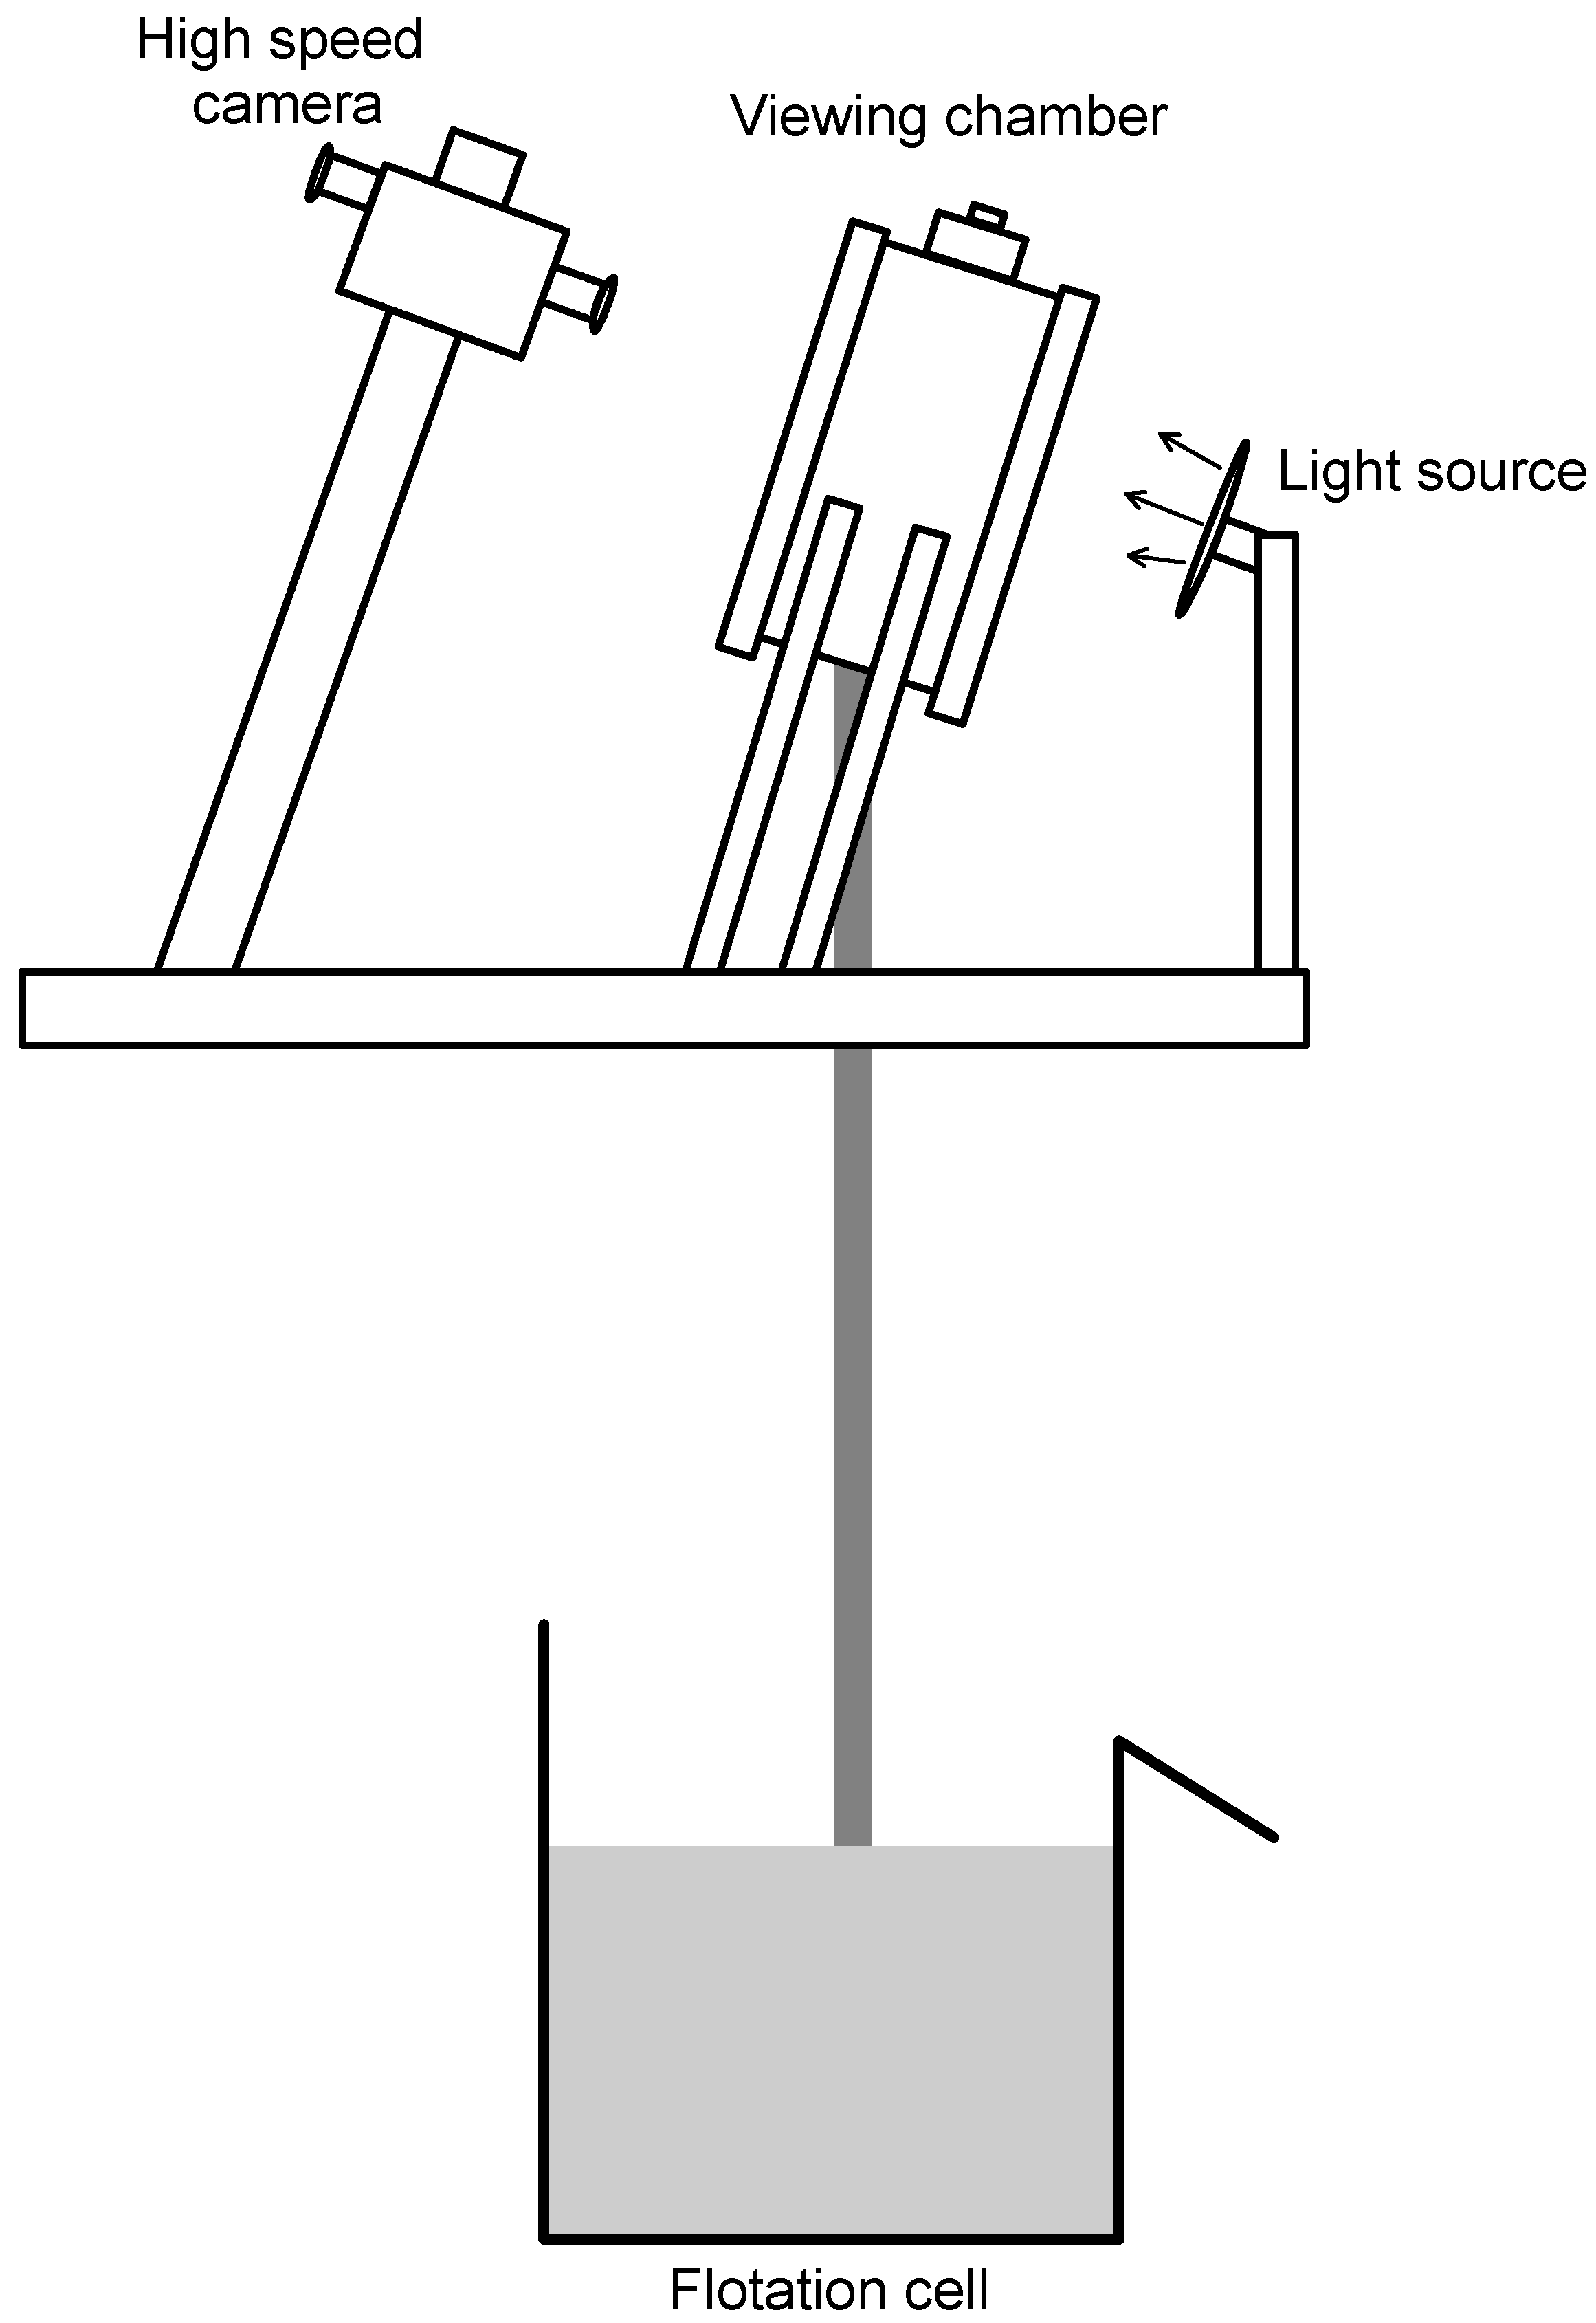
2.4. Bubble Size Distributions
2.5. Water Recovery Experiments
3. Results
3.1. LS Characterization
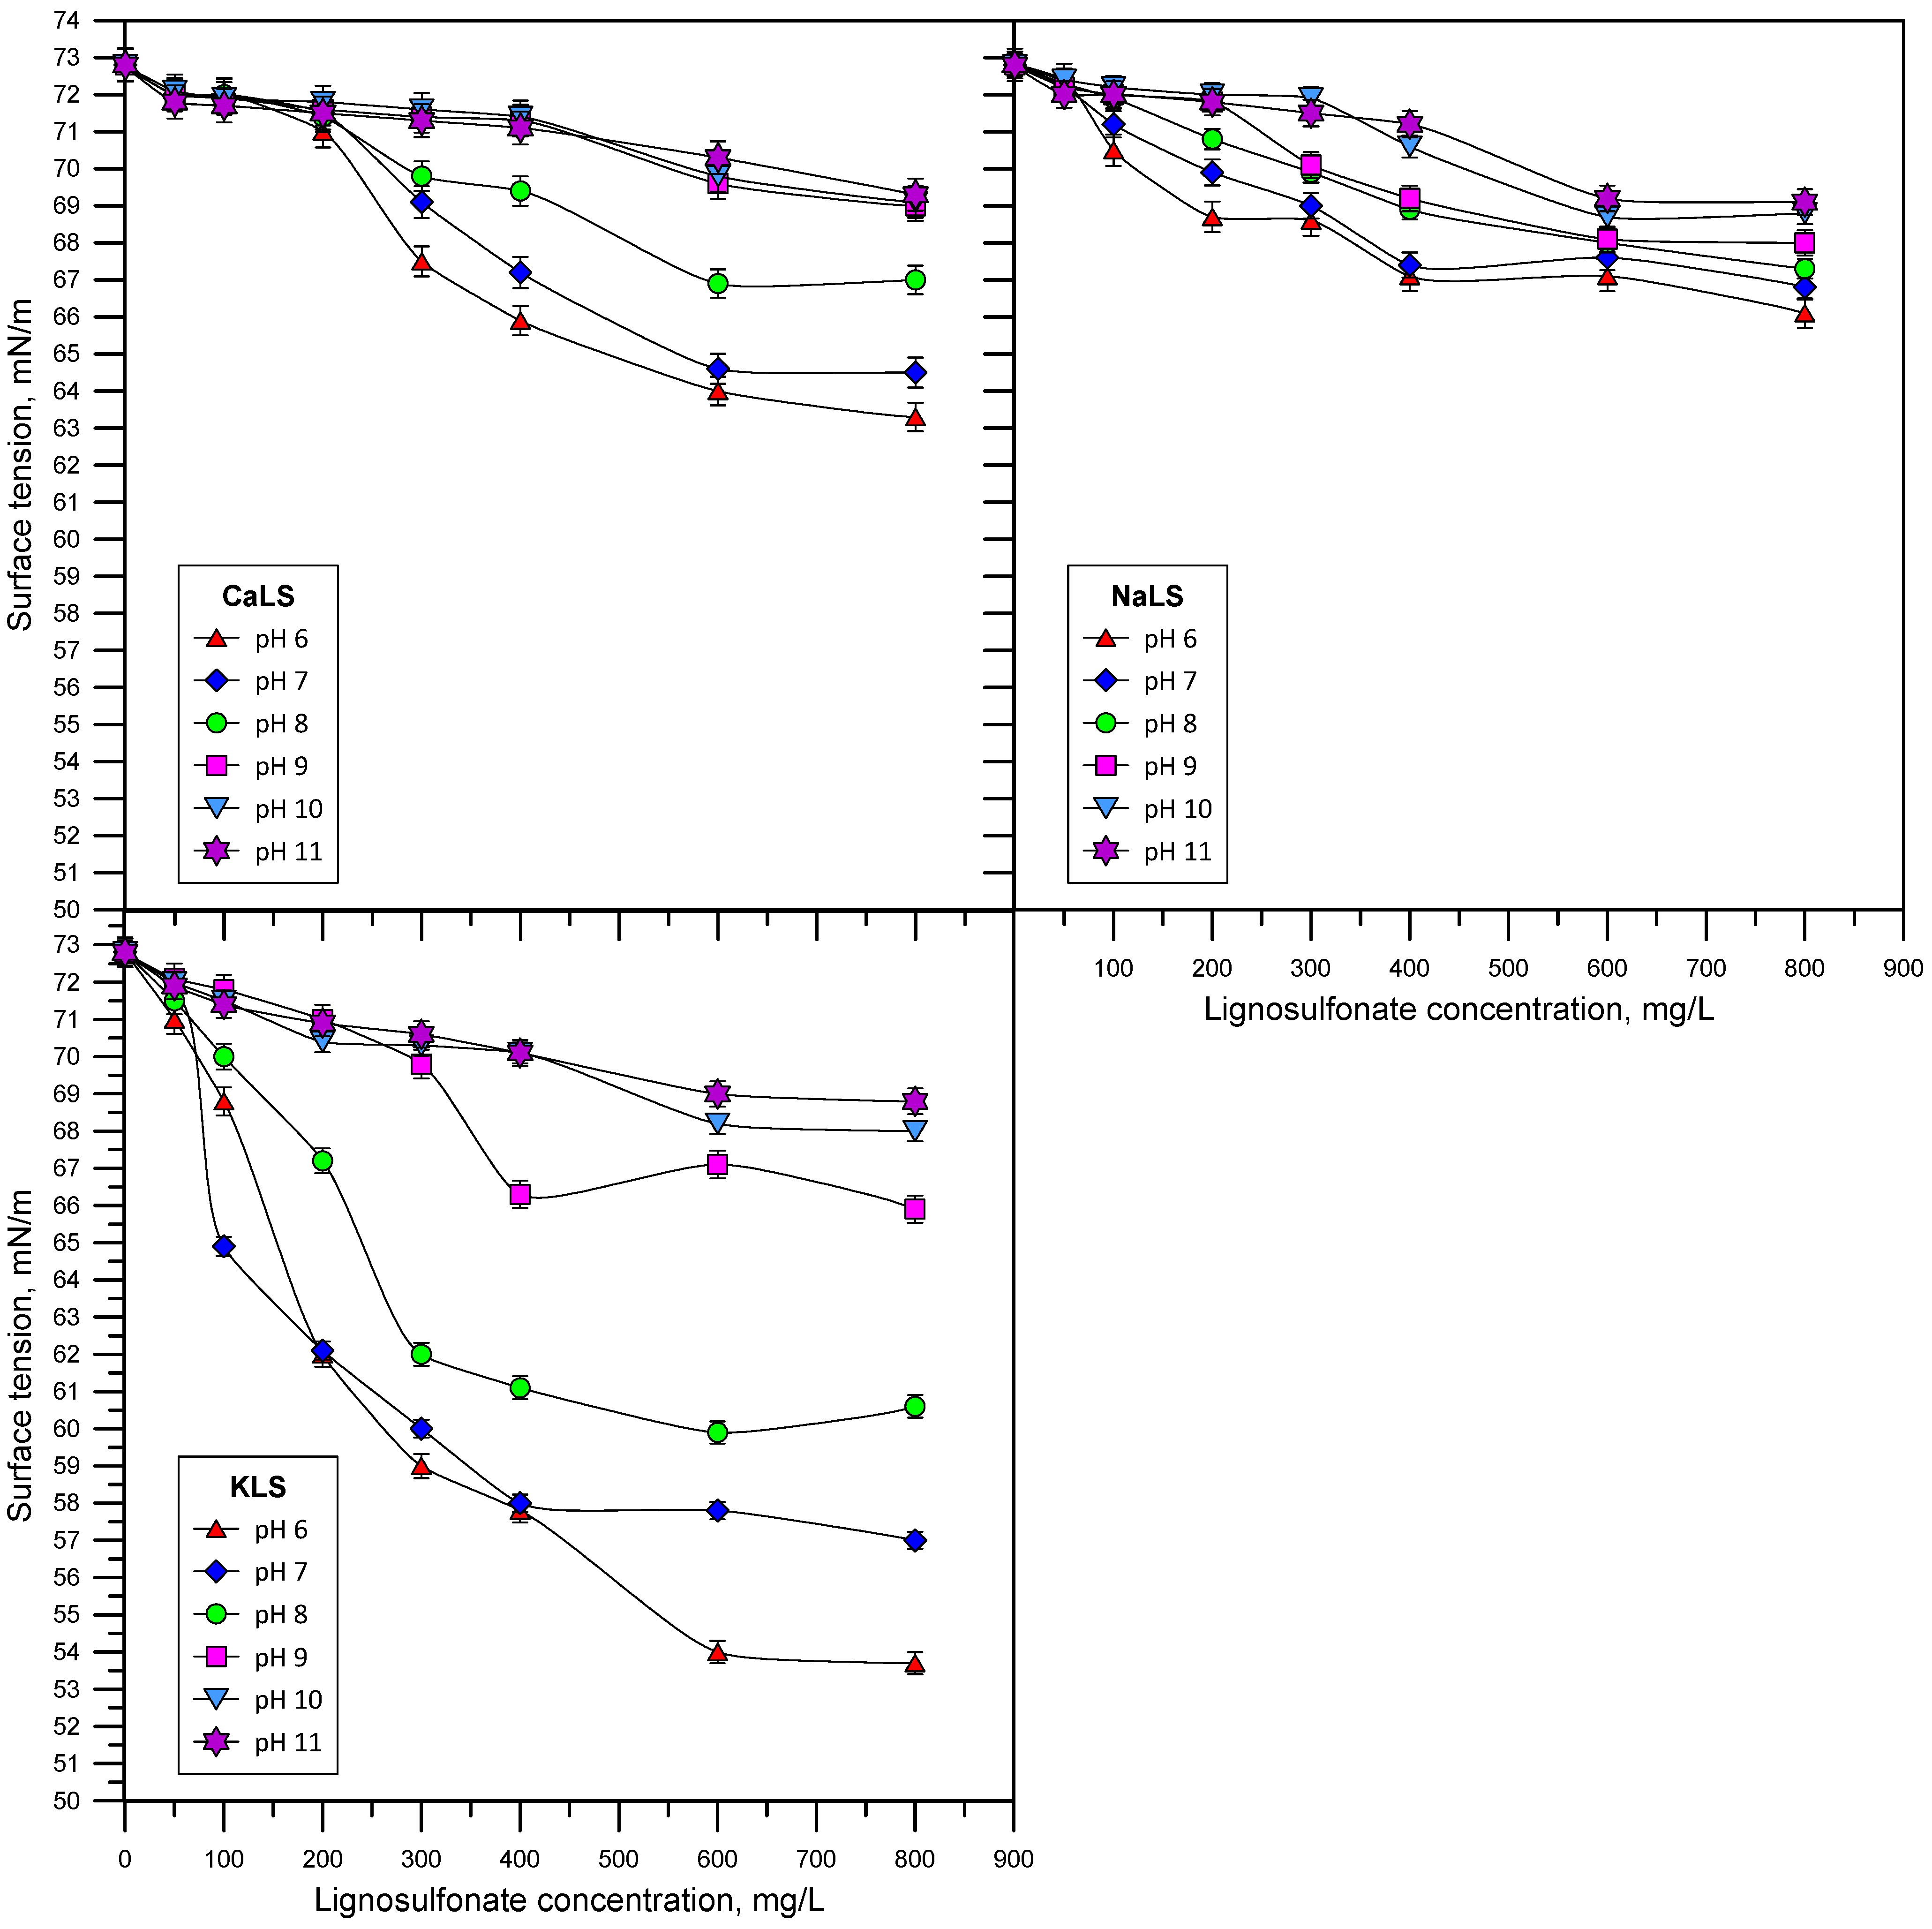
3.2. Surface Tension
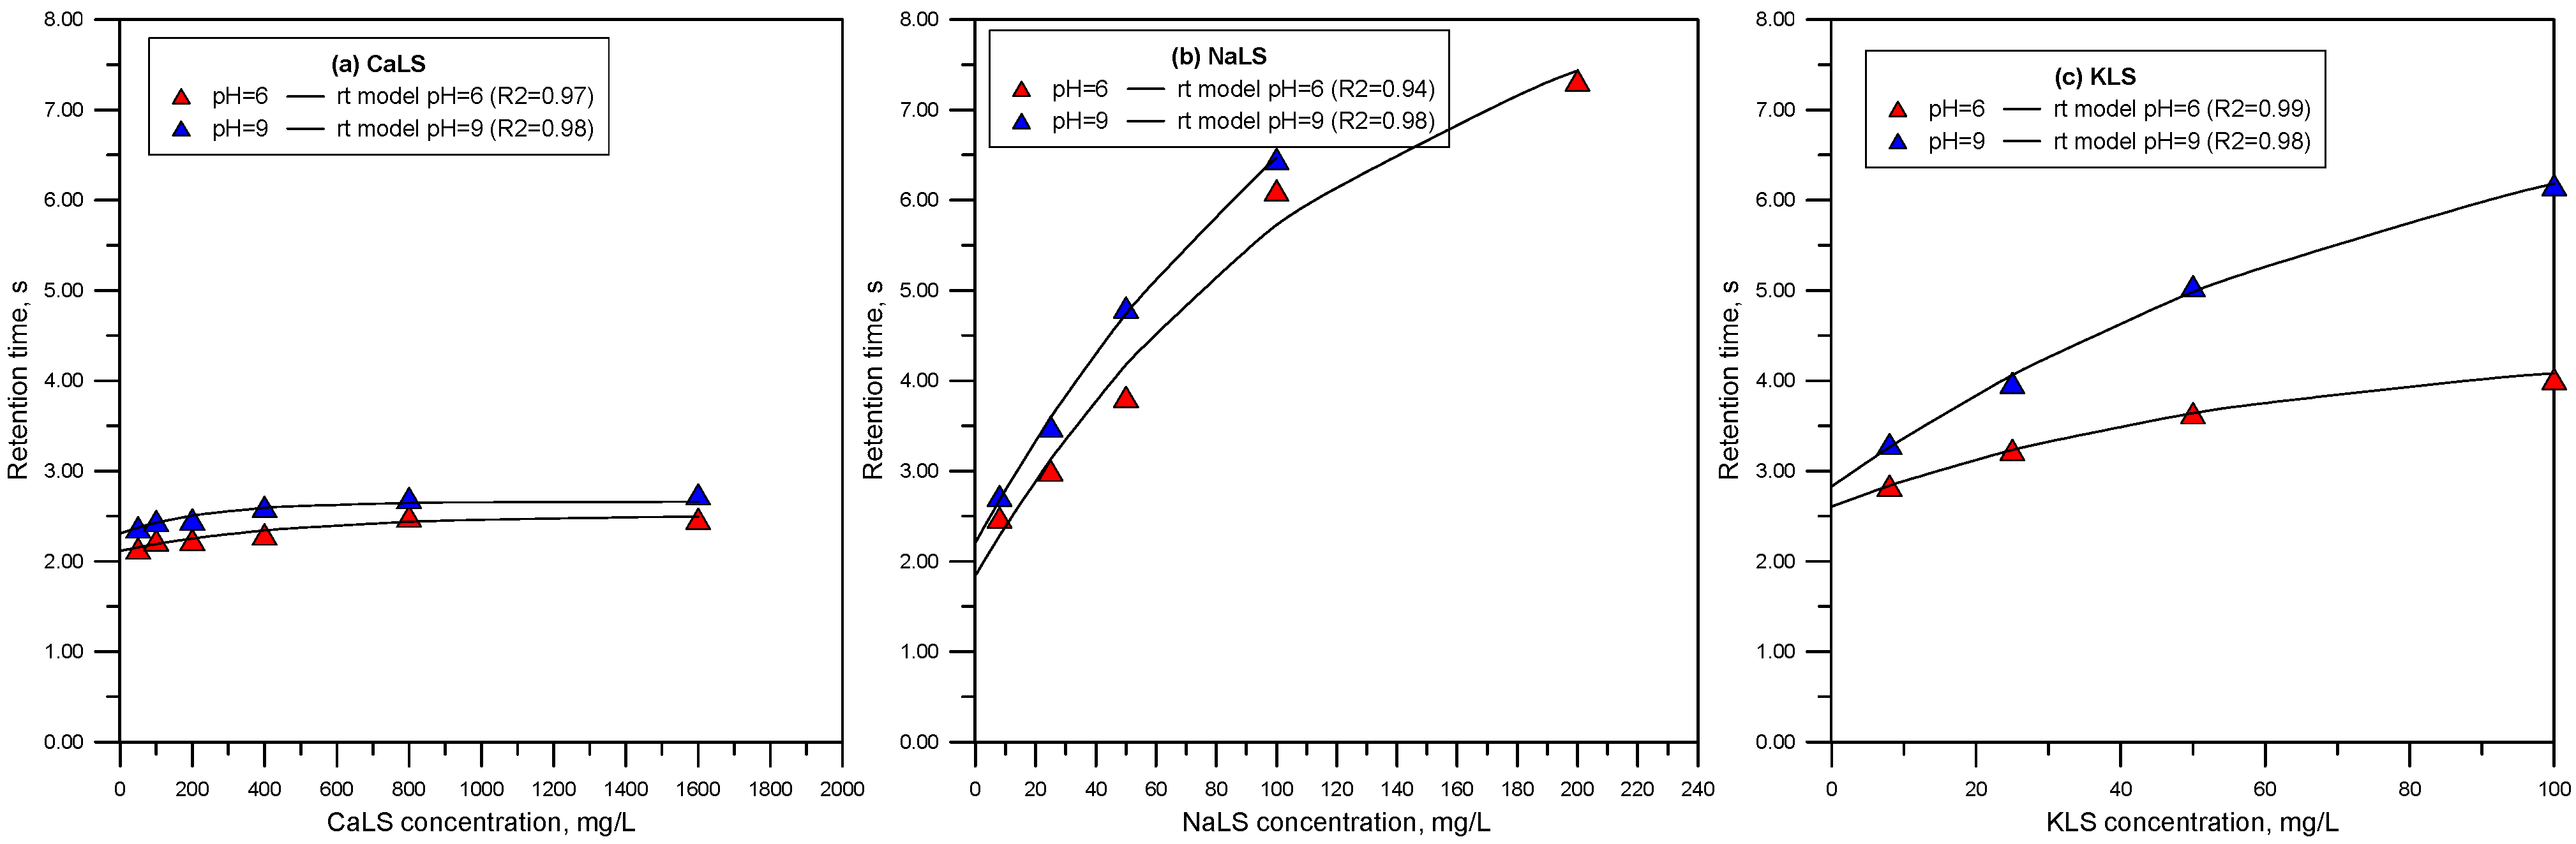
3.3. Foamability
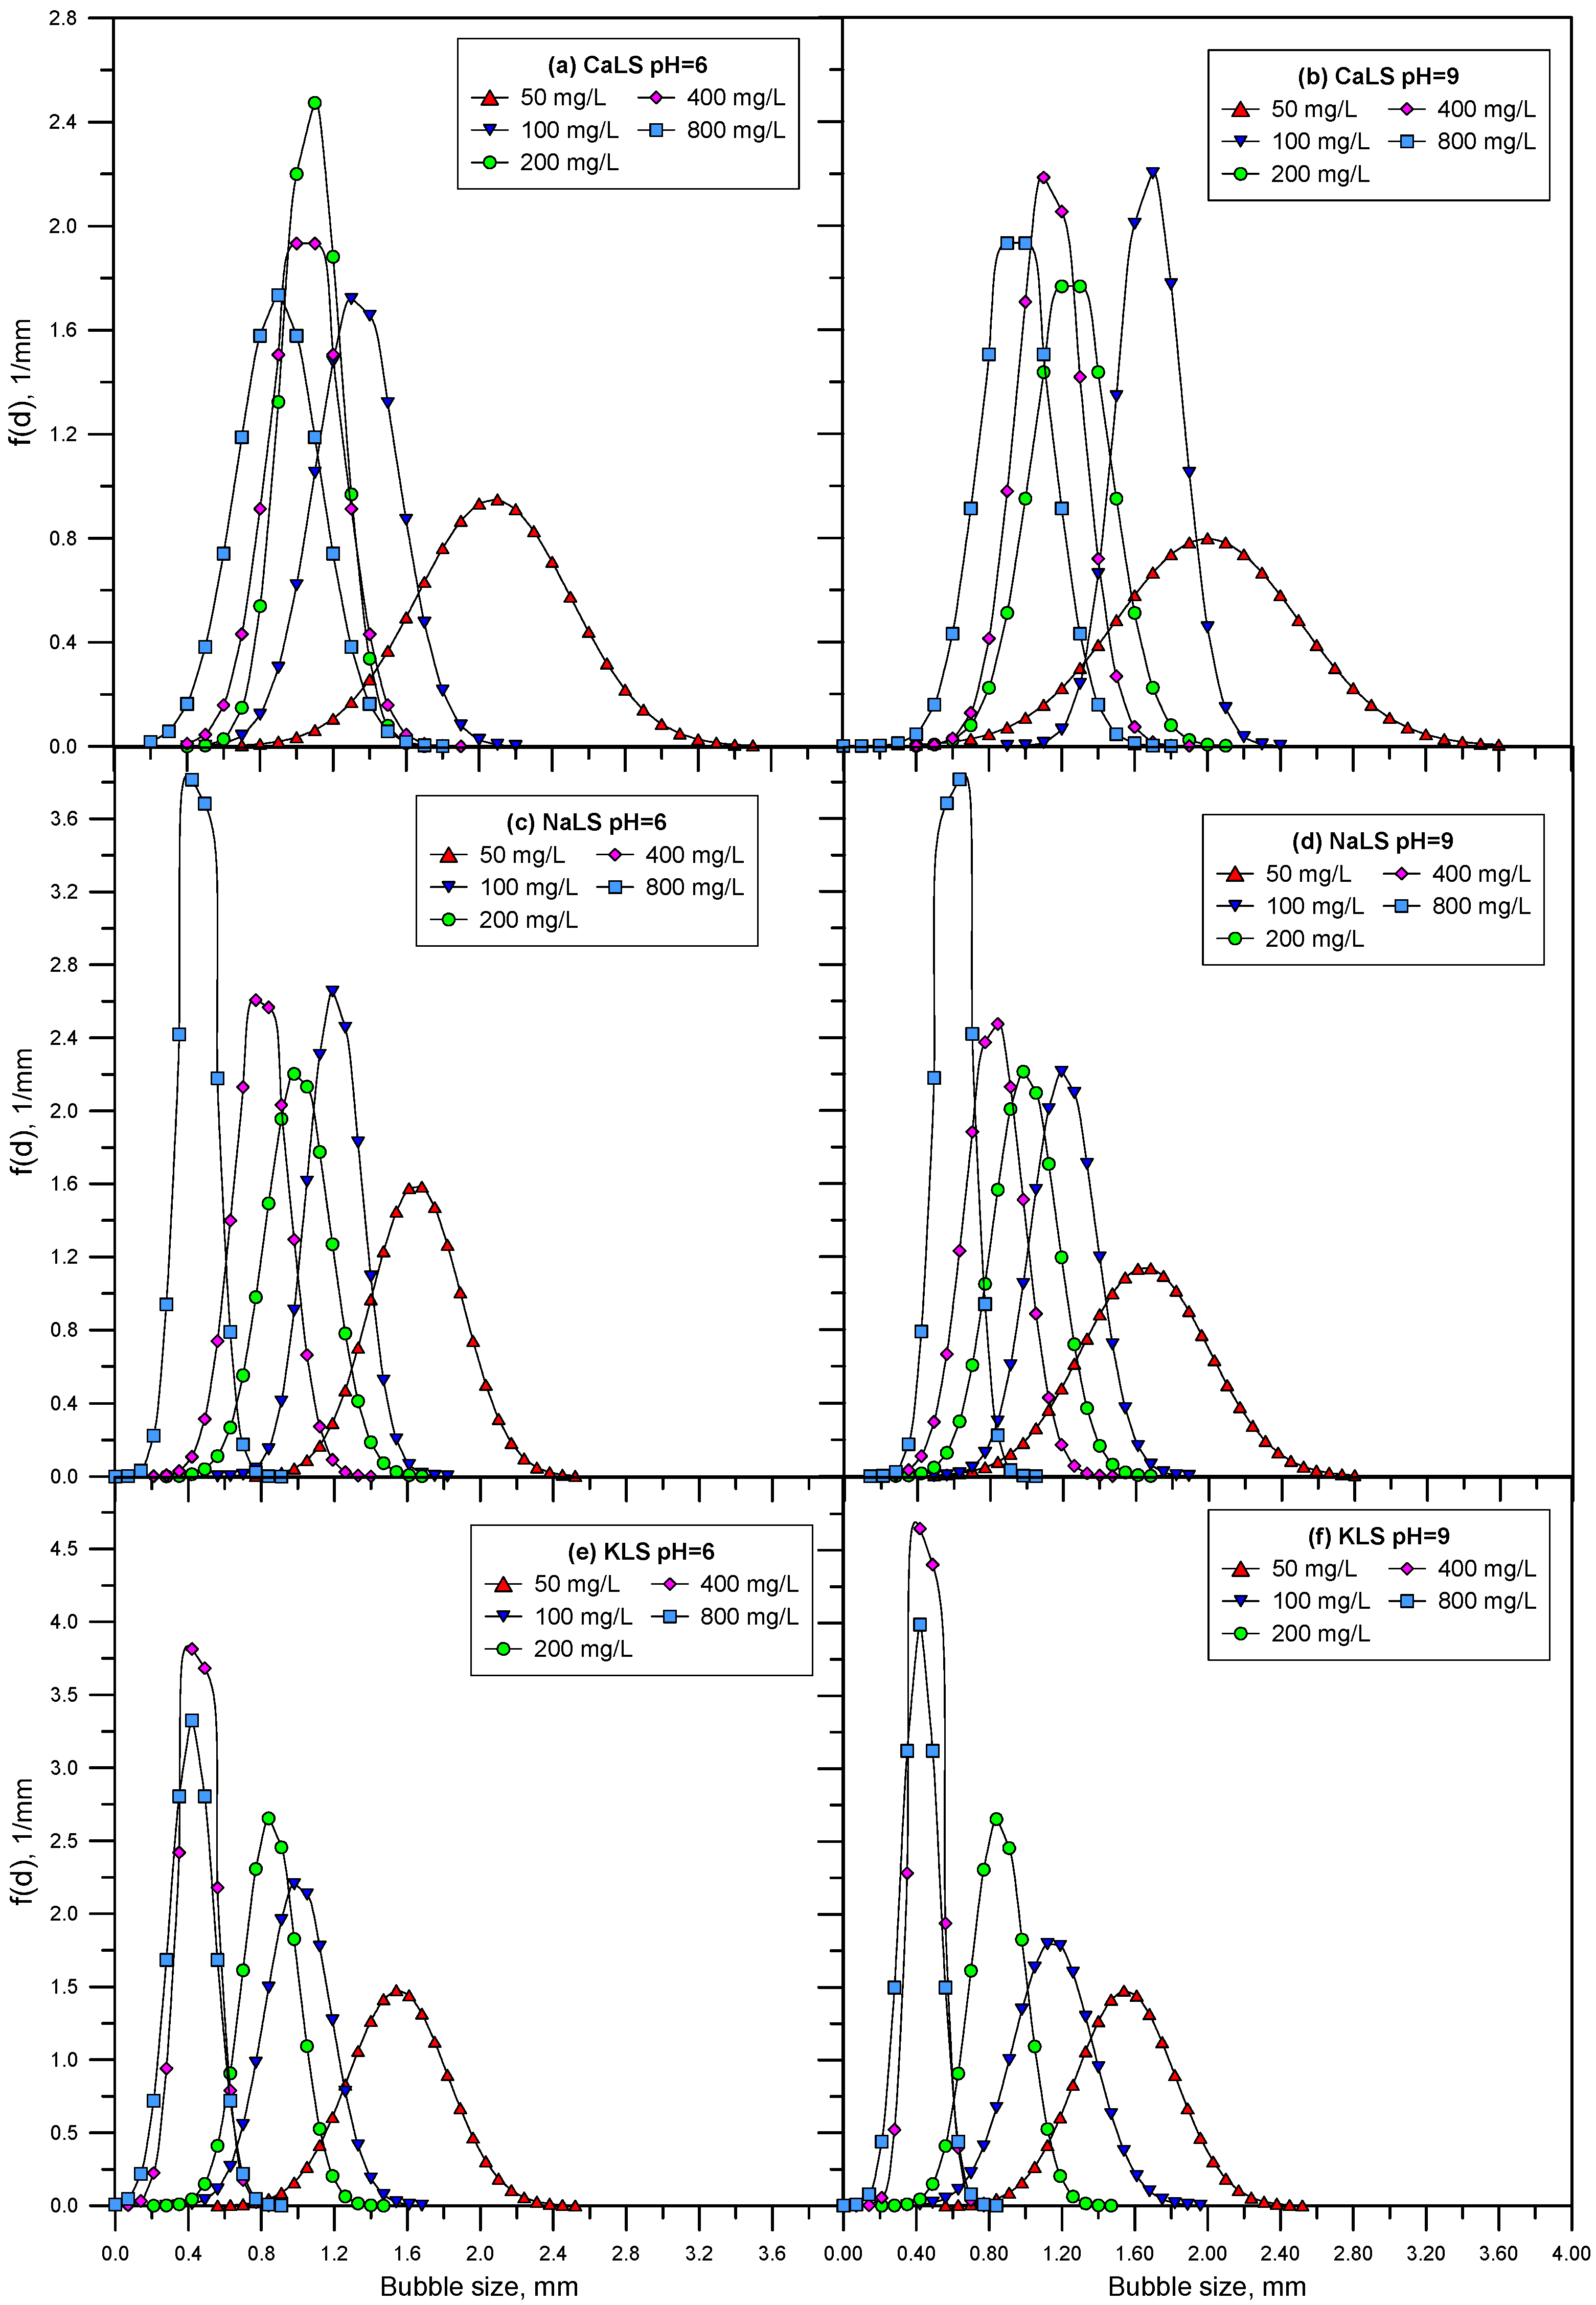
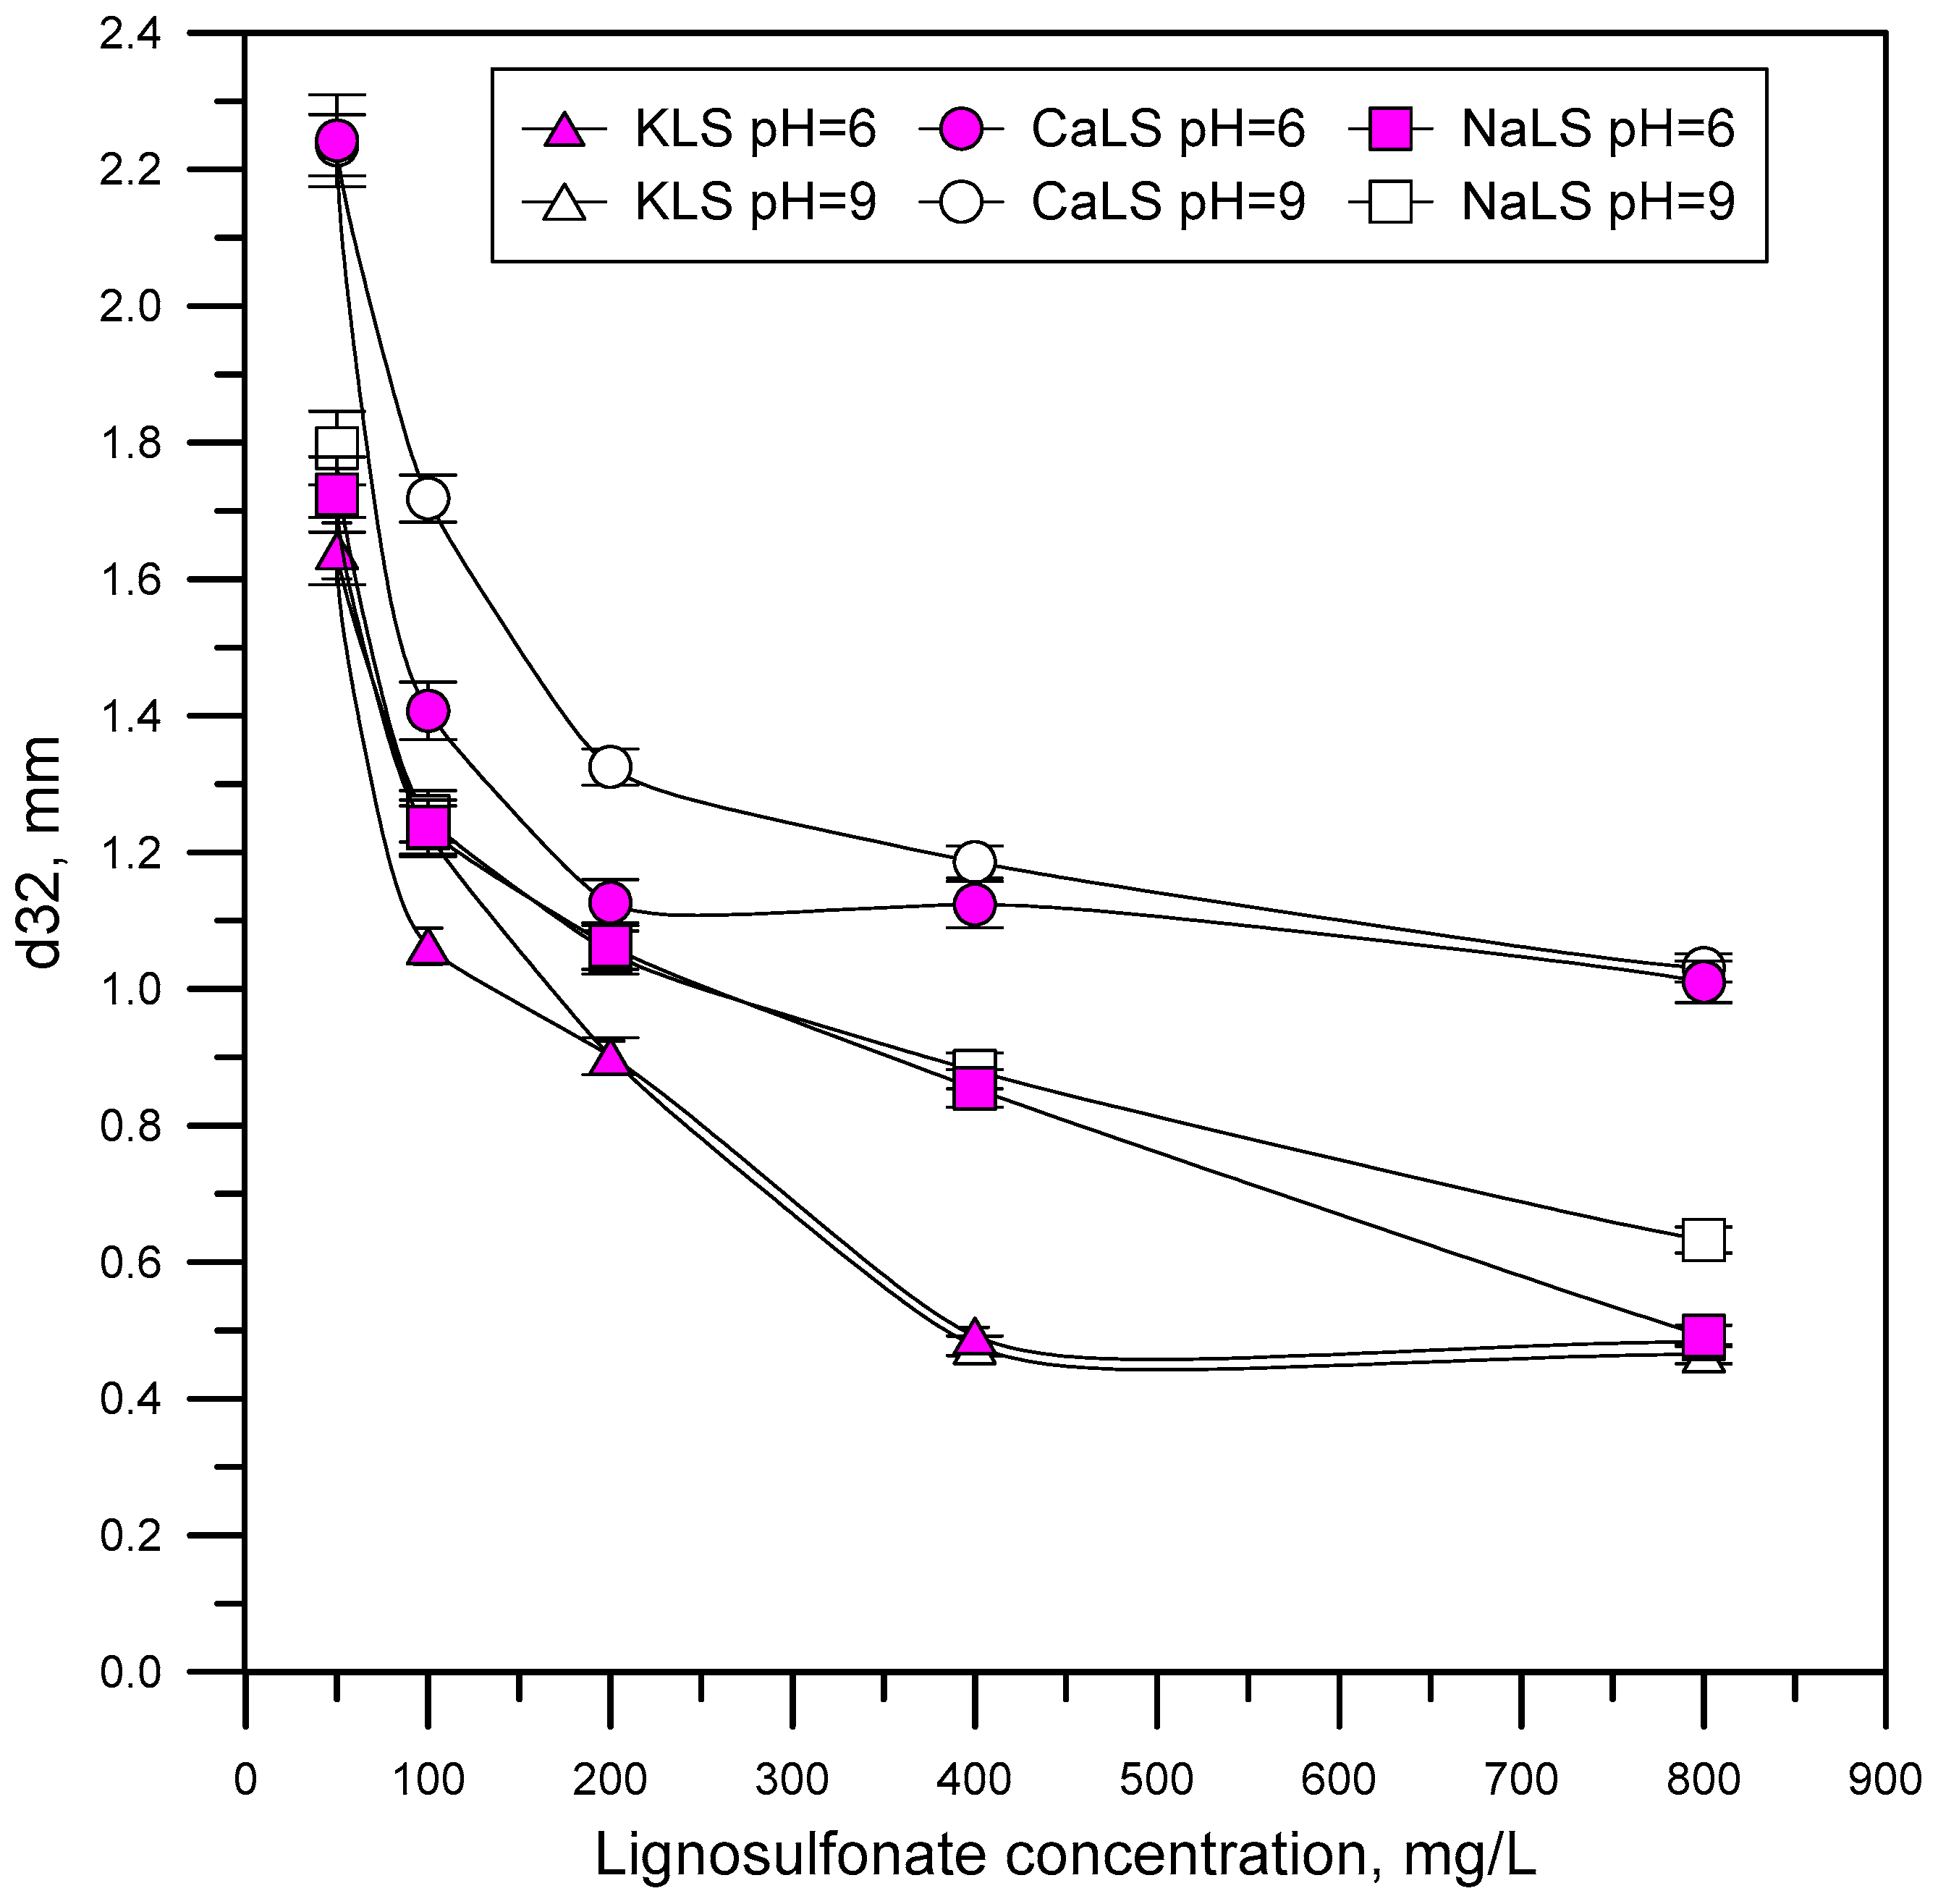
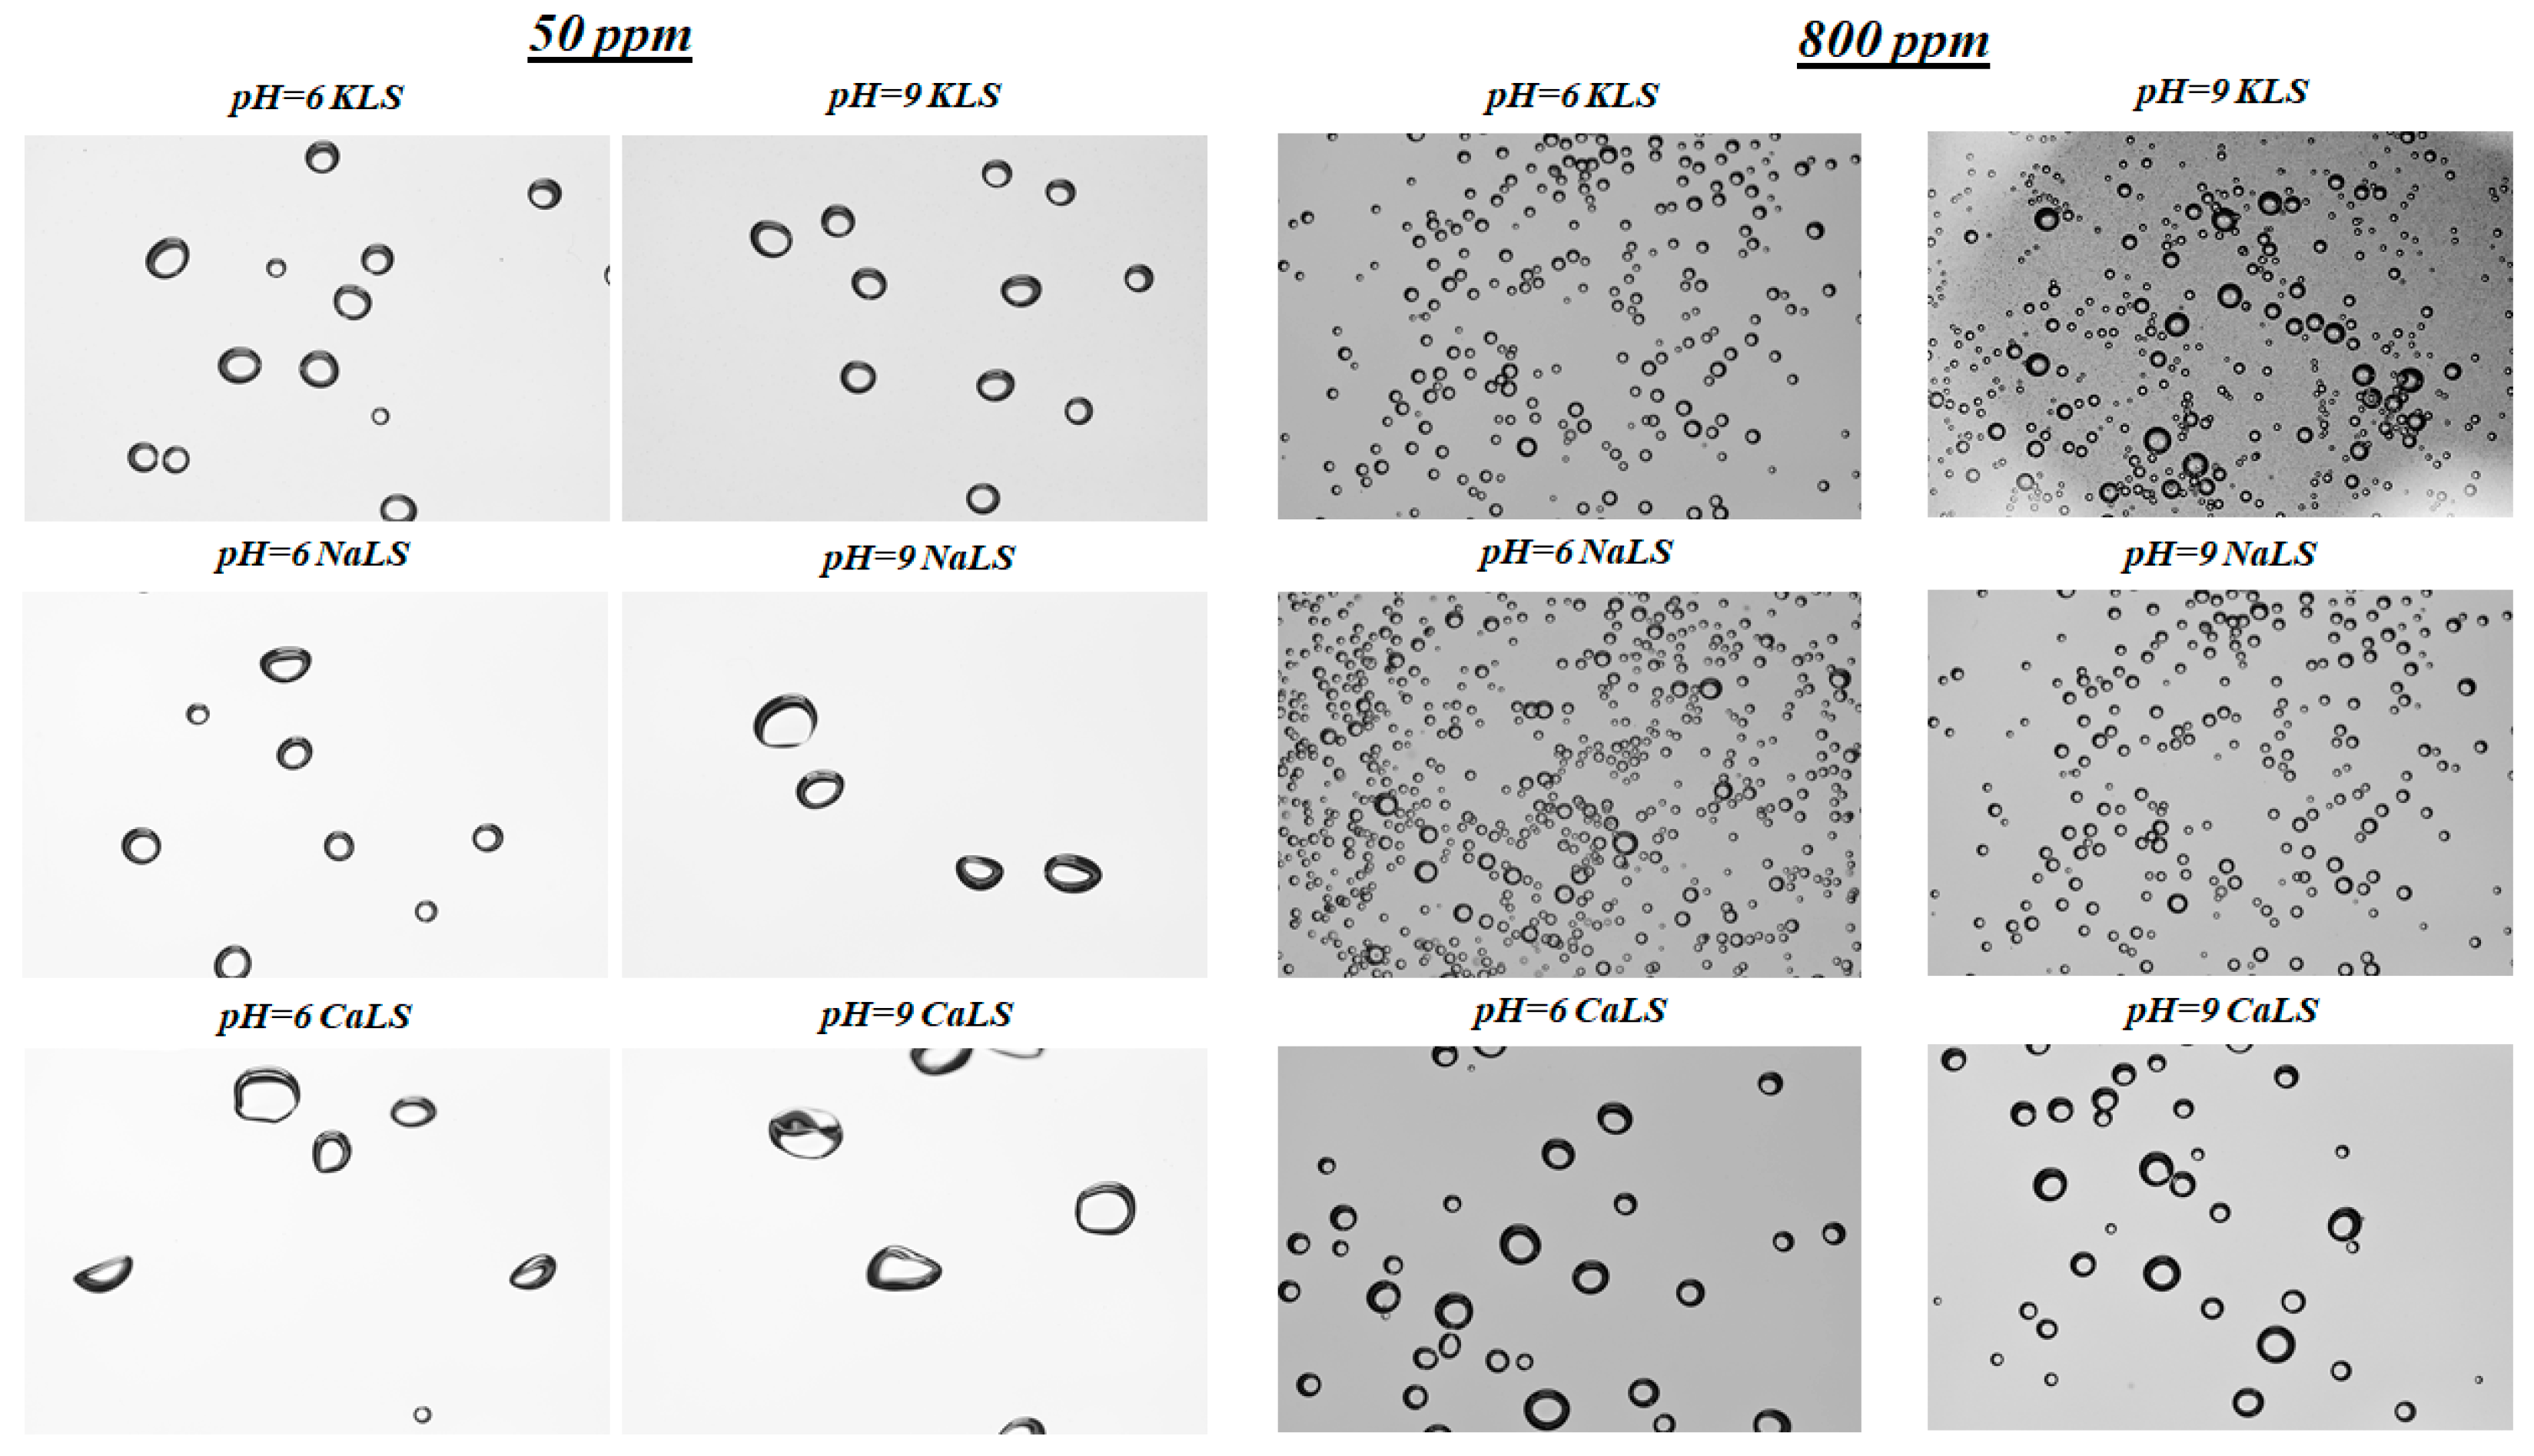
3.4. Bubble Size
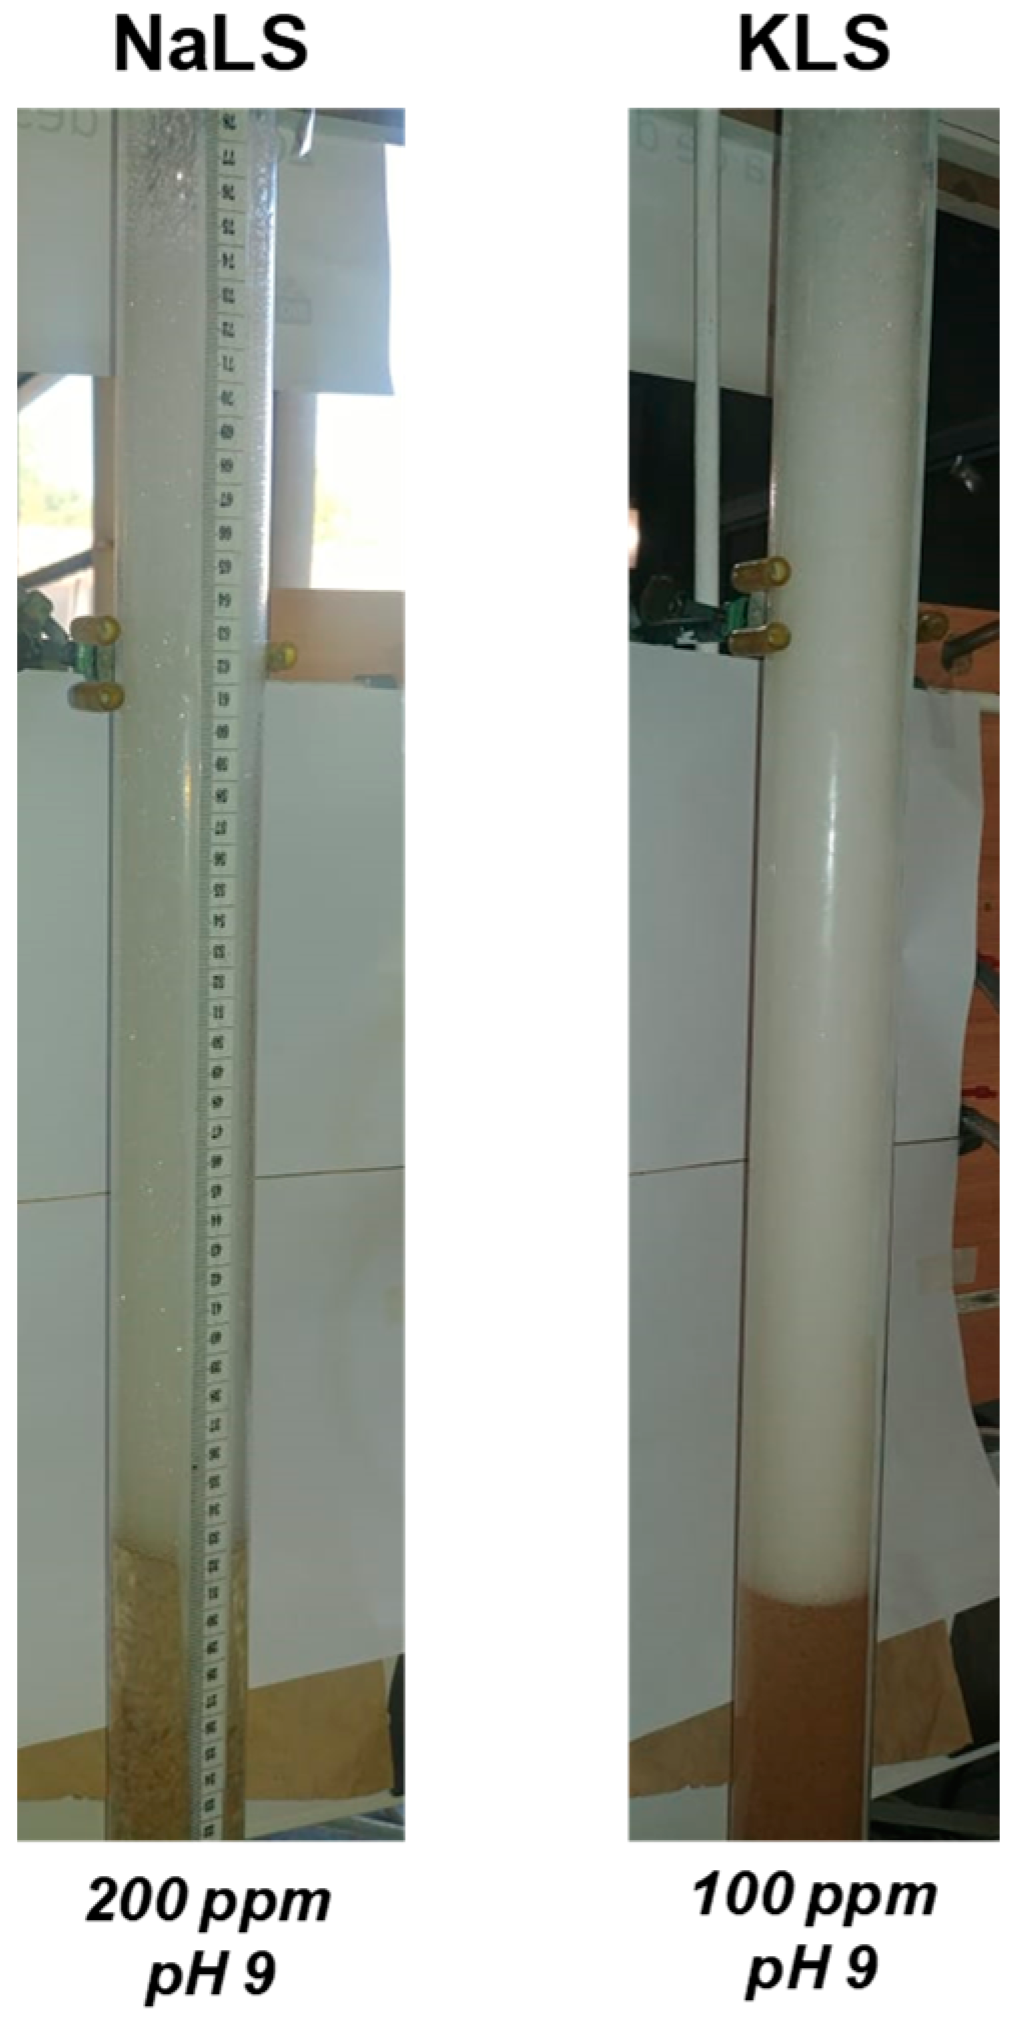
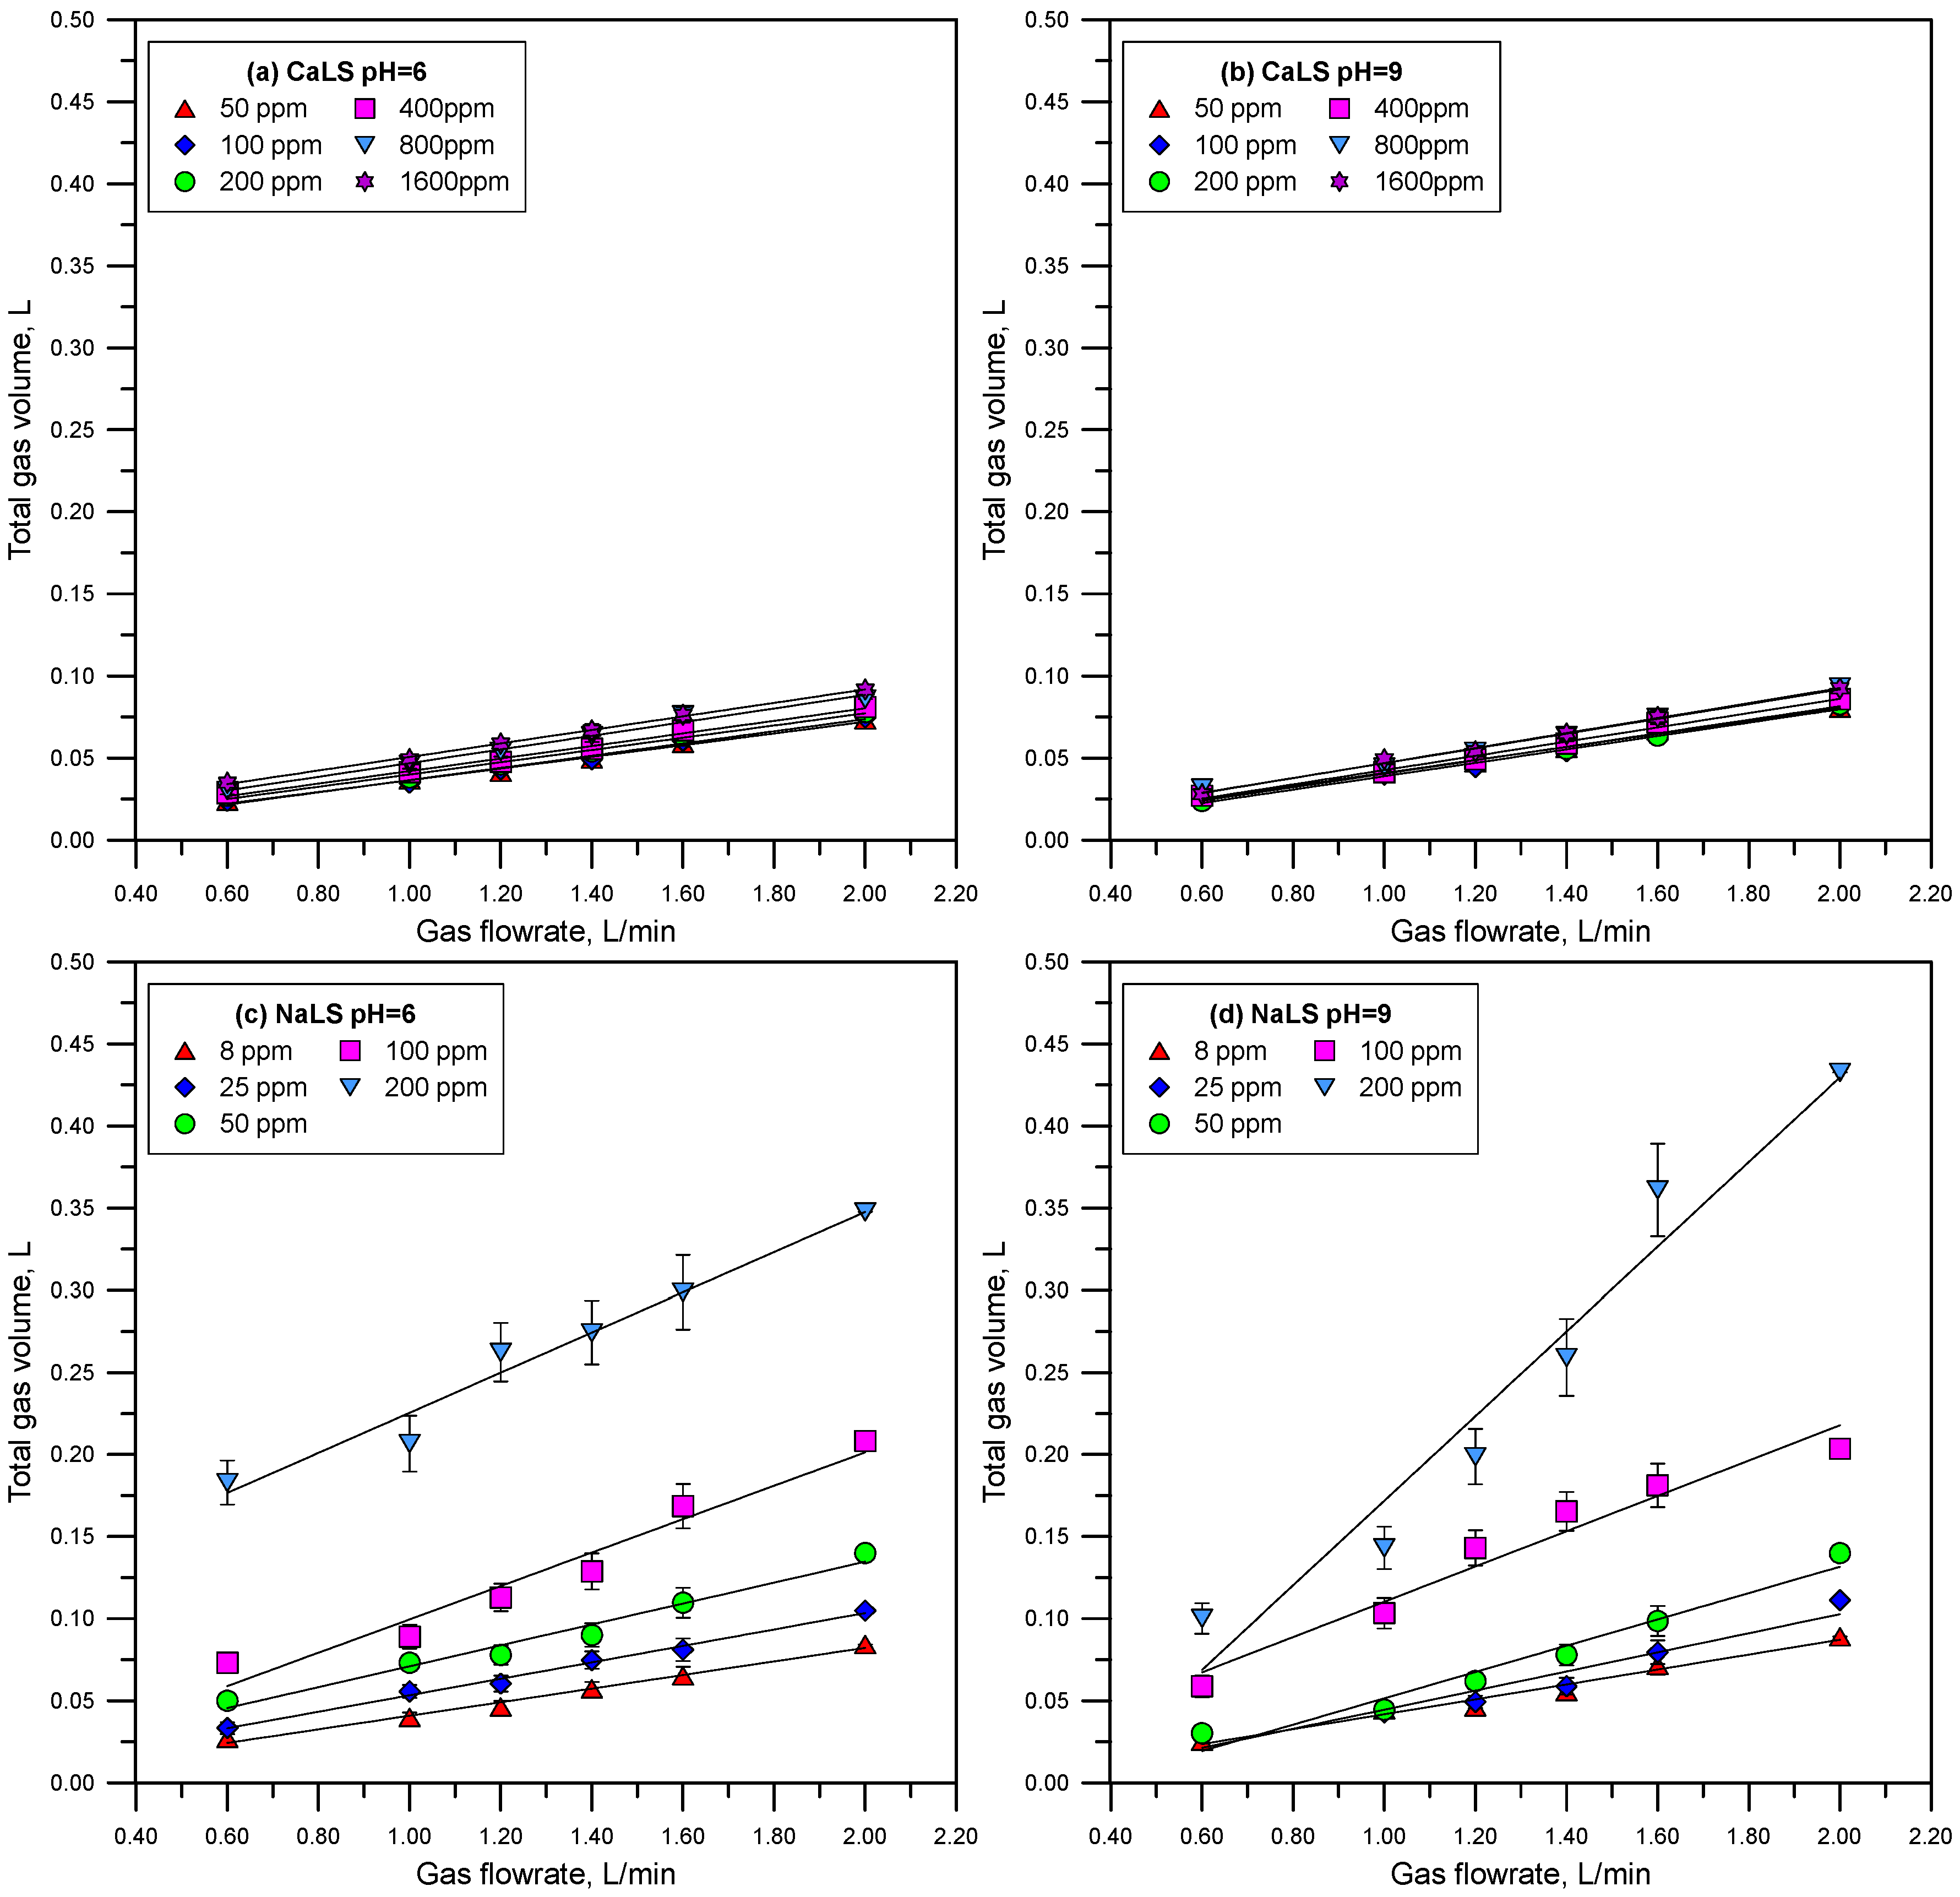
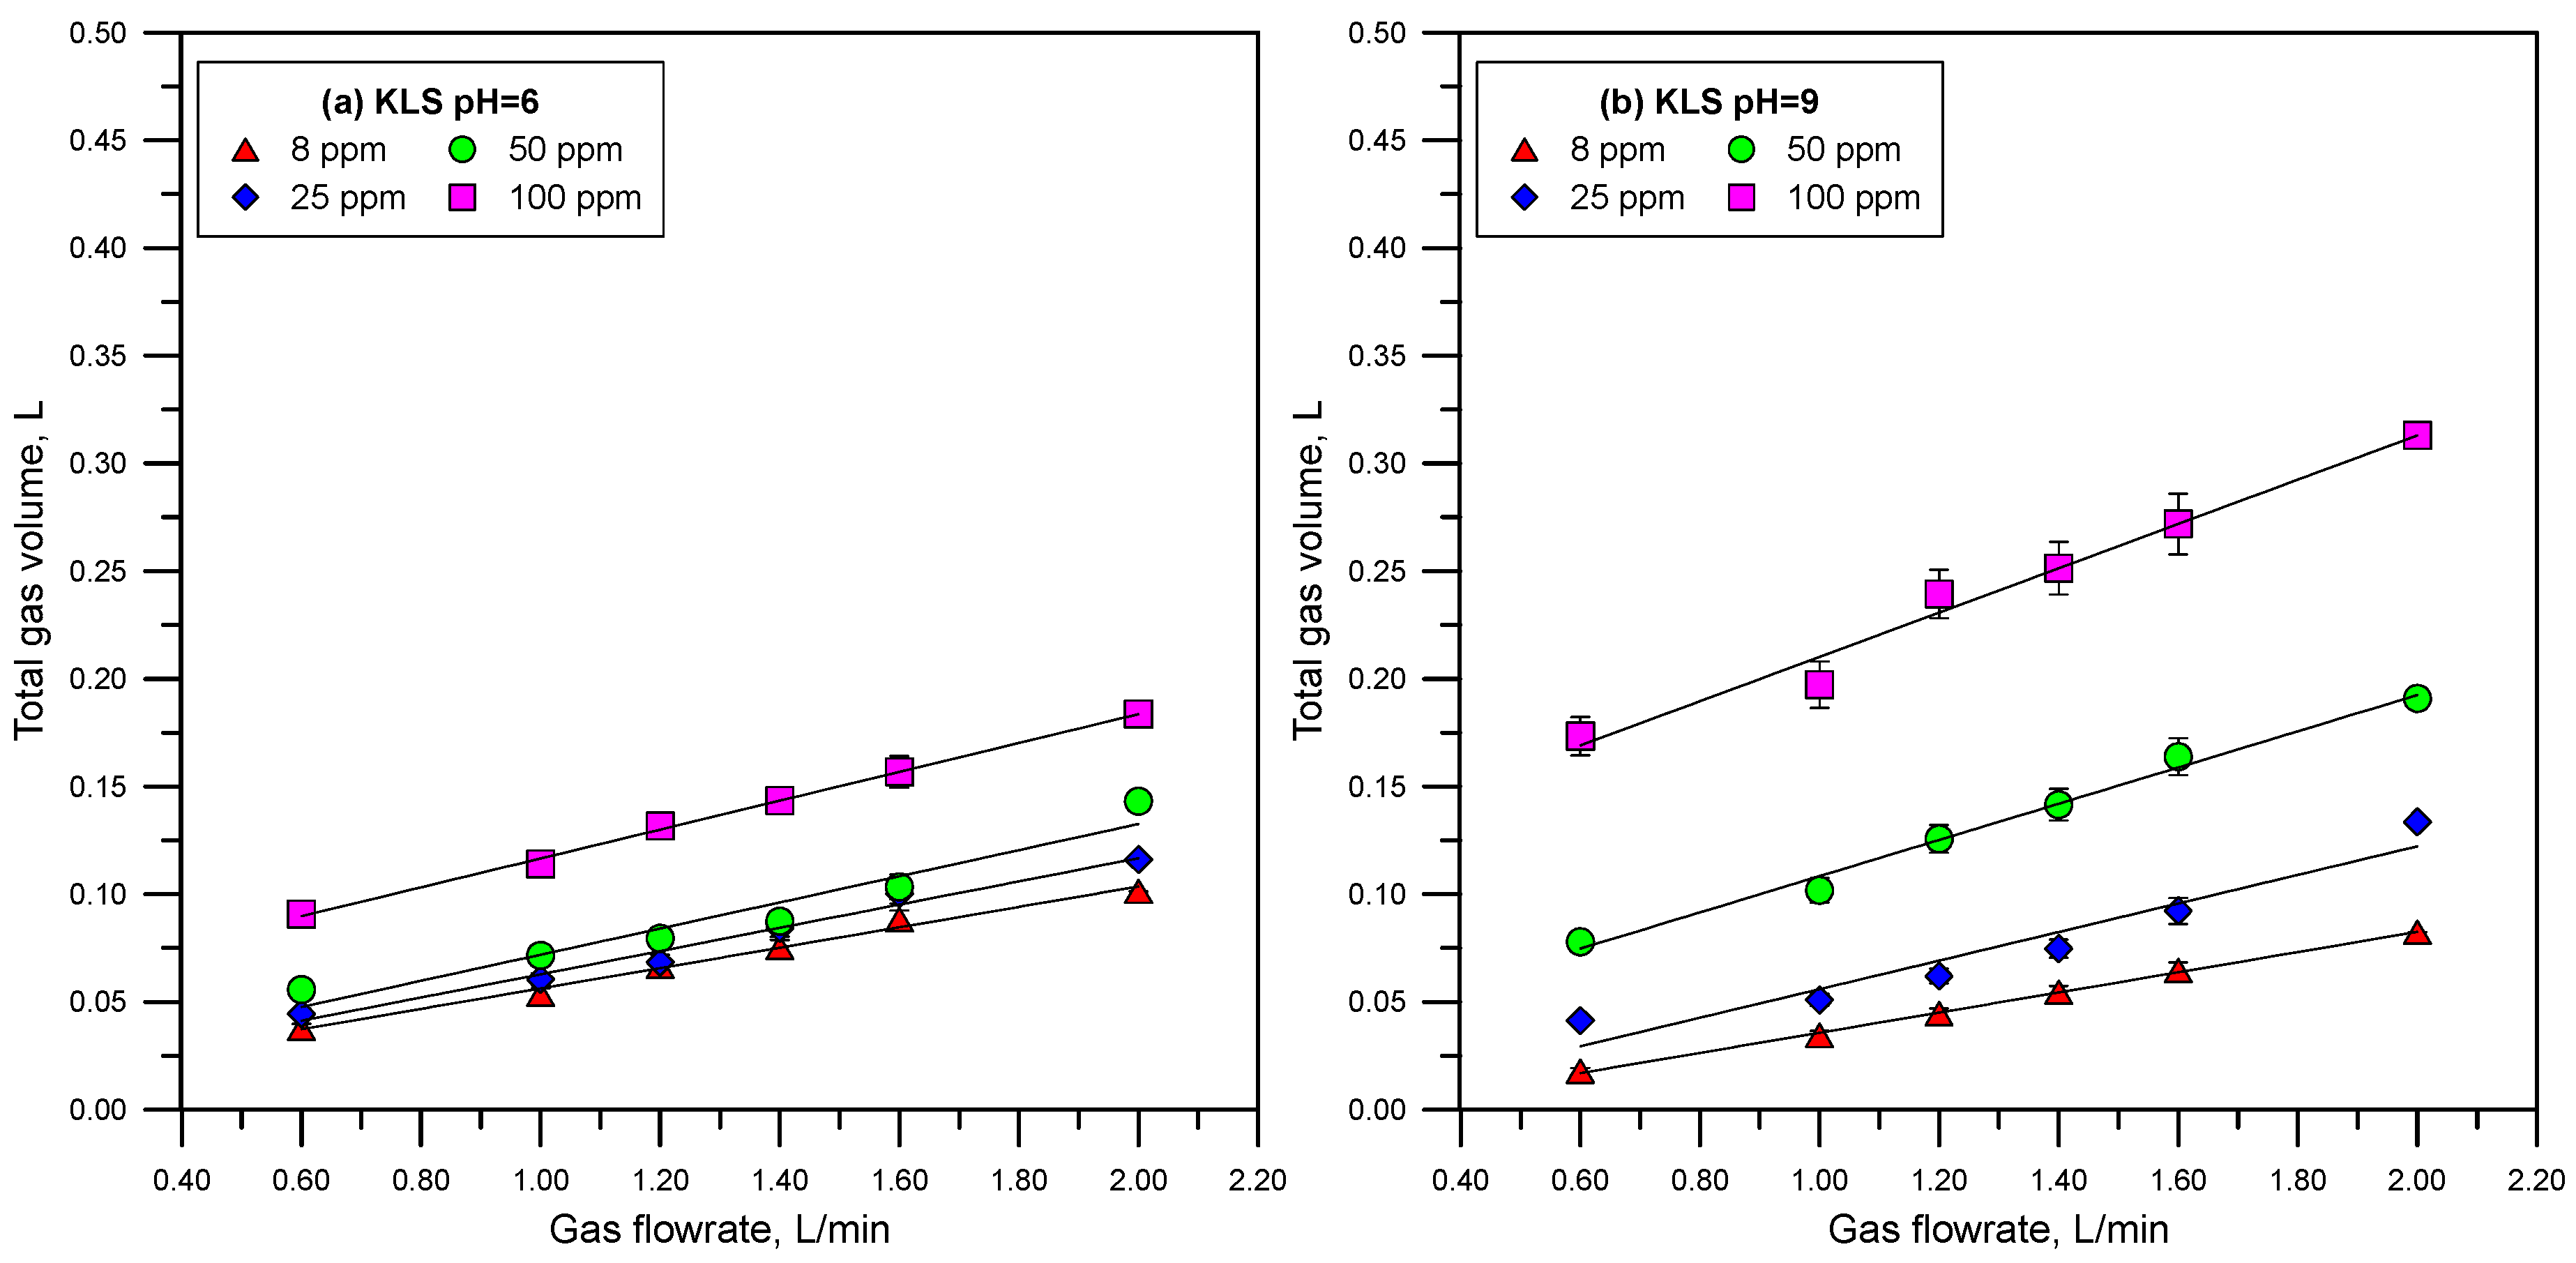
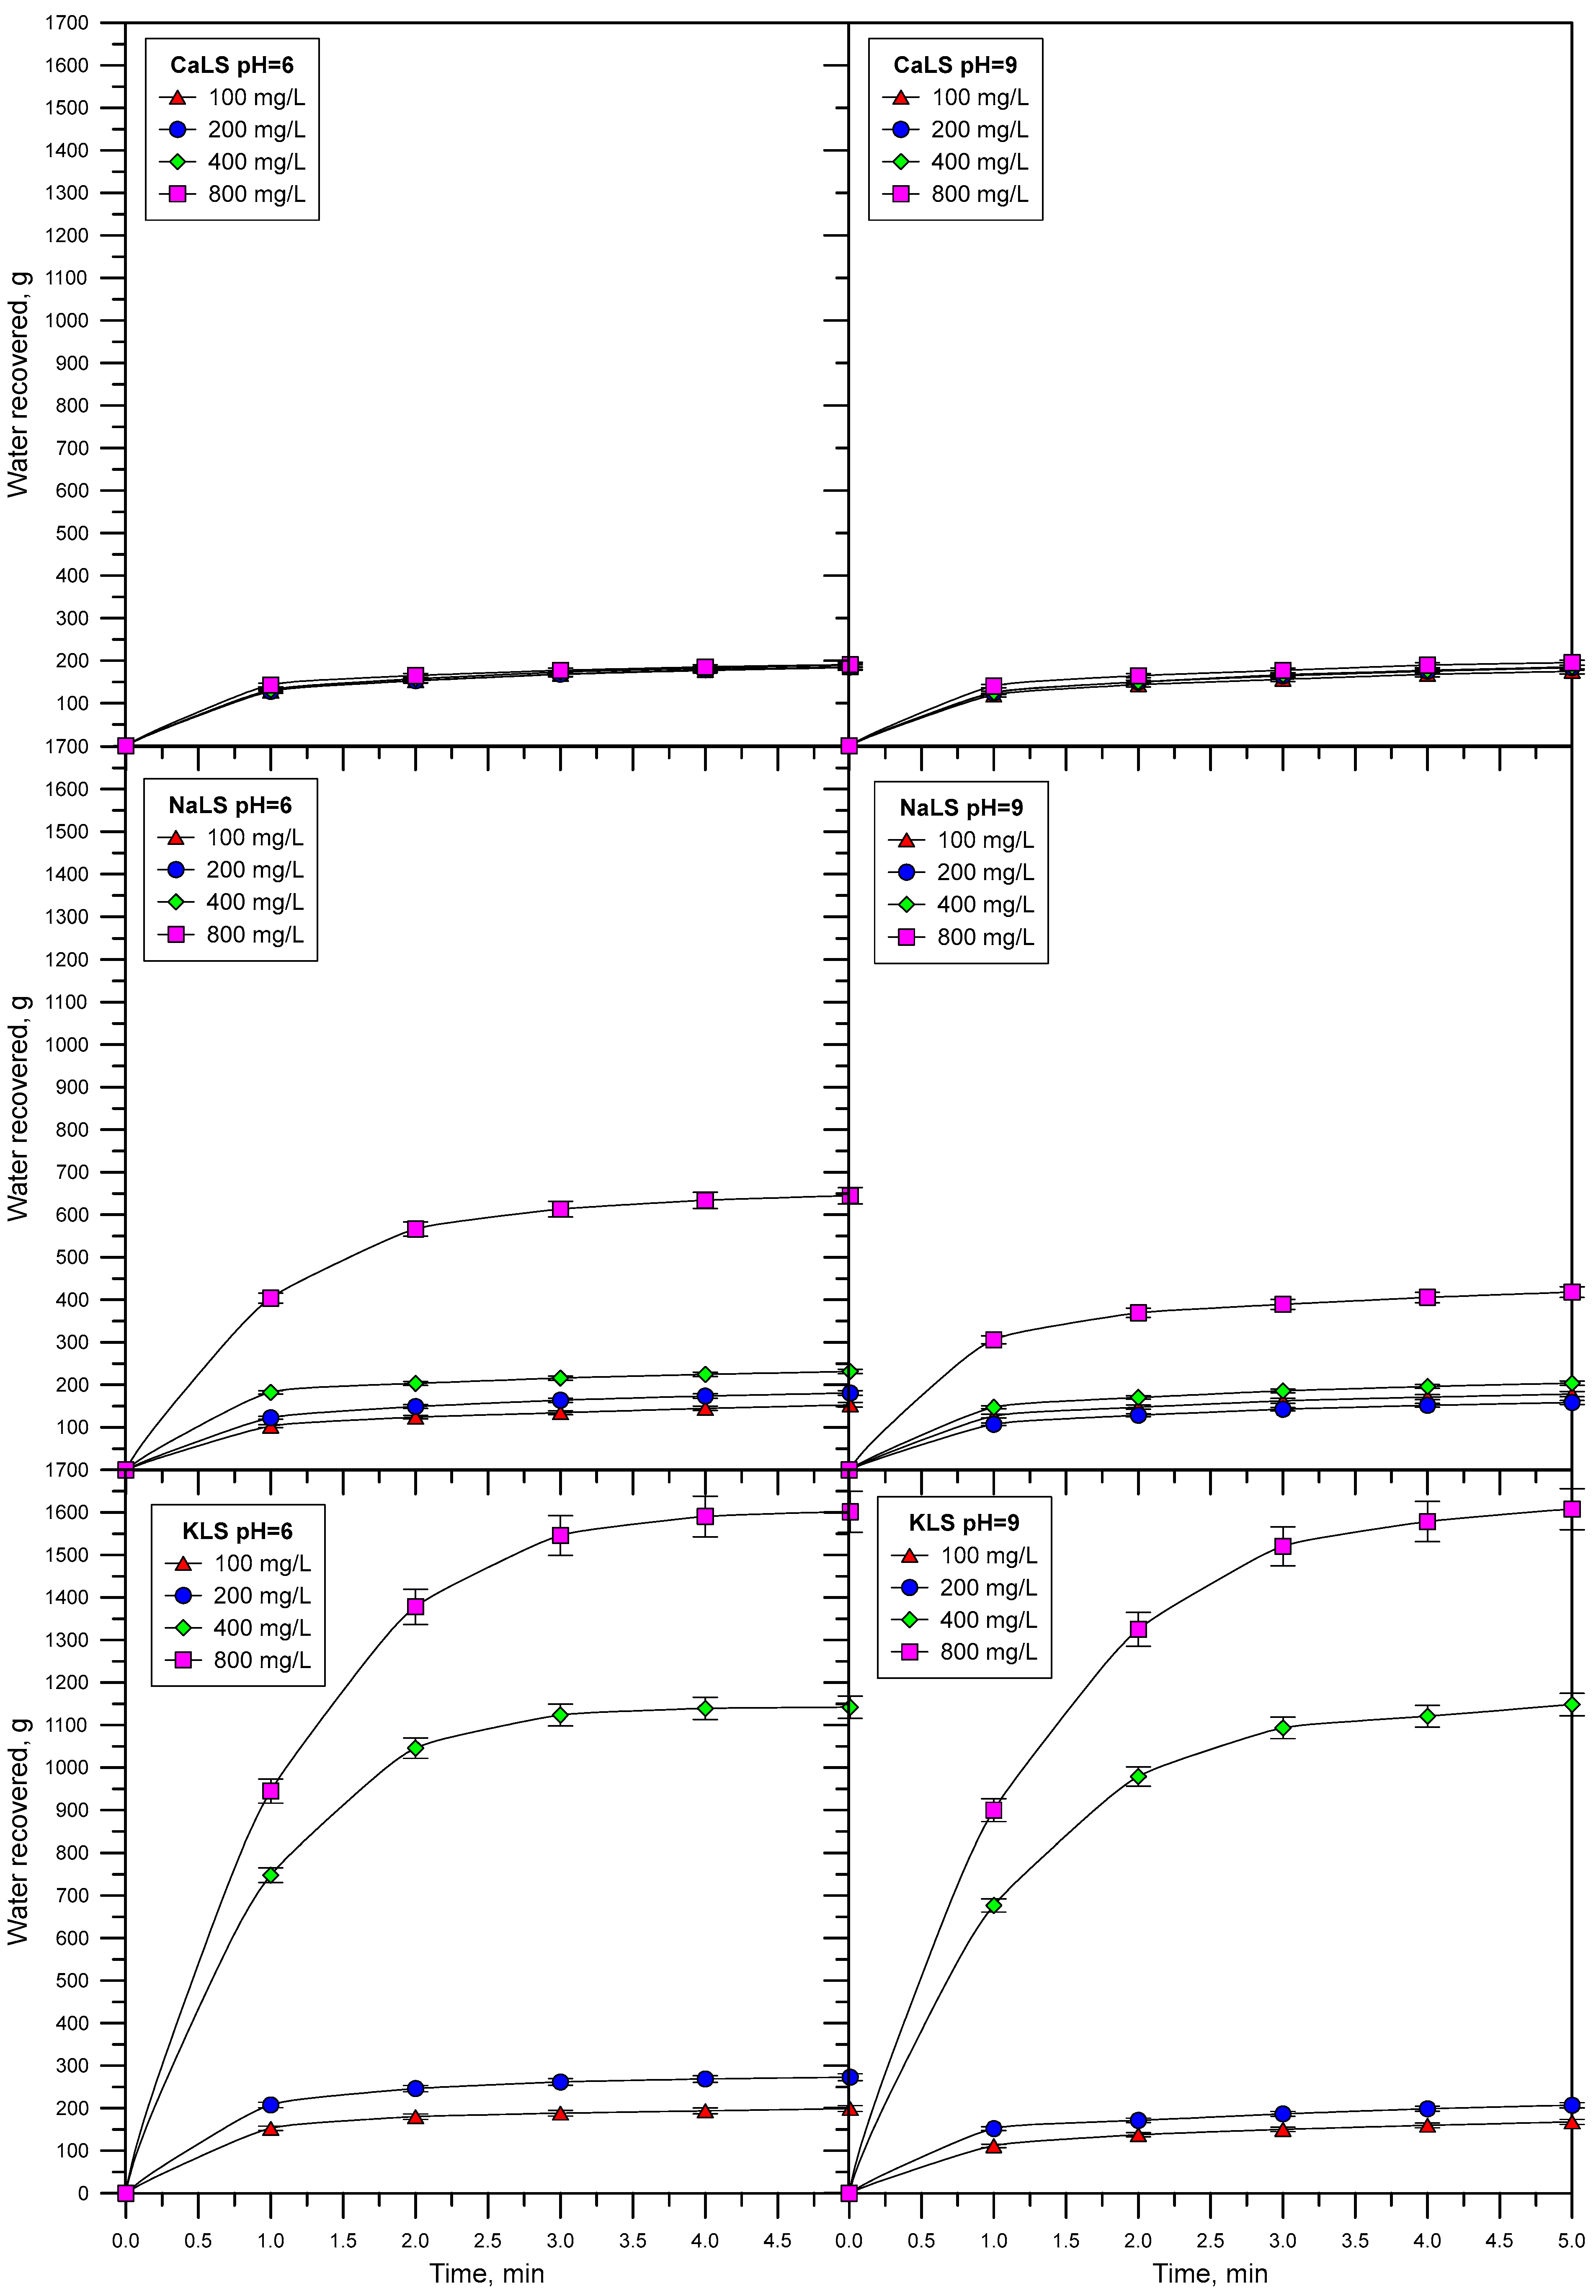
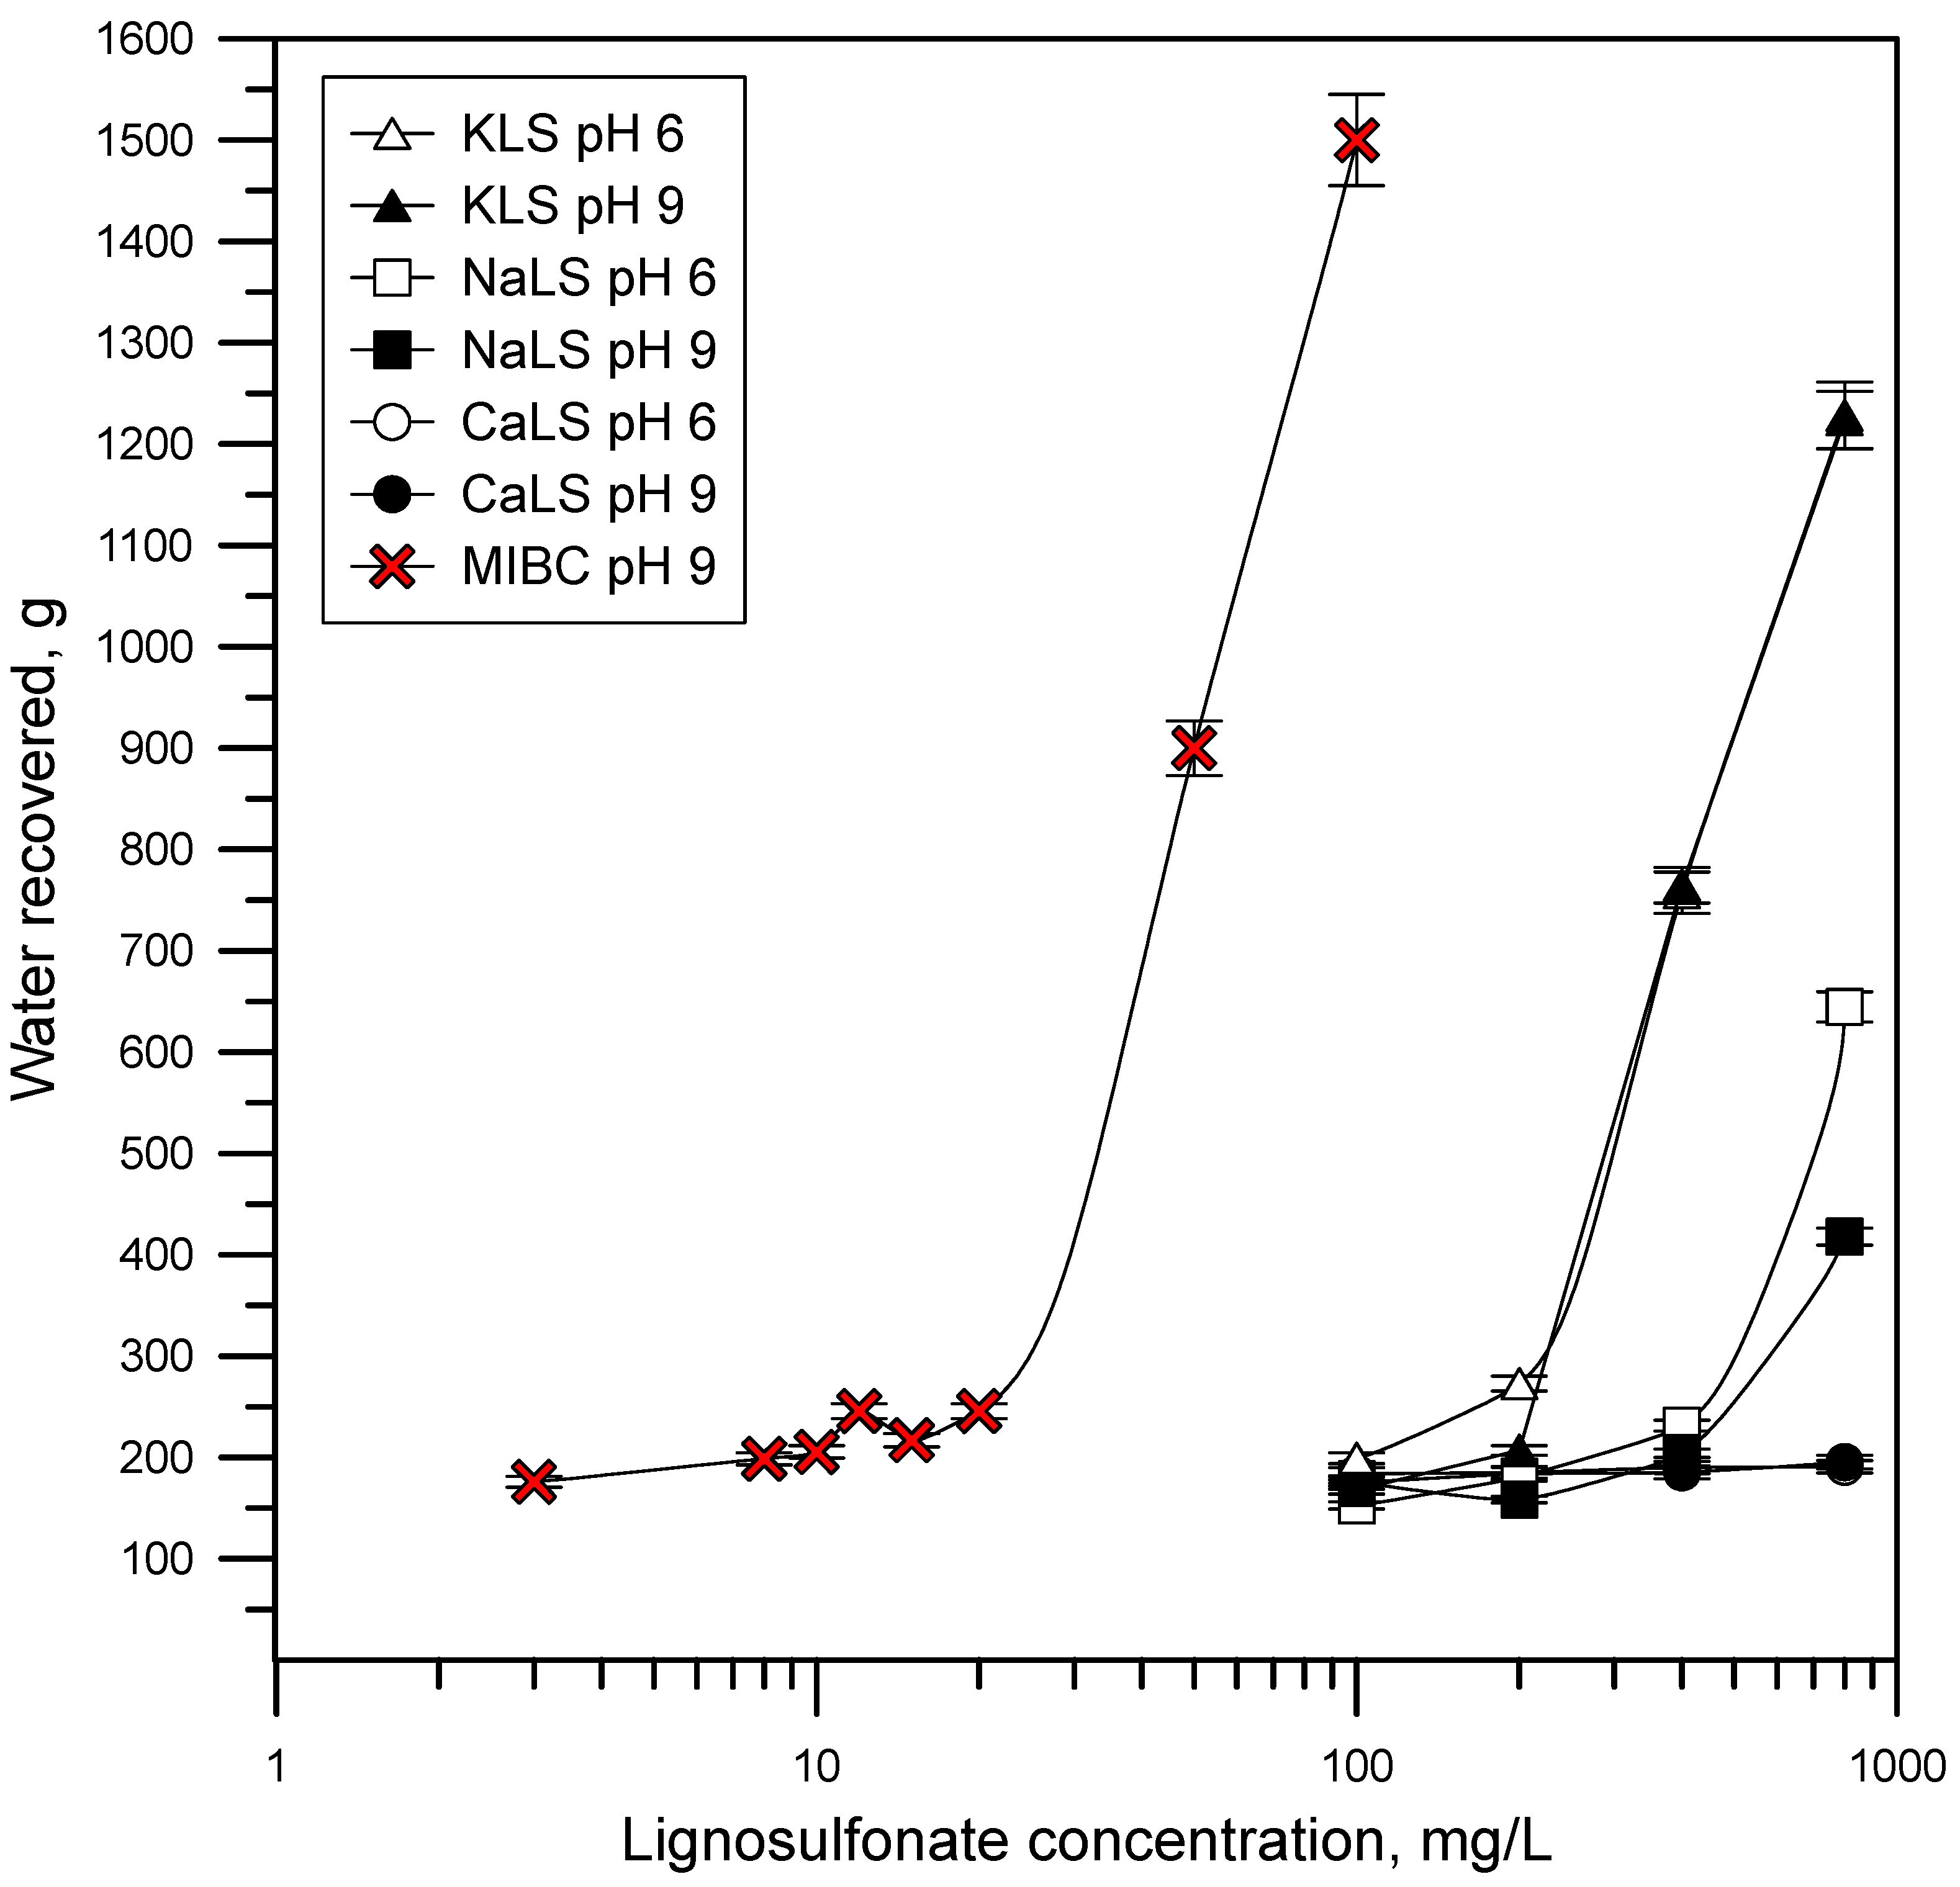
3.5. Water Recovery
4. Discussion
5. Conclusions
- The lignosulfonates studied in this work displayed substantial surface activity. The most surface-active lignosulfonate was KLS, followed by CaLS and NaLS. The order of surface activity of the lignosulfonates tested was related to the degree of anionicity and molecular weight of these polyelectrolytes.
- The surface activity of lignosulfonates decreased with the increase of pH, which is explained by the increase of negatively charged lignosulfonates at a higher pH, and by the stronger electrostatic repulsion between the more anionic lignosulfonates and the negatively charged air/water interface.
- The NaLS lignosulfonate is the one with the highest DFI value, which is higher than the DFI values obtained for the CaLS and KLS samples, and higher than the values reported for common industrial frothers.
- The lignosulfonates tested in this study had a strong effect on bubble size, with values like those previously obtained using MIBC. The KLS lignosulfonate generated the smallest bubble sizes (D32~0.5 mm), followed by NaLS (D32~0.5–0.6 mm) and CaLS (D32~1.0–1.1 mm).
- The experiments performed to assess the effect of lignosulfonates on water recovery, which were carried out through flotation experiments in a two-phase system, showed that the KLS and NaLS samples had the strongest effect. The amount of water recovered strongly increased in the presence of KLS and NaLS, which correlated with the surface tension, foamability, and bubble size results. According to these results, the increase of water recovery obtained in the presence of KLS and NaLS is explained by the inhibiting effect of these polyelectrolytes on bubble coalescence and most probably on bubble bursting.
Author Contributions
Funding
Acknowledgments
Conflicts of Interest
References
- Ansari, A.; Pawlik, M. Floatability of Chalcopyrite and Molybdenite in the Presence of Lignosulfonates Part II Hallimond Tube Flotation. Miner. Eng. 2007, 20, 609–616. [Google Scholar] [CrossRef]
- Ansari, A.; Pawlik, M. Floatability of Chalcopyrite and Molybdenite in the Presence of Lignosulfonates Part I Adsorption studies. Miner. Eng. 2007, 20, 600–608. [Google Scholar] [CrossRef]
- Gutierrez, L.; Uribe, L.; Hernandez, V.; Vidal, C.; Texeira Mendonça, R. Assessment of the Use of Lignosulfonates to Separate Chalcopyrite and Molybdenite by Flotation. Powder Technol. 2020, 359, 216–225. [Google Scholar] [CrossRef]
- Kelebek, S.; Yoruk, S.; Smith, G.W. Wetting Behavior of Molybdenite and Talc in Lignosulphonate/MIBC Solutions and Their Separation by Flotation. Sep. Sci. Technol. 2001, 36, 145–157. [Google Scholar] [CrossRef]
- Pradip; Fuerstenau, D.W. The Role of Inorganic and Organic Reagents in the Flotation Separation of Rare-Earth Ores. Int. J. Miner. Process. 1991, 32, 1–22. [Google Scholar] [CrossRef]
- Mu, Y.; Peng, Y.; Lauten, R.A. The Depression of Pyrite in Selective Flotation by Different Reagent Systems—A Literature Review. Miner. Eng. 2016, 96–97, 143–156. [Google Scholar] [CrossRef]
- Liu, S.; Chen, X.; Lauten, R.A.; Peng, Y.; Liu, Q. Mitigating the Negative Effects of Clay Minerals on Gold Flotation by a Lignosulfonate-Based Biopolymer. Miner. Eng. 2018, 126, 9–15. [Google Scholar] [CrossRef]
- Gutierrez, L.; Pawlik, M. Influence of humic acids on oil sand processing. Part I: Detection and quantification of humic acids in oil sand ores and their effect on bitumen wettability. Int. J. Miner. Process. 2014, 126, 117–125. [Google Scholar] [CrossRef]
- Laskowski, J.S.; Castro, S.; Gutierrez, L. Flotation in Seawater. Min. Metall. Explor. 2019, 36, 89–98. [Google Scholar] [CrossRef]
- Neethling, S.J.; Cilliers, J.J. The Entrainment Factor in Froth Flotation: Model for Particle Size and Other Operating Parameter Effects. Int. J. Miner. Process. 2009, 93, 141–148. [Google Scholar] [CrossRef]
- Neethling, S.J.; Lee, H.T.; Cilliers, J.J. Simple Relationships for Predicting the Recovery of Liquid from Flowing Foams and Froths. Miner. Eng. 2003, 16, 1123–1130. [Google Scholar] [CrossRef]
- Neethling, S.J.; Lee, H.T.; Cilliers, J.J. The Recovery of Liquid from Flowing Foams. J. Phys. Condens. Matter. 2003, 15, 1563. [Google Scholar] [CrossRef]
- Neethling, S.J.; Brito-Parada, P.R. Predicting Flotation Behaviour—The Interaction Between Froth Stability and Performance. Miner. Eng. 2018, 120, 60–65. [Google Scholar] [CrossRef]
- Ruwoldt, J.; Planque, J.; Øye, G. Lignosulfonate Salt Tolerance and the Effect on Emulsion Stability. ACS Omega 2020, 5, 15007–15015. [Google Scholar] [CrossRef] [PubMed]
- Ruwoldt, J.; Simon, S.; Øye, G. Viscoelastic Properties of Interfacial Lignosulfonate Films and The Effect of Added Electrolytes. Colloids Surf. A Physicochem. Eng. Asp. 2020, 606, 125478. [Google Scholar] [CrossRef]
- Paria, S.; Khilar, K.C. A Review on Experimental Studies of Surfactant Adsorption at the Hydrophilic Solid-Water Interface. Adv. Colloid Interface Sci. 2004, 110, 75–95. [Google Scholar] [CrossRef]
- El Mansouri, N.E.; Salvadó, J. Analytical Methods for Determining Functional Groups in Various Technical Lignins. Ind. Crops Prod. 2007, 26, 116–124. [Google Scholar] [CrossRef]
- Gosselink, R.J.A.; Abächerli, A.; Semke, H.; Malherbe, R.; Käuper, P.; Nadif, A.; Van Dam, J.E.G. Analytical Protocols for Characterisation of Sulphur-Free Lignin. Ind. Crops Prod. 2004, 19, 271–281. [Google Scholar] [CrossRef]
- Boeriu, C.G.; Bravo, D.; Gosselink, R.J.A.; van Dam, J.E.G. Characterisation of Structure-Dependent Functional Properties of Lignin with Infrared Spectroscopy. Ind. Crops Prod. 2004, 20, 205–218. [Google Scholar] [CrossRef]
- Capanema, E.A.; Balakshin, M.Y.; Kadla, J.F. A Comprehensive Approach for Quantitative Lignin Characterization by NMR Spectroscopy. J. Agric. Food Chem. 2004, 52, 1850–1860. [Google Scholar] [CrossRef]
- Lecomte Du Noüy, P. A New Apparatus for Measuring Surface Tension. J. Gen. Physiol. 1919, 1, 521. [Google Scholar] [CrossRef]
- Qiu, X.; Kong, Q.; Zhou, M.; Yang, D. Aggregation Behavior of Sodium Lignosulfonate in Water Solution. J. Phys. Chem. B 2010, 114, 15857–15861. [Google Scholar] [CrossRef]
- Masutani, G.; Stenstrom, M.K. A Review of Surface Tension Measuring Techniques, Surfactants, and Treir Implications for Oxygen Transfer in Wastewater Treatment Plants; Water Research Program, School of Engineering and Applied Science, University of California: Los Angeles, CA, USA, 1984. [Google Scholar]
- Małysa, E.; Małysa, K.; Czarnecki, J. A Method of Comparison of the Frothing and Collecting Properties of Frothers. Colloids Surf. 1987, 23, 29–39. [Google Scholar] [CrossRef]
- Gomez, C.O.; Finch, J.A. Gas Dispersion Measurements in Flotation Cells. Int. J. Miner. Process. 2007, 84, 51–58. [Google Scholar] [CrossRef]
- Alvarez, J.; Gomez, C.; Wen, L.W. Gas Dispersion Characterization of a Laboratory Mechanical Flotation Cell. In Proceedings of the XXVII International Mineral Processing Congress, Santiago, Chile, 20–24 October 2014; Volume I. [Google Scholar]
- Atrafi, A.; Gomez, C.O.; Finch, J.A.; Pawlik, M. Frothing behavior of Aqueous Solutions of Oleic Acid. Miner. Eng. 2012, 36–38, 138–144. [Google Scholar] [CrossRef]
- Grigg, R.B.; Bai, B. Calcium Lignosulfonate Adsorption and Desorption on Berea Sandstone. J. Colloid Interface Sci. 2004, 279, 36–45. [Google Scholar] [CrossRef]
- Qiu, X.; Yan, M.; Yang, D.; Pang, Y.; Deng, Y. Effect of Straight-Chain Alcohols on the Physicochemical Properties of Calcium Lignosulfonate. J. Colloid Interface Sci. 2009, 338, 151–155. [Google Scholar] [CrossRef] [PubMed]
- Yan, M.; Yang, D.; Deng, Y.; Chen, P.; Zhou, H.; Qiu, X. Influence of pH on the Behavior of Lignosulfonate Macromolecules in Aqueous Solution. Colloids Surf. A Physicochem. Eng. Asp. 2010, 371, 50–58. [Google Scholar] [CrossRef]
- Simon, S.S.; Saadat, M.; Ruwoldt, J.; Dudek, M.; Ellis, R.J.; Øye, G. Lignosulfonates in Crude Oil Processing: Interactions with Asphaltenes at the Oil/Water Interface and Screening of Potential Applications. ACS Omega 2020, 5, 30189–30200. [Google Scholar] [CrossRef] [PubMed]
- Park, S.; Lee, S.; Rosli, W.; Sulaiman, W. Adsorption Behaviors of Surfactants for Chemical Flooding In Enhanced Oil Recovery. J. Ind. Eng. Chem. 2015, 21, 1239–1245. [Google Scholar] [CrossRef]
- Askvik, K.M.; Are Gundersen, S.; Sjöblom, J.; Merta, J.; Stenius, P. Complexation Between Lignosulfonates and Cationic Surfactants and its Influence on Emulsion and Foam Stability. Colloids Surf. A Physicochem. Eng. Asp. 1999, 159, 89–101. [Google Scholar] [CrossRef]
- Czarnecki, J.; Małysa, K.; Pomianowski, A. Dynamic Frothability Index. J. Colloid Interface Sci. 1982, 86, 570–572. [Google Scholar] [CrossRef]
- Cho, Y.S.; Laskowski, J.S. Effect of Flotation Frothers on Bubble Size And Foam Stability. Int. J. Miner. Process. 2002, 64, 69–80. [Google Scholar] [CrossRef]
- Nanthakumar, B.; Arinaitwe, E.; Pawlik, M. Adsorption of Sodium Lignosulfonates on Hematite. Adsorption 2010, 16, 447–455. [Google Scholar] [CrossRef]
- Myers, D. Surfaces, Interfaces, and Colloids Principles and Applications, 2nd ed.; Wiley: New York, NY, USA, 1999. [Google Scholar]
- Li, C.; Somasundaran, P. Reversal of Bubble Charge in Multivalent Inorganic Salt Solutions-Effect of Magnesium. J. Colloid Interface Sci. 1991, 146, 215–218. [Google Scholar] [CrossRef]
- Pugh, R.J. Foaming, Foam Films, Antifoaming and Defoaming. Adv. Colloid Interface Sci. 1996, 64, 67–142. [Google Scholar] [CrossRef]
- Pugh, R.J. Experimental Techniques for Studying the Structure of Foams and Froths. Adv. Colloid Interface Sci. 2005, 114–115, 239–251. [Google Scholar] [CrossRef]


| Moisture | C | H | N | S | Ca | Na | Sulfonate Sulfur | Carboxylic Groups | Mwa | Mn | Mw/Mn | |
|---|---|---|---|---|---|---|---|---|---|---|---|---|
| % | % | % | % | % | % | % | % | % | Da | Da | ||
| NaLS | 9.5 | 42.2 | 4.75 | ˂2.2 | 3.73 | 1.48 | 20.48 | 3.5 | 4.5 | 54,000 | 7300 | 7.40 |
| CaLS | 10.2 | 41.8 | 5.30 | ˂2.2 | 5.50 | 16.60 | 5.00 | 4.7 | 6.4 | 18,000 | 2500 | 7.20 |
| KLS | 9.4 | 38.8 | 4.25 | 3.90 | 5.70 | 0.00 | 11.55 | 5.6 | 6.3 | 960 | 634 | 1.51 |
| DFI, sL/mol | rt∞, s | k, L/mol | ||||
|---|---|---|---|---|---|---|
| pH = 6 | pH = 9 | pH = 6 | pH = 9 | pH = 6 | pH = 9 | |
| NaLS | 3,074,122 | 3,298,648 | 8.8 | 10.2 | 349,332 | 323,397 |
| CaLS | 15,304 | 26,310 | 2.5 | 2.7 | 6122 | 974 |
| KLS | 30,802 | 56,911 | 4.4 | 7.7 | 7000 | 7391 |
Disclaimer/Publisher’s Note: The statements, opinions and data contained in all publications are solely those of the individual author(s) and contributor(s) and not of MDPI and/or the editor(s). MDPI and/or the editor(s) disclaim responsibility for any injury to people or property resulting from any ideas, methods, instructions or products referred to in the content. |
© 2023 by the authors. Licensee MDPI, Basel, Switzerland. This article is an open access article distributed under the terms and conditions of the Creative Commons Attribution (CC BY) license (https://creativecommons.org/licenses/by/4.0/).
Share and Cite
Chique, J.; Uribe, L.; Pawlik, M.; Ramirez, A.; Gutierrez, L. Foaming Properties of Lignosulfonates in the Flotation Process. Polymers 2023, 15, 3575. https://doi.org/10.3390/polym15173575
Chique J, Uribe L, Pawlik M, Ramirez A, Gutierrez L. Foaming Properties of Lignosulfonates in the Flotation Process. Polymers. 2023; 15(17):3575. https://doi.org/10.3390/polym15173575
Chicago/Turabian StyleChique, Jhon, Lina Uribe, Marek Pawlik, Andres Ramirez, and Leopoldo Gutierrez. 2023. "Foaming Properties of Lignosulfonates in the Flotation Process" Polymers 15, no. 17: 3575. https://doi.org/10.3390/polym15173575
APA StyleChique, J., Uribe, L., Pawlik, M., Ramirez, A., & Gutierrez, L. (2023). Foaming Properties of Lignosulfonates in the Flotation Process. Polymers, 15(17), 3575. https://doi.org/10.3390/polym15173575