
Adsorption of Methylene Blue Dye by Cetyltrimethylammonium Bromide Intercalated Polyaniline-Functionalized Montmorillonite Clay Nanocomposite: Kinetics, Isotherms, and Mechanism Study


 and
and 
Abstract
:1. Introduction
2. Materials and Methods
2.1. Materials
2.2. Measurements
2.3. Preparation of PANI@CTAB-Mt Adsorbent
2.4. Electrochemical Studies
2.5. Adsorption Tests
3. Results
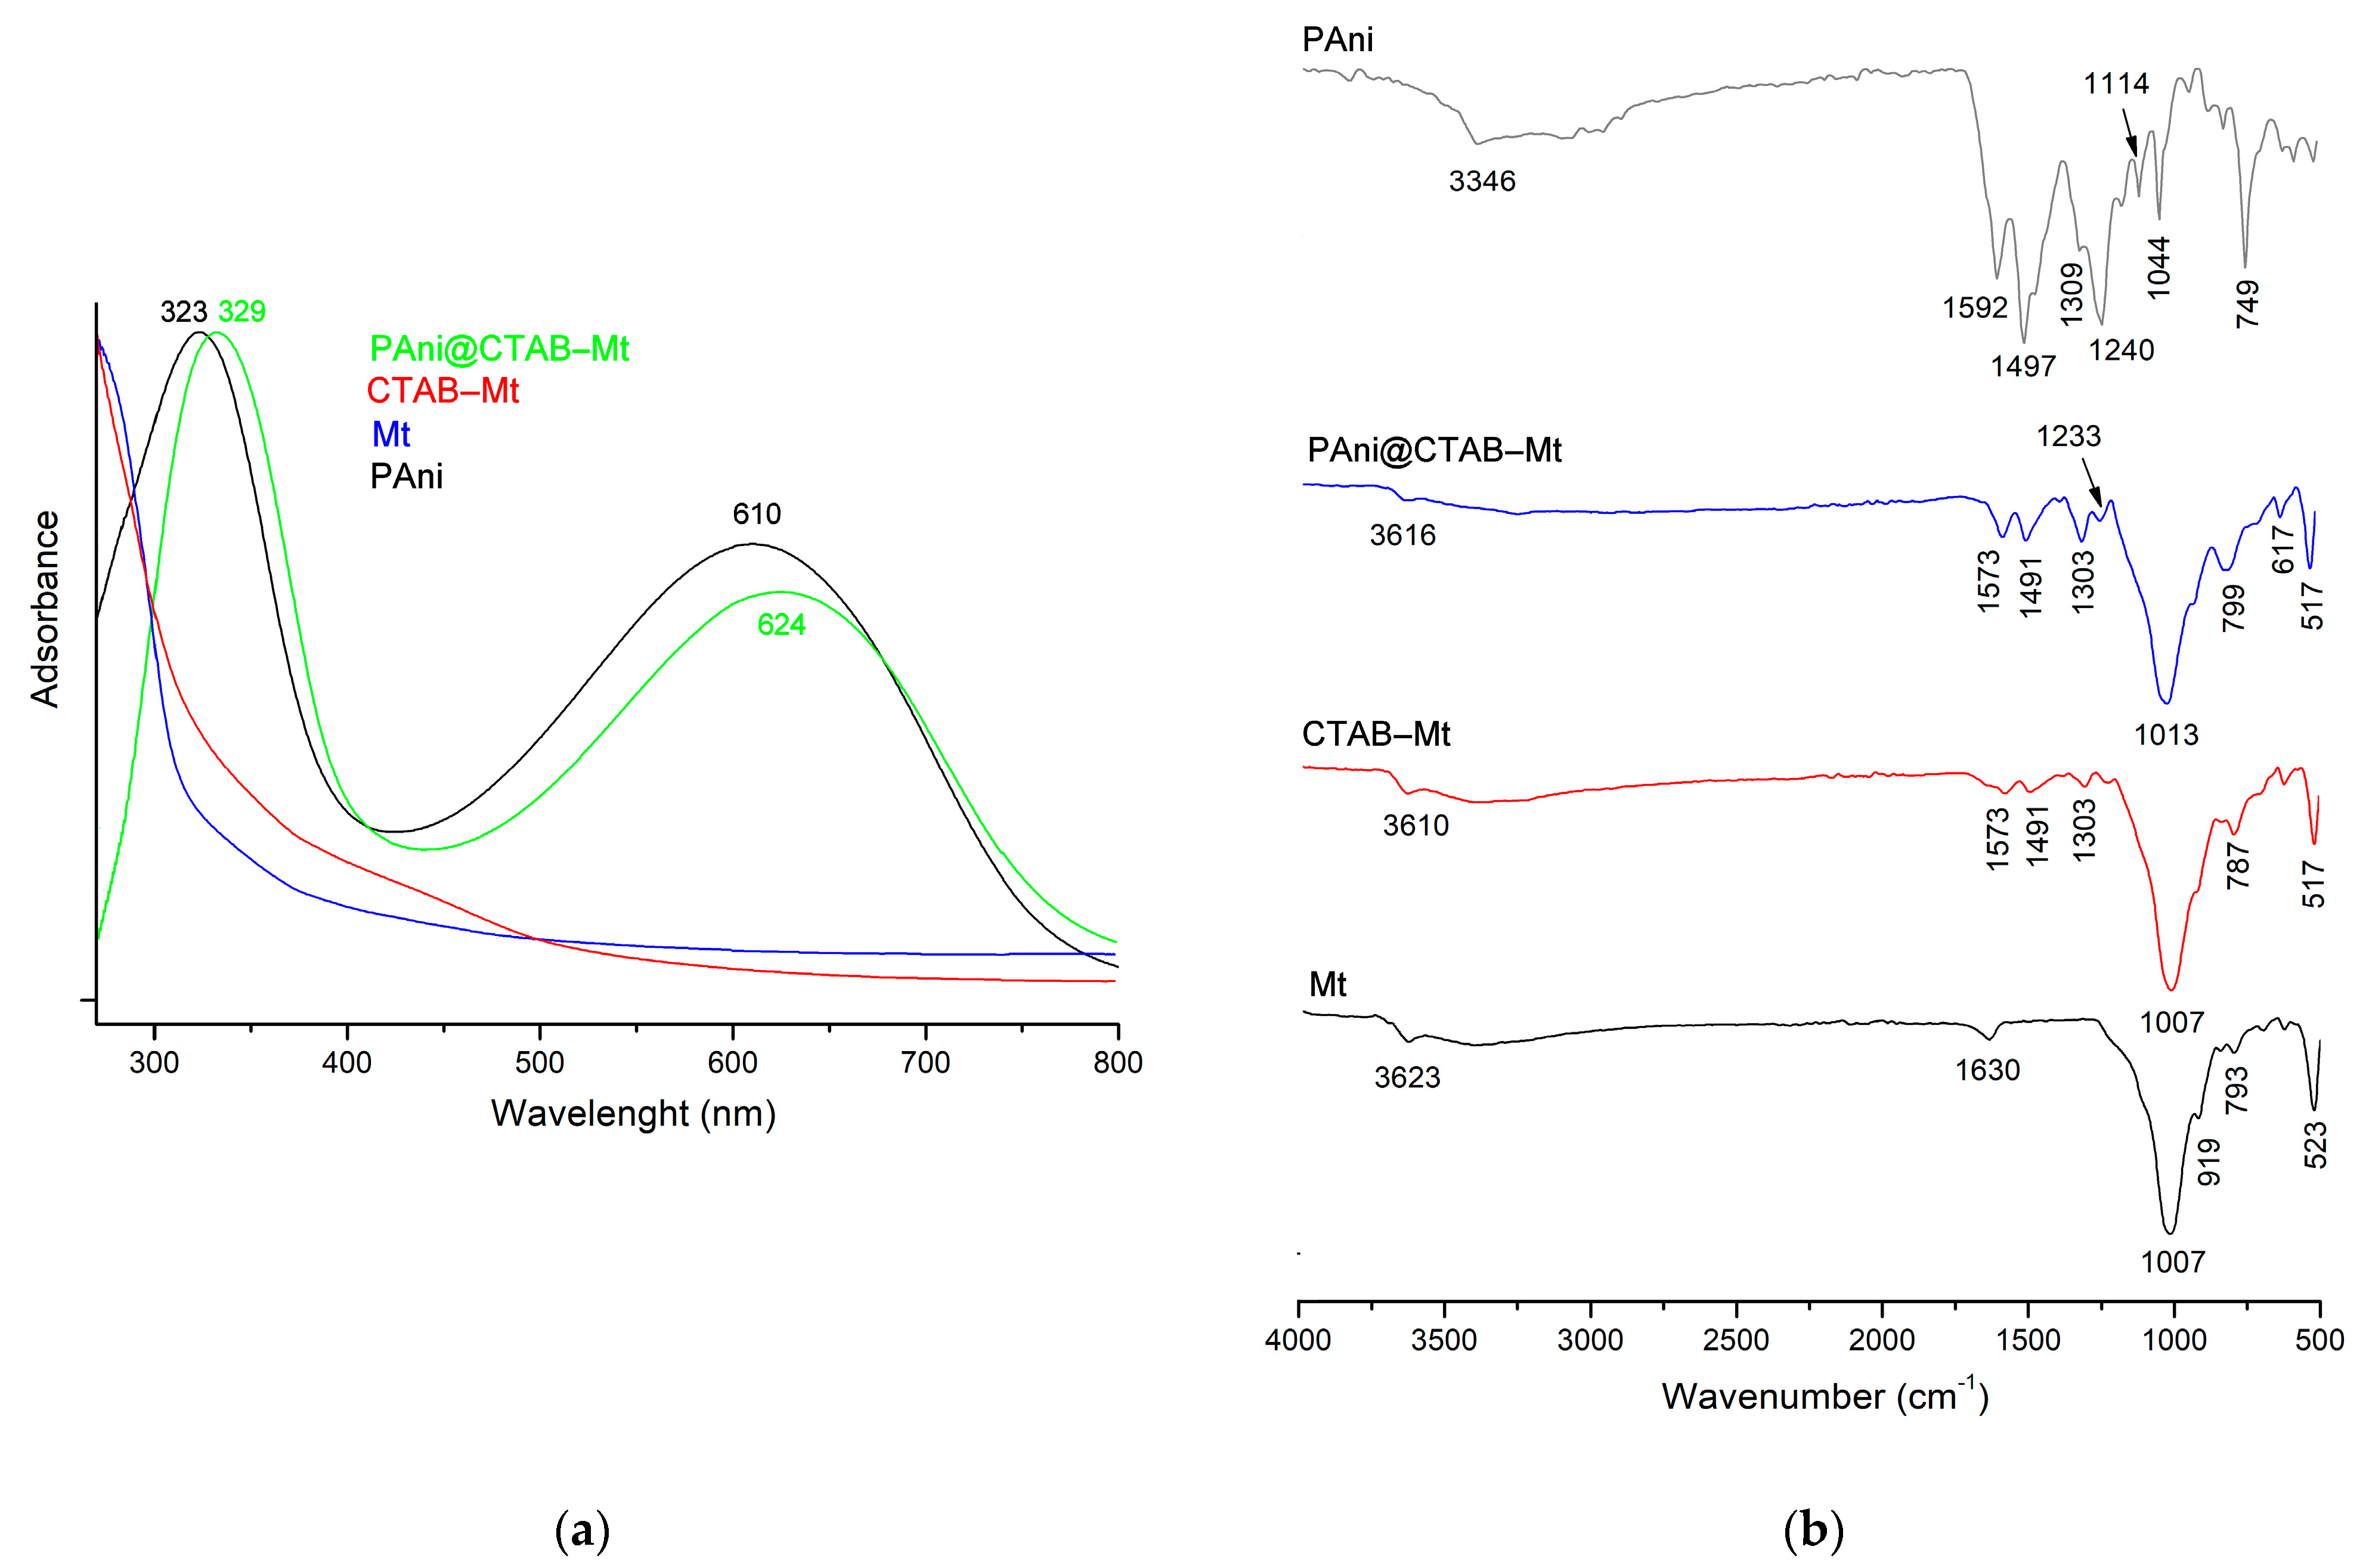
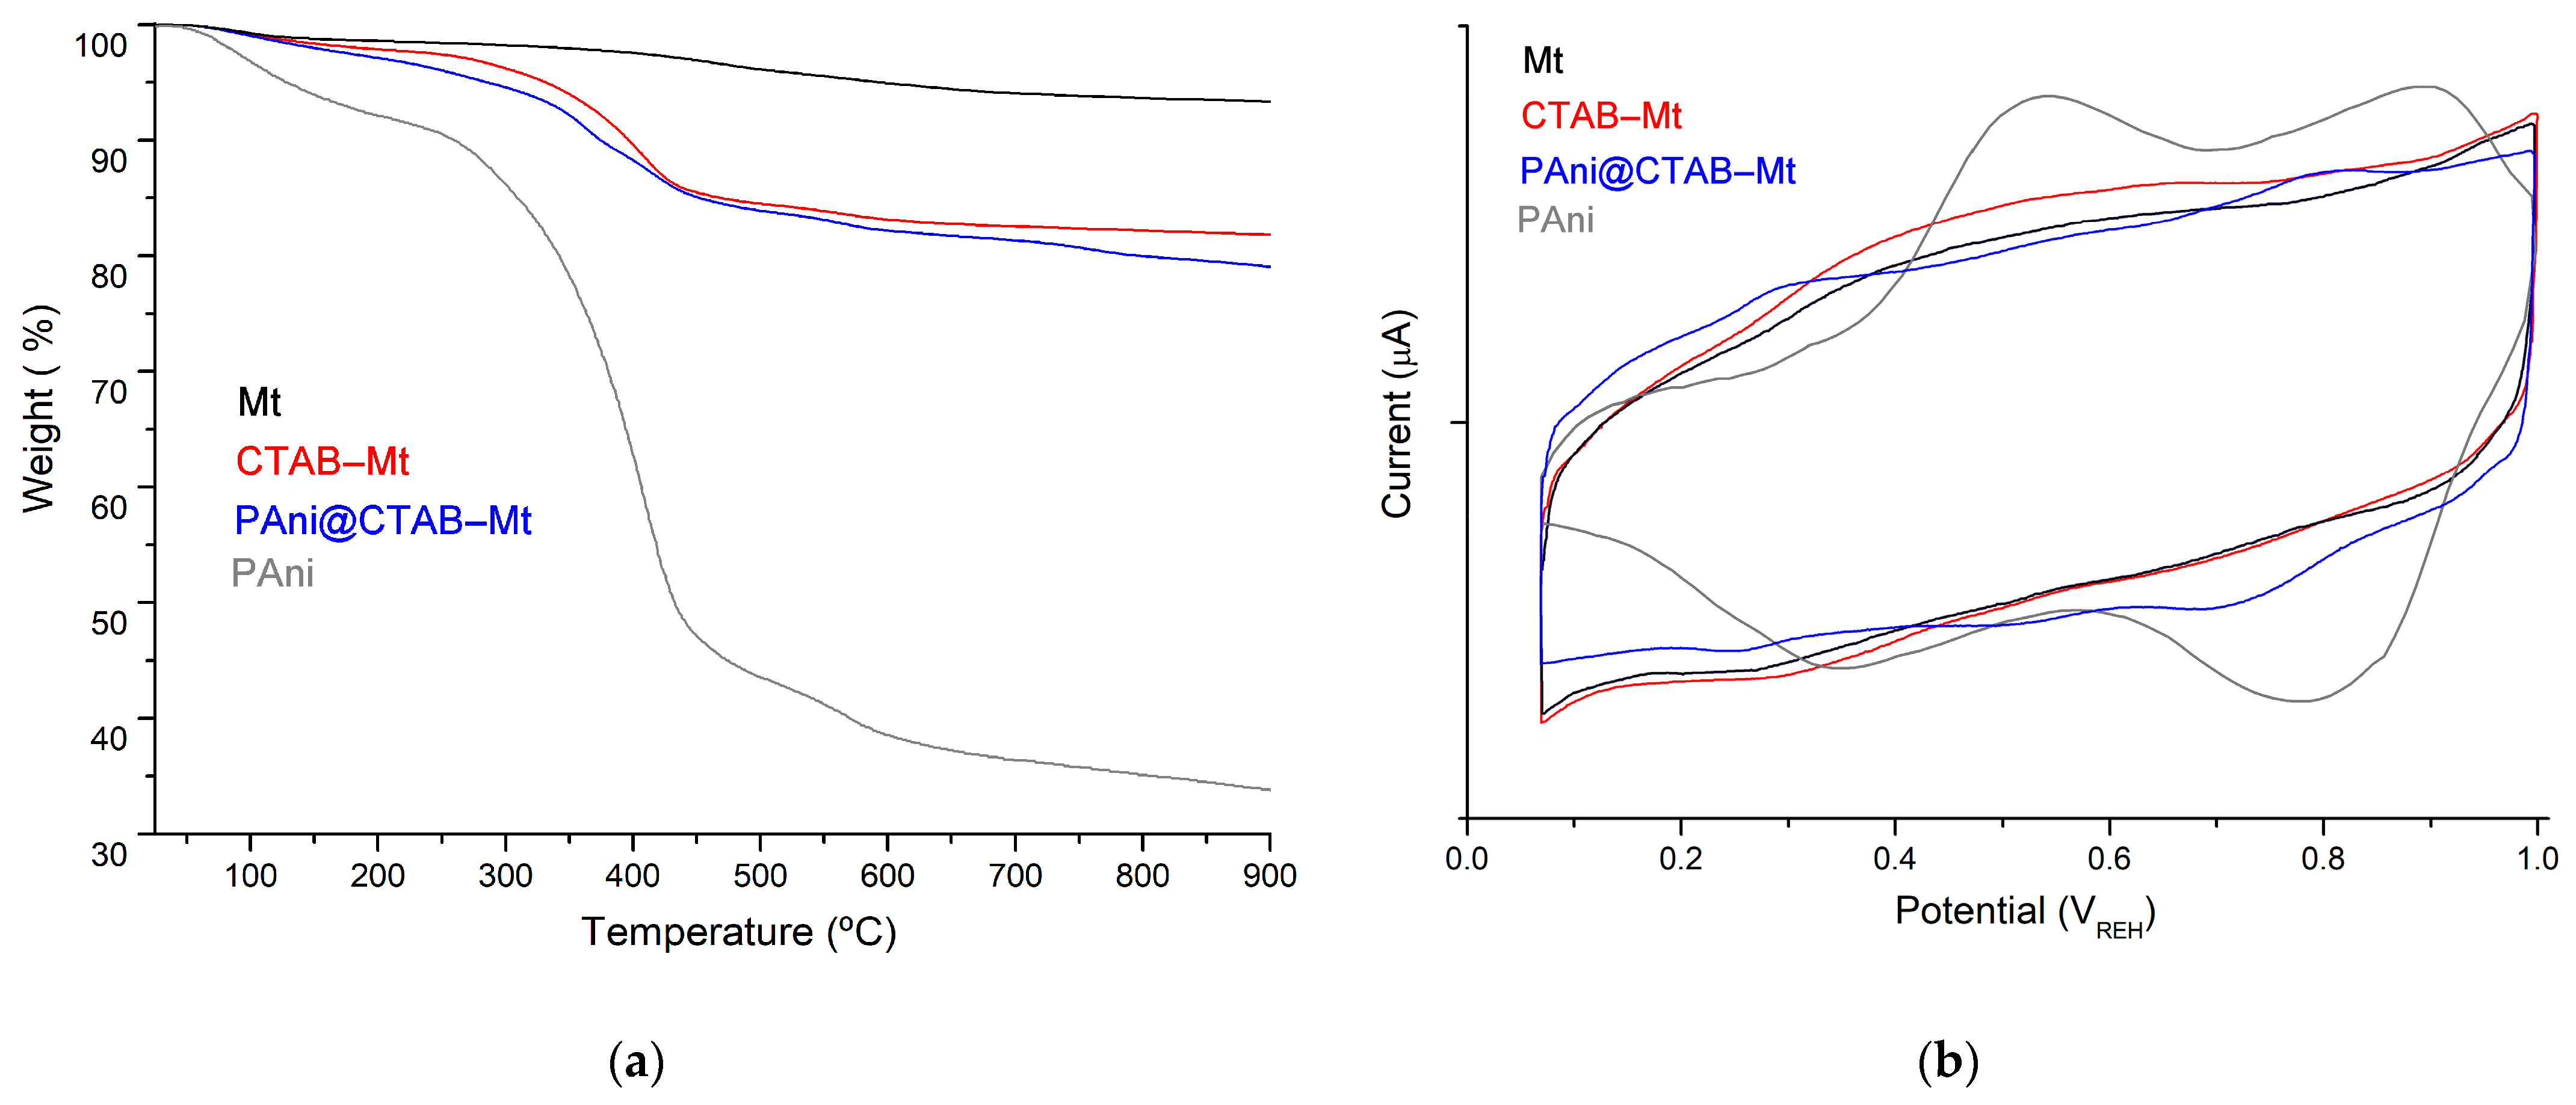
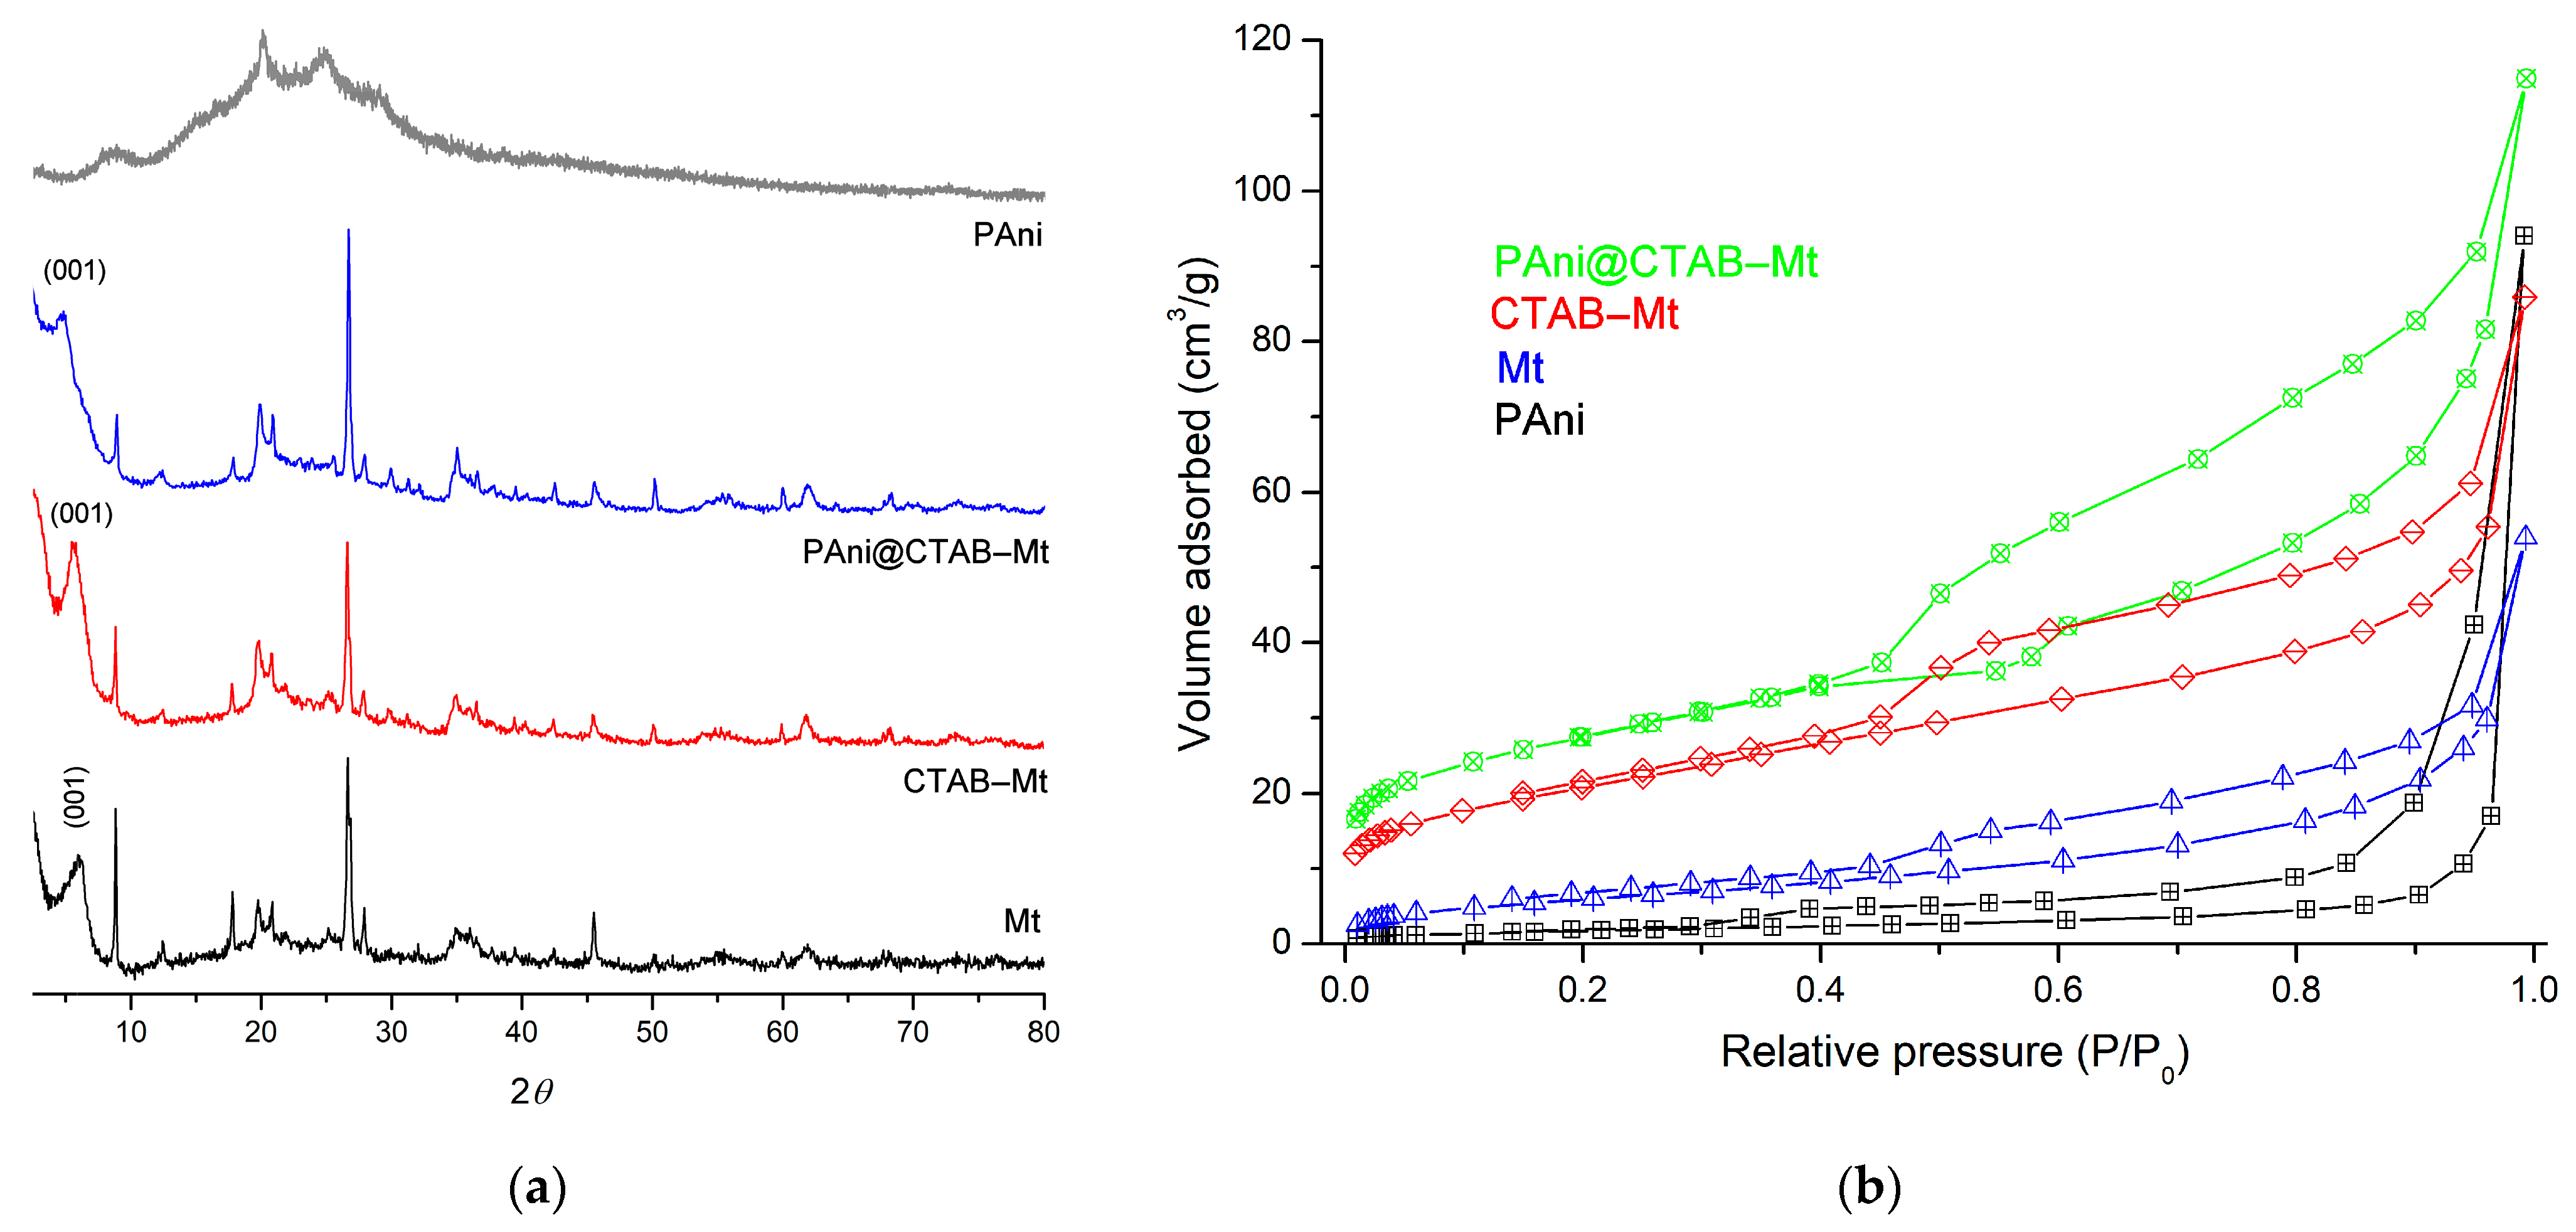
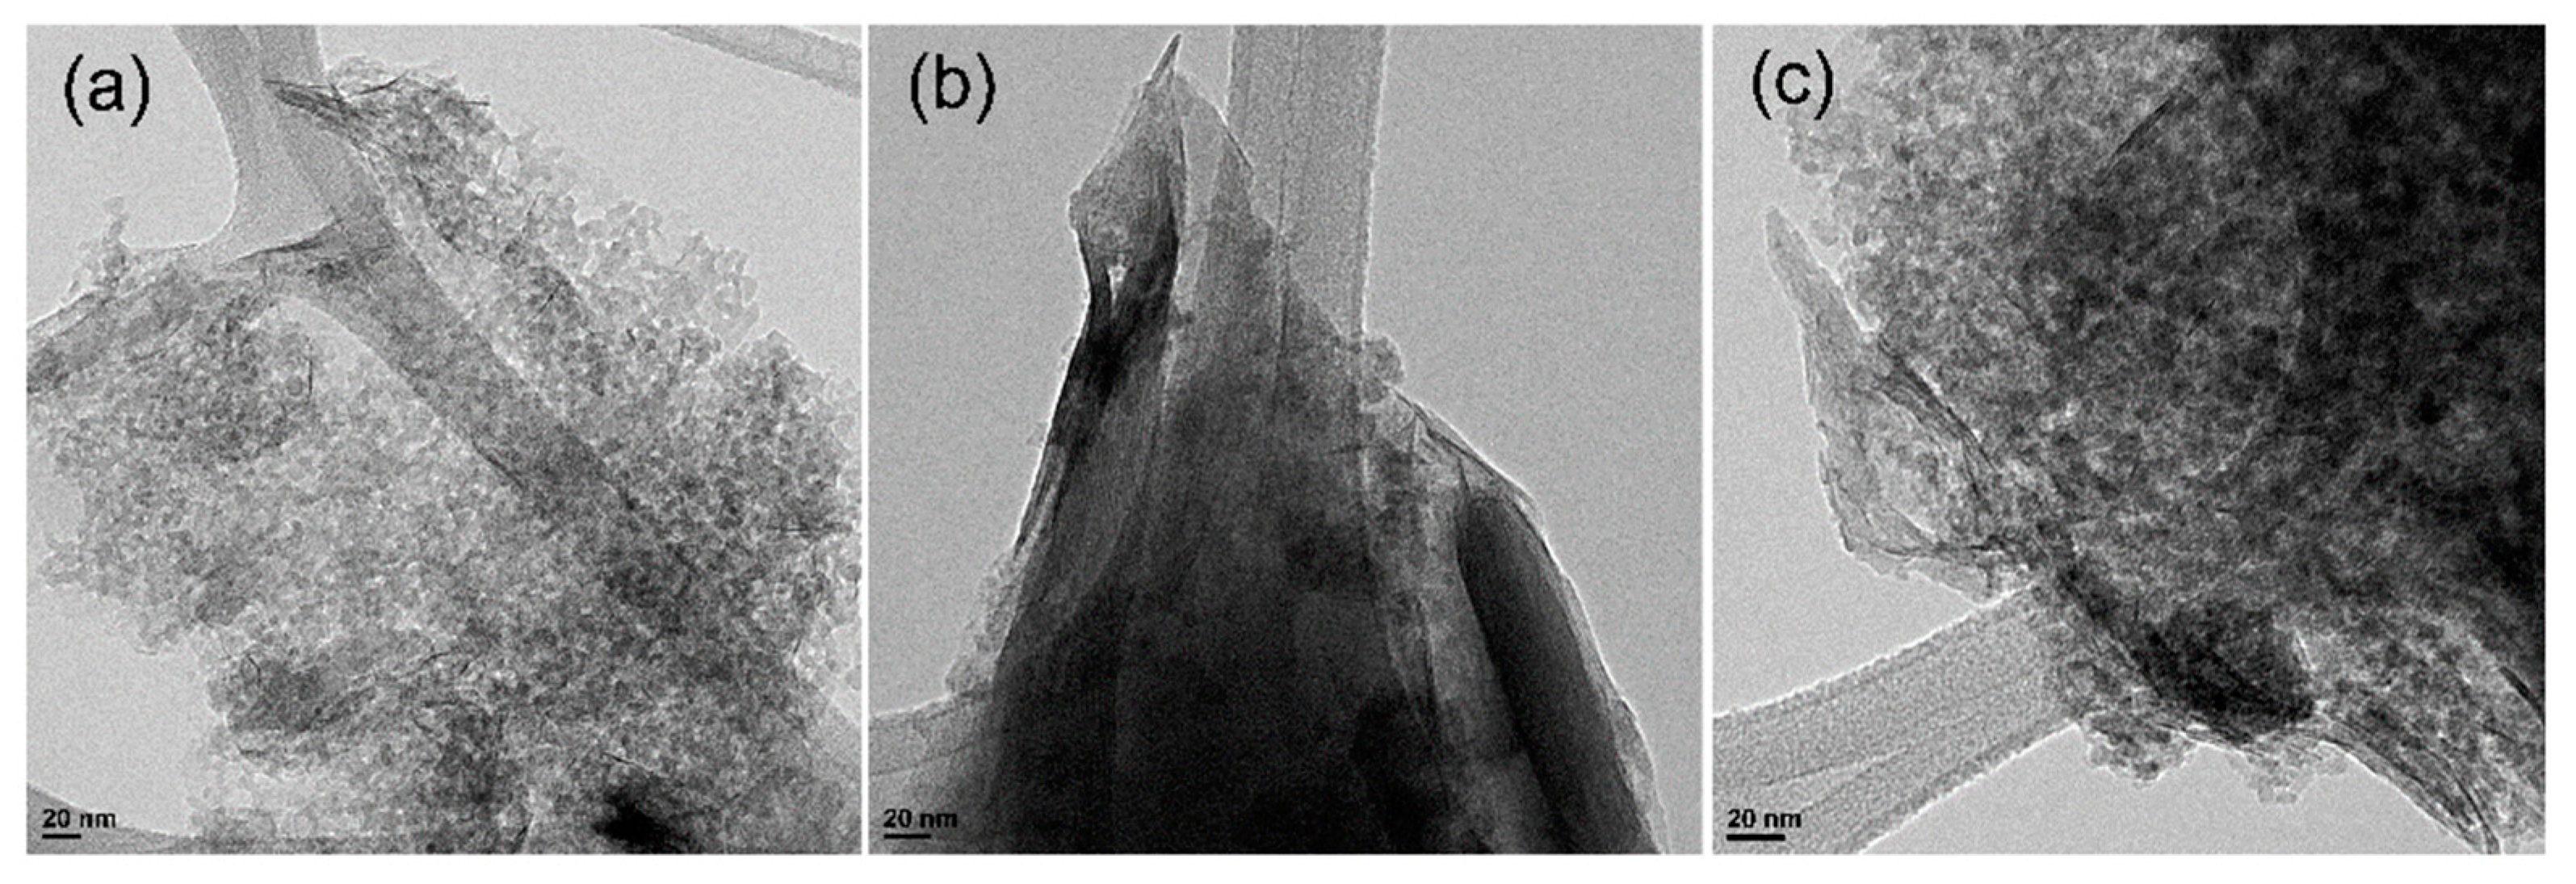
3.1. Physicochemical Characteristics of the Samples
3.2. Adsorption Study of MB on Adsorbents
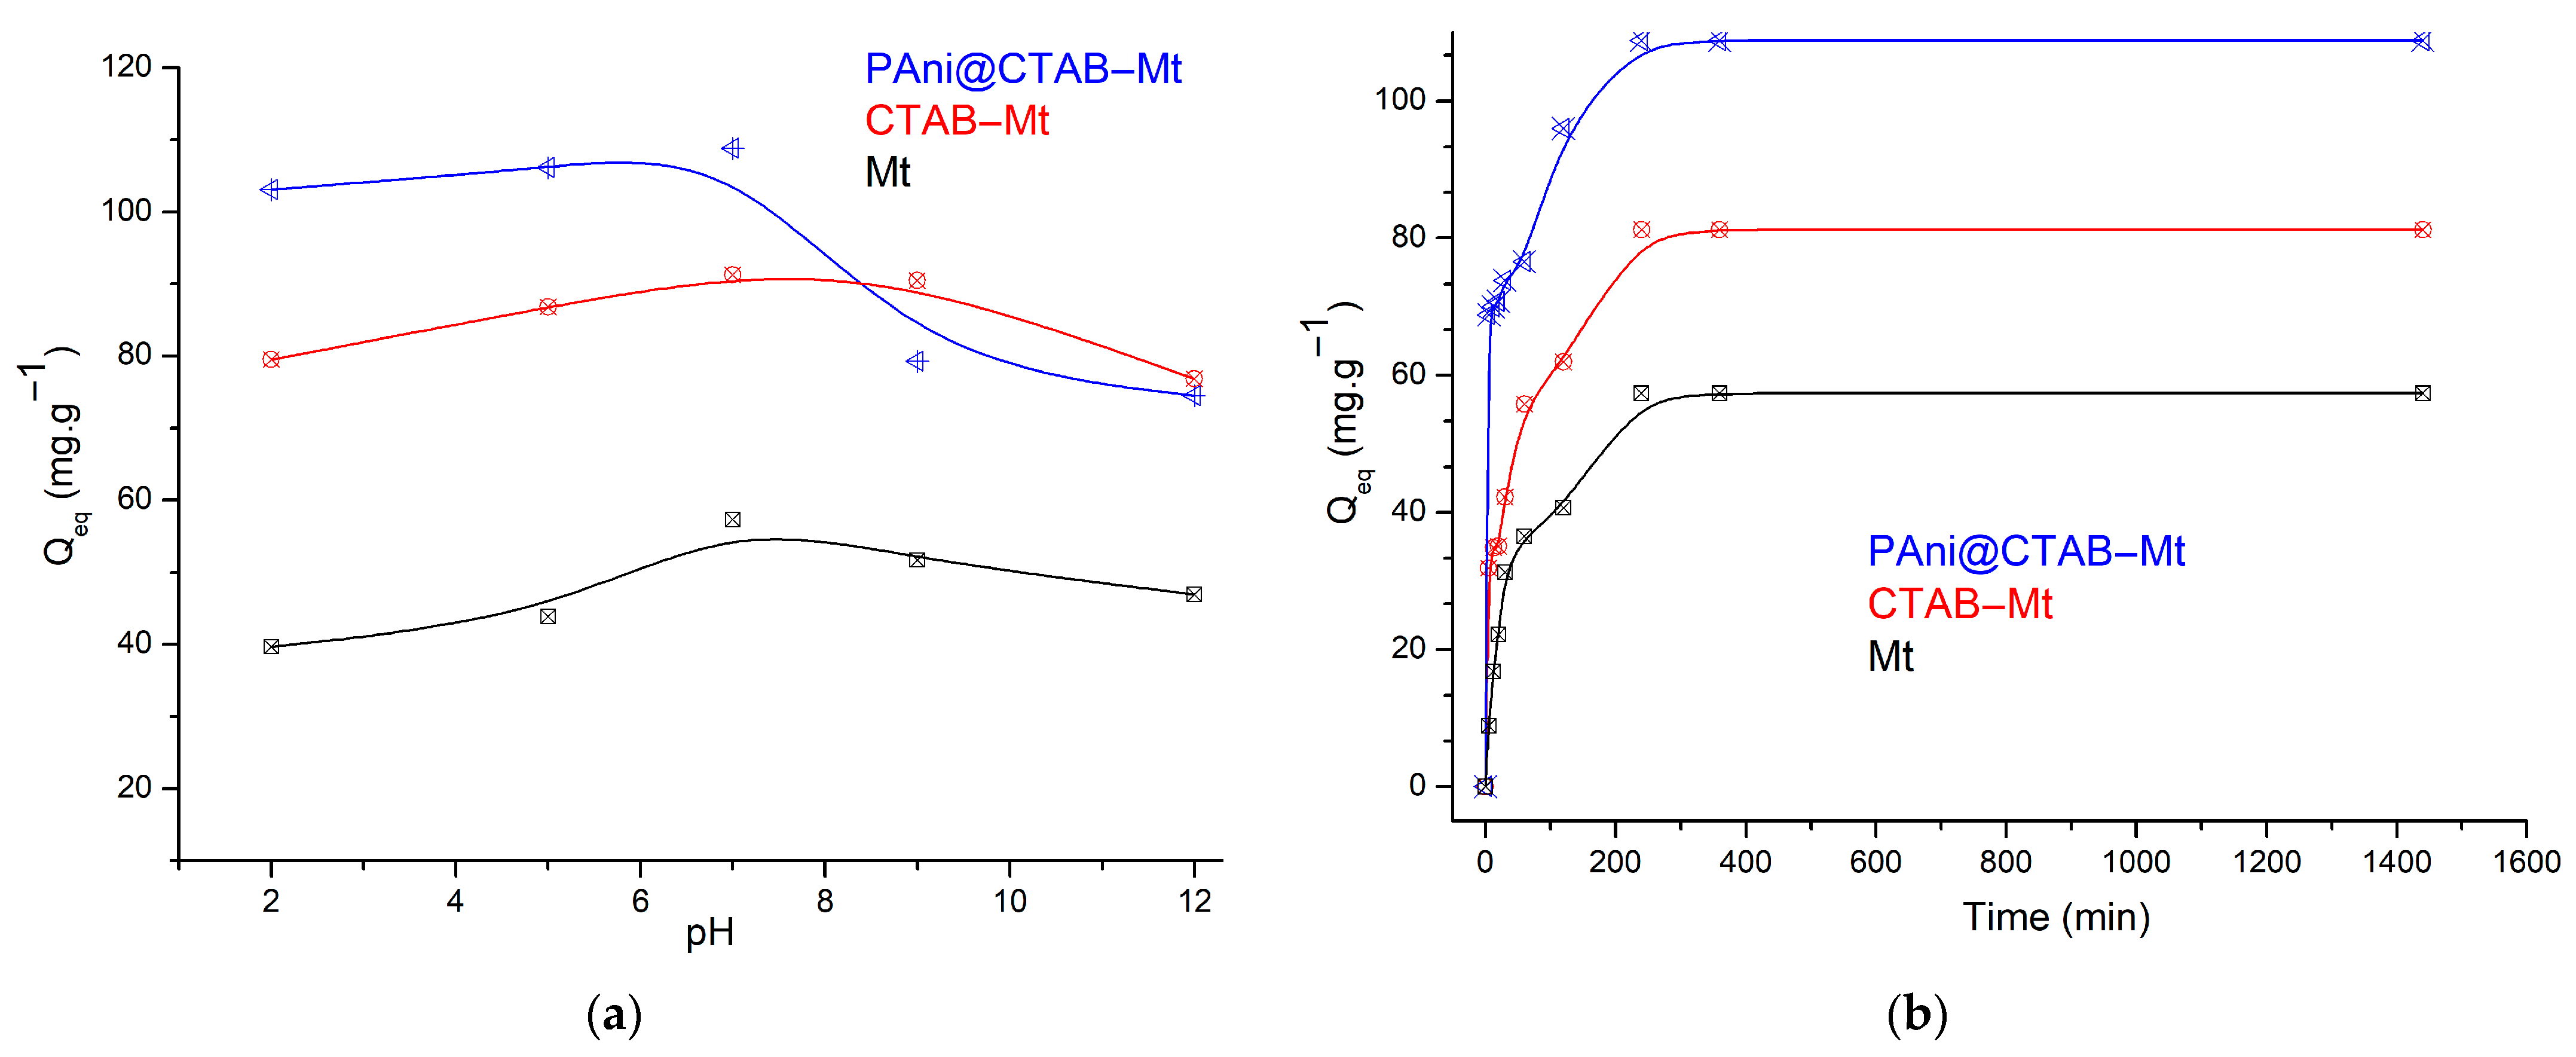
3.2.1. pH Effect on MB Adsorption
3.2.2. Contact Time and Kinetic Modeling
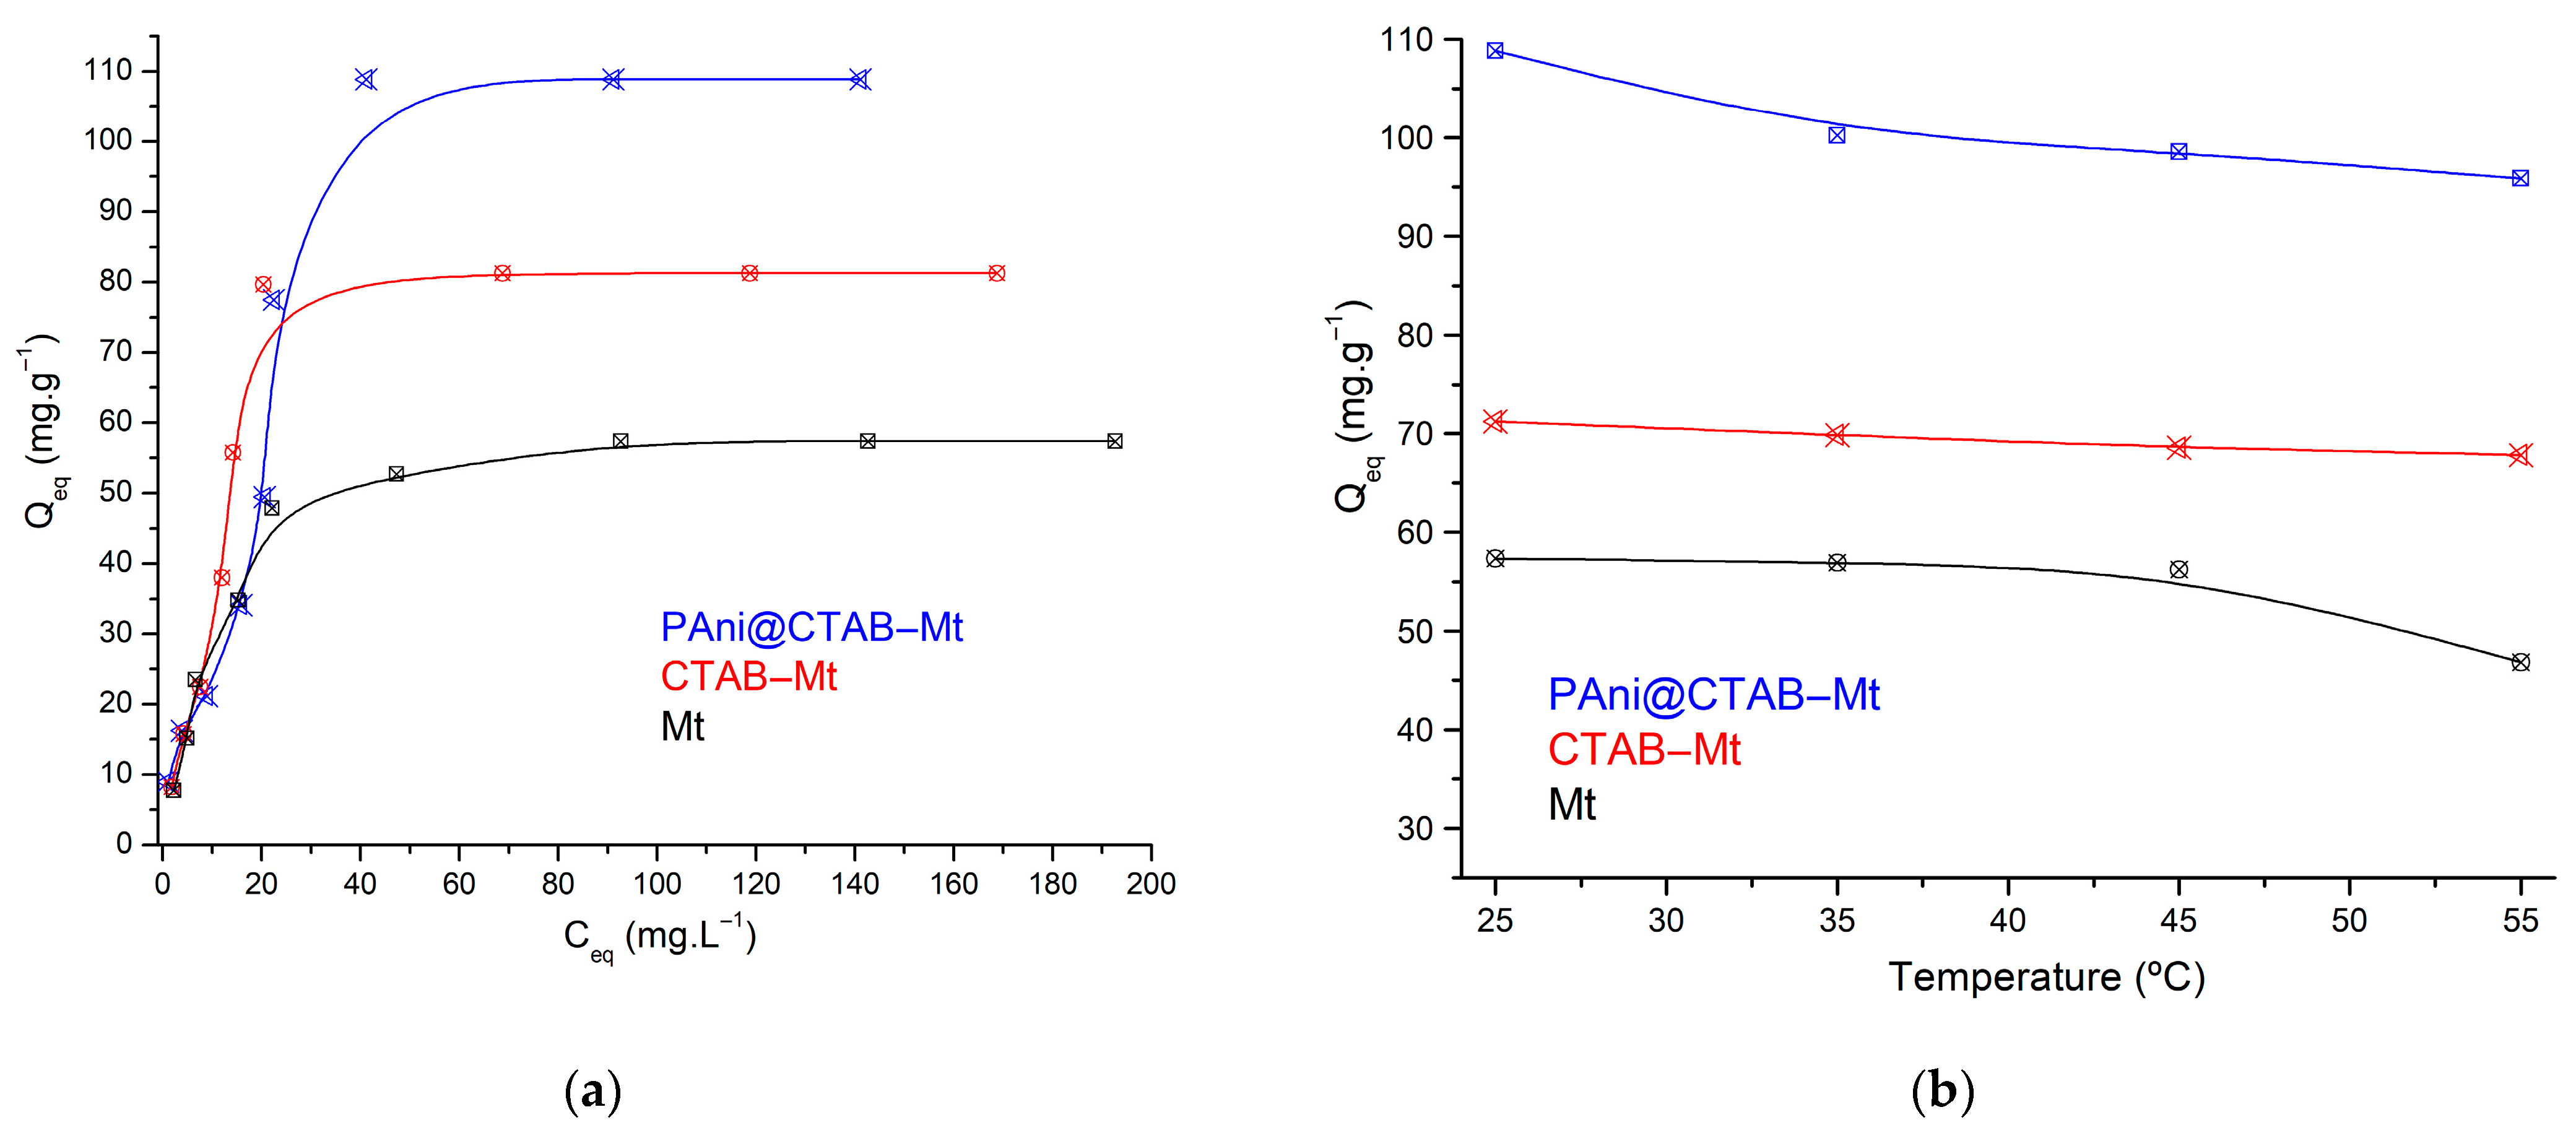
3.2.3. Initial Concentration Effect and Isotherm Modeling
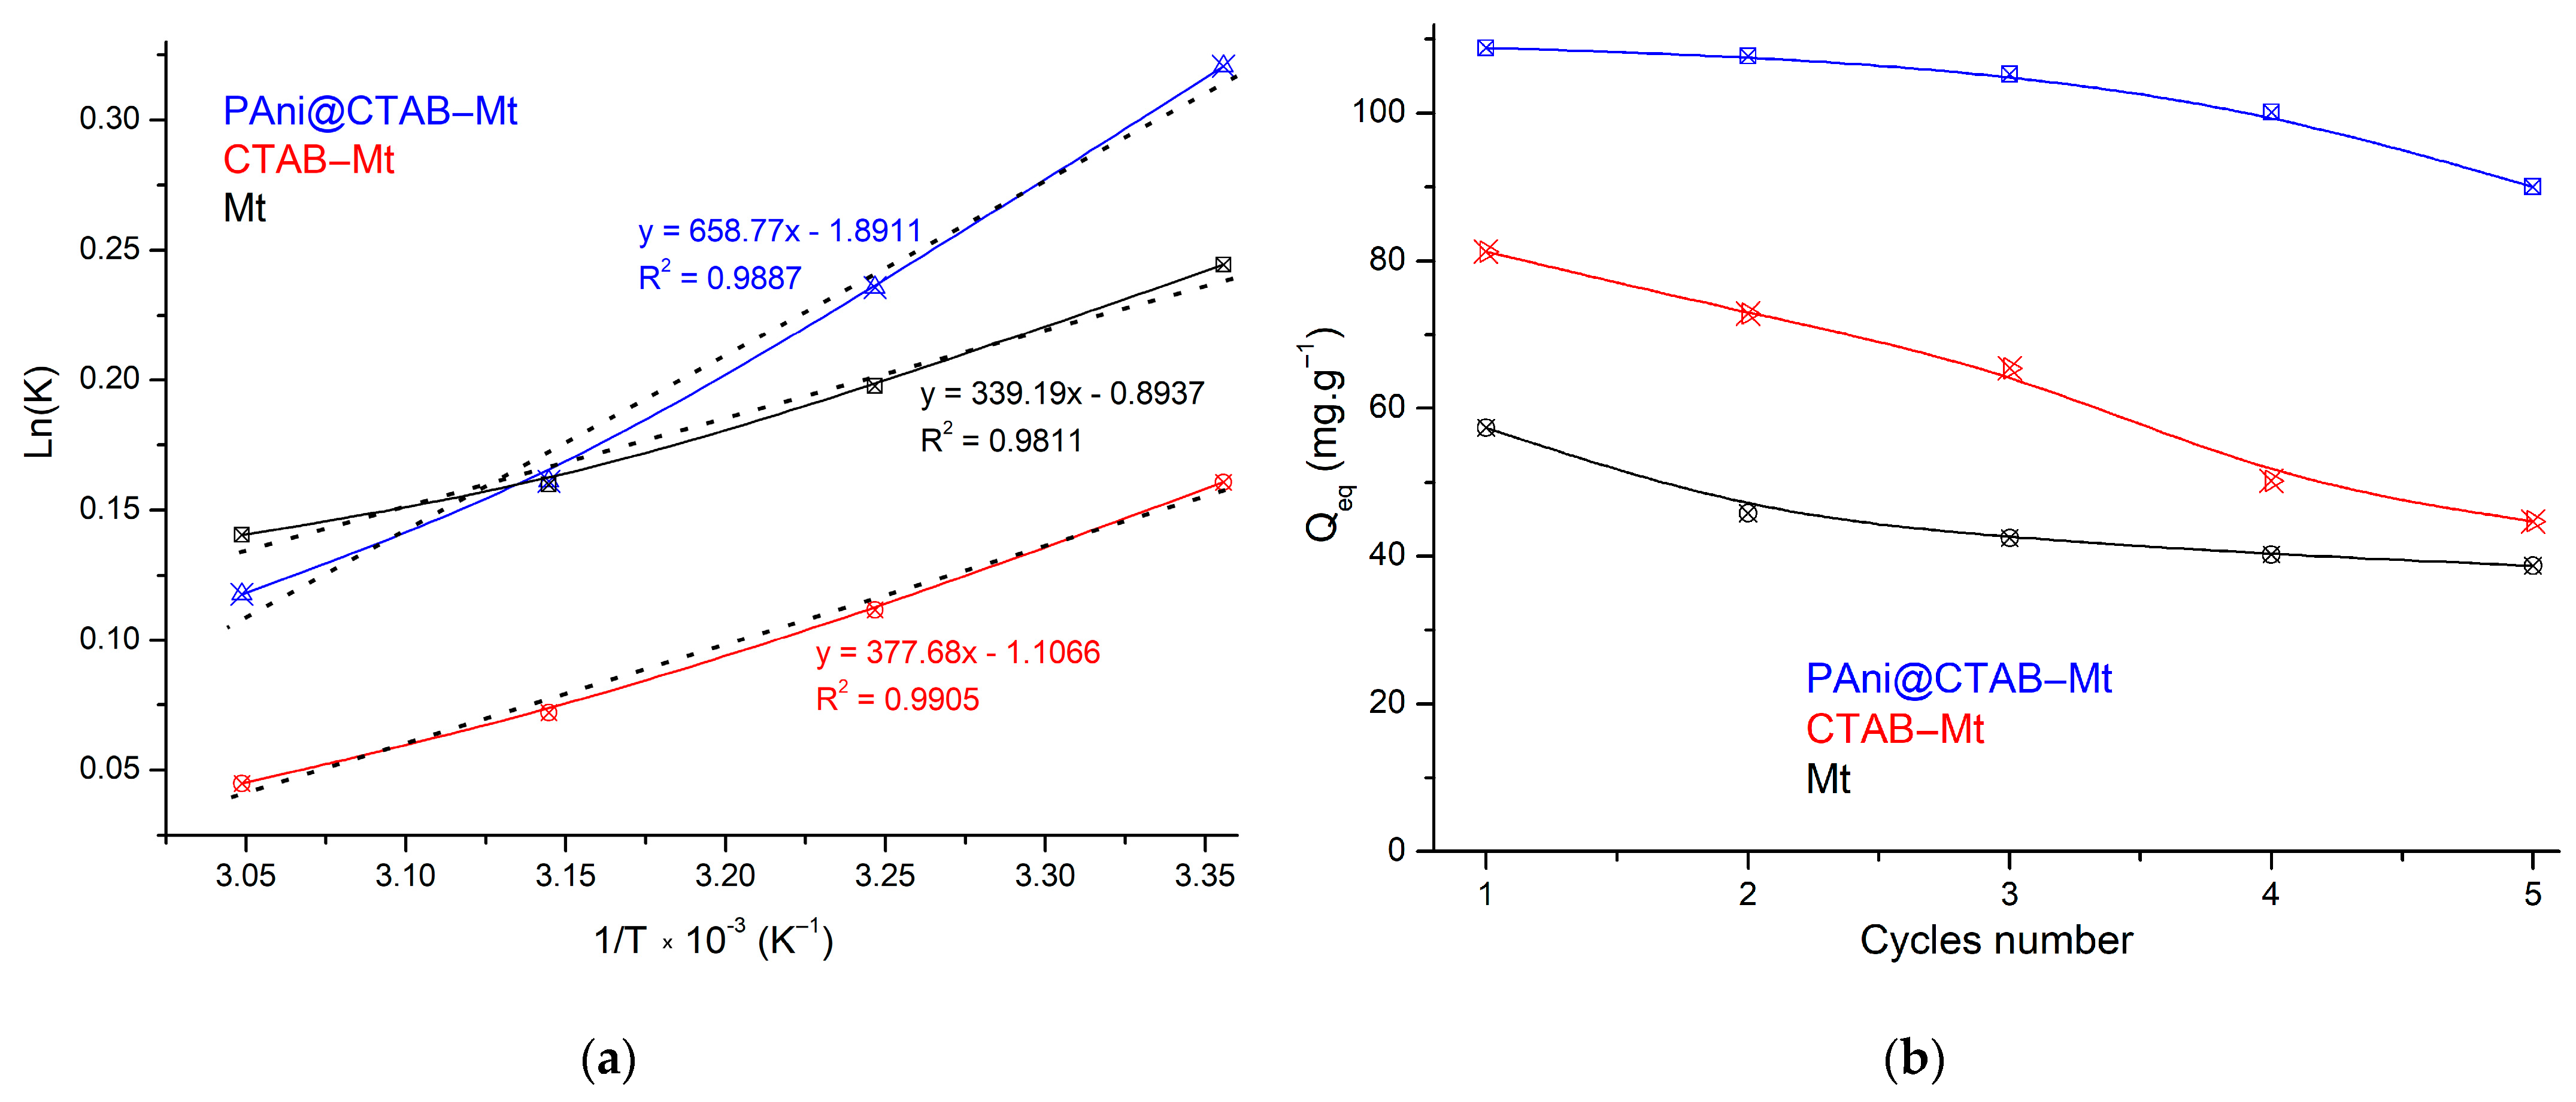
3.2.4. Adsorption Temperature and Thermodynamics
3.3. Recyclability of Adsorbents
4. Conclusions
Author Contributions
Funding
Institutional Review Board Statement
Data Availability Statement
Acknowledgments
Conflicts of Interest
References
- Gao, M.; Liu, G.; Gao, Y.; Chen, G.; Huang, X.; Xu, X.; Wang, J.; Yang, X.; Xu, D. Recent advances in metal-organic frameworks/membranes for adsorption and removal of metal ions. TrAC Trends Anal. Chem. 2021, 137, 116226. [Google Scholar] [CrossRef]
- Finke, E.J.; Beyer, W.; Loderstädt, U.; Frickmann, H. The risk of contracting anthrax from spore-contaminated soil—A military medical perspective. Eur. J. Microbiol. Immunol. 2020, 10, 29–63. [Google Scholar] [CrossRef]
- Zou, L.; Wang, H.; Jiang, X.; Yuan, G.; Wang, X. Enhanced photocatalytic efficiency in degrading organic dyes by coupling CdS nanowires with ZnFe2O4 nanoparticles. Sol. Energy 2020, 195, 271–277. [Google Scholar] [CrossRef]
- Kuang, Y.; Zhang, X.; Zhou, S. Adsorption of Methylene Blue in Water onto Activated Carbon by Surfactant Modification. Water 2020, 12, 587. [Google Scholar] [CrossRef]
- Elkady, M.F.; Hassan, H.S. Photocatalytic Degradation of Malachite Green Dye from Aqueous Solution Using Environmentally Compatible Ag/ZnO Polymeric Nanofibers. Polymers 2021, 13, 2033. [Google Scholar] [CrossRef] [PubMed]
- Nawaz, H.; Umar, M.; Nawaz, I.; Ullah, A.; Khawar, M.T.; Nikiel, M.; Razzaq, H.; Siddiq, M.; Liu, X. Hybrid PVDF/PANI Membrane for Removal of Dyes from Textile Wastewater. Adv. Energy Mater. 2022, 24, 2100719. [Google Scholar] [CrossRef]
- Bekhoukh, A.; Kiari, M.; Moulefera, I.; Sabantina, L.; Benyoucef, A. New Hybrid Adsorbents Based on Polyaniline and Polypyrrole with Silicon Dioxide: Synthesis, Characterization, Kinetics, Equilibrium, and Thermodynamic Studies for the Removal of 2,4-Dichlorophenol. Polymers 2023, 15, 2032. [Google Scholar] [CrossRef]
- Benchikh, I.; Dahou, F.Z.; Lahreche, S.; Sabantina, L.; Benmimoun, Y.; Benyoucef, A. Development and characterisation of novel hybrid materials of modified ZnO-SiO2 and polyaniline for adsorption of organic dyes. Int. J. Environ. Anal. Chem. 2022, 1–20. [Google Scholar] [CrossRef]
- Muhammad, A.; Shah, A.H.A.; Bilal, S.; Rahman, G. Basic Blue Dye Adsorption from Water Using Polyaniline/Magnetite (Fe3O4) Composites: Kinetic and Thermodynamic Aspects. Materials 2019, 12, 1764. [Google Scholar] [CrossRef] [PubMed]
- Daikh, S.; Ouis, D.; Benyoucef, A.; Mouffok, B. Equilibrium, kinetic and thermodynamic studies for evaluation of adsorption capacity of a new potential hybrid adsorbent based on polyaniline and chitosan for Acetaminophen. Chem. Phys. Lett. 2022, 798, 139565. [Google Scholar] [CrossRef]
- Salah, D.; Hamd, A.; Soliman, N.K.; Elzanaty, A.M.; Alanazi, A.M.; Shaban, M.; El-Sayed, R.; Ahmed, S.A. Polyaniline/Glauconite Nanocomposite Adsorbent for Congo Red Dye from Textile Wastewater. Separations 2022, 9, 384. [Google Scholar] [CrossRef]
- Boutaleb, N.; Chouli, F.; Benyoucef, A.; Zeggai, F.Z.; Bachari, K. A comparative study on surfactant cetyltrimethylammoniumbromide modified clay-based poly(p-anisidine) nanocomposites: Synthesis, characterization, optical and electrochemical properties. Polym. Compos. 2021, 42, 1648–1658. [Google Scholar] [CrossRef]
- Soltani, H.; Belmokhtar, A.; Zeggai, F.Z.; Benyoucef, A.; Bousalem, S.; Bachari, K. Copper(II) Removal from Aqueous Solutions by PANI-Clay Hybrid Material: Fabrication, Characterization, Adsorption and Kinetics Study. J. Inorg. Organomet. Polym. Mater. 2019, 29, 841–850. [Google Scholar] [CrossRef]
- Bensedira, A.; Haddaoui, N.; Doufnoune, R.; Ouahiba Meziane, O.; Labidi, N.S. Study of methylene blue dye elimination from water using polyaniline (PANI) and PANI/SiO2 composite. Polym. Polym. Compos. 2023, 30, 09673911221141747. [Google Scholar] [CrossRef]
- Amari, A.; Alzahrani, F.M.; Katubi, K.M.; Alsaiari, N.S.; Tahoon, M.A.; Rebah, F.B. Clay-Polymer Nanocomposites: Preparations and Utilization for Pollutants Removal. Materials 2021, 14, 1365. [Google Scholar] [CrossRef] [PubMed]
- Açıkyıldız, M.; Gürses, A.; Güneş, K.; Şahin, E. Adsorption of textile dyes from aqueous solutions onto clay: Kinetic modelling and equilibrium isotherm analysis. Front. Chem. 2023, 11, 56457. [Google Scholar] [CrossRef] [PubMed]
- Cunha, R.V.; Morais, A.I.S.; Trigueiro, P.; de Souza, J.S.N.; Damacena, D.H.L.; Lima, L.C.B.; Bezerra, R.D.S.; Fonseca, M.G.; Filho, E.C.S.; Osajima, J.A. Organic–Inorganic Hybrid Pigments Based on Bentonite: Strategies to Stabilize the Quinoidal Base Form of Anthocyanin. Int. J. Mol. Sci. 2023, 24, 2417. [Google Scholar] [CrossRef] [PubMed]
- Kim, E. Effects of binary doping on chiroptical, electrochemical, and morphological properties of chiral polyaniline. J. Korean Chem. Soc. 2015, 59, 423–428. [Google Scholar] [CrossRef]
- Zare, E.N.; Motahari, A.; Sillanpää, M. Nanoadsorbents based on conducting polymer nanocomposites with main focus on polyaniline and its derivatives for removal of heavy metal ions/dyes: A review. Environ. Res. 2018, 162, 173–195. [Google Scholar] [CrossRef] [PubMed]
- Tan, J.; Song, Y.; Huang, X.; Zhou, L. Facile Functionalization of Natural Peach Gum Polysaccharide with Multiple Amine Groups for Highly Efficient Removal of Toxic Hexavalent Chromium (Cr(VI)) Ions from Water. ACS Omega 2018, 3, 17309–17318. [Google Scholar] [CrossRef]
- Charmas, B.; Zięzio, M.; Jedynak, K. Assessment of the Porous Structure and Surface Chemistry of Activated Biocarbons Used for Methylene Blue Adsorption. Molecules 2023, 28, 4922. [Google Scholar] [CrossRef]
- Lyu, W.; Li, J.; Trchová, M.; Wang, G.; Liao, Y.; Bober, P.; Stejskal, J. Fabrication of polyaniline/poly(vinyl alcohol)/montmorillonite hybrid aerogels toward efficient adsorption of organic dye pollutants. J. Hazard. Mater. 2022, 435, 129004. [Google Scholar] [CrossRef] [PubMed]
- Somsesta, N.; Sricharoenchaikul, V.; Aht-Ong, D. Adsorption Removal of Methylene Blue onto Activated Carbon/Cellulose Biocomposite Films: Equilibrium and Kinetic Studies. Mater. Chem. Phys. 2020, 240, 122221. [Google Scholar] [CrossRef]
- Hajati, S.; Ghaedi, M.; Barazesh, B.; Karimi, F.; Sahraei, R.; Daneshfar, A.; Asghari, A. Application of high order derivative spectrophotometry to resolve the spectra overlap between BG and MB for the simultaneous determination of them: Ruthenium nanoparticle loaded activated carbon as adsorbent. J. Ind. Eng. Chem. 2014, 20, 2421–2427. [Google Scholar] [CrossRef]
- Li, G.; Zhu, W.; Zhang, C.; Zhang, S.; Liu, L.; Zhu, L.; Zhao, W. Effect of a magnetic field on the adsorptive removal of methylene blue onto wheat straw biochar. Bioresour. Technol. 2016, 206, 16–22. [Google Scholar] [CrossRef] [PubMed]
- Youcef, L.D.; Belaroui, L.S.; Galindo, A.L. Adsorption of a cationic methylene blue dye on an Algerian palygorskite. Appl. Clay Sci. 2019, 179, 105145. [Google Scholar] [CrossRef]
- Pei, Y.; Wu, X.; Xu, G.; Sun, Z.; Zheng, X.; Liu, J.; Tang, K. Tannin-immobilized cellulose microspheres as effective adsorbents for removing cationic dye (Methylene Blue) from aqueous solution. J. Chem. Technol. Biotechnol. 2017, 92, 1276–1284. [Google Scholar] [CrossRef]
- Mechi, N.; Khemis, I.B.; Dotto, G.L.; Franco, D.; Sellaoui, L.; Lamine, A.B. Investigation of the adsorption mechanism of methylene blue (MB) on Cortaderia selloana flower spikes (FSs) and on Cortaderia selloana flower spikes derived carbon fibers (CFs). J. Mol. Liq. 2019, 280, 268–273. [Google Scholar] [CrossRef]
- Khan, M.I. Adsorption of methylene blue onto natural Saudi Red Clay: Isotherms, kinetics and thermodynamic studies. Mater. Res. Express 2020, 7, 055507. [Google Scholar] [CrossRef]
- Hajjaji, W.; Andrejkovičová, A.; Pullar, R.C.; Tobaldi, D.M. Effective removal of anionic and cationic by kaolinite and TiO2/kaolinite composite. Clay Miner. 2016, 51, 19–27. [Google Scholar] [CrossRef]
- Alkayal, N.S.; Elsilk, S.E.; Elsherbiny, A.S.; Salahuddin, N.A. Fashionable epoxy/clay nanocomposites using modified clay-loaded methyl blue dye. Environ. Sci. Eur. 2023, 35, 45. [Google Scholar] [CrossRef]
- Ettahiri, Y.; Bouna, L.; Hanna, J.V.; Benlhachemi, A.; Pilsworth, H.L.; Bouddouch, A.; Bakiz, B. Pyrophyllite clay-derived porous geopolymers for removal of methylene blue from aqueous solutions. Mater. Chem. Phys. 2023, 296, 127281. [Google Scholar] [CrossRef]
- Fierro, X.J.; Gaona, S.; Ramón, J.; Valarezo, E. Porous Geopolymer/ZnTiO3/TiO2 Composite for Adsorption and Photocatalytic Degradation of Methylene Blue Dye. Polymers 2023, 15, 2697. [Google Scholar] [CrossRef] [PubMed]
- da Silva, E.O.; dos Santos, V.D.; de Araujo, E.B.; Guterres, F.P.; Zottis, R.; Flores, W.H.; de Almeida, A.R.F. Removal of methylene blue from aqueous solution by ryegrass straw. Int. J. Environ. Sci. Technol. 2020, 17, 3723–3740. [Google Scholar] [CrossRef]
- da Silva, E.O.; dos Santos, V.D.; de Araujo, E.B.; Andrade, T.D.; dos Santos, M.C.; Zottis, R.; da Rosa, G.S.; de Almeida, A.R.F. Application of Lolium multiflorum as an Efficient Raw Material in the Production of Adsorbent for Removal of Methylene Blue. C-J. Carbon Res. 2023, 9, 44. [Google Scholar] [CrossRef]
- Sajab, M.S.; Chia, C.H.; Zakaria, S.; Jani, S.M.; Ayob, M.K.; Chee, K.L.; Khiew, P.S.; Chiu, W.S. Citric acid modified kenaf core fibres for removal of methylene blue from aqueous solution. Bioresour. Technol. 2011, 102, 7237–7243. [Google Scholar] [CrossRef]
- Amode, J.O.; Santos, J.H.; Alam, Z.M.; Mirza, A.H.; Mei, C.C. Adsorption of methylene blue from aqueous solution using untreated and treated (Metroxylon spp.) waste adsorbent: Equilibrium and kinetics studies. Int. J. Ind. Chem. 2016, 7, 333–345. [Google Scholar] [CrossRef]
- Lata, H.; Garg, V.K.; Gupta, R.K. Removal of a basic dye from aqueous solution by adsorption using Parthenium hysterophorus: An agricultural waste. Dye. Pigment. 2007, 74, 653–658. [Google Scholar] [CrossRef]
- Ertugay, N.; Malkoc, E. Adsorption Isotherm, Kinetic, and Thermodynamic Studies for Methylene Blue from Aqueous Solution by Needles of Pinus Sylvestris L. Pol. J. Environ. Stud. 2014, 23, 1995–2006. [Google Scholar]
- Toumi, I.; Djelad, H.; Chouli, F.; Benyoucef, A. Synthesis of Hybrid Material and Evaluations in Adsorption of Congo Red and Methylene Blue Dyes: Structural Characterization and Adsorption Performance. J. Inorg. Organomet. Polym. Mater. 2022, 32, 112–121. [Google Scholar] [CrossRef]


| Weight wt % | SiO2 | Al2O3 | Fe2O3 | MgO | Na2O | K2O | TiO2 | OMC * |
|---|---|---|---|---|---|---|---|---|
| Mt | 62.61 | 31.52 | 1.87 | 2.03 | 0.82 | 0.94 | 0.20 | 0.01 |
| CTAB-Mt | 56.84 | 25.12 | 2.13 | 1.89 | 1.98 | 1.07 | 0.17 | 10.80 |
| PANI@CTAB-Mt | 54.47 | 24.79 | 2.21 | 1.94 | 1.56 | 0.88 | 0.09 | 14.06 |
| Materials | PANI | Mt | CTAB-Mt | PANI@CTAB-Mt |
|---|---|---|---|---|
| SBET/m2·g−1 | 31 | 91 | 73 | 121 |
| VDR (N2)/cm3·g−1 | 1.11 | 0.92 | 1.37 | 1.24 |
| Vmes/cm3·g−1 | 0.01 | 0.01 | 0.09 | 0.08 |
| Vmic/cm3·g−1 | 0.01 | 0.02 | 0.15 | 0.13 |
| Vtot pore | 0.02 | 0.03 | 0.24 | 0.21 |
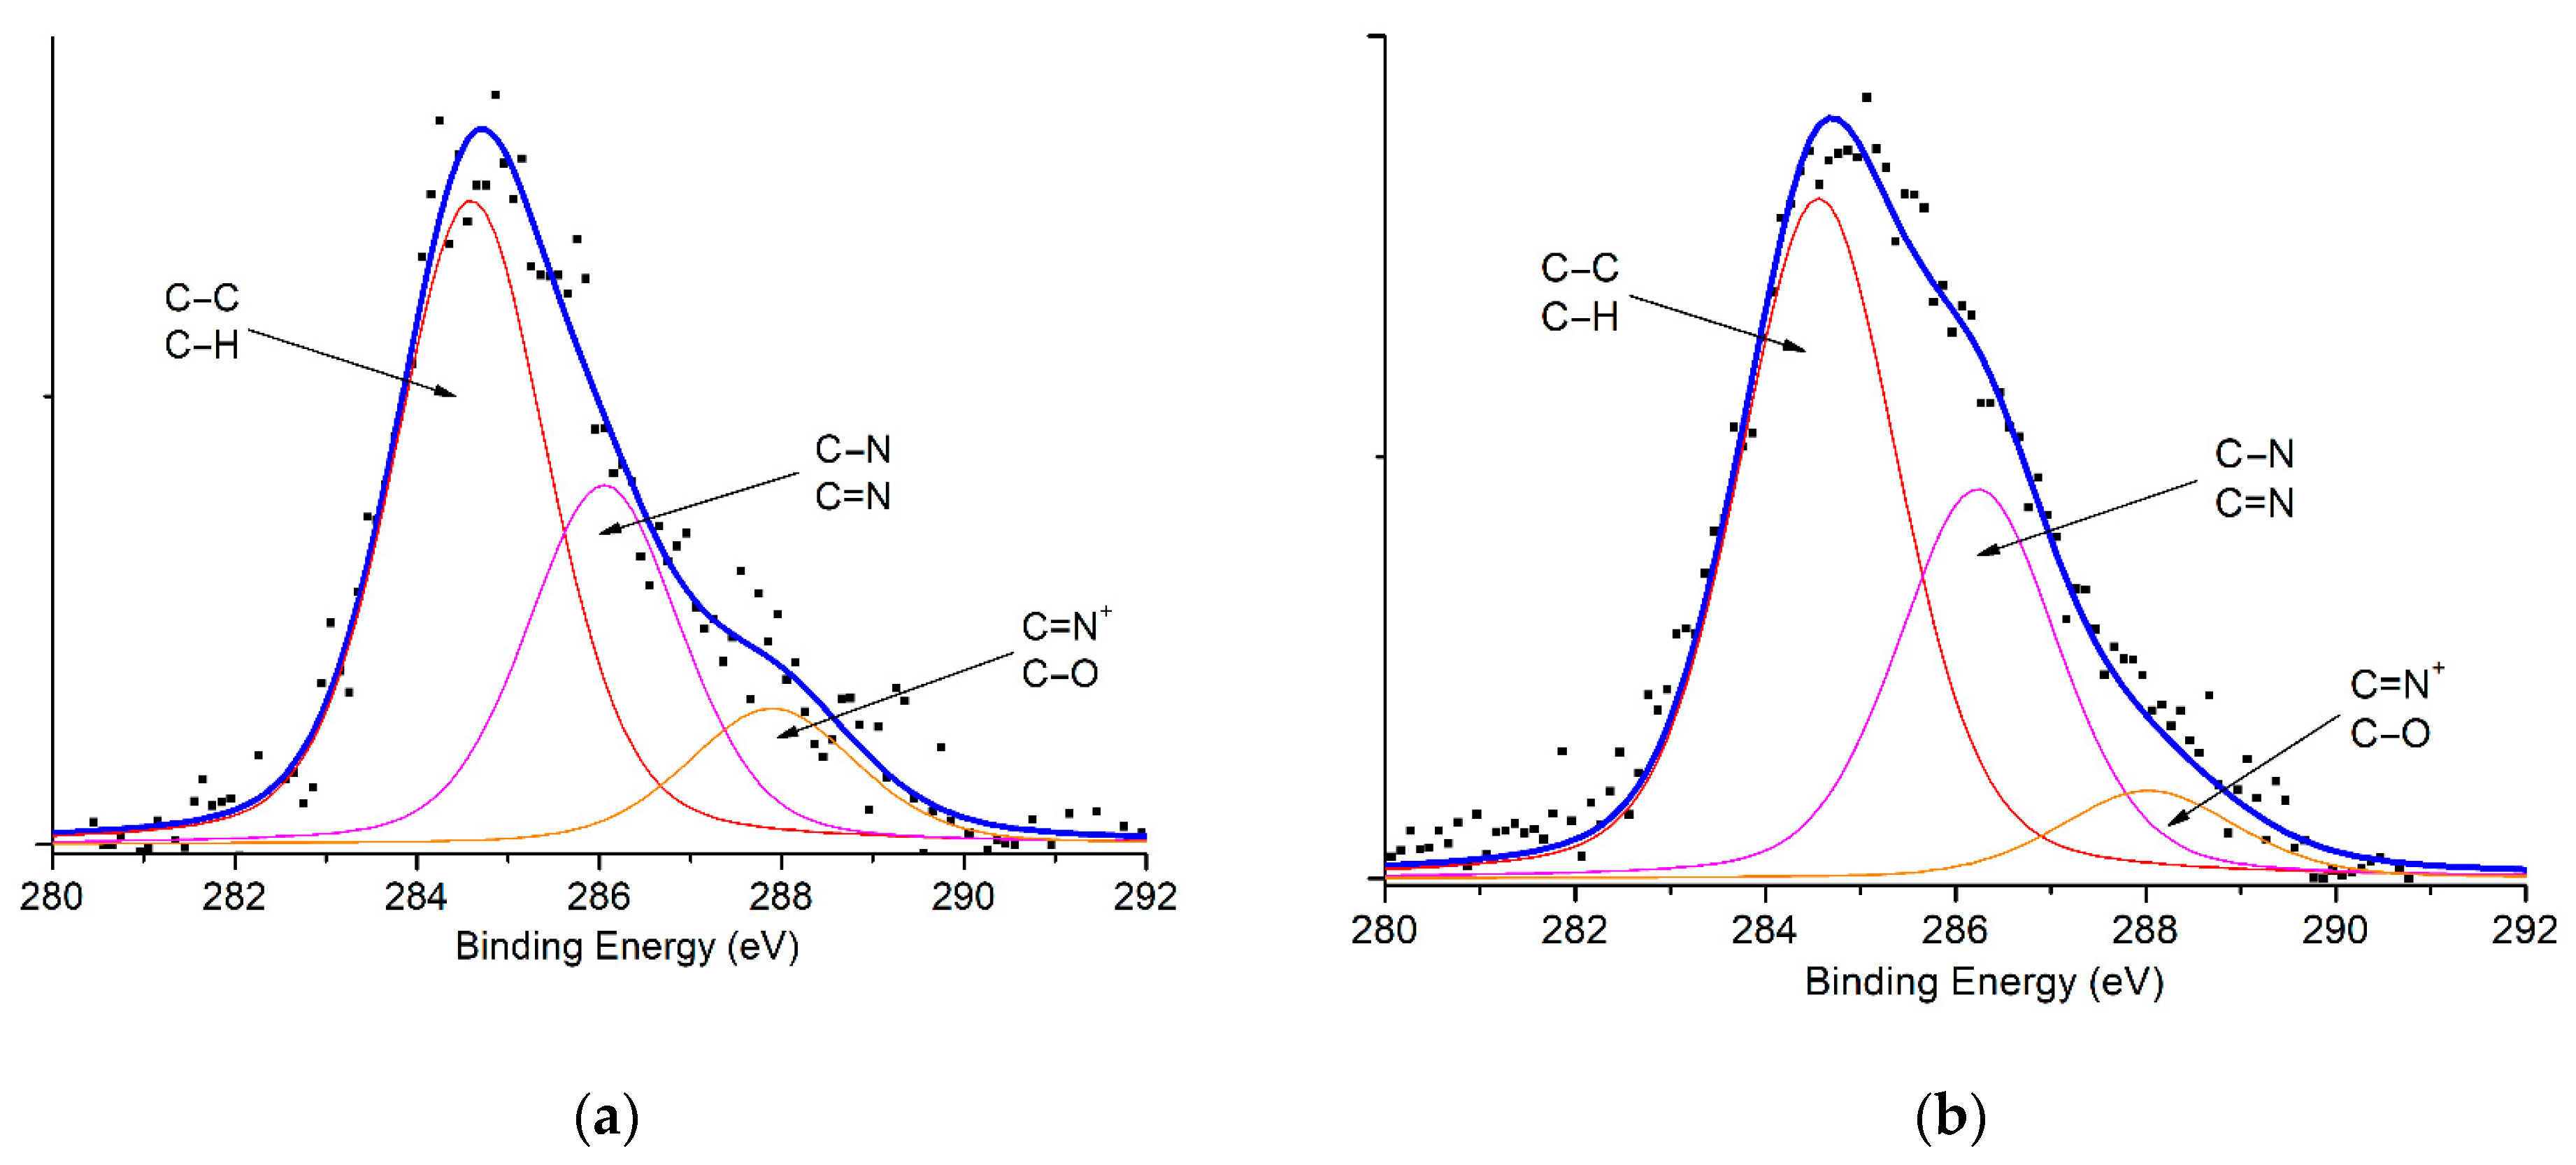
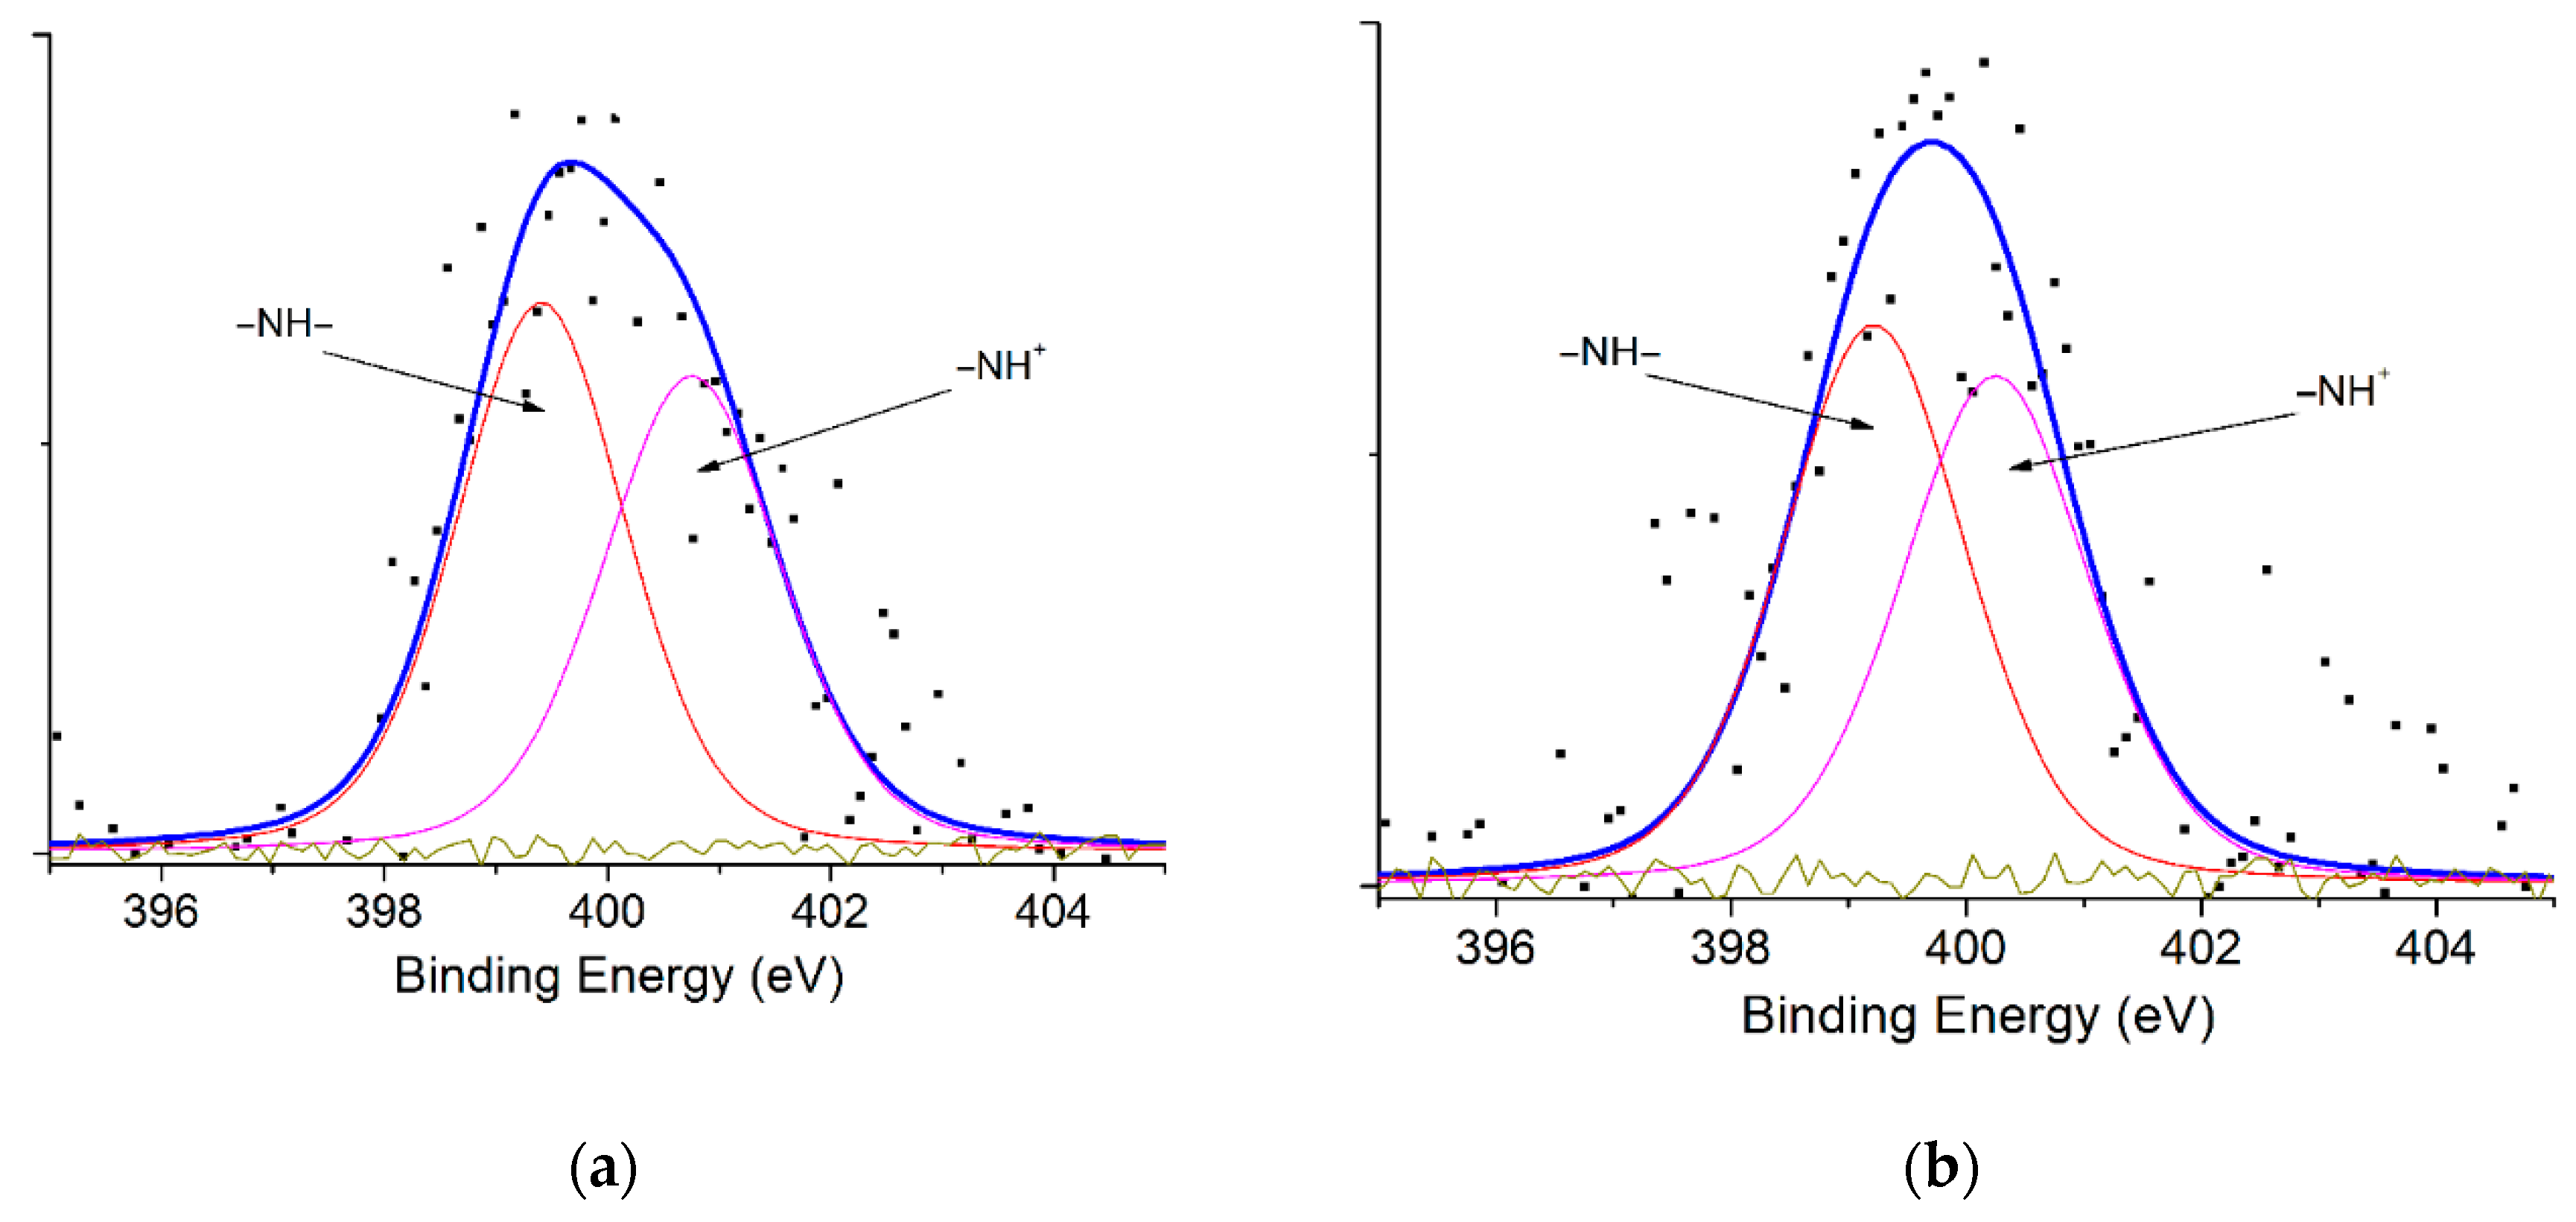
| Materials | Spectrum | Peak BE * (eV) | Atomic % | Assignments |
|---|---|---|---|---|
| CTAB-Mt | N1s | 399.42 | 61.11 | –NH– |
| 400.75 | 38.89 | =NH– | ||
| C1s | 284.61 | 62.22 | C–C, C–H | |
| 286.08 | 29.54 | O–C=O, C=N, C–N | ||
| 287.93 | 8.24 | C–O–C, C=N+ | ||
| PAni@CTAB-Mt | N1s | 399.20 | 56.89 | –NH– |
| 400.24 | 43.11 | =NH– | ||
| C1s | 284.56 | 68.19 | C–C, C–H | |
| 286.25 | 26.88 | O–C=O, C=N, C–N | ||
| 288.04 | 4.93 | C–O–C, C=N+ |
| Model | Constant | Mt | CTAB-Mt | PAni@CTAB-Mt |
|---|---|---|---|---|
| PFO | (min−1) | 0.033 | 0.031 | 0.047 |
| (mg·g−1) | 44.38 | 68.91 | 74.47 | |
| R2 | 0.625 | 0.763 | 0.599 | |
| PSO | (mg·g−1) | 69.82 | 81.25 | 108.82 |
| (g·mg−1·min−1) | 0.0162 | 0.0035 | 0.0071 | |
| (mg·g−1) | 48.35 | 52.51 | 96.50 | |
| R2 | 0.954 | 0.942 | 0.958 | |
| Intraparticle diffusion | (g·mg−1·min−1) | 0.978 | 1.545 | 1.332 |
| C (mg·g−1) | 28.92 | 37.85 | 71.14 | |
| R2 | 0.709 | 0.676 | 0.678 |
| Adsorbents | (mg·g−1) | (mg·L−1) | Ref. |
|---|---|---|---|
| PAni@ZnO-SiO2 | 71.20 | 100 | [8] |
| Activated carbon/cellulose | 103.66 | 100 | [23] |
| Ruthenium nanoparticle loaded activated carbon | 94.60 | 80 | [24] |
| Wheat straw biochar powder | 62.50 | 10 | [25] |
| Algerian palygorskite powder | 57.5 | 10 | [26] |
| Tannin-immobilized cellulose microspheres | 55.4 | 1500 | [27] |
| Cortaderia selloana flower spikes | 47.9 | 50 | [28] |
| Natural Saudi Red Clay | 50.25 | 100 | [29] |
| Natural clay Portugal | 22.20 | 100 | [30] |
| Epoxy/clay nanocomposites | 1.424 | 2000 | [31] |
| Porous geopolymer based pyrophyllite (PyGP4) | 64.10 | 2400 | [32] |
| Geopolymer/ZnTiO3/TiO2 (GTA) | 61.96 | 150 | [33] |
| Lolium multiforum (LM) | 28.70 | 150 | [34] |
| Treated NaOH/Lolium multiforum (NaOH/LM) | 67.19 | 150 | [34] |
| Treated H3PO4 40%/Lolium multiforum (R-40) | 80.79 | 150 | [35] |
| Treated H3PO4 70%/Lolium multiforum (R-70) | 70.21 | 150 | [35] |
| Pyrolysis R-40 (AC-40) | 8.20 | 150 | [35] |
| Pyrolysis R-40 (AC-70) | 53.32 | 150 | [35] |
| Citric acid/Kenaf core fiber | 144.1 | 150 | [36] |
| Untreated (Metroxylon sagu) waste | 64.21 | 150 | [37] |
| Potassium hydroxide/(Metroxylon sagu) waste | 66.11 | 150 | [37] |
| Phosphoric acid/(Metroxylon sagu) waste | 36.00 | 150 | [37] |
| Sulphuric acid/Parthenium carbon (SWC) | 16.80 | 150 | [38] |
| Phosphoric acid/Parthenium carbon (PWC) | 26.10 | 150 | [38] |
| Needles of Pinus sylvestris | 92.52 | 150 | [39] |
| PANI@ZnO | 59.23 | 150 | [40] |
| Mt | 57.36 | 150 | This work |
| CTAB-Mt | 81.25 | 150 | This work |
| PAni@CTAB-Mt | 108.82 | 150 | This work |
| Model | Constant | Mt | CTAB-Mt | PAni@CTAB-Mt |
|---|---|---|---|---|
| Langmuir | (mg·g−1) | 57.36 | 81.25 | 108.82 |
| (mg·g−1) | 80.64 | 12.50 | 67.56 | |
| (L·mg−1) | 0.098 | 0.058 | 0.013 | |
| 0.112 | 0.730 | 0.532 | ||
| R2 | 0.806 | 0.567 | 0.559 | |
| Freundlich | (mg1−1/nL1/ng−1) | 1.022 | 1.238 | 1.584 |
| 1.182 | 1.038 | 1.398 | ||
| R2 | 0.989 | 0.993 | 0.972 | |
| Temkin | (T·mol−1) | 16.99 | 17.12 | 11.65 |
| (L·g−1) | 1.633 | 1.378 | 2.627 | |
| R2 | 0.935 | 0.892 | 0.861 |
| Adsorbents | T/K | ΔG/kJ·mol−1 | ΔH/kJ·mol−1 | ΔS/J·mol−1 |
|---|---|---|---|---|
| Mt | 298 | −0.606 | −2.82 | −7.43 |
| 308 | −0.531 | |||
| 318 | −0.457 | |||
| 328 | −0.383 | |||
| CTAB-Mt | 298 | −0.398 | −3.14 | −9.20 |
| 308 | −0.306 | |||
| 318 | −0.214 | |||
| 328 | −0.122 | |||
| PAni@CTAB-Mt | 298 | −0.794 | −5.50 | −15.79 |
| 308 | −0.637 | |||
| 318 | −0.478 | |||
| 328 | −0.321 |
Disclaimer/Publisher’s Note: The statements, opinions and data contained in all publications are solely those of the individual author(s) and contributor(s) and not of MDPI and/or the editor(s). MDPI and/or the editor(s) disclaim responsibility for any injury to people or property resulting from any ideas, methods, instructions or products referred to in the content. |
© 2023 by the authors. Licensee MDPI, Basel, Switzerland. This article is an open access article distributed under the terms and conditions of the Creative Commons Attribution (CC BY) license (https://creativecommons.org/licenses/by/4.0/).
Share and Cite
Mennas, N.; Lahreche, S.; Chouli, F.; Sabantina, L.; Benyoucef, A. Adsorption of Methylene Blue Dye by Cetyltrimethylammonium Bromide Intercalated Polyaniline-Functionalized Montmorillonite Clay Nanocomposite: Kinetics, Isotherms, and Mechanism Study. Polymers 2023, 15, 3518. https://doi.org/10.3390/polym15173518
Mennas N, Lahreche S, Chouli F, Sabantina L, Benyoucef A. Adsorption of Methylene Blue Dye by Cetyltrimethylammonium Bromide Intercalated Polyaniline-Functionalized Montmorillonite Clay Nanocomposite: Kinetics, Isotherms, and Mechanism Study. Polymers. 2023; 15(17):3518. https://doi.org/10.3390/polym15173518
Chicago/Turabian StyleMennas, Naima, Saadia Lahreche, Faiza Chouli, Lilia Sabantina, and Abdelghani Benyoucef. 2023. "Adsorption of Methylene Blue Dye by Cetyltrimethylammonium Bromide Intercalated Polyaniline-Functionalized Montmorillonite Clay Nanocomposite: Kinetics, Isotherms, and Mechanism Study" Polymers 15, no. 17: 3518. https://doi.org/10.3390/polym15173518
APA StyleMennas, N., Lahreche, S., Chouli, F., Sabantina, L., & Benyoucef, A. (2023). Adsorption of Methylene Blue Dye by Cetyltrimethylammonium Bromide Intercalated Polyaniline-Functionalized Montmorillonite Clay Nanocomposite: Kinetics, Isotherms, and Mechanism Study. Polymers, 15(17), 3518. https://doi.org/10.3390/polym15173518