Article

Thermal and Mechanical Properties of Reprocessed Polylactide/Titanium Dioxide Nanocomposites for Material Extrusion Additive Manufacturing

by
Saltanat Bergaliyeva
1,2,*,
David L. Sales
1,*,
José María Jiménez Cabello
3,
Pedro Burgos Pintos
3,
Natalia Fernández Delgado
3,
Patricia Marzo Gago
3,
Ann Zammit
4 and
Sergio I. Molina
3
1
Department of Materials Science and Metallurgical Engineering and Inorganic Chemistry, Algeciras School of Engineering and Technology, Universidad de Cádiz, INNANOMAT, IMEYMAT, Ramón Puyol Avenue, 11202 Algeciras, Cádiz, Spain
2
Physics and Technology Department, Al-Farabi Kazakh National University, 71, Al-Farabi Avenue, Almaty 050040, Kazakhstan
3
Department of Materials Science and Metallurgical Engineering and Inorganic Chemistry, Universidad de Cádiz, Campus Río S. Pedro, INNANOMAT, IMEYMAT, 11510 Puerto Real, Cádiz, Spain
4
Department of Metallurgy & Materials Engineering, University of Malta, MSD 2080 Msida, Malta
*
Authors to whom correspondence should be addressed.
Polymers 2023, 15(16), 3458; https://doi.org/10.3390/polym15163458
Submission received: 23 July 2023 / Revised: 14 August 2023 / Accepted: 15 August 2023 / Published: 18 August 2023

Abstract

:
Polylactic acid (PLA) is a biodegradable polymer that can replace petroleum-based polymers and is widely used in material extrusion additive manufacturing (AM). The reprocessing of PLA leads to a downcycling of its properties, so strategies are being sought to counteract this effect, such as blending with virgin material or creating nanocomposites. Thus, two sets of nanocomposites based respectively on virgin PLA and a blend of PLA and reprocessed PLA (rPLA) with the addition of 0, 3, and 7 wt% of titanium dioxide nanoparticles (TiO2) were created via a double screw extruder system. All blends were used for material extrusion for 3D printing directly from pellets without difficulty. Scanning electron micrographs of fractured samples’ surfaces indicate that the nanoparticles gathered in agglomerations in some blends, which were well dispersed in the polymer matrix. The thermal stability and degree of crystallinity for every set of nanocomposites have a rising tendency with increasing nanoparticle concentration. The glass transition and melting temperatures of PLA/TiO2 and PLA/rPLA/TiO2 do not differ much. Tensile testing showed that although reprocessed material implies a detriment to the mechanical properties, in the specimens with 7% nano-TiO2, this effect is counteracted, reaching values like those of virgin PLA.

Graphical Abstract

1. Introduction

With benefits such as toolless material processing, high geometric freedom, fast prototyping, and cost-efficient small-scale production, additive manufacturing (AM) has the potential to revolutionize the manufacturing industry [1]. Depending on the form of material and the type of extruder, extrusion-based AM can be divided into filament fused fabrication (FFF) and fused granular fabrication (FGF), among others [2]. FFF uses high-quality, not too brittle or too flexible filament with a specific and constant diameter [3]. So, only certain materials with the appropriate mechanical properties can be processed by FFF. In comparison, the FGF method is not so limited by the variety of materials [3], while all industrial polymers can be found as pellets [4]. Using polymeric pellets as a feedstock material can improve production times by up to 200 times [5] and reduce costs by a factor of 10. This is due to the fact that an additional filament-extruding step is not required during the pellet-based AM process [6]. In addition, the one-step preparation of feedstock for FGF excludes a second thermal processing of the polymers, which always reduces their molar mass [3].
Biodegradable polylactic acid (PLA) filaments are one of the most widely used extrusion-based 3D printing feedstocks [3]. PLA is an eco-friendly polymer material [7] based on plant materials [8]. It is a three-carbon-membered thermoplastic with one hydroxyl and one carbonyl at the end. It has a prolonged biodegradation rate and is brittle despite its low degree of crystallinity [9]. However, the role of biodegradable plastics in solid waste management is somewhat controversial because of their slow degradation rate and their possible interference with plastic recycling efforts [10]. Therefore, increasing the production of PLA might cause some problems, mainly related to managing the waste generated after its use [11]. One way to utilize PLA waste is composting [12]. However, this method is used to degrade industrial waste, where a large amount of waste is collected daily [12]. Hence, considering that PLA and the construction of composting facilities are expensive [13,14], reprocessing scrap materials could be an interesting way to save costs [15,16].
Some studies revealed that coupling open-source 3D printers with polymer processing could offer the basis for a new paradigm of the distributed recycling process [1,8,17,18]. The main conclusion from these studies is that 3D printing with recycled PLA is a viable option. A common disadvantage of filament-fed printers reported in these works is nozzle clogging during the reprinting of recycled materials. On the other hand, these studies showed the decreasing tendency of mechanical properties with the addition of recycled content [1,8,17,18]. This limitation can be solved by adding nanofillers, which could also add functionalities to the produced nanocomposites [19]. The physical, chemical, and mechanical improvements are significantly higher than the more traditional polymer composites with micron-sized fillers [20].
Among the many inorganic materials available today, nano-TiO2 has received most of the attention [9] because it is nearly non-toxic, inert, optically transparent, biocompatible, environmentally friendly, and inexpensive. Therefore, nano-TiO2 has been widely introduced into polymers to improve heat resistance, radiation resistance, mechanical and electrical properties [13], and bacteriostatic and photocatalytic activity [21]. So, the nanoalloy of Ti has a great potential to act as a reinforcing material in PLA composites compared with natural fillers [12]. According to the literature, plentiful dangling bonds exist on the surface of nano-TiO2, which could interact with polymer molecules, thus improving the properties of nanocomposites [22]. The literature also revealed that 0.5% to 8% nanofiller reinforcement is sufficient to strengthen the polymer mechanically and thermally. Apart from that, PLA is less susceptible to photodegradation than TiO2 nanoparticles; hence, TiO2 nanoparticles can improve the photodegradability of PLA [12].
Several investigators have fabricated nanocomposites by reinforcing titanium dioxide in the PLA matrix. The results of Zhuang et al. [10] show that the thermal and mechanical properties are markedly improved when the content of TiO2 is 3 wt% in the PLA/TiO2 nanocomposites prepared by in situ polymerization. Buzarovska et al. [23] produced nanocomposites with 0.5, 1, 2, 5, and 10 wt% TiO2 by solution casting. Zhang et al. [22] employed a vane extruder to compound PLA/TiO2 nanocomposites with 0, 0.5, 1.0, 2.0, 5.0, 10.0, and 15.0 wt% TiO2 and prepared the samples by injection molding. The prepared nanocomposites showed improved thermal stability for all samples and improved tensile strength in the samples by up to 2%. Nakayama et al. [24] proved that the tensile behavior of PLA films with 10% nano-TiO2 was similar to pure PLA. All these studies showed a rising trend in tensile strength when a uniform dispersion of nanoparticles in the matrix of PLA is achieved up to a certain amount of nano-TiO2. This upper limit depends on the manufacturing technique, and to the best of our knowledge, nobody has reported the maximum amount of nano-TiO2 that produces the best enhancement of the tensile strength on FGF PLA-printed parts. Thus, it can be concluded that the effects of different processing flow fields on the degree of dispersion and the mechanical behavior have not been investigated in detail yet [22]. Also, in 3D printing, mechanical performance depends on the product’s layer adhesion [25], as the bonding strength between two consecutive layers is a weak point of layer-by-layer construction [26].
The aim of this research is to study the possibility of enhancing PLA recyclability by hybridizing reprocessed PLA (rPLA) with virgin PLA and nano-TiO2 and using the resulting material as a feedstock for FGF to produce high-quality parts. To achieve this goal, two types of nanocomposite pellets incorporating neat PLA with nano-TiO2 and a blend of neat and rPLA with nano-TiO2 were prepared. Secondly, samples were FGF-printed from the prepared nanocomposite pellets. This printing technology was preferred because it reduces nozzle clogging during printing and makes filament production unnecessary, saving PLA from additional thermal degradation. Then, the morphology, thermal, and mechanical properties of the produced samples were investigated. Subsequently, the influence of the addition of nano-TiO2 and rPLA to neat PLA on the interlayer adhesion of 3D printed samples was analyzed. Finally, the mass fraction of TiO2 that improves the mechanical properties of PLA nanocomposites produced by FGF was determined. Although not the focus of this study, the addition of nano-TiO2 may also provide further functionalities to the nanocomposites, such as UV resistance and antibacterial activity. Once the feasibility of using the proposed nanocomposites for FGF and their mechanical reinforcement capabilities are proven, this study will serve as a basis for investigating these additional properties of PLA.
The novelty of this work lies in using nanocomposite pellets of PLA and rPLA with the addition of nanoscale titanium dioxide as a feedstock for FGF technology. To the best of our knowledge, there has been no previous report on the preparation and properties studies of 3D printed nanocomposites from PLA with nano-TiO2 (PLA/TiO2) and from a mixture of PLA and rPLA with nano-TiO2 (PLA/rPLA/TiO2).

2. Materials and Methods

Six mixtures from neat PLA pellets with or without adding rPLA and/or titanium dioxide nanoparticles were produced for investigation and comparison. Proportions of PLA and rPLA pellets and nano-TiO2 are presented in Table 1. The designations of the different composites are as follows: letter V stands for virgin PLA, R for one-time reprocessed PLA, and A for additives, i.e., titanium dioxide nanoparticles. The number to the right of the letter indicates the percentage of each material in the mixture.

2.1. Materials

PLA granules named NatureWorks 3D850, purchased from NatureWorks LLC (Plymouth, MI, USA), were used as virgin PLA, with a specific gravity of 1240 kg/m3, a relative viscosity of 4.0, peak melt temperature of 165–180 °C, and 55–60 °C glass transition temperature, as reported in the manufacturer’s technical data and security sheet [27]. An additive nanopowder of titanium (IV) oxide with a particle size of approximately 10–20 nm was purchased from ALDRICH Chemistry (Taufkirchen, Germany) and used as received.

2.2. Production of Reprocessed PLA

Reprocessed PLA was obtained under simulated recycling conditions by melt-processing virgin PLA in an extruder system to emulate recycled PLA [8,17]. About 700 g of raw PLA granules were dried overnight at 50 °C to remove residual moisture in a Piovan DPA 200 (Group Piovan, Maria di Sala VE, Italy) dehumidifying system. Then, this material was processed in a twin-screw modular extruder system by Scamex (Isques, France). It has five heater zones with controlled temperatures, screw speed, and work pressure, and two electronic dosimeters with different blades: the first for pellets and the second for powders. A continuous filament with a diameter of 1.75 mm was produced. The diameter of the filament was automatically adjusted by using the optical reader of the winder. This filament was automatically cut into small pieces in the extruder, which were then used as the reprocessed part in the composites. The technical data used for processing the samples is shown in Table 2. The mixture of virgin and rPLA V25R75 was produced by extruding the proportion of 25% virgin PLA and 75% rPLA.

2.3. Manufacturing of Nanocomposites
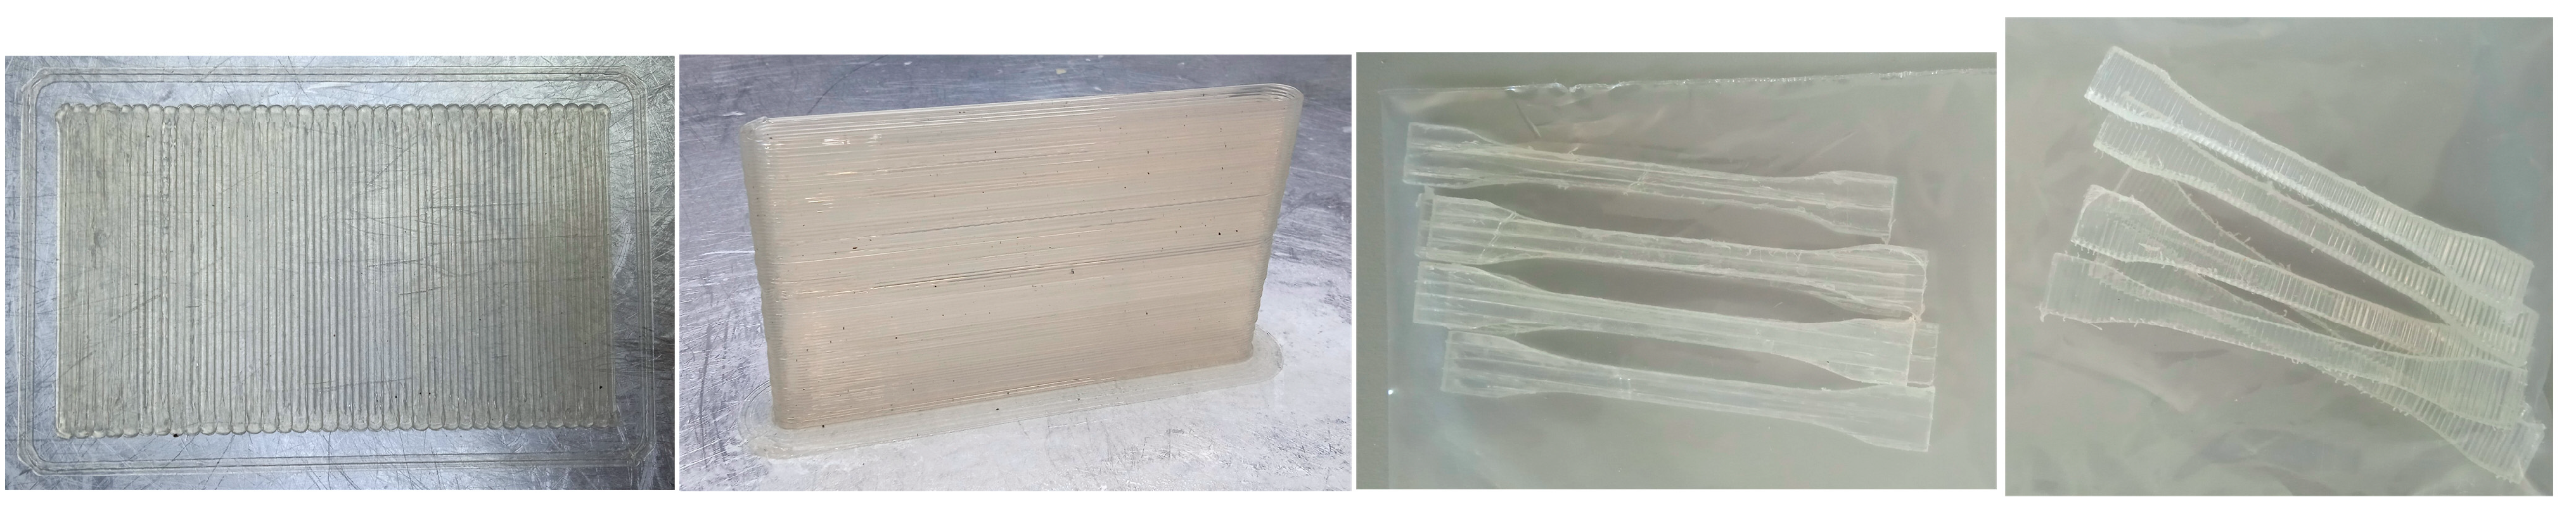
To produce each composite material, V97A3, V93A7, V22R75A3, and V18R75A7, PLA was introduced in the extruder by the first dosimeter and the TiO2 nanoparticles by the second dosimeter. Table 2 presents the processing conditions. Figure 1 shows pictures of the pellets produced.

2.4. Printing

Specimens were printed using direct pellet extrusion technology with the Discovery 3D Granza printer from Bárcenas CNC (Valdepeñas, Ciudad Real, Spain); its printing volume is 1100 × 800 × 500 mm. The slicer software Simplify3D (Simplify3D, Cincinnati, OH, USA) was used to prepare the files in a G-code format for printing out the specimens. Table 3 shows the printing parameters used. For horizontal specimens, a 100% linear infill at 0° (XY orientation) was used, and for vertical specimens (XZ orientation), a unique contour (nomenclature according to AM standard [28]) was used. All compositions processed with FGF were dried for 4 h at 60 °C in a Piovan DPA (Group Piovan, Maria di Sala VE, Italy) dehumidifying dryer to avoid possible defects due to humidity. Pictures of the resultant horizontal and vertical FGF-printed samples are shown in Figure 2.
The temperature of the extruder (namely the three heating zones of the extruder, the last one of which is the closest to the nozzle), the temperature of the bed, and the printing speed for horizontal and vertical plates were constant. Table 4 lists the parameters used to manufacture the plates. The temperatures have been selected according to the PLA manufacturer’s recommendations for printing (around 200–220 °C) and to previous prints carried out by the authors on the used printer. The temperature gradient of the extruder (with increases of 5 °C per part) was set according to the recommendation of the printer manufacturer and its technical characteristics. The multiplier is a parameter that controls the rate of extruded material and is experimentally set. The variations in the used multiplier value are due to the differences in the rheological behavior of the blends, which depend on the additive content. This correction aims to maintain a constant flow throughout the printing process and to be able to manufacture plates with perfectly joined beads. The multiplier of each composition is varied for the vertical sheet with respect to the horizontal one to preserve the extrusion width of 2 mm. Finally, the printing speed for horizontal plates is the one recommended by the printer manufacturer for printing standard parts, and it was reduced for the vertical specimens, so the filament has enough time to adhere to the previous layer, hence avoiding sobbing.
Considering the multiplier for a PLA material of 0.2, the flow of V18R75A7 is moderately controllable, somewhat better than for the V100, V97A3, and V22R75A3. Therefore, the plate comes out quite full. In the case of horizontal and vertical plates from V22R75A3, it was only necessary to increase the multiplier to 0.22 to cover the plate well. The V93R7 is a compound that needed the least multiplier of 0.18 due to its high fluidity at the temperature range used. However, there is a problem with some flow control, which was also experienced in other compounds. In contrast, the V25R75 compound requires much more multiplier extrusion than the rest because of the 75% of rPLA, considering the parameters used in the rest of the materials, raising the multiplier to 0.26. Finally, the V100 compound performs very well in printing, as it is an untreated and pure base, avoiding excess material and flow variations during printing. On the vertical plate, excellent wall stability is observed, as expected. It must be mentioned that warping, cracking, delamination problems, or nozzle clogging during the 3D printing process were not detected in any sample.

2.5. Cutting of Samples

The specimens were cut from the FGF-printed sheets to the required dimensional accuracy. At least five tensile specimens of type 1BA (i.e., a reduced-size version of probes extracted from machining) according to ISO 527-2 [29] were milled with a LEKN(C1) 3020 CNC Router Machine Kit (Lekn, Nanjing, China), using a 2 mm diameter flat milling cutter with two cutting edges. A milling speed of 5000 rpm and a cutting speed of 350 mm/min were used for both horizontal and vertical printed plates. Before milling, the surfaces of the plates were covered with an adhesive film to prevent the plate from being overcoated and the chips resulting from the milling process from sticking to it.

2.6. Characterization and Testing

Following tensile testing, the fractured surface was examined via scanning electron microscopy (SEM). This test was conducted to show the distribution of nanoparticles in polymer matrix. SEM measurements were carried out using an FEI Nova NanoSEM 450 (Fei, Waltham, MA, USA) microscope with a field-emission gun for high-resolution analyses controlled by xT Microscope Server software (Fei, Waltham, MA, USA). Secondary electron detectors with 5 kV, a probe size of 2.0 nm, and magnifications of 40X and 20 kX were used. To carry out the EDX analysis, an EDAX detector and the AZtec software from Oxford Instruments (Abingdon, UK) were used. To protect the samples during the analysis, they were covered by a 10 nm layer of gold using a Balzers SCD 004 Sputter Coater (Balzers, Liechtenstein). SEM images were analyzed and processed using ImageJ software (National Institute of Health, Bethesda, MA, USA) [30].
Differential scanning calorimetry (DSC) experiments were performed in a Q20 (T&A Instruments, Austin, TX, USA) according to ISO 11357-1 [31]. Temperature sweeps were performed from room temperature to 200 °C at 10 °C/min under nitrogen flow. The glass transition, melting and crystallization temperatures, and degree of crystallization (Tg, Tm, Tc, and Xc, respectively) were determined by the heating process.
Thermogravimetric analysis (TGA) was carried out in a Q50 (T&A Instruments, Austin, TX, USA) in accordance with ISO [32]. Samples of approximately 10 mg of each polymer/blend were tested. A temperature sweep was performed from room temperature to 600 °C at 10 °C/min under nitrogen flow.
Tensile testing of the printed specimens was performed on a universal testing machine (Shimadzu, Kyoto, Japan) at a constant speed of 1 mm/min, according to ISO 527-1 [28]. At least five specimens were tested for each material. The Young’s modulus, tensile strength, and elongation at break values were determined for each specimen. Results were averaged, and standard deviations were presented as error bars.

3. Results

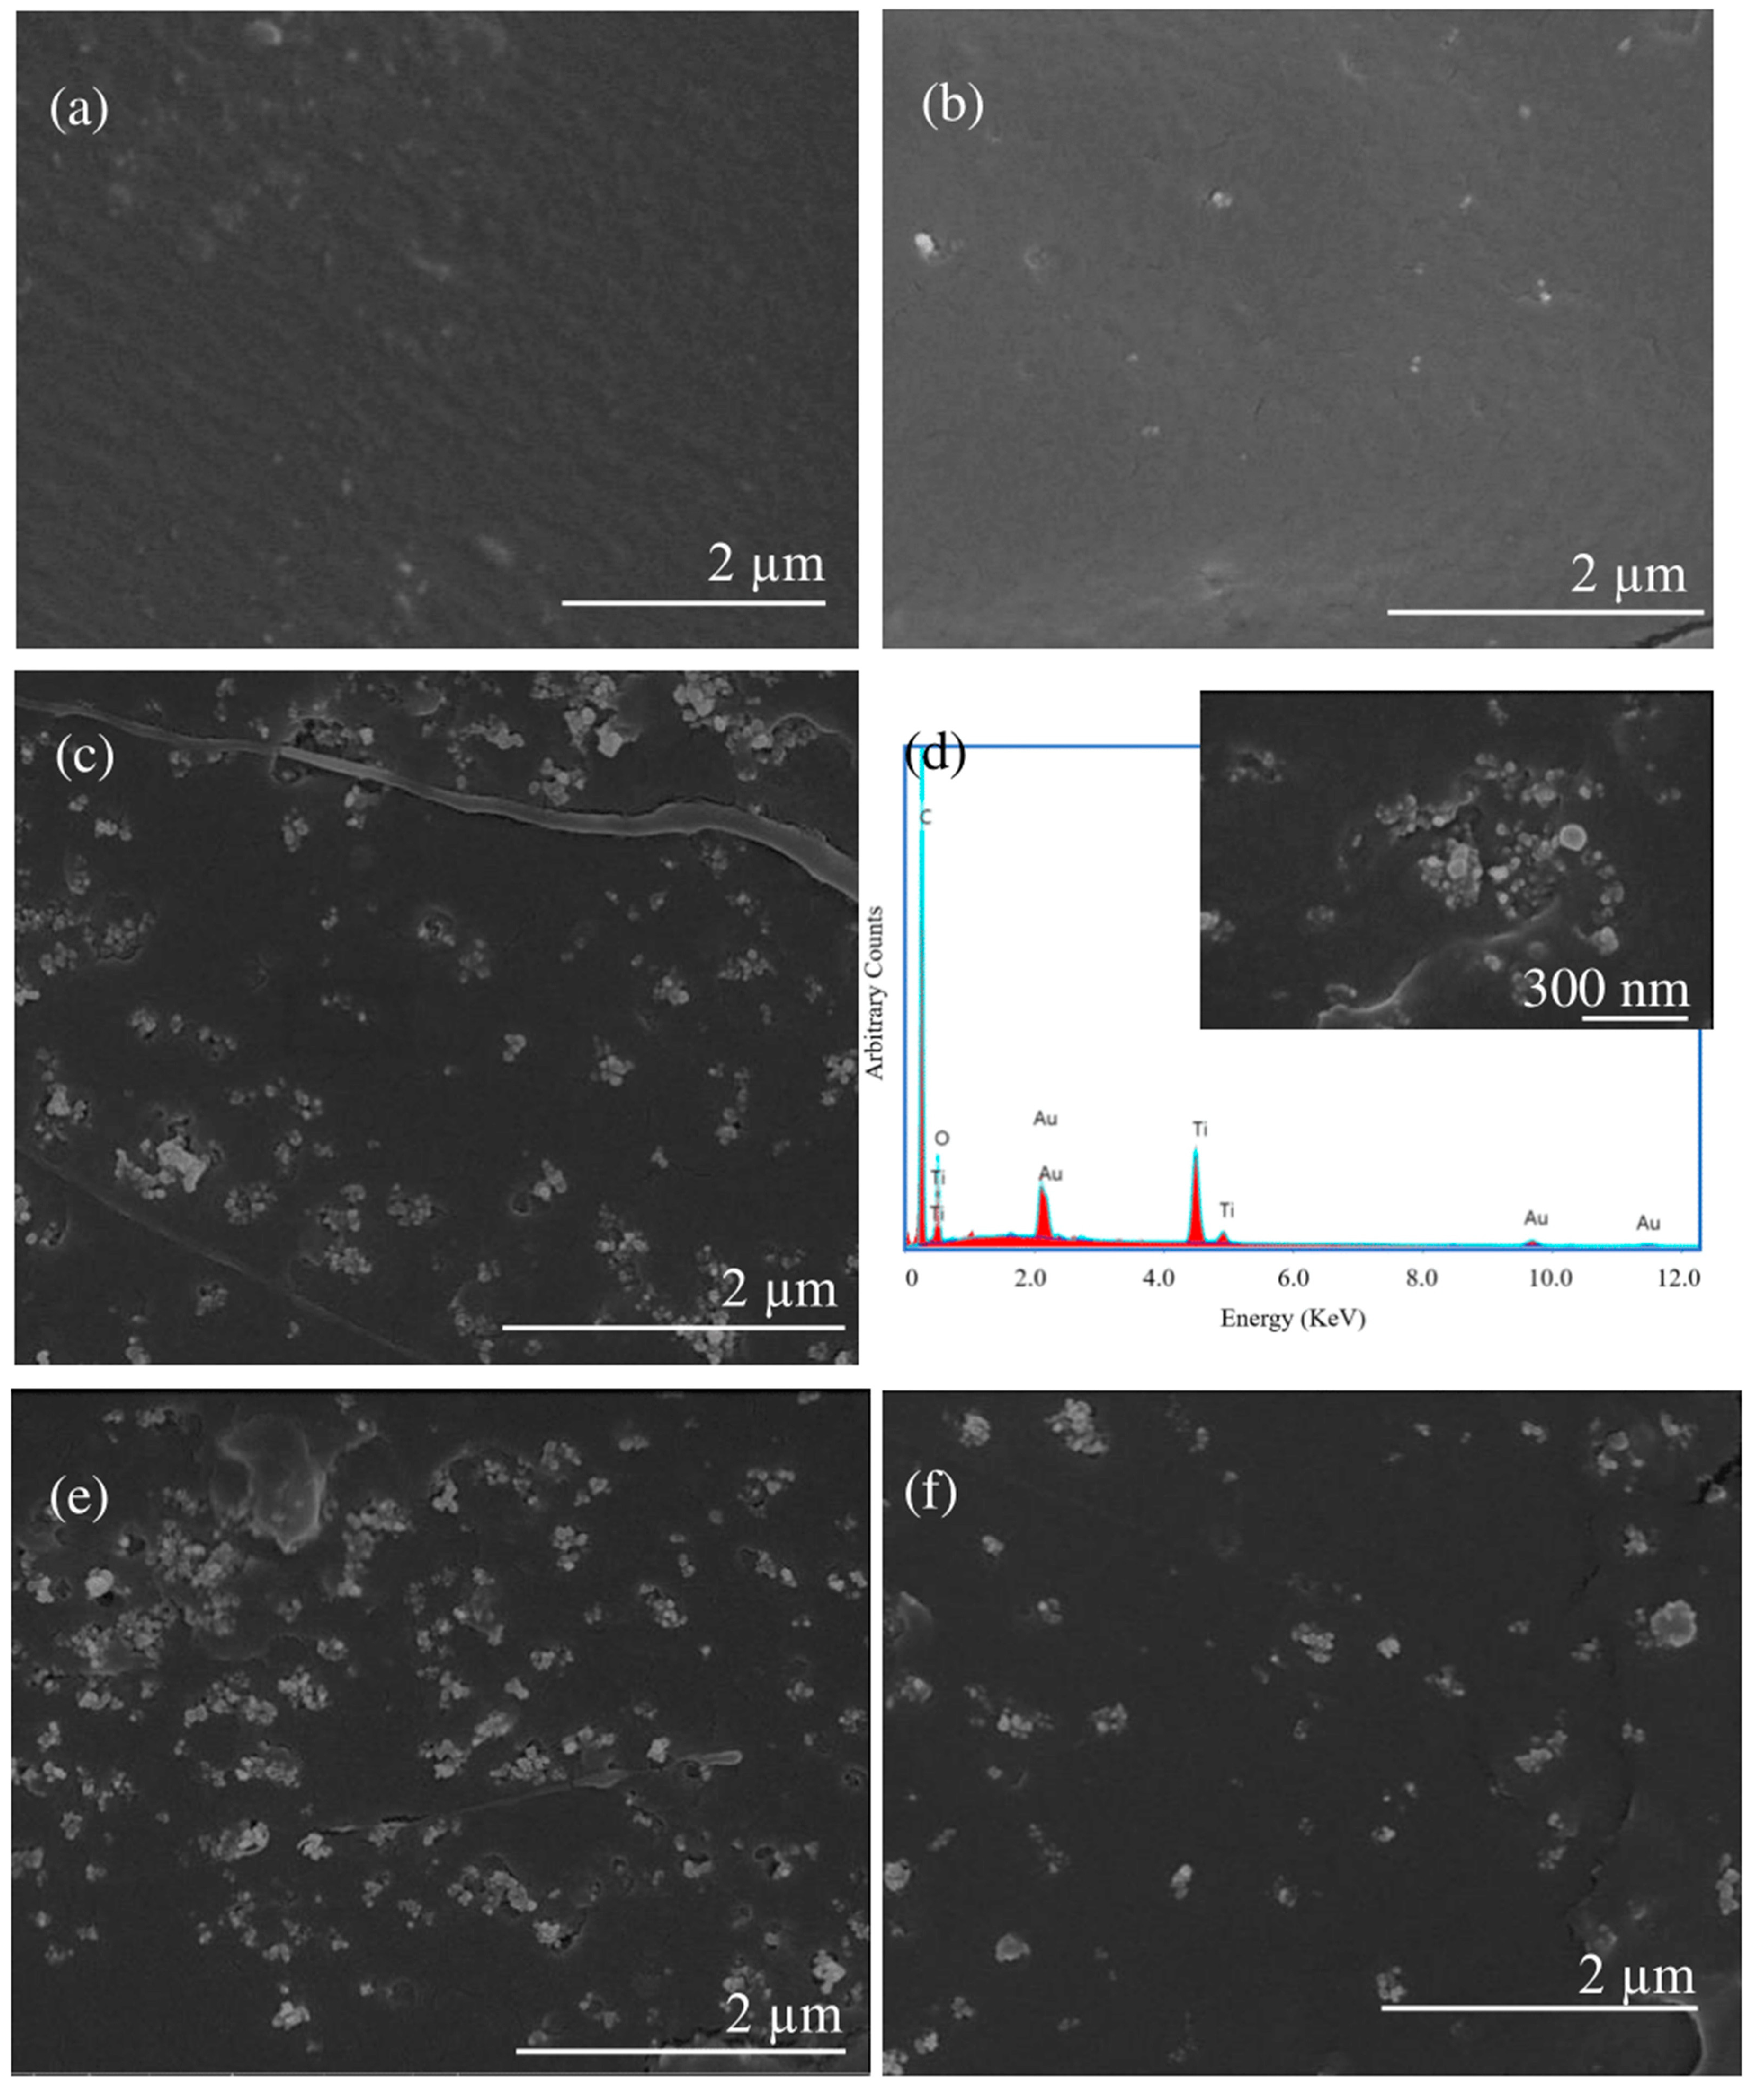
3.1. Scanning Electron Microscopy

The dispersion of nanoparticles in the polymer matrix is a crucial factor influencing the physical properties of the nanocomposites. Therefore, the SEM analysis of the FGF-printed PLA, PLA/TiO2, and PLA/rPLA/TiO2 nanocomposites was performed on fracture surfaces of post-tested tensile test samples (Figure 3), to investigate the dispersion and distribution of TiO2 nanoparticles within the biodegradable matrix. The SEM images do not show any significant differences at a magnification of 40 k. The surfaces are flat and smooth, indicating a brittle nature, consistent with the break without necking observed in the tensile tests (see Section 3.4) and a similar study by Thumsorn et al. [25].
The SEM analysis was also carried out at higher magnifications to study the integration of the nanoparticles in the polymer. As shown in Figure 4, the TiO2 nanoparticles are revealed with a higher intensity in the secondary electron micrographs and are clearly differentiated from the PLA matrix. EDX analysis was carried out to corroborate the composition of the TiO2 nanoparticles. Figure 4d shows the Ti peak, corroborating the presence of TiO2. The Au peak is due to the gold coating necessary for SEM analysis of organic samples (see Section 2.6).
Images in Figure 4 show a homogeneous distribution and adequate integration of the TiO2 in all samples. Nevertheless, Figure 4c,e,f depict that the nanoparticles are gathered into agglomerations in V93A7, V22R75A3, and V18R75A7. The areas corresponding to TiO2 were measured on the high-magnification images to know the equivalent diameters of nanoparticle agglomerations. The histogram of aggregates’ equivalent diameter is presented in Figure 5. The areas of agglomerations range from 0.0003 µm2 to 0.2180 µm2. According to the manufacturer, the average size of TiO2 nanoparticles is between 10 and 20 nm. Considering this information, the equivalent diameter of the smallest agglomeration with an area of 0.0003 µm2 is around 20 nm. Then, the smallest bright areas in the received micrographs consist of one TiO2 nanoparticle. Isolated nanoparticles can be seen in all samples, but their density is low for all samples (<7 × 106 cm−2). Otherwise, the percentage of 2-nanoparticle aggregates is higher than the one for separate particles and is 14, 14, 13, and 10% in V97A3, V93A7, V22R75A3, and V18R75A7, respectively. The biggest agglomeration was revealed in V93A7, with an area of 0.2180 µm2 corresponding to the union of 26 nanoparticles of 20 nm diameter. The results of measured equivalent diameters were statistically normalized in OriginPro software (OriginLab, MA, USA) and presented in Figure 5. The agglomeration sizes that presented more frequency are 0.003 µm2 and 0.005 µm2 (about 3–4 nanoparticles of 20 nm diameter) for V97A3, 0.01 µm2 (about 5–6 nanoparticles with size 20 nm) for V93A7 and V22R75A3, and 0.005 µm2 (4 nanoparticles of 20 nm diameter) for V18R75A7. From this data, it can be estimated that the highest content of agglomerations consists of 3–6 nanoparticles in all samples. Figure 5 illustrates that V18R75A7 has smaller agglomeration sizes than V93A7 and V22R75A3.
The tendency to aggregate can be explained by the fact that no surface treatment was performed on the oxide particles, as in the study in reference [23]. Severe aggregation of TiO2 nanoparticles could be reduced by surface modification using carboxylic acid and long-chain alkyl amine, as Nakayama et al. did [24]. The gathering of nanoparticles in agglomerations may be due to the hydrogen bonds on the surface of the TiO2 particles. Dubois et al. [33] and Zhuang et al. [10] stated that, because of the unique surface properties of the nanoparticles, they easily formed both soft and hard agglomeration. Electrostatic forces and Van der Waals forces mainly cause soft agglomeration. These forces are weak, and this agglomeration can be eliminated through chemical or mechanical processes. By contrast, hard agglomeration is caused by many kinds of forces, including Van der Waals forces, Coulomb forces, and chemical bonding. As a result, the particles are closely combined, and it is not easy to eliminate this kind of agglomeration.
Therefore, SEM micrographs revealed good dispersion of nano-TiO2 aggregates in the matrix at low nano-TiO2 content. In contrast, higher content contributed to aggregation within the matrix, which was consistent with the results of mechanical and thermal properties. The same results were reported by Zhang et al. [13].

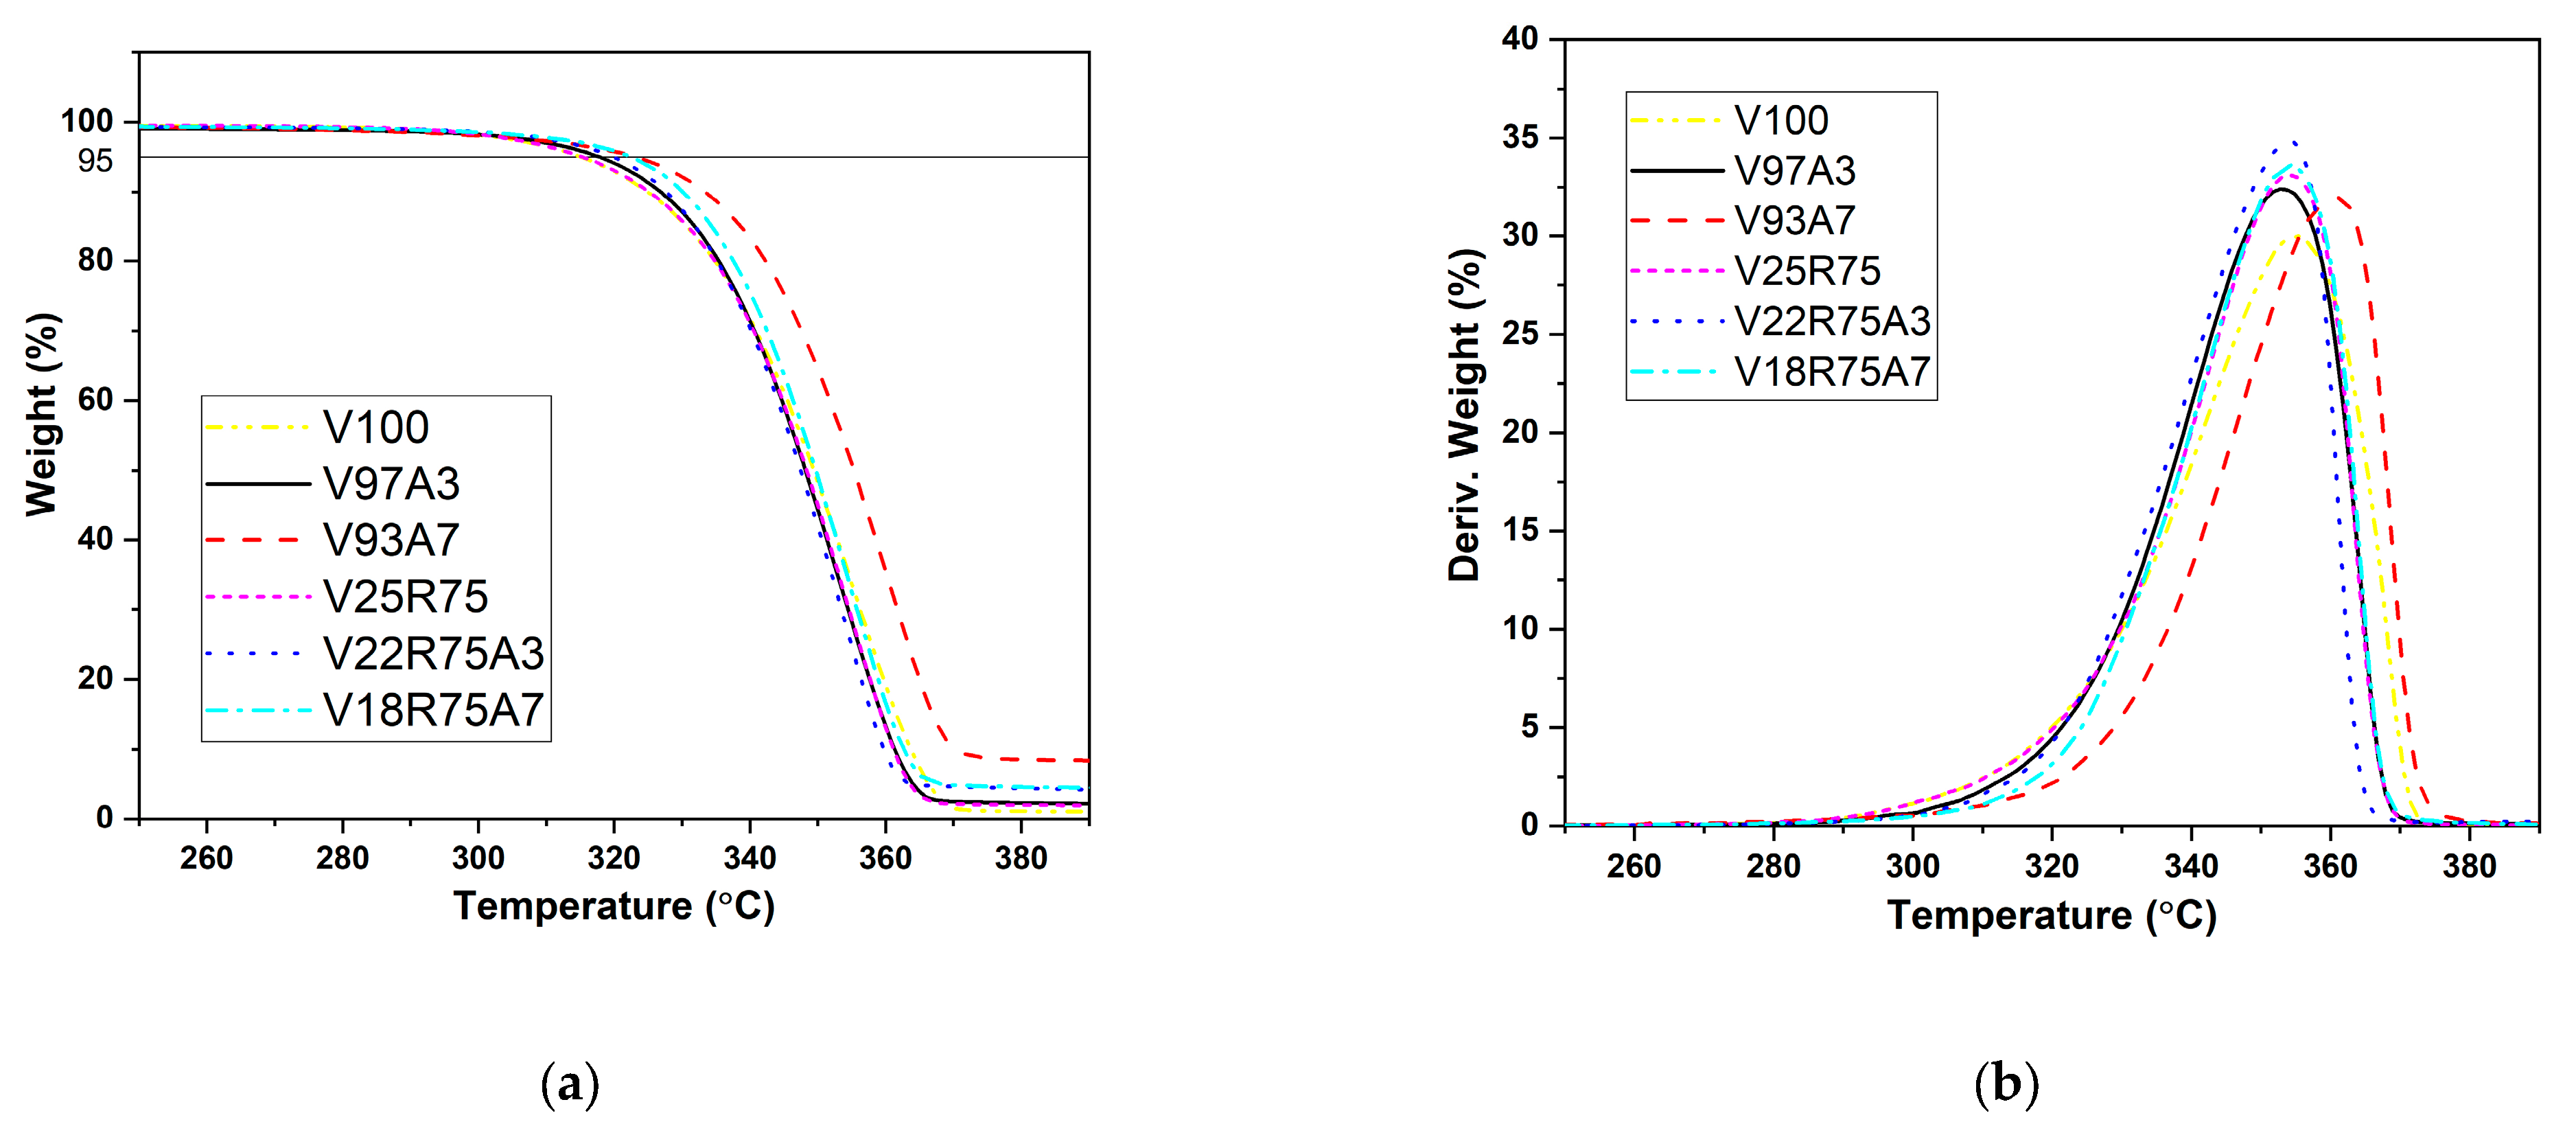
3.2. Thermogravimetric Analysis

The effect of nano-TiO2 addition on the thermal stability of PLA nanocomposites was evaluated by thermogravimetry (TG). Figure 6 illustrates the TG curves and their respective derivative thermograms (DTG) of pure PLA, the mixture of pure and rPLA, and their nanocomposites. TGA curves of PLA nanocomposites have a single-stage sample weight reduction with a maximum decomposition temperature (Tmax) of around 350 °C. Tmax is listed in the last row of Table 5 (extracted from DTG in Figure 6b), evidencing that the composites degrade similarly to PLA.
V100 has the lowest decomposition temperature at 5% weight loss (T5%loss) among all samples. This temperature rises with the addition of rPLA, V25R75, experiencing an increase of almost 3 °C. This effect is also observed after adding nano-TiO2, so the T5%loss of PLA/TiO2 and PLA/rPLA/TiO2 nanocomposites shifted to a higher value than the reference samples without TiO2. This fact indicated that the addition of nano-TiO2 improved the thermal stability of nanocomposites. Generally, the particles can enhance the thermal stability of a polymer because the presence of nano-TiO2 particles constrains the mobility of PLA molecular chains [10,13].
The temperature Tmax shows the maximum degradation temperature. According to the results presented in Figure 6 and Table 5, most of the samples, except V93A7, reached maximum degradation conditions at the same temperature range of about 353–355 °C. For polymers without nanoparticles, complete degradation occurs at about 400 °C. With nanoparticles, zero residue weight was not reached when the samples were heated up to 600 °C. Hence, the particles are stable in the considered temperature range. TGA results show that introducing TiO2 has a rising tendency to increase thermal stability for both PLA/TiO2 and PLA/rPLA/TiO2 nanocomposites with increasing nanoparticle concentration. This agrees with the results of Zhang et al. [22], who showed that introducing TiO2 significantly improved thermal stability.

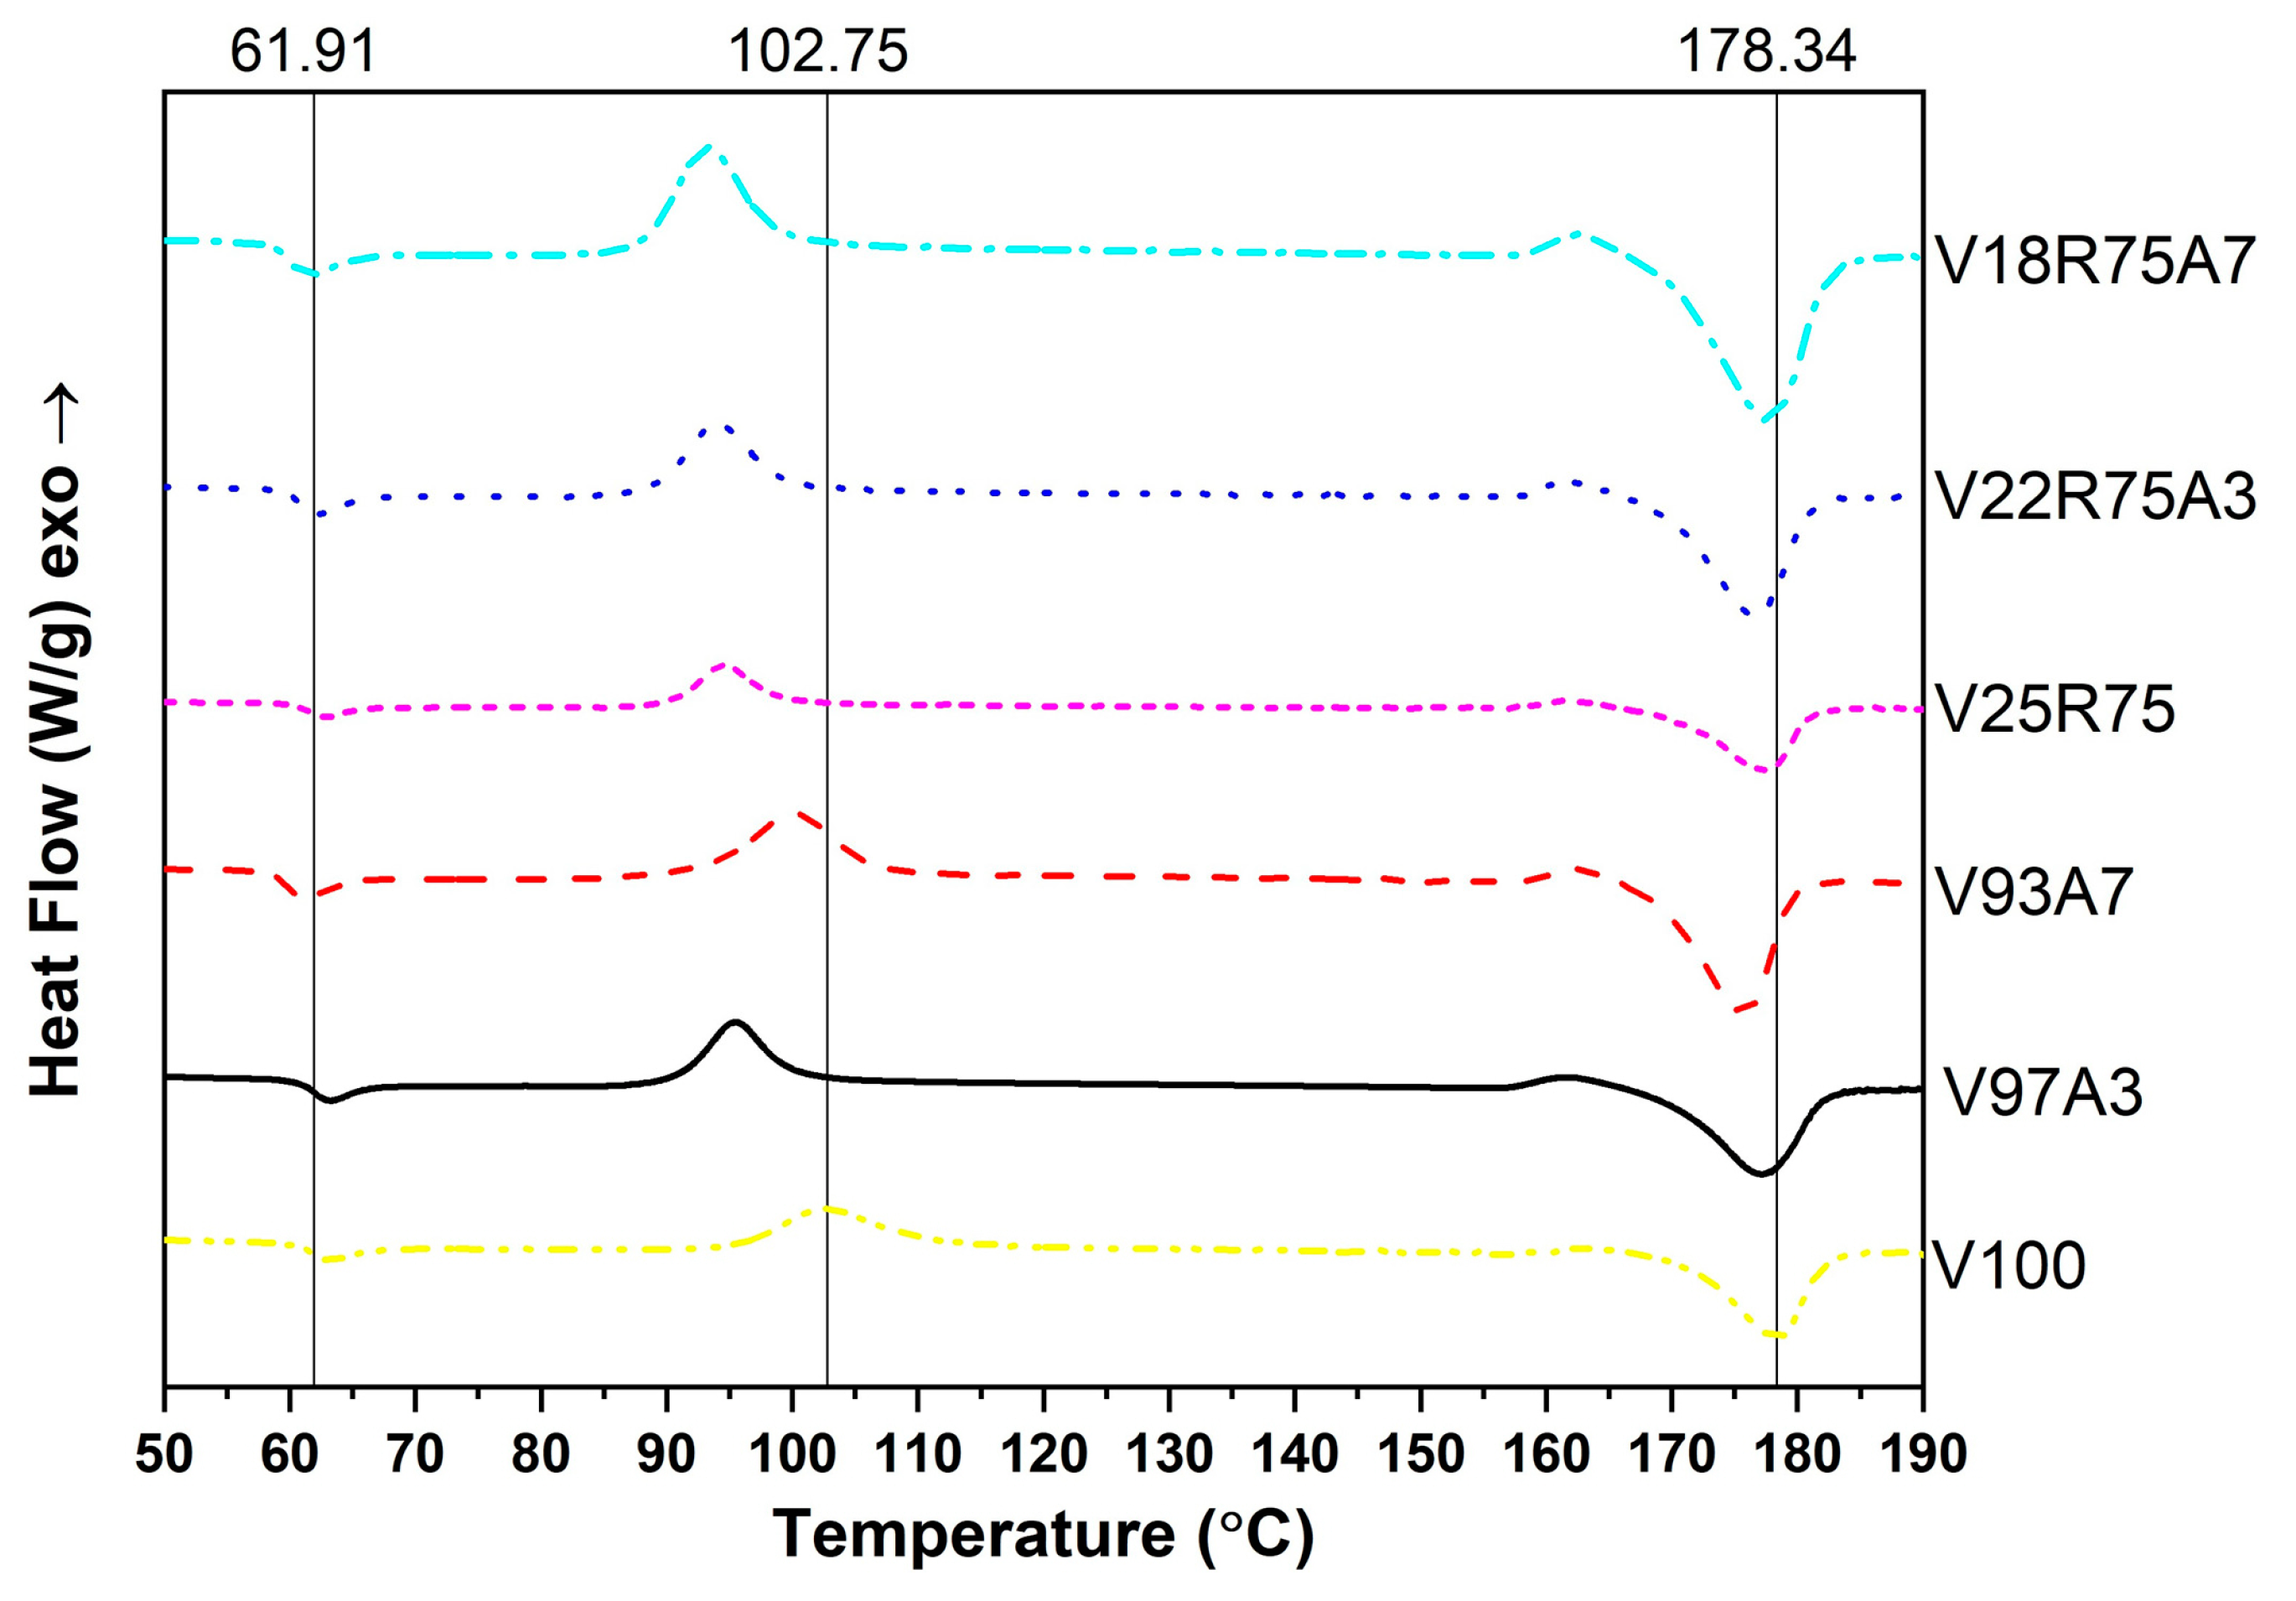
3.3. Differential Scanning Calorimetry

Table 6 and Figure 7 illustrate the results of the DSC test. They show that Tg appears to have a value between 60 and 62 °C and does not change much from sample to sample. This conclusion also applies to Tm. Otherwise, Tc is higher for virgin PLA samples than rPLA samples. The reduction of Tc can be attributed to the higher mobility of the polymer chain due to the reduced molecular weight in V25R75 and their nanocomposites [33].
The degree of crystallinity Xc was quantified according to [34,35,36,37] as:
Xc = (∆Hm − ∆Hc)/∆H∗ × 100
where ΔH∗ = 93 J/g and denotes the enthalpy of fusion for an infinitely large crystal [8].
Comparing the crystallinity degree Xc of V100 and V25R75, the higher crystallinity of the PLA mixture can be noticed. This could be attributed to the fact that the recycled part of V25R75 has molecules with shortened molecular chains, as was mentioned earlier, that can organize crystals easier. For both groups of nanocomposites, PLA and rPLA, there is a clear trend: the reduction in crystallinity when increasing the nanoparticle concentration. As mentioned in Section 3.1, nanoparticles form agglomerations, which can restrict the mobility of PLA macromolecules and the formation of crystals. In this study, the TiO2 nanofiller has no significant influence on the Tg and Tm temperatures but affects the mobility of macromolecular chains in all investigated samples. Similar results were observed by [22,23,38].

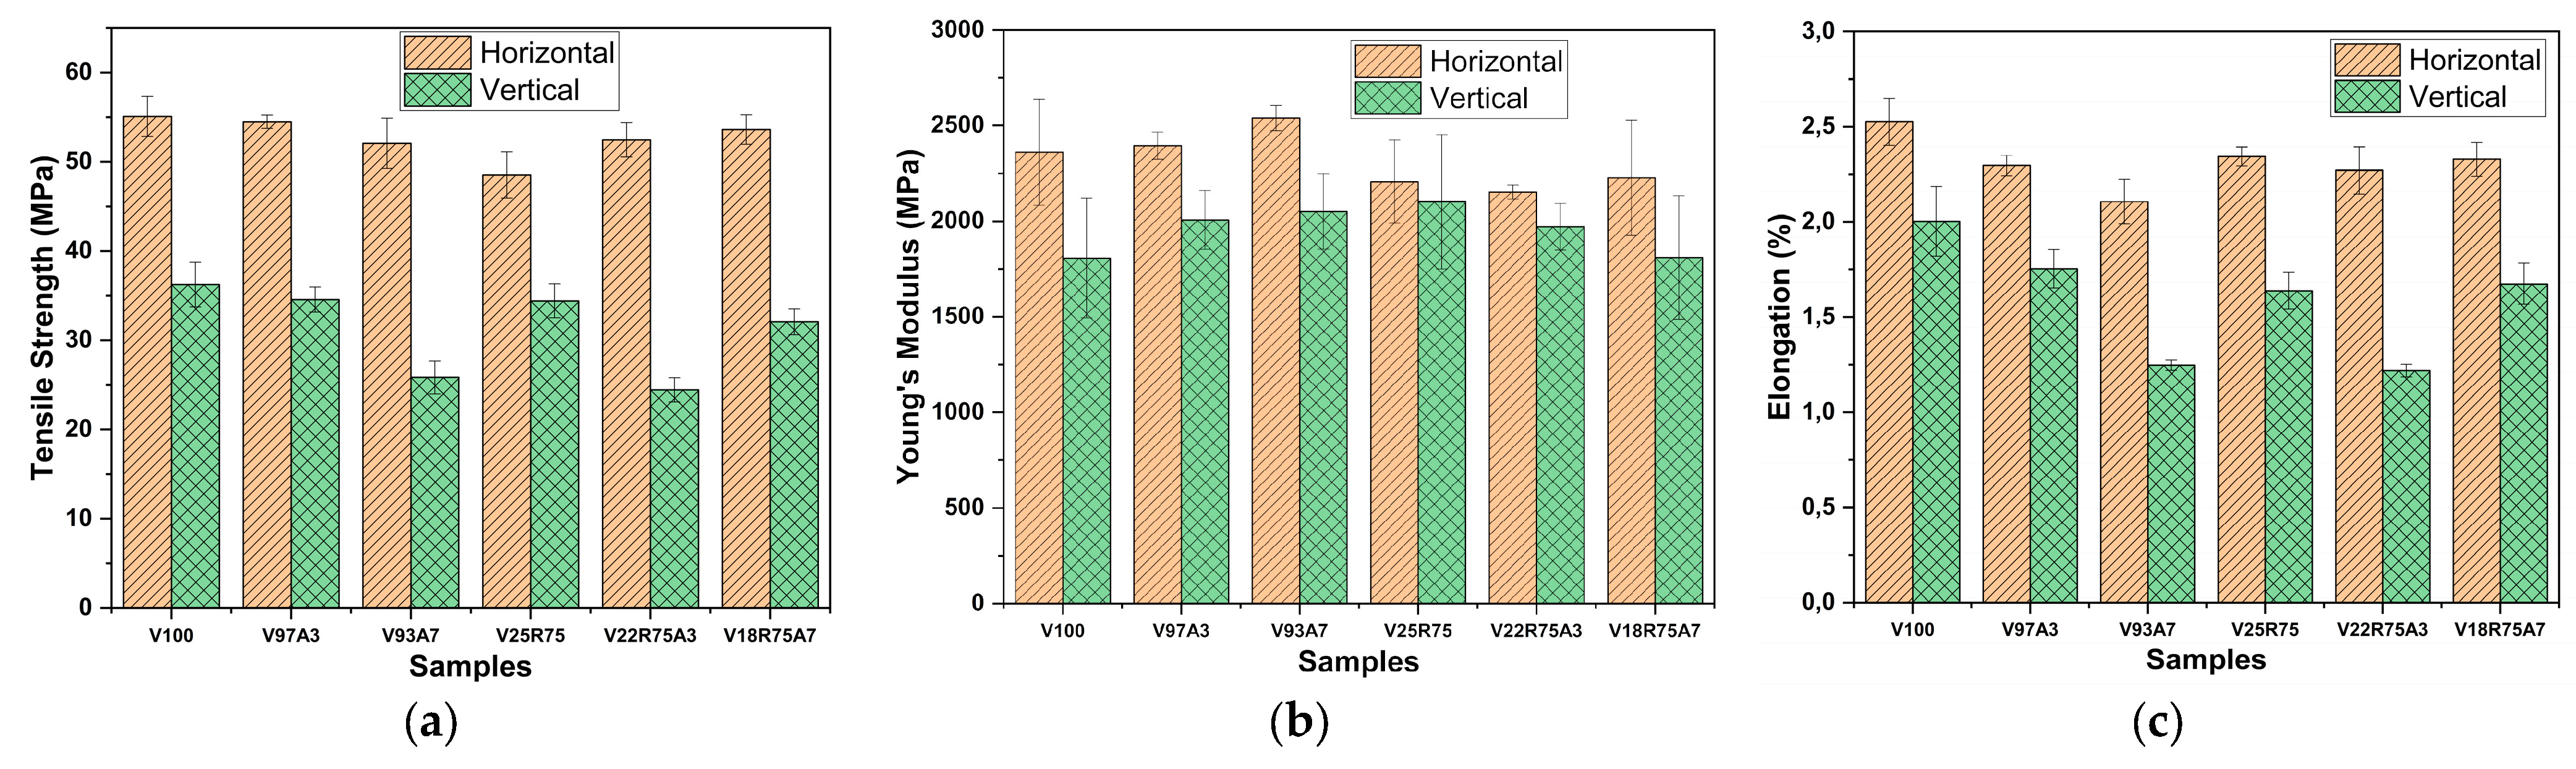
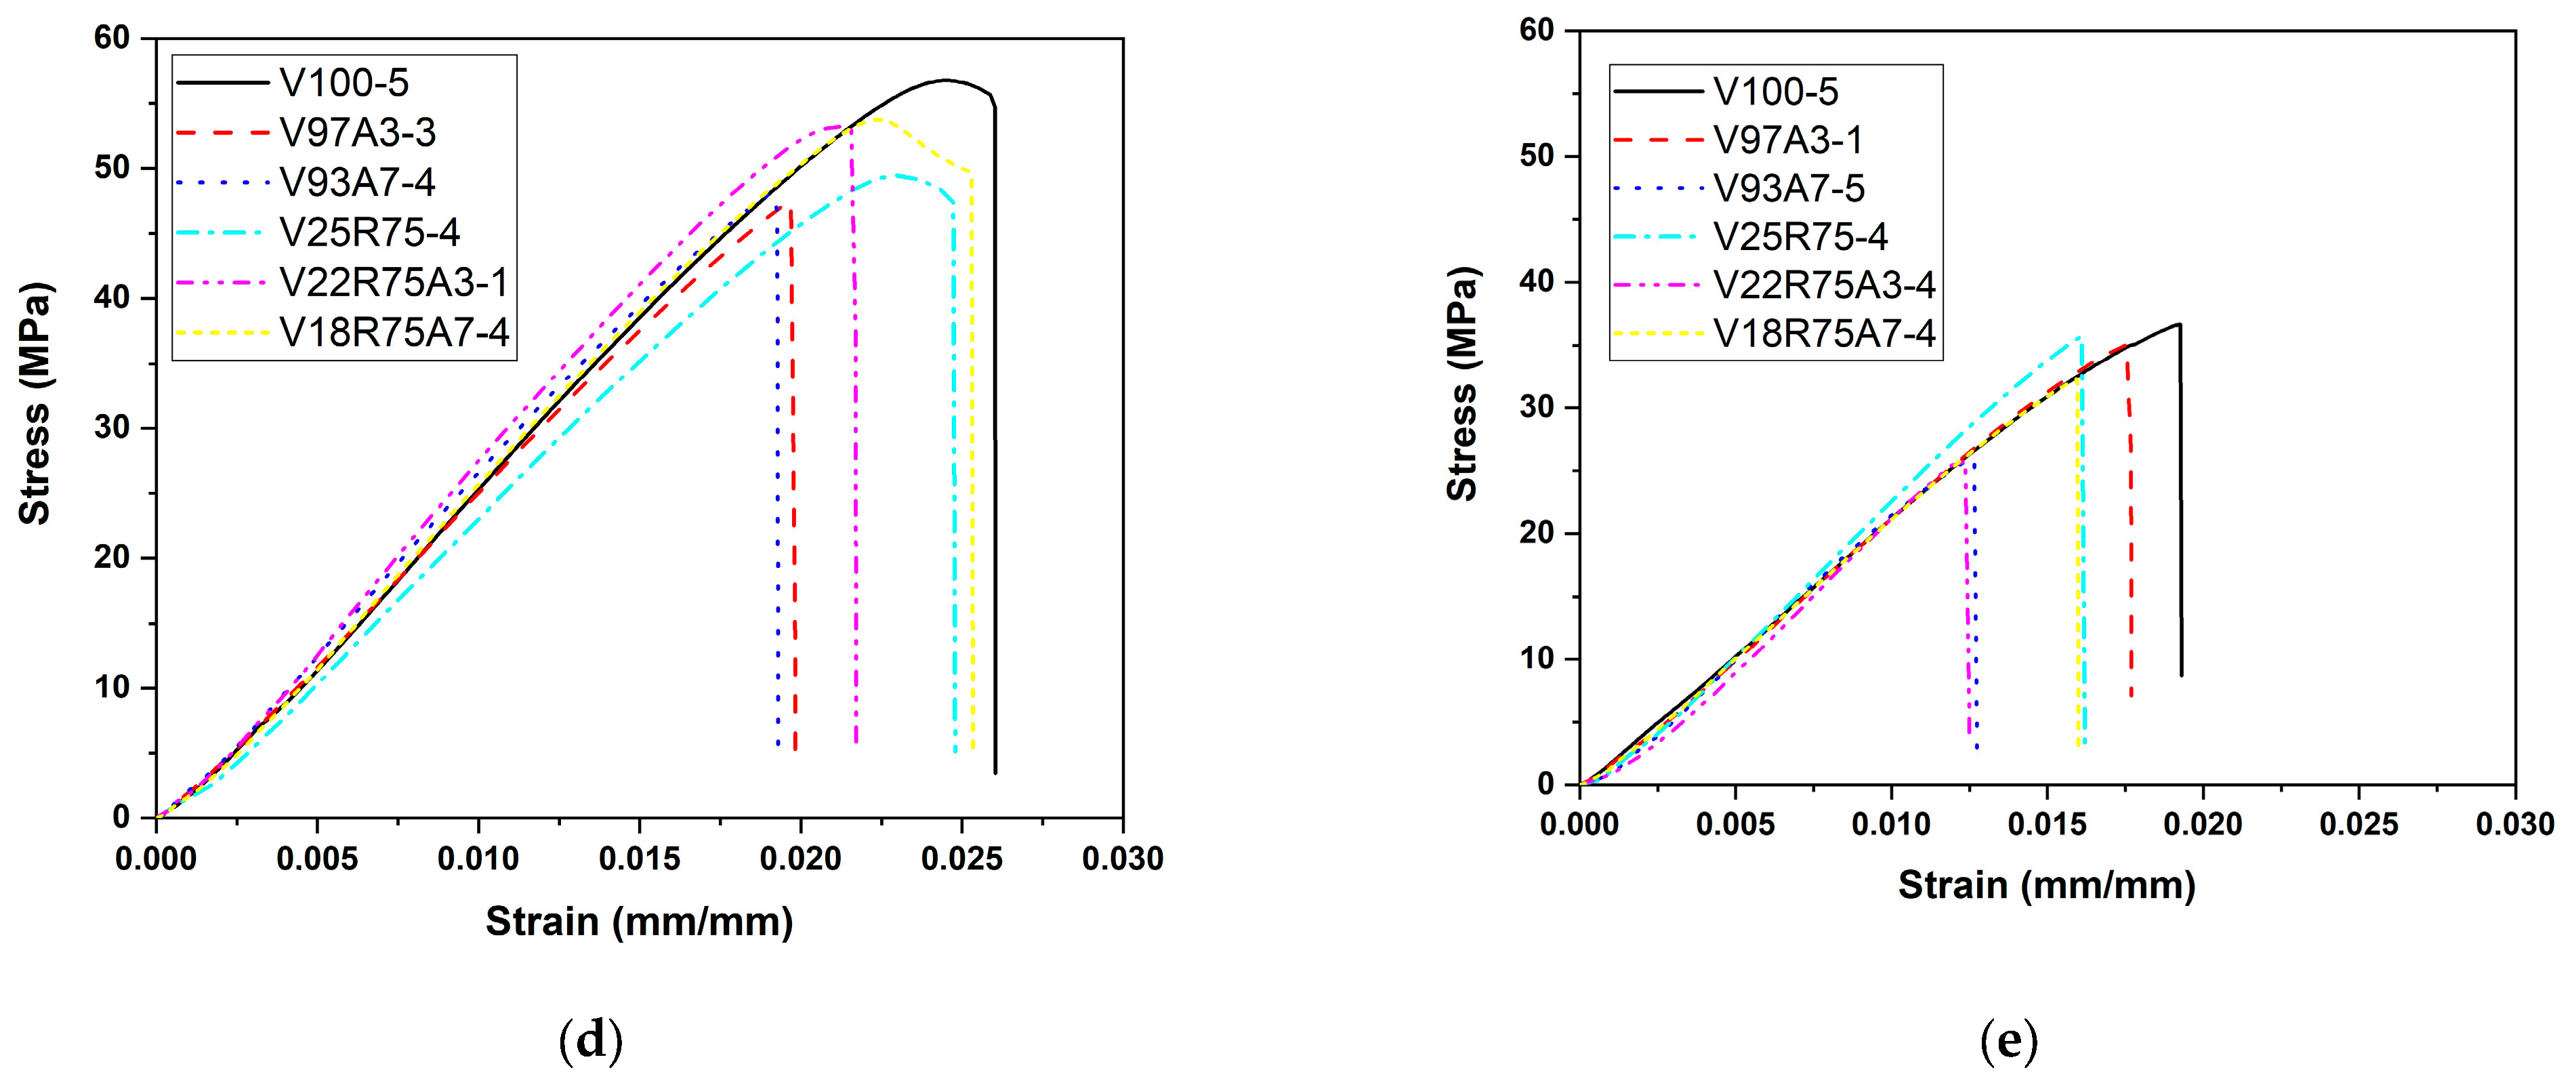
3.4. Tensile Testing

In this study, all samples were printed in both horizontal and vertical orientations. The tensile strength of V100 is 55.100 ± 2.243 MPa, which is higher than that of V25R75, which is 48.535 ± 2.590 MPa in horizontal printed samples. The reduction in tensile strength after 3D printing reprocessing was also observed by Anderson [8] and Cruz Sanchez et al. [17]. This can be explained by the tendency of PLA to undergo degradation during thermal processing from the molten state, giving a rapid reduction of molecular weight [39], which was seen in Section 3.3.
Nanocomposites from 100% rPLA were not produced because previous experiments conducted with 100% rPLA samples (not considered in this study) resulted in a drastic drop in the vertical tensile strength of almost half of that for V100, from 36.242 ± 2.512 MPa to 18.675 ± 0.711 MPa. In contrast, the tensile strength in the vertical direction of V25R75 stayed almost the same as V100. This was the reason for considering TiO2 nanocomposites with a maximum content of 75% rPLA in this work. This difference in the tensile strength of rPLA and V25R75 can be explained by the fact that the strength acquired by the vertical specimen can be considered to be due to the adhesion strength between layers [40]. The strength of printed parts depends on the strength of the used thermoplastic filament and the bond strength between layers [41]. Thus, it can be concluded that short molecular chains in rPLA cannot form strong interlayer adhesion during printing compared with V25R75 with long and short flexible molecular chains, which have more robust molecular entanglement.
The results presented in Figure 8 show that the addition of nanoparticles to pure PLA reduces the tensile strength in both printing directions. Zhang et al. [22] revealed that adding nano-TiO2 to injection-molded samples up to 2 wt% slightly shifts tensile strength to a higher value than pure PLA. However, when the TiO2 content is greater than or equal to 2 wt%, the nanocomposites show a lower tensile strength than neat PLA. At high loading, the lack of strong interaction between polymer and particles due to filler aggregation resulted in debonding of the particles at lower tensile stress and a subsequent premature yield [14]. So, it can be said that adding 3–7% of nanoparticles to pure 3D-printed PLA is too much to enhance the mechanical properties of nanocomposites. This is due to the nano-TiO2 agglomerations, seen in Section 3.2, which restrict the movement of the polymer chains in the composites.
On the other hand, positive dynamics can be observed due to the addition of nanoparticles to a mixture of pure and reprocessed polymers. The tensile strengths of V22R75A3 and V18R75A7 increase from 48.535 ± 2.590 MPa to 52.470 ± 1.916 and 53.622 ± 1.651 MPa in the horizontal printing direction, respectively. These results show that the tensile strength in XY orientation of nanocomposites from the mixture of virgin and rPLA reaches the same value as V100. In the vertical direction, the tensile strength of V18R75A7 is almost the same as V25R75, considering the standard deviation. Hence, nanocomposite from PLA and rPLA with 7% TiO2 has almost the same tensile strength as specimens manufactured through FGF from 100% PLA. The formation of two new bonds can explain it. First, according to the published research, there are many hydroxyl groups (Ti–OH) covering the surface region of TiO2 nanoparticles, which could form a strong interfacial bond (Ti–O–C) with the carbonyl groups of PLA [22]. In this sense, compared with V100, V25R75 would have increased the concentration of carboxylic acid end groups in the degradation medium because of chain scission in recycled PLA [39]. Secondly, Zhang [13] reported the increasing number of hydrogen bonds being formed between the titanium hydroxyl and hydroxyl groups of the PLA matrix. That is why it can be concluded that the molecular chains of the mixture with rPLA have more hydroxyl and carbonyl end groups that can form strong internal friction (interaction) between nanoparticles in the matrix of V18R75A7, hence enhancing tensile strength. Also, it was mentioned in Section 3.1 that V18R75A7 has a lower agglomeration size than V93A7 and V22R75A3, which may be the reason for its slightly higher strength.
According to Figure 8b, the Young’s Modulus of V97A3 and V93A7 rises when increasing the TiO2 content in both printing directions, while this effect is not observed in nanocomposites with rPLA. Considering the standard deviation, the Young’s Modulus of nanocomposites from neat and rPLA is approximately the same as the reference sample in both XY and XZ orientations. It must be mentioned that V93A7 has the highest value of Young’s Modulus among all the studied samples.
The values of elongation presented in Figure 8c follow a similar tendency as the tensile strength for all the samples, with the only exception of the horizontal rPLA sample series, in which ductility does not vary with the addition of TiO2. Therefore, ductility is generally reduced when adding nanoparticles, making them more brittle.

4. Conclusions

This study investigates the preparation and the thermal, mechanical, and structural characterization of six polymer blends for FGF additive manufacturing: pure PLA, a mixture of 25% pure and 75% reprocessed PLA, and their nanocomposites with 3 and 7% TiO2. From the derived results, the following can be concluded:
  • Regarding the manufacturing of the granules, the extruder’s technical setup varies for every granule type and is experimentally established. The screw speed varies from 130 rpm for a mixture of 25% PLA and 75% rPLA to 100 rpm for nanocomposites based on rPLA.
  • The printing parameters were established experimentally too. The multiplier values for horizontal and vertical printed samples change from 0.16 for PLA to 0.27 for the mixture of PLA and rPLA. Other printing parameters were constant.
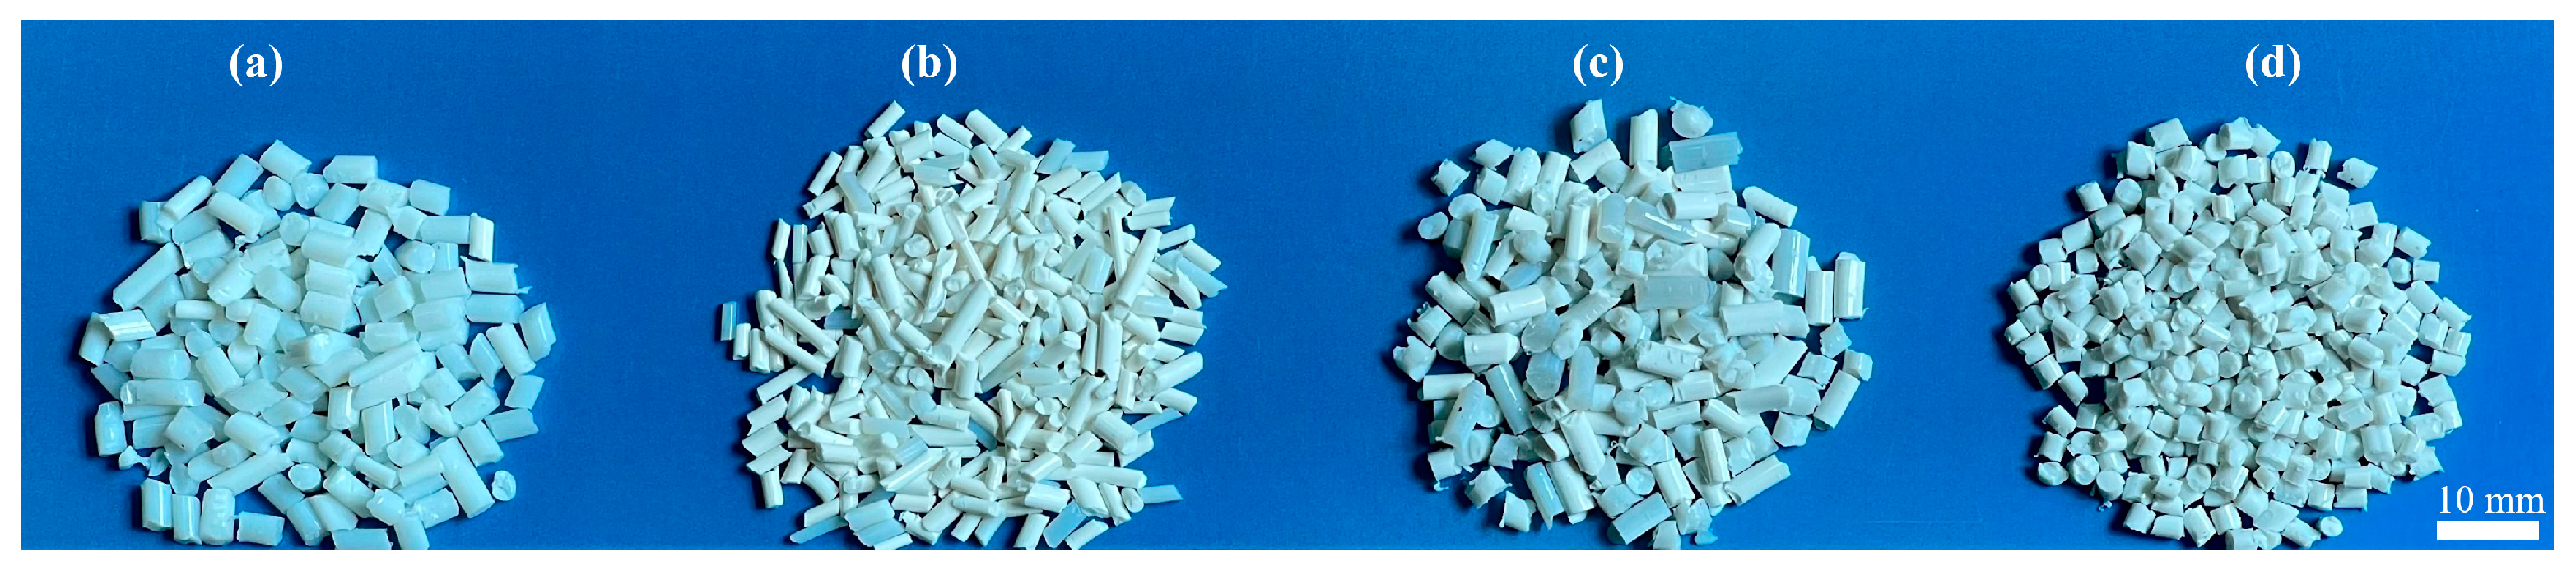
  • All granules showed good flowability and printable quality.
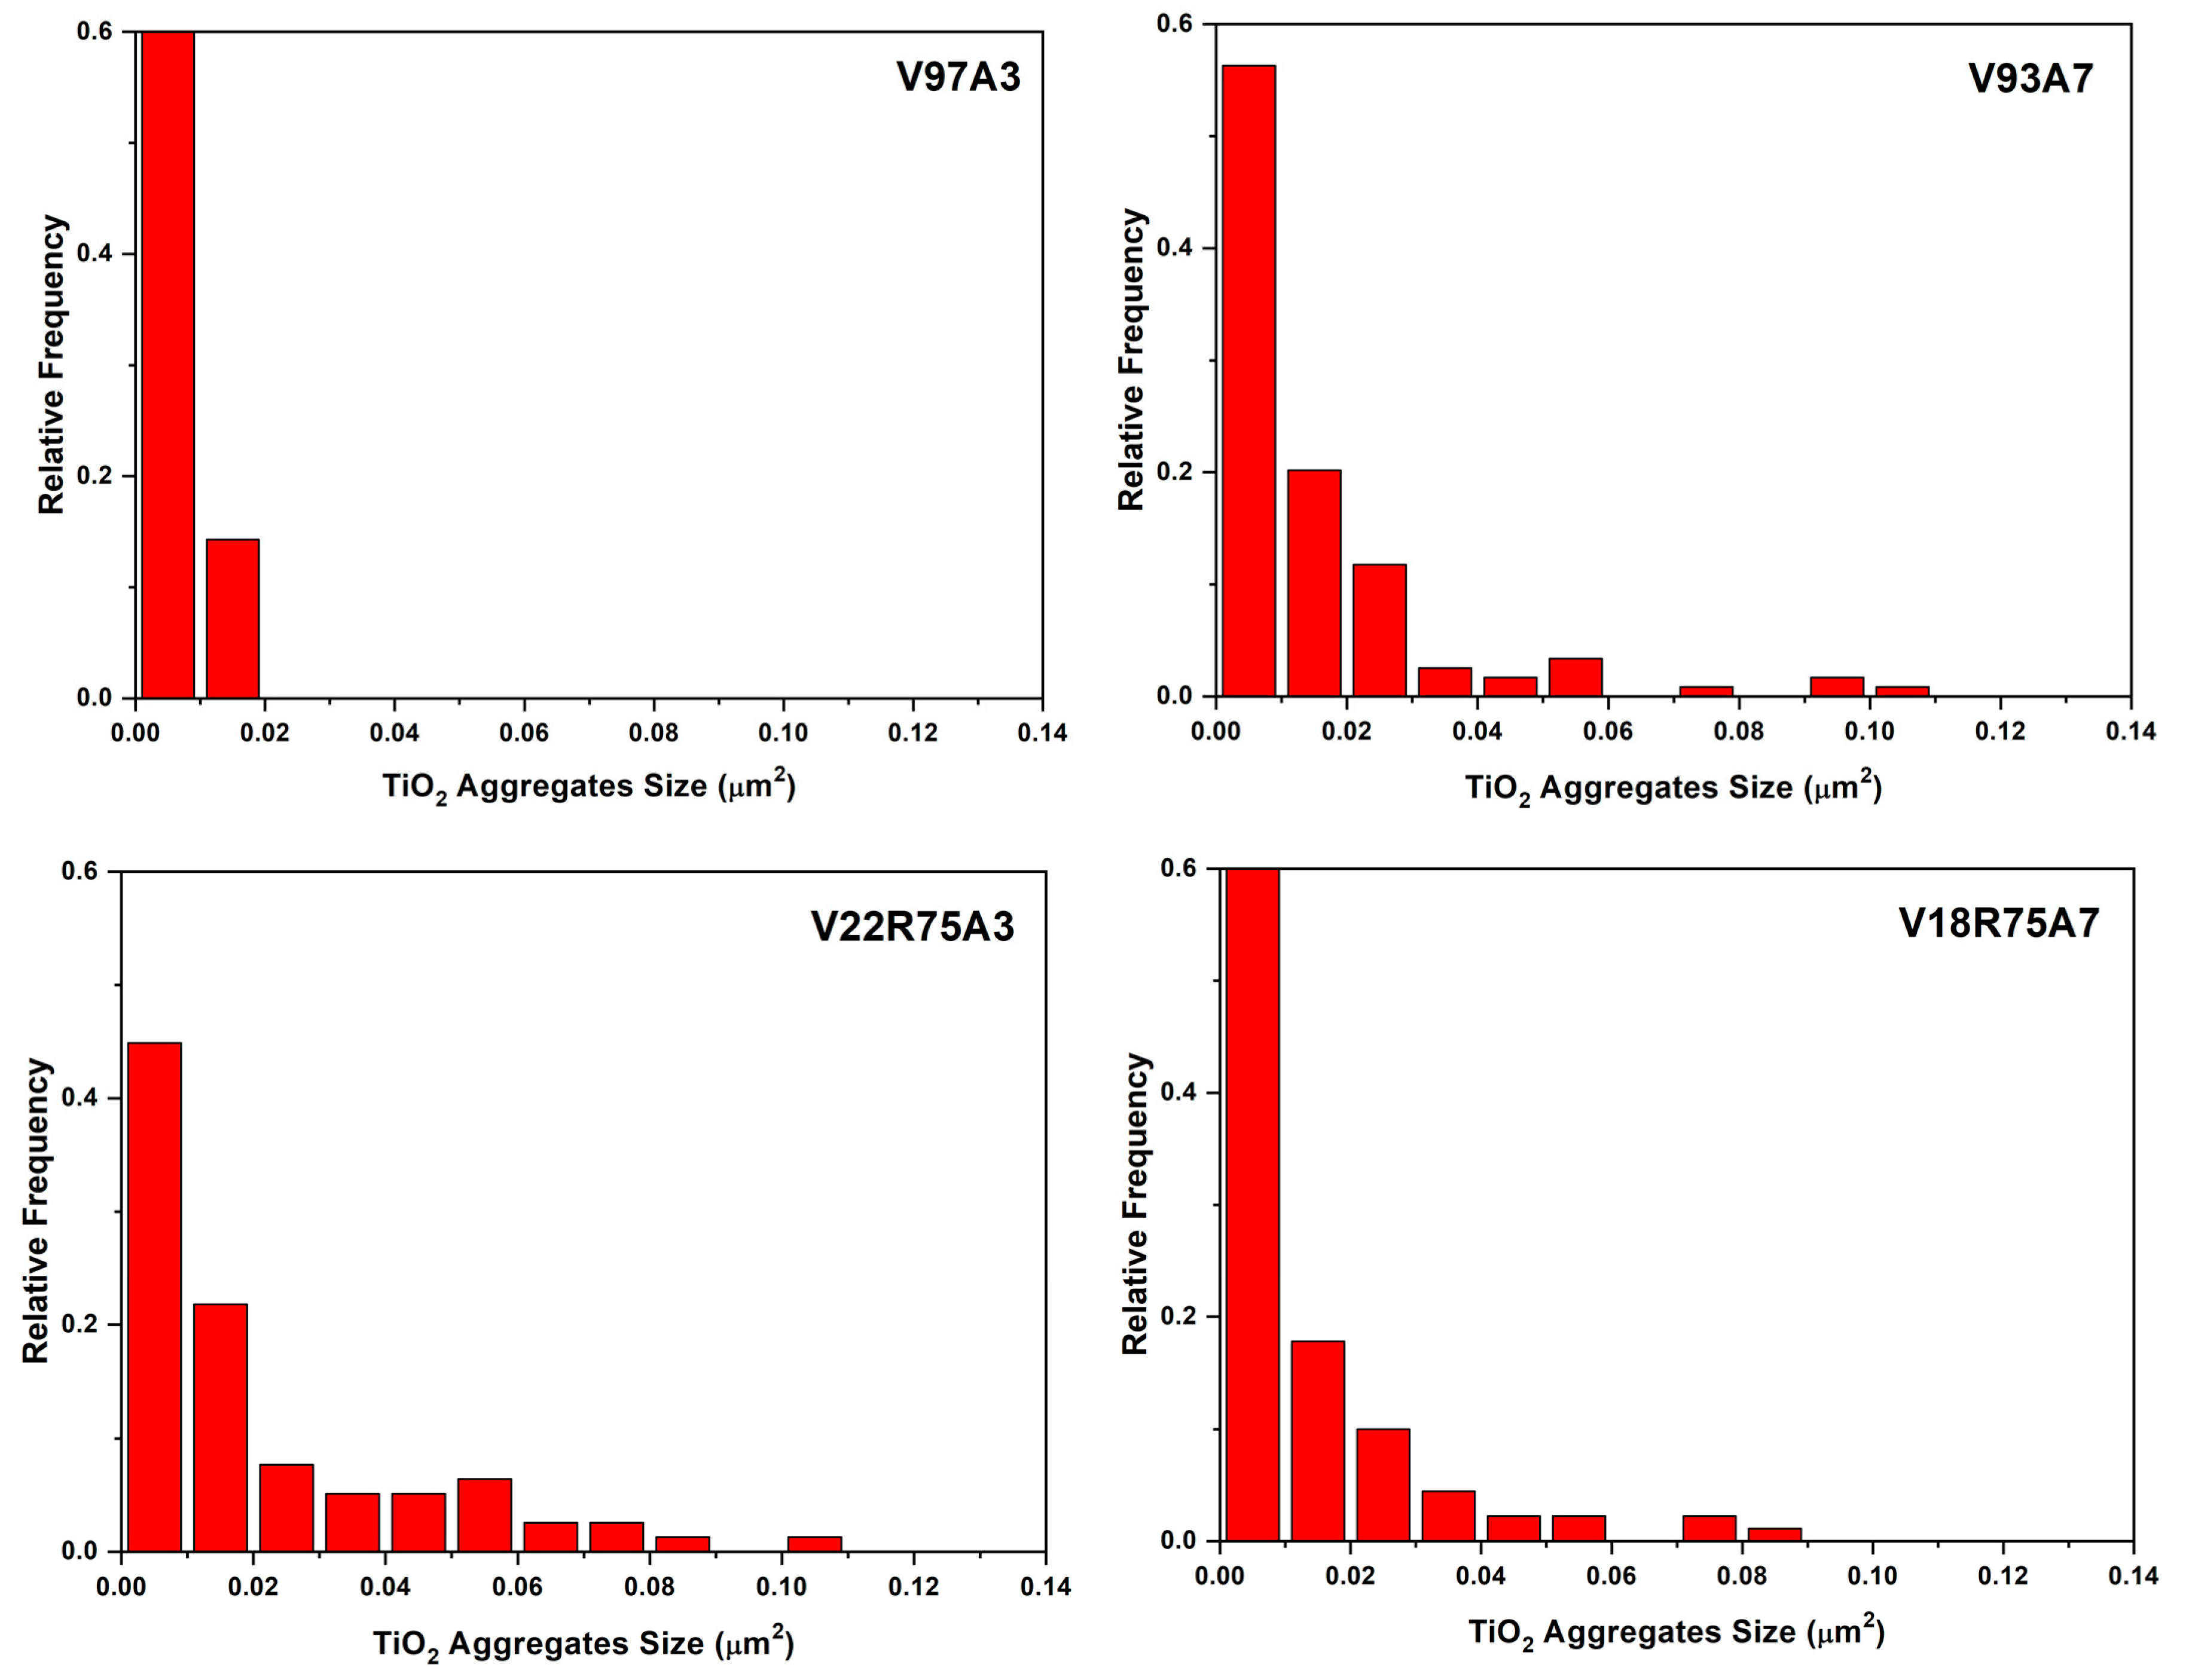
  • Even though all blends showed nanoparticle agglomerations, they were uniformly distributed.
  • The thermal stability has a rising tendency when increasing the additive’s content. The T5%loss rises by 10 °C for nanocomposites with 7% TiO2 compared with PLA.
  • The crystallization temperature and degree of crystallinity of nanocomposites decreased with the addition of TiO2. For example, PLA has a degree of crystallinity of about 15%, the nanocomposite with 3% TiO2 is 11%, and the one with 7% TiO2 is 9%. The same tendency can be seen for samples with reprocessed PLA, so the mixture of PLA and rPLA has a degree of crystallinity of about 20%, the nanocomposite with 3% TiO2 is 15%, and the one with 7% TiO2 is 10%.
  • Tensile testing showed that adding nanoparticles to pure PLA reduces the tensile strength and increases the Young’s Modulus in both printing directions. However, this effect is not observed in nanocomposites with rPLA. Nanocomposite from primary and secondary PLA with 7% nano-TiO2 has almost the same mechanical characteristics as PLA.
In summary, FGF nanocomposites based on a blend of virgin and recycled PLA with titanium dioxide nanoparticles are excellent options for improving recycled PLA’s tensile strength and thermal stability and adding functionalities to the material. Future research will be aimed at checking the resistance of the produced nanocomposites to UV degradation and their antibacterial activity.

Author Contributions

Conceptualization, S.B., D.L.S. and S.I.M.; methodology, S.B., D.L.S. and S.I.M.; validation, D.L.S., A.Z. and S.I.M.; formal analysis, S.B., D.L.S. and N.F.D.; investigation, S.B., J.M.J.C., P.B.P., P.M.G. and N.F.D.; resources, D.L.S. and S.I.M.; data curation, S.B., D.L.S. and N.F.D.; writing—original draft preparation, S.B., J.M.J.C., P.B.P., P.M.G. and N.F.D.; writing—review and editing, D.L.S., A.Z. and S.I.M.; visualization, S.B., D.L.S. and N.F.D.; supervision, D.L.S. and S.I.M.; project administration, D.L.S. and S.I.M.; funding acquisition, D.L.S. and S.I.M. All authors have read and agreed to the published version of the manuscript.

Funding

This research was funded by JUNTA DE ANDALUCÍA (Research group INNANOMAT), ref. TEP-946, and the University of Cadiz’s Support and Stimulus Plan for Research and Transfer, 2022–2023. Co-funding from UE is also acknowledged. Grants for joint supervision of doctoral theses for the year 2019 from the Hispano-Russian Centre of the University of Cádiz were used by S. Bergaliyeva.

Institutional Review Board Statement

Not applicable.

Informed Consent Statement

Not applicable.

Data Availability Statement

Data are available upon reasonable request by contacting the corresponding author.

Acknowledgments

The authors acknowledge R. González for her lab support and the University of Cadiz’s Scientific and Technological Research Central Services (SC-ICYT). S. Bergaliyeva thanks the CUNEAC office at UCA for the studentship grant.

Conflicts of Interest

The authors declare no conflict of interest.

References

  1. Sasse, J.; Pelzer, L.; Schön, M.; Ghaddar, T.; Hopmann, C. Investigation of Recycled and Coextruded PLA Filament for Additive Manufacturing. Polymers 2022, 14, 2407. [Google Scholar] [CrossRef]
  2. Patel, A.; Taufik, M. Extrusion-Based Technology in Additive Manufacturing: A Comprehensive Review. Arab. J. Sci. Eng. 2022, 1–34. [Google Scholar] [CrossRef]
  3. Marchewka, J.; Laska, J. Processing of poly-l-lactide and poly(l-lactide-co-trimethylene carbonate) blends by fused filament fabrication and fused granulate fabrication using RepRap 3D printer. Int. J. Adv. Manuf. Technol. 2020, 106, 4933–4944. [Google Scholar] [CrossRef]
  4. Bellini, A.; Shor, L.; Guceri, S.I. New developments in fused deposition modeling of ceramics. Rapid Prototyp. J. 2005, 11, 214–220. [Google Scholar] [CrossRef]
  5. Duty, C.E.; Kunc, V.; Compton, B.; Post, B.; Erdman, D.; Smith, R.; Lind, R.; Lloyd, P.; Love, L. Structure and mechanical behavior of Big Area Additive Manufacturing (BAAM) materials. Rapid Prototyp. J. 2017, 23, 181–189. [Google Scholar] [CrossRef]
  6. Nieto, D.M.; López, V.C.; Molina, S.I. Large-format polymeric pellet-based additive manufacturing for the naval industry. Addit. Manuf. 2018, 23, 79–85. [Google Scholar] [CrossRef]
  7. Yakdoumi, F.Z.; Hadj-Hamou, A.S. Effectiveness assessment of TiO2-Al2O3 nano-mixture as a filler material for improvement of packaging performance of PLA nanocomposite films. J. Polym. Eng. 2020, 40, 848–858. [Google Scholar] [CrossRef]
  8. Anderson, I.; Raza, I.; Iannucci, L.; Curtis, P.T.; Ruppert, D.S.; Harrysson, O.L.; Marcellin-Little, D.J.; Abumoussa, S.; Dahners, L.E.; Weinhold, P.S.; et al. Mechanical Properties of Specimens 3D Printed with Virgin and Recycled Polylactic Acid. 3D Print. Addit. Manuf. 2017, 4, 110–115. [Google Scholar] [CrossRef]
  9. Mofokeng, J.P.; Luyt, A.S. Dynamic mechanical properties of PLA/PHBV, PLA/PCL, PHBV/PCL blends and their nanocomposites with TiO2 as nanofiller. Thermochim. Acta 2015, 613, 41–53. [Google Scholar] [CrossRef]
  10. Zhuang, W.; Liu, J.; Zhang, J.H.; Hu, B.X.; Shen, J. Preparation, characterization, and properties of TiO2/PLA nanocomposites by in situ polymerization. Polym. Compos. 2009, 30, 1074–1080. [Google Scholar] [CrossRef]
  11. Beltr, F.R.; Arrieta, M.P.; Elena, D.; Lozano-p, A.A.; Cenis, J.L.; Gaspar, G.; De, U. Effect of Yerba Mate and Silk Fibroin Nanoparticles on the Migration Properties in Ethanolic Food Simulants and Composting Disintegrability of Recycled PLA Nanocomposites. Polymers 2021, 13, 1925. [Google Scholar] [CrossRef] [PubMed]
  12. Ranakoti, L.; Gangil, B.; Mishra, S.K.; Singh, T.; Sharma, S.; Ilyas, R.; El-Khatib, S. Critical Review on Polylactic Acid: Properties, Structure, Processing, Biocomposites, and Nanocomposites. Materials 2022, 15, 4312. [Google Scholar] [CrossRef] [PubMed]
  13. Zhang, Q.; Li, D.; Zhang, H.; Su, G.; Li, G. Preparation and properties of poly(lactic acid)/sesbania gum/nano-TiO2 composites. Polym. Bull. 2018, 75, 623–635. [Google Scholar] [CrossRef]
  14. Meng, B.; Tao, J.; Deng, J.; Wu, Z.; Yang, M. Toughening of polylactide with higher loading of nano-titania particles coated by poly(ε-caprolactone). Mater. Lett. 2011, 65, 729–732. [Google Scholar] [CrossRef]
  15. Yerezhep, D.; Tychengulova, A.; Sokolov, D.; Aldiyarov, A. A Multifaceted Approach for Cryogenic Waste Tire Recycling. Polymers 2021, 13, 2494. [Google Scholar] [CrossRef] [PubMed]
  16. Peinado, V.; Castell, P.; García, L.; Fernández, Á. Effect of Extrusion on the Mechanical and Rheological Properties of a Reinforced Poly(Lactic Acid): Reprocessing and Recycling of Biobased Materials. Materials 2015, 8, 7106–7117. [Google Scholar] [CrossRef]
  17. Cruz Sanchez, F.A.; Boudaoud, H.; Hoppe, S.; Camargo, M. Polymer recycling in an open-source additive manufacturing context: Mechanical issues. Addit. Manuf. 2017, 17, 87–105. [Google Scholar] [CrossRef]
  18. Babagowda; Math, R.K.; Goutham, R.; Prasad, K.S. Study of Effects on Mechanical Properties of PLA Filament which is blended with Recycled PLA Materials. IOP Conf. Series Mater. Sci. Eng. 2018, 310, 012103. [Google Scholar] [CrossRef]
  19. Hassan, T.; Salam, A.; Khan, A.; Khan, S.U.; Khanzada, H.; Wasim, M.; Khan, M.Q.; Kim, I.S. Functional nanocomposites and their potential applications: A review. J. Polym. Res. 2021, 28, 36. [Google Scholar] [CrossRef]
  20. Roussenova, M.; Hughes, D.; Enrione, J.; Diaz-Calderon, P.; Sivaniah, E.; Song, Q.; Ubbink, J.; Beavis, P.; Swain, A.; Alam, M. Free Volume, Molecular Mobility and Polymer Structure: Towards the Rational Design of Multi-Functional Materials. Acta Phys. Pol. A 2014, 125, 801–805. [Google Scholar] [CrossRef]
  21. Reijnders, L. The release of TiO2 and SiO2 nanoparticles from nanocomposites. Polym. Degrad. Stab. 2009, 94, 873–876. [Google Scholar] [CrossRef]
  22. Zhang, H.; Huang, J.; Yang, L.; Chen, R.; Zou, W.; Lin, X.; Qu, J. Preparation, characterization and properties of PLA/TiO2 nanocomposites based on a novel vane extruder. RSC Adv. 2015, 5, 4639–4647. [Google Scholar] [CrossRef]
  23. Buzarovska, A.; Grozdanov, A. Biodegradable poly(L-lactic acid)/TiO2 nanocomposites: Thermal properties and degradation. J. Appl. Polym. Sci. 2011, 123, 2187–2193. [Google Scholar] [CrossRef]
  24. Nakayama, N.; Hayashi, T. Preparation and characterization of poly(l-lactic acid)/TiO2 nanoparticle nanocomposite films with high transparency and efficient photodegradability. Polym. Degrad. Stab. 2007, 92, 1255–1264. [Google Scholar] [CrossRef]
  25. Thumsorn, S.; Prasong, W.; Kurose, T.; Ishigami, A.; Kobayashi, Y.; Ito, H. Rheological Behavior and Dynamic Mechanical Properties for Interpretation of Layer Adhesion in FDM 3D Printing. Polymers 2022, 14, 2721. [Google Scholar] [CrossRef]
  26. Nieto, D.M.; Molina, S.I. Large-format fused deposition additive manufacturing: A review. Rapid Prototyp. J. 2020, 26, 793–799. [Google Scholar] [CrossRef]
  27. NatureWorks Ingeo TM Biopolymer 3D850 Technical Data Sheet 3D Printing Monofilament—General Purpose Grade. Available online: https://www.unicgroup.com/wp-content/uploads/2019/12/3D850.pdf (accessed on 1 January 2023).
  28. ISO/TC 61/SC 2; Mechanical Behavior ISO 527-1:2019 Plastics—Determination of Tensile Properties—Part 1: General Principles. ISO: Geneva, Switzerland, 2019; Volume 26.
  29. ISO/TC 61/SC 2; Mechanical behavior ISO 527-2:2012 Plastics—Determination of Tensile Properties—Part 2: Test Conditions for Moulding and Extrusion Plastics. ISO: Geneva, Switzerland, 2012; Volume 2012, p. 11.
  30. Schneider, C.A.; Rasband, W.S.; Eliceiri, K.W. NIH Image to ImageJ: 25 Years of image analysis. Nat. Methods 2012, 9, 671–675. [Google Scholar] [CrossRef]
  31. ISO/TC 61/SC 5; Physical-Chemical Properties ISO 11357-1:2016 Plastics—Differential Scanning Calorimetry (DSC)—Part 1: General Principles. ISO: Geneva, Switzerland, 2016; Volume 33.
  32. ISO/TC 61/SC 5; Physical-Chemical Properties ISO 11358-1:2014 Plastics—Thermogravimetry (TG) of Polymers—Part 1: General Principles. ISO: Geneva, Switzerland, 2014; Volume 1, p. 9.
  33. Dubois, P.; Zhang, J.; Jérôme, R.; Teyssié, P. Macromolecular engineering of polylactones and polylactides: 13. Synthesis of telechelic polyesters by coupling reactions. Polymer 1994, 35, 4998–5004. [Google Scholar] [CrossRef]
  34. Beltrán, F.; Lorenzo, V.; Acosta, J.; de la Orden, M.; Urreaga, J.M. Effect of simulated mechanical recycling processes on the structure and properties of poly(lactic acid). J. Environ. Manag. 2018, 216, 25–31. [Google Scholar] [CrossRef]
  35. Żenkiewicz, M.; Richert, J.; Rytlewski, P.; Moraczewski, K.; Stepczyńska, M.; Karasiewicz, T. Characterisation of multi-extruded poly(lactic acid). Polym. Test. 2009, 28, 412–418. [Google Scholar] [CrossRef]
  36. Pluta, M.; Galeski, A.; Alexandre, M.; Paul, M.-A.; Dubois, P. Polylactide/montmorillonite nanocomposites and microcomposites prepared by melt blending: Structure and some physical properties. J. Appl. Polym. Sci. 2002, 86, 1497–1506. [Google Scholar] [CrossRef]
  37. Nam, P.H.; Maiti, P.; Okamoto, M.; Kotaka, T.; Hasegawa, N.; Usuki, A. A hierarchical structure and properties of intercalated polypropylene/clay nanocomposites. Polymer 2001, 42, 9633–9640. [Google Scholar] [CrossRef]
  38. Luo, Y.-B.; Li, W.-D.; Wang, X.-L.; Xu, D.-Y.; Wang, Y.-Z. Preparation and properties of nanocomposites based on poly(lactic acid) and functionalized TiO2. Acta Mater. 2009, 57, 3182–3191. [Google Scholar] [CrossRef]
  39. Gorrasi, G.; Pantani, R. Hydrolysis and Biodegradation of Poly(lactic acid). In Synthesis, Structure and Properties of Poly(lactic acid); Springer International Publishing: Cham, Switzerland, 2018. [Google Scholar] [CrossRef]
  40. Prasong, W.; Ishigami, A.; Thumsorn, S.; Kurose, T.; Ito, H. Improvement of Interlayer Adhesion and Heat Resistance of Biodegradable Ternary Blend Composite 3D Printing. Polymers 2021, 13, 740. [Google Scholar] [CrossRef] [PubMed]
  41. Wickramasinghe, S.; Do, T.; Tran, P. FDM-Based 3D Printing of Polymer and Associated Composite: A Review on Mechanical Properties, Defects and Treatments. Polymers 2020, 12, 1529. [Google Scholar] [CrossRef]
Figure 1. Pellets from different nanocomposites: (a) V97A3; (b) V93A7; (c) V22R75A3; (d) V18R75A7.
Polymers 15 03458 g001
Figure 2. Horizontal and vertical plates of size 150 × 90 × 2 mm (first two on the right, respectively) and examples of specimens for tensile tests in the XY and XZ orientations (last two on the left, respectively).
Polymers 15 03458 g002
Figure 3. SEM images showing the topography of fracture surfaces of the FGF printed samples: (a) V100; (b) V97A3; (c) V93A7; (d) V25R75; (e) V22R75A3; (f) V18R75A7. Flat surfaces with small steps, typical of brittle fracture, are shown in all samples. The deposited beads can also be distinguished.
Polymers 15 03458 g003
Figure 4. TiO2 nanoparticles and their aggregates are shown with a brighter contrast in the secondary electron SEM images. (a) SEM image of V100 sample; (b) SEM images of V97A3 sample; (c) SEM image of V93A7 sample; (d) EDX spectra of one of the V93A7 zones with TiO2 particles (the inset is an image of the region of the sample where EDX was taken); (e) SEM image of V22R75A3 sample; (f) SEM image of V18R75A7 sample.
Polymers 15 03458 g004
Figure 5. Normalized frequencies of TiO2 aggregates.
Polymers 15 03458 g005
Figure 6. (a) Thermogravimetric curve of PLA and its nanocomposites; (b) Respective derivative thermogram curves.
Polymers 15 03458 g006
Figure 7. Differential scanning calorimetry curves.
Polymers 15 03458 g007
Figure 8. Results of the tensile tests. Average values with error bars of the main mechanical properties: (a) tensile strength, (b) Young’s modulus, and (c) elongation. Strain-stress curves of one of the specimens per batch of (d) the horizontal samples and (e) the vertical samples.
Polymers 15 03458 g008aPolymers 15 03458 g008b
Table 1. Sample name and composition. Letter V stands for virgin polylactide, R for one-time reprocessed polylactide, and A for additives, i.e., titanium dioxide nanoparticles.
Sample DesignationWeight Ratio (%)
Virgin PolylactideReprocessed PolylactideNanoparticles of Titanium Dioxide
V10010000
V97A39703
V93A79307
V25R7525750
V22R75A322753
V18R75A718757
Table 2. Technical data to manufacture reprocessed polylactide, the mixture of neat and reprocessed polylactide, and nanocomposites.
Sample CodeCentral UnitDehumidifierDosimeterWinderPelletizing MachineWork Pressure (Bar)
Screw Speed (rpm)T1 (°C)T2 (°C)T3 (°C)T4 (°C)T5 (°C)Initial Material Temperature (°C)D1 (rpm)D2 (rpm)Winder Speed (m/min)Cutting (rpm)Pull (rpm)
rPLA126180180190200200602.5-2.344323
V97A3130185190190180175601.531.7527207
V93A7130185190190180175600.561.7527207
V25R75130185190190180175601.531.7527208
V22R75A3100185190190180185601.551.2027207
V18R75A7100185190190180185601.551.2048188
Table 3. Three-dimensional printing parameters.
Nozzle Diameter (mm)Bead Width (mm)Layer Height (mm)
221
Table 4. Fused granular fabrication printing parameters.
CompositeMultiplier Horizontal SpecimensMultiplier Vertical SpecimensTemperature of Extruder (°C)Temperature of the Bed (°C)Print Speed Horizontal Specimen (mm/s)Print Speed Vertical Specimen (mm/s)
V1000.160.16205/210/215505023
V97A30.220.22
V93A70.180.20
V25R750.260.27
V22R75A30.220.22
V18R75A70.230.24
Table 5. The results of the thermogravimetric analysis: decomposition temperature at 5% weight sample loss and maximum decomposition temperature (T5%loss and Tmax, respectively). All values are given in °C.
Sample CodeV100V97A3V93A7V25R75V22R75A3V18R75A7
T5%loss312.000317.803322.191315.117319.000322.000
Tmax355.114352.859361.042354.037353.930354.227
Table 6. Results of DSC tests: glass transition, crystallization, and melting temperatures (Tg, Tc, and Tm, respectively) are shown, as are the enthalpies of crystallization and fusion (∆Hc and ∆Hm) and the calculated degree of crystallinity (Xc).
Sample CodeTg (°C)Tc (°C)∆Hc (J/g)Tm (°C)∆Hm (J/g)Xc (%)
V10061.91102.7531.83178.3446.0815
V97A362.1695.5731.25177.1841.6211
V93A760.1999.9737.34175.6646.039
V25R7562.5794.6926.61177.2945.0220
V22R75A360.8693.9629.15176.5443.2215
V18R75A760.2593.0936.43177.6744.6610
Disclaimer/Publisher’s Note: The statements, opinions and data contained in all publications are solely those of the individual author(s) and contributor(s) and not of MDPI and/or the editor(s). MDPI and/or the editor(s) disclaim responsibility for any injury to people or property resulting from any ideas, methods, instructions or products referred to in the content.

