
Revealing the Impact of Micro-SiO2 Filer Content on the Anti-Corrosion Performance of Water-Borne Epoxy Resin

 , ,
, ,
Abstract
:1. Introduction
2. Materials and Methods
2.1. Materials and Coating
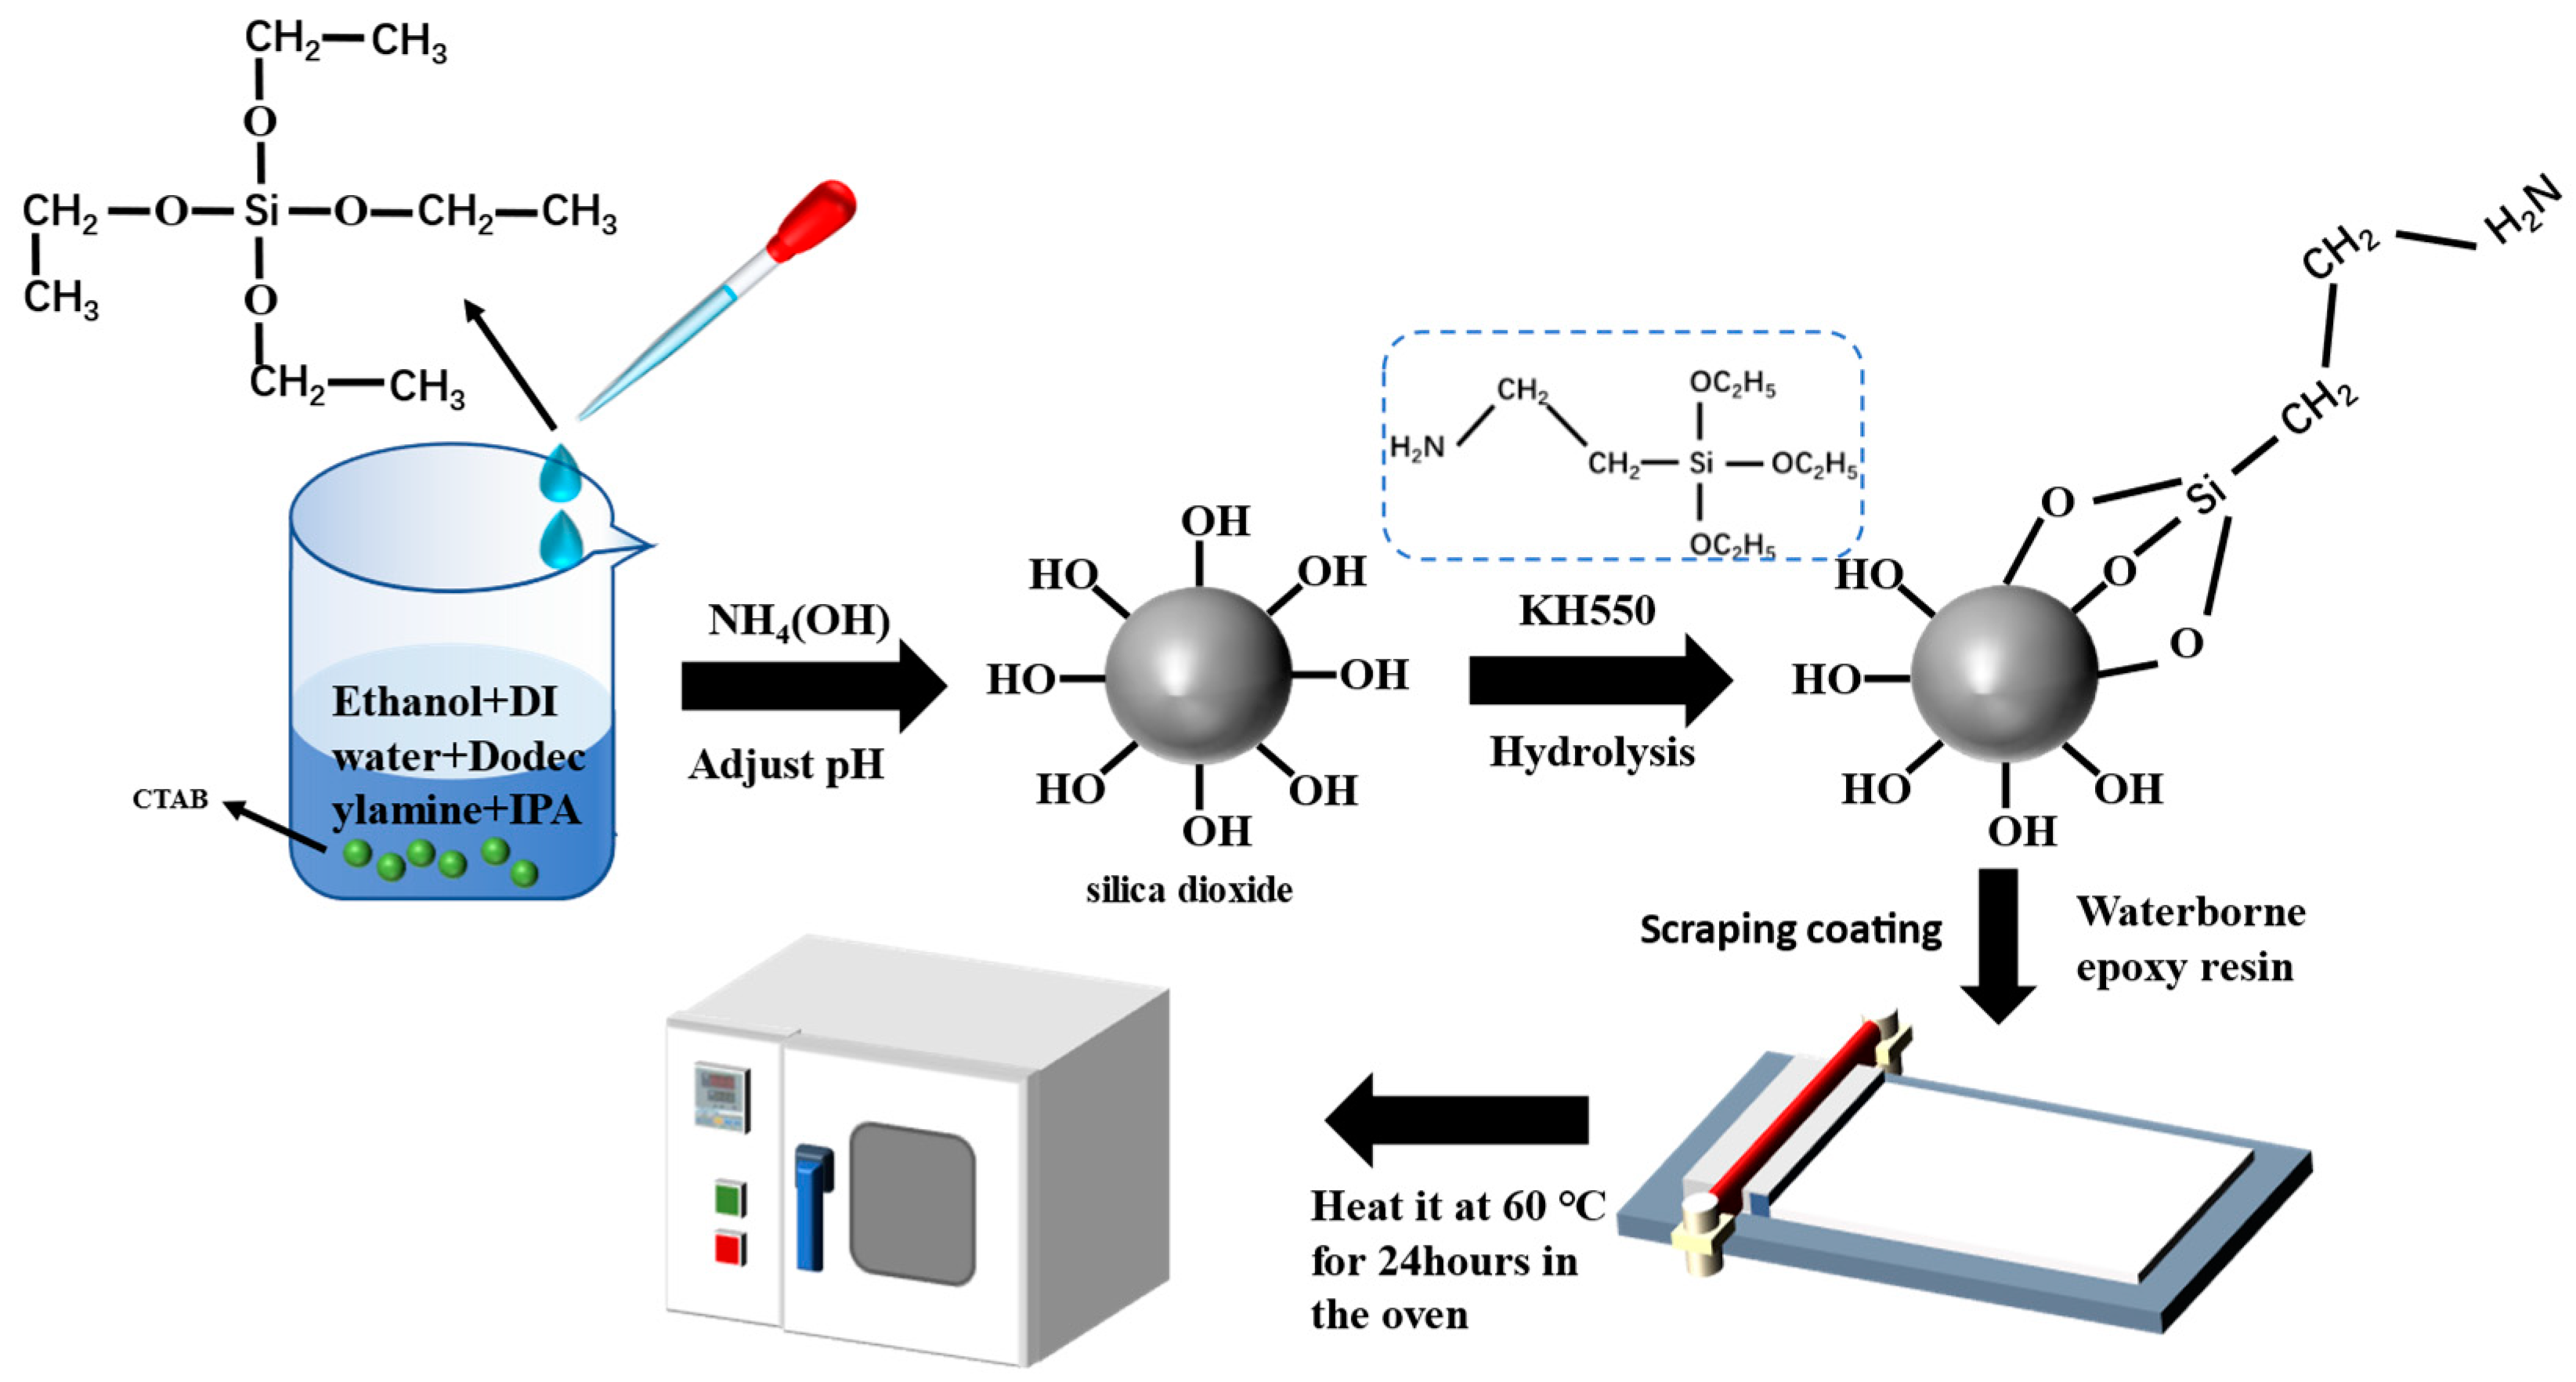
2.2. Synthesis of the Modified Spherical SiO2
2.3. Preparation of Composite Coating with Different Content of SiO2
2.4. Characterization of Modified SiO2
2.5. Electrochemical Test
2.6. Surface Characterization
3. Result and Discussion
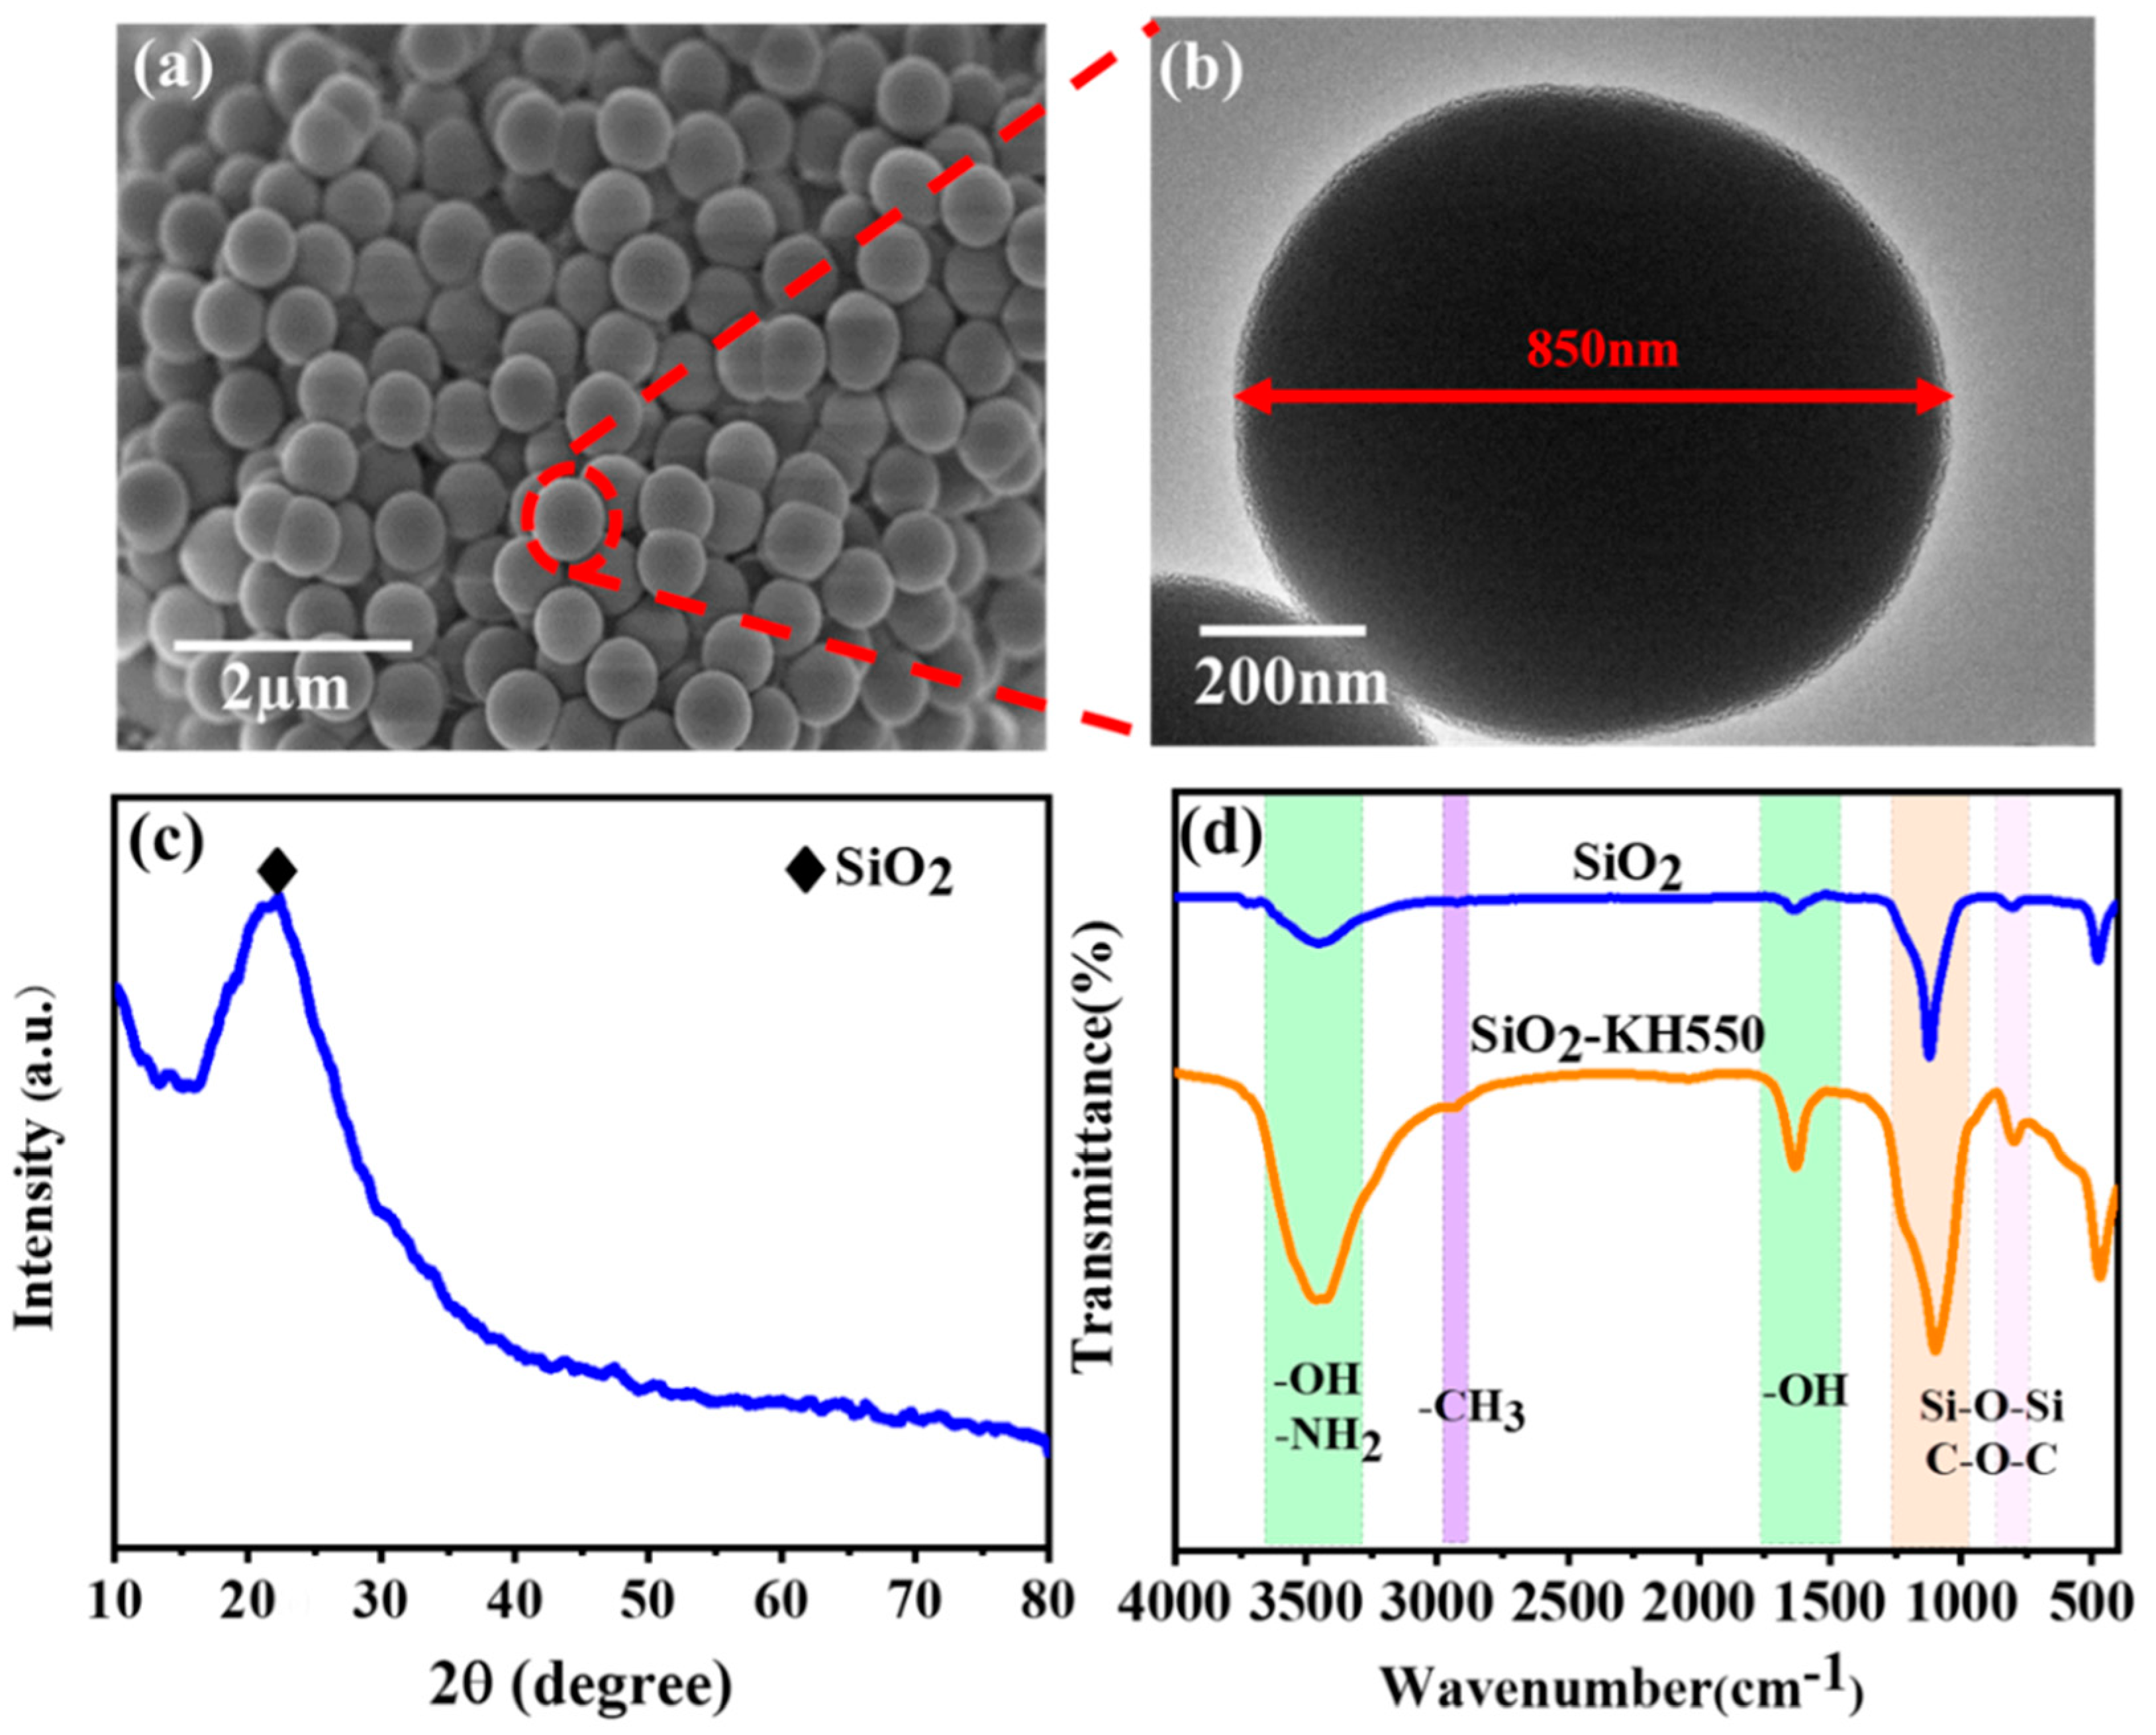
3.1. Characterization of SiO2 and Composite Coating
3.2. Electrochemical Test
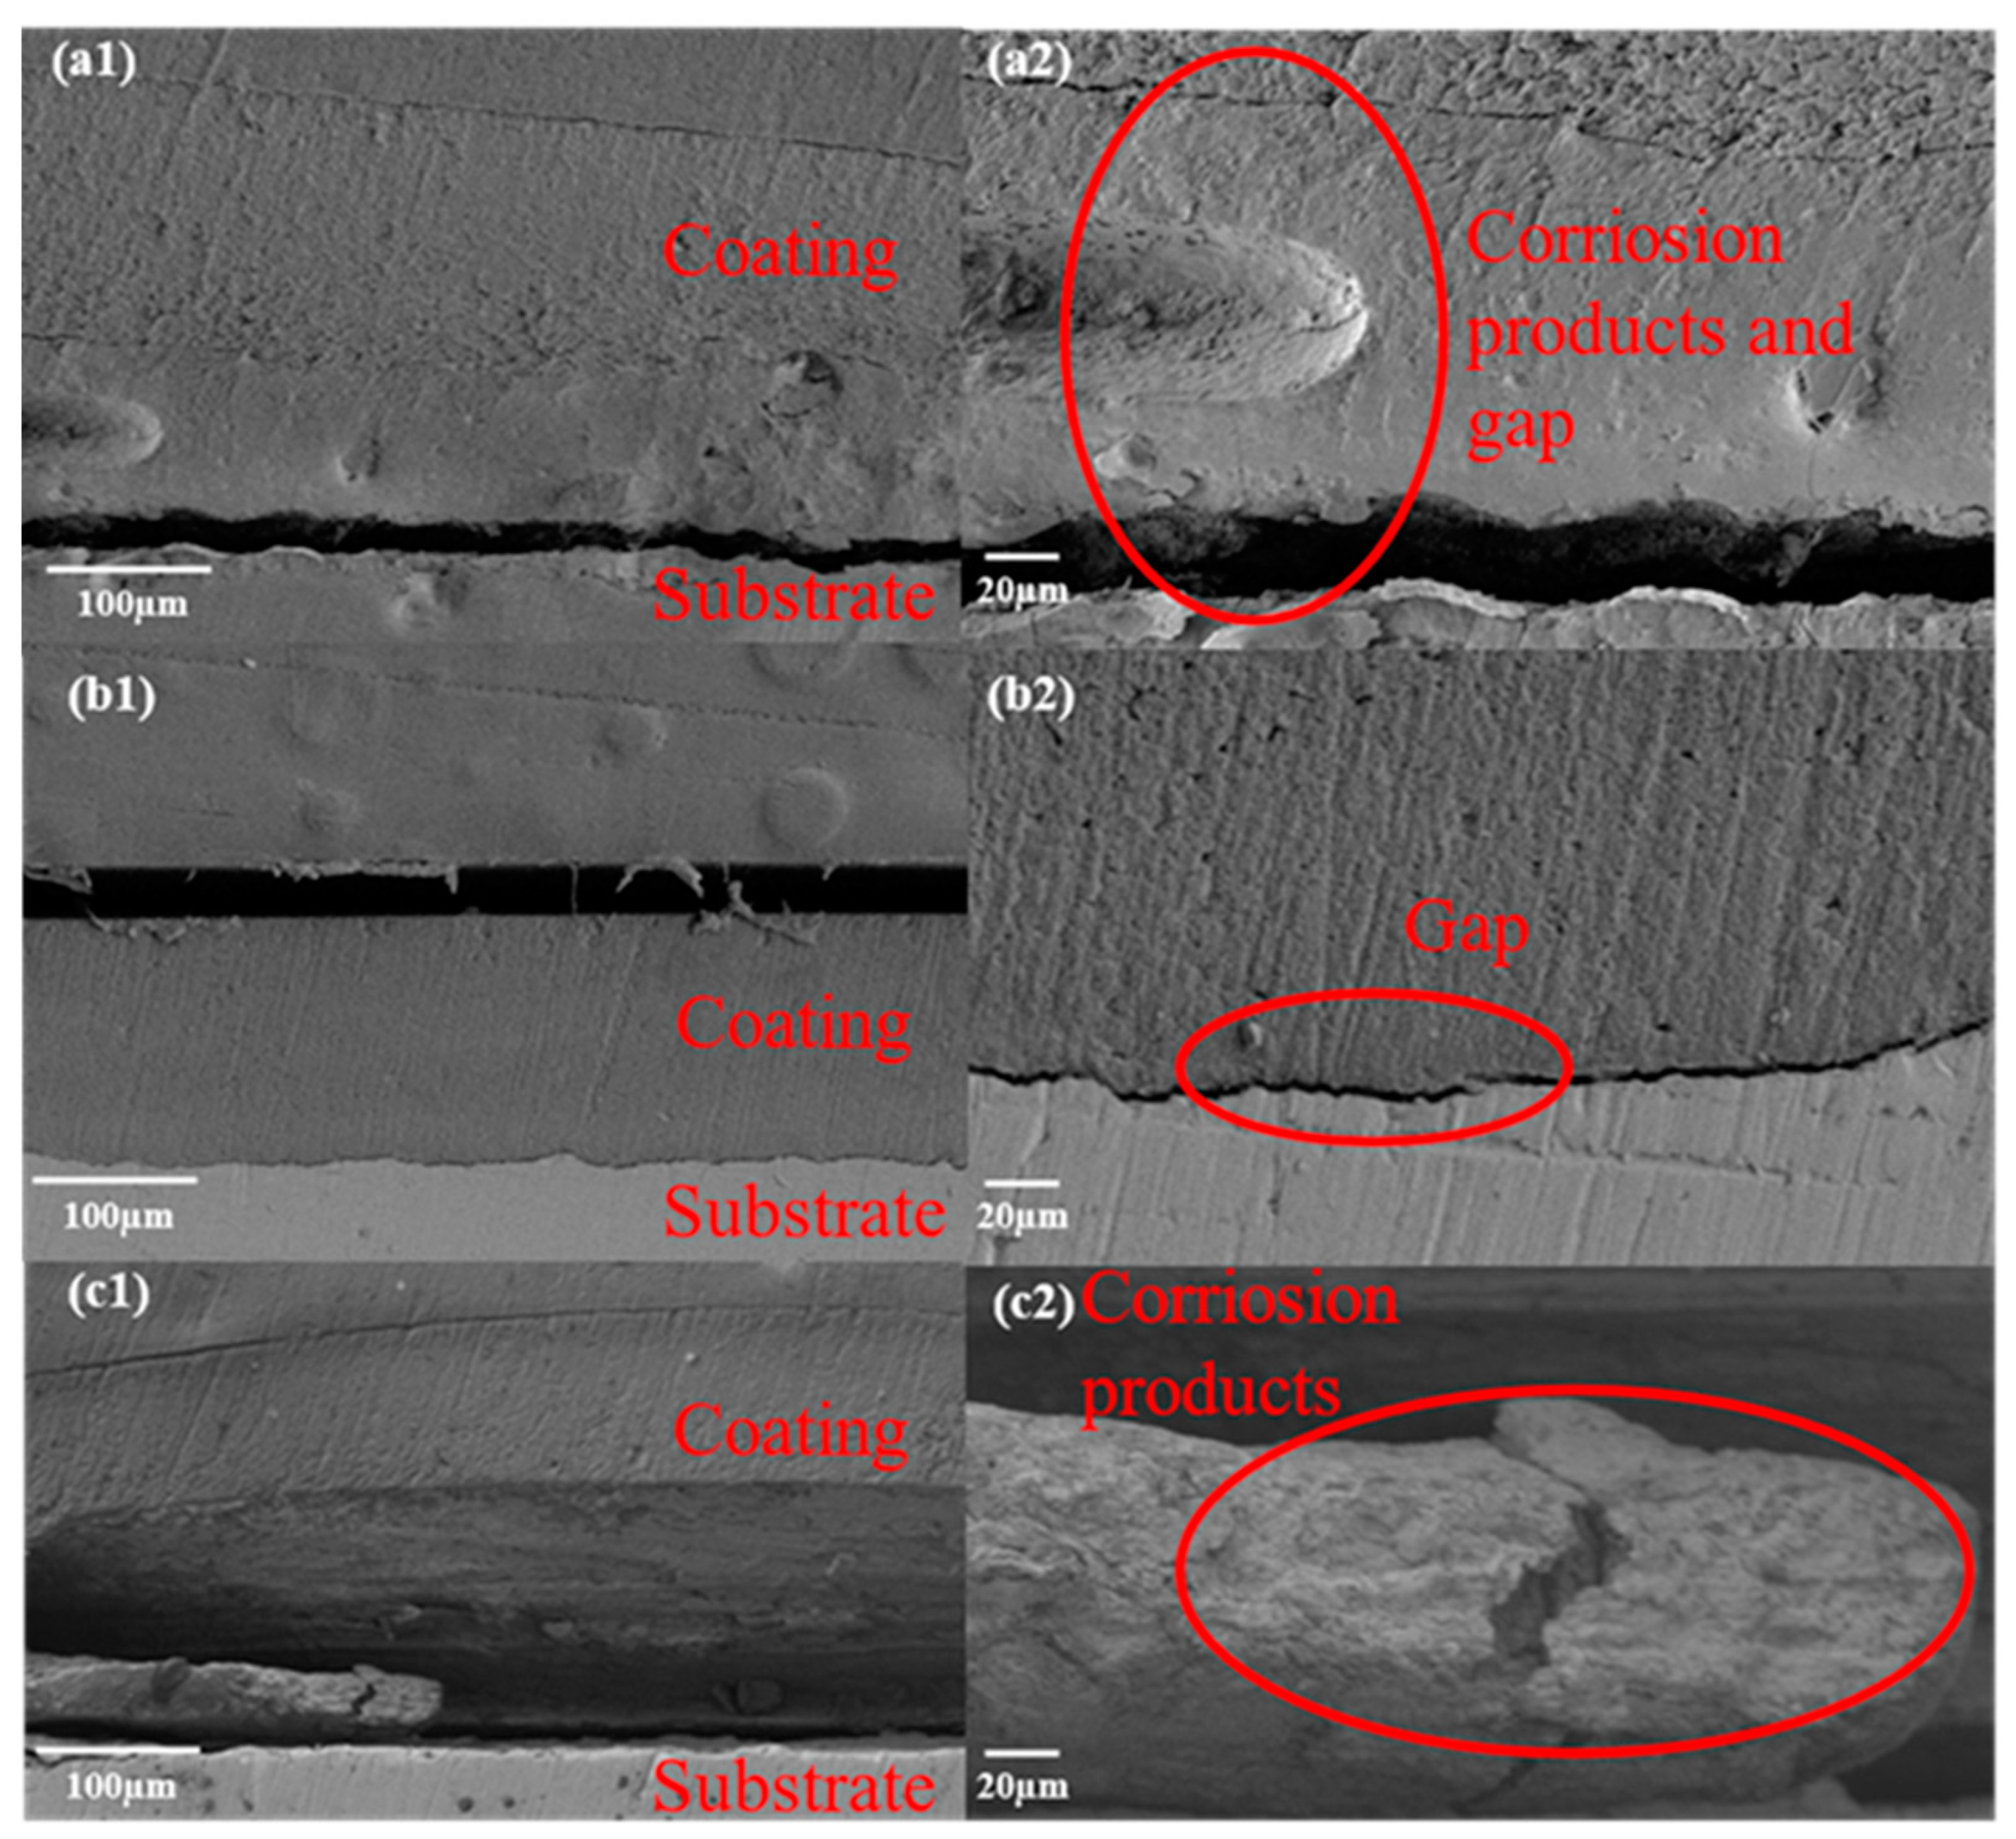
3.3. Corrosion Evaluation of Composite Coating
4. Conclusions
- (1)
- Spherical SiO2 particles with a particle size of 800 ± 50 nm were synthesized by a solution-gel method.
- (2)
- By modifying SiO2 with the silane coupling agent KH550, appropriate amounts of SiO2 can be dispersed in water-borne epoxy resins more effectively.
- (3)
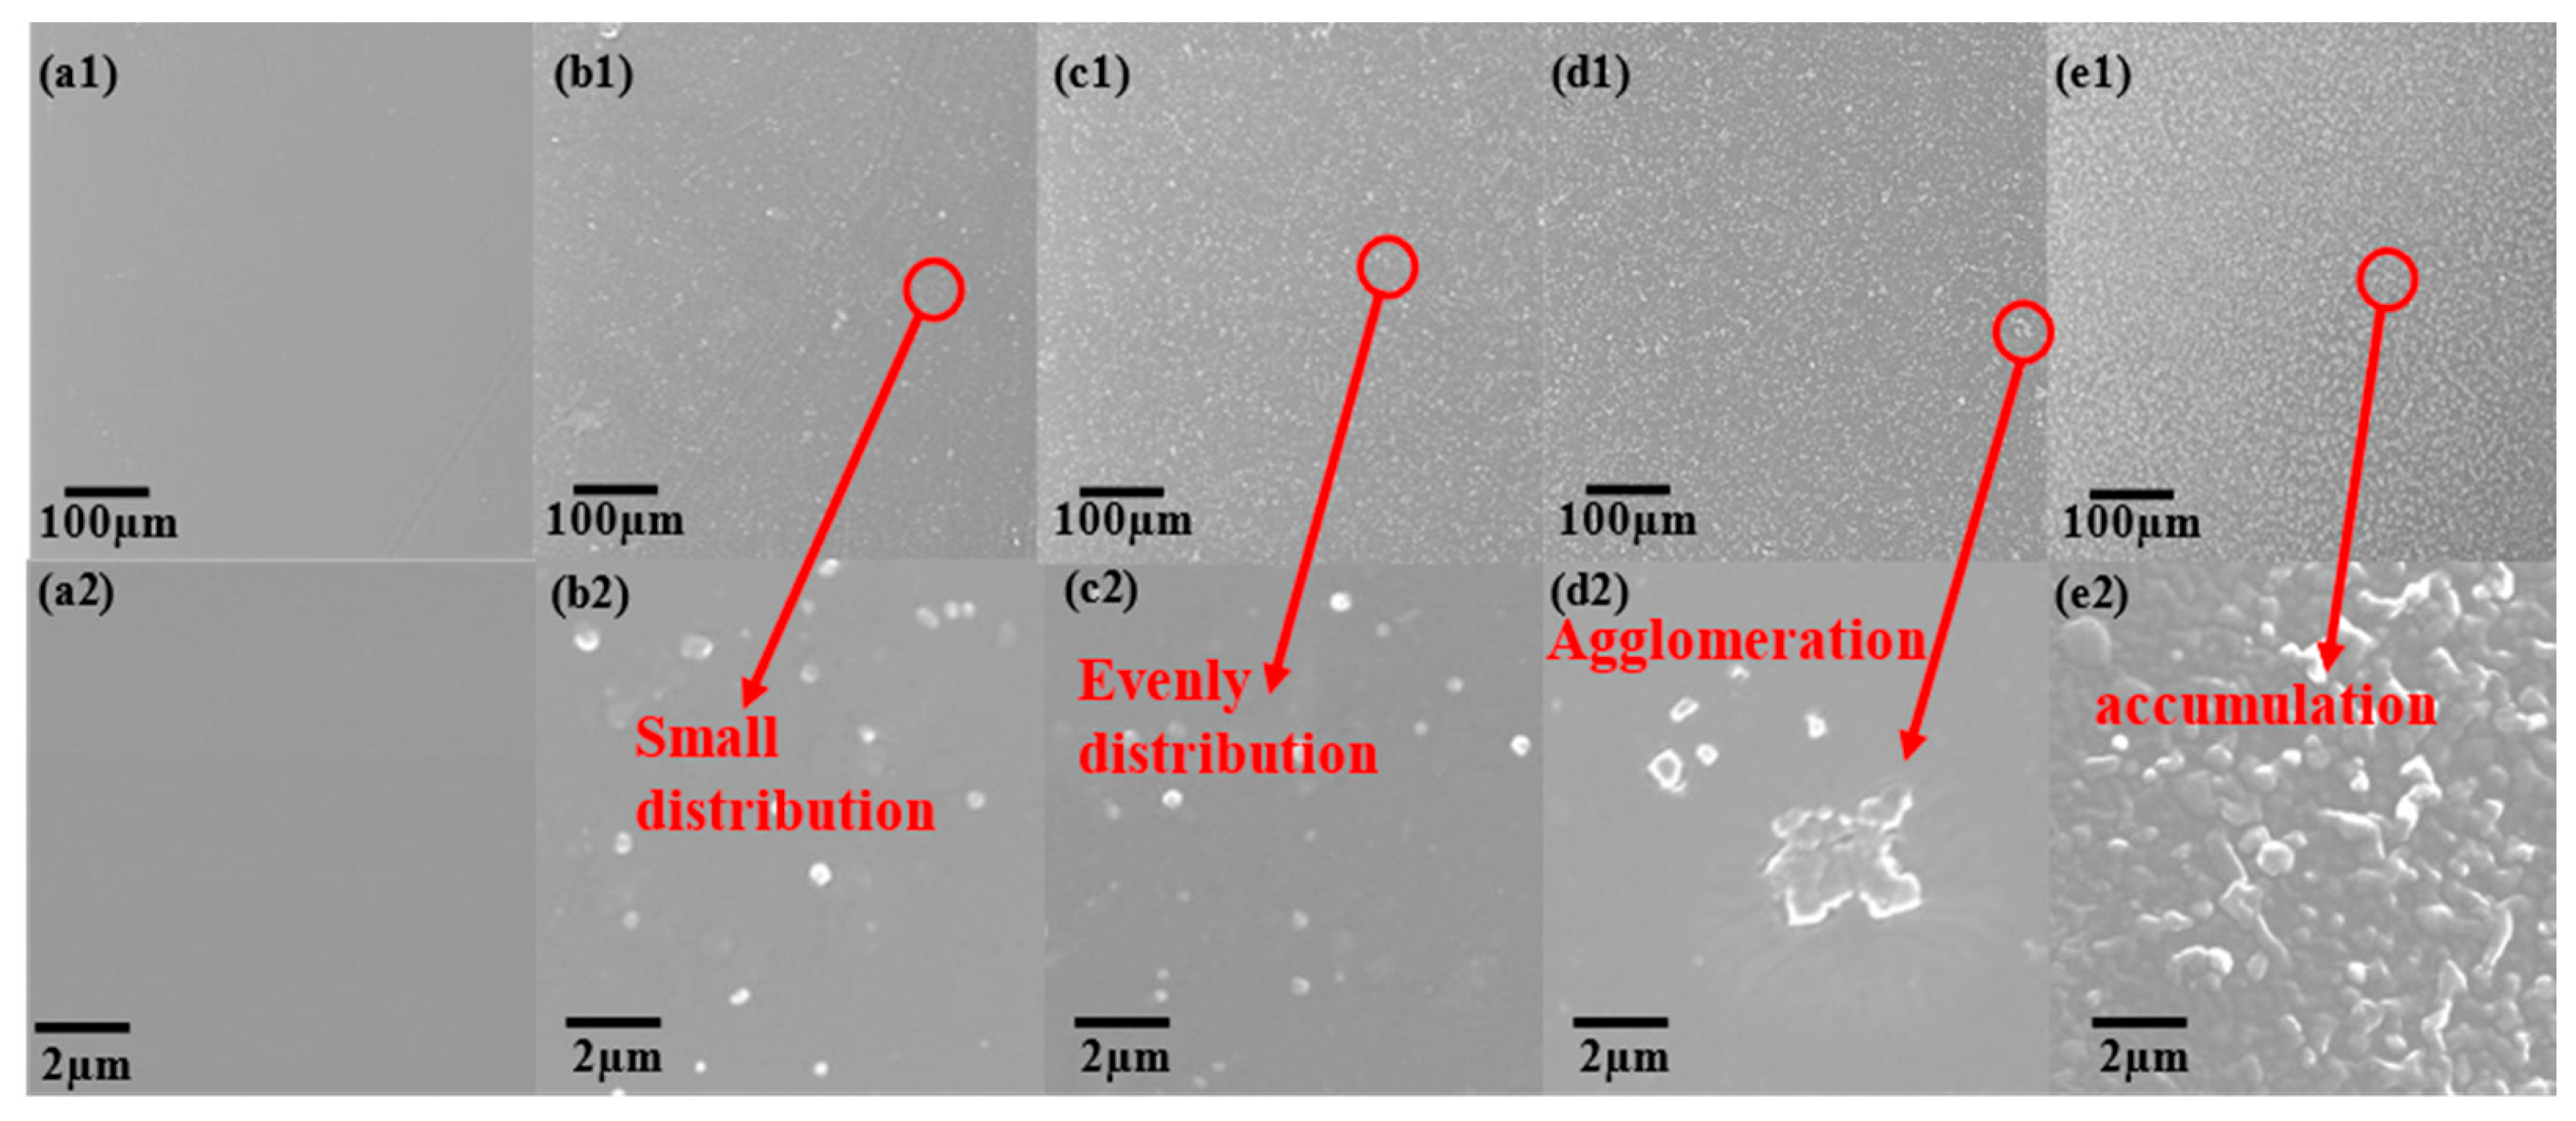
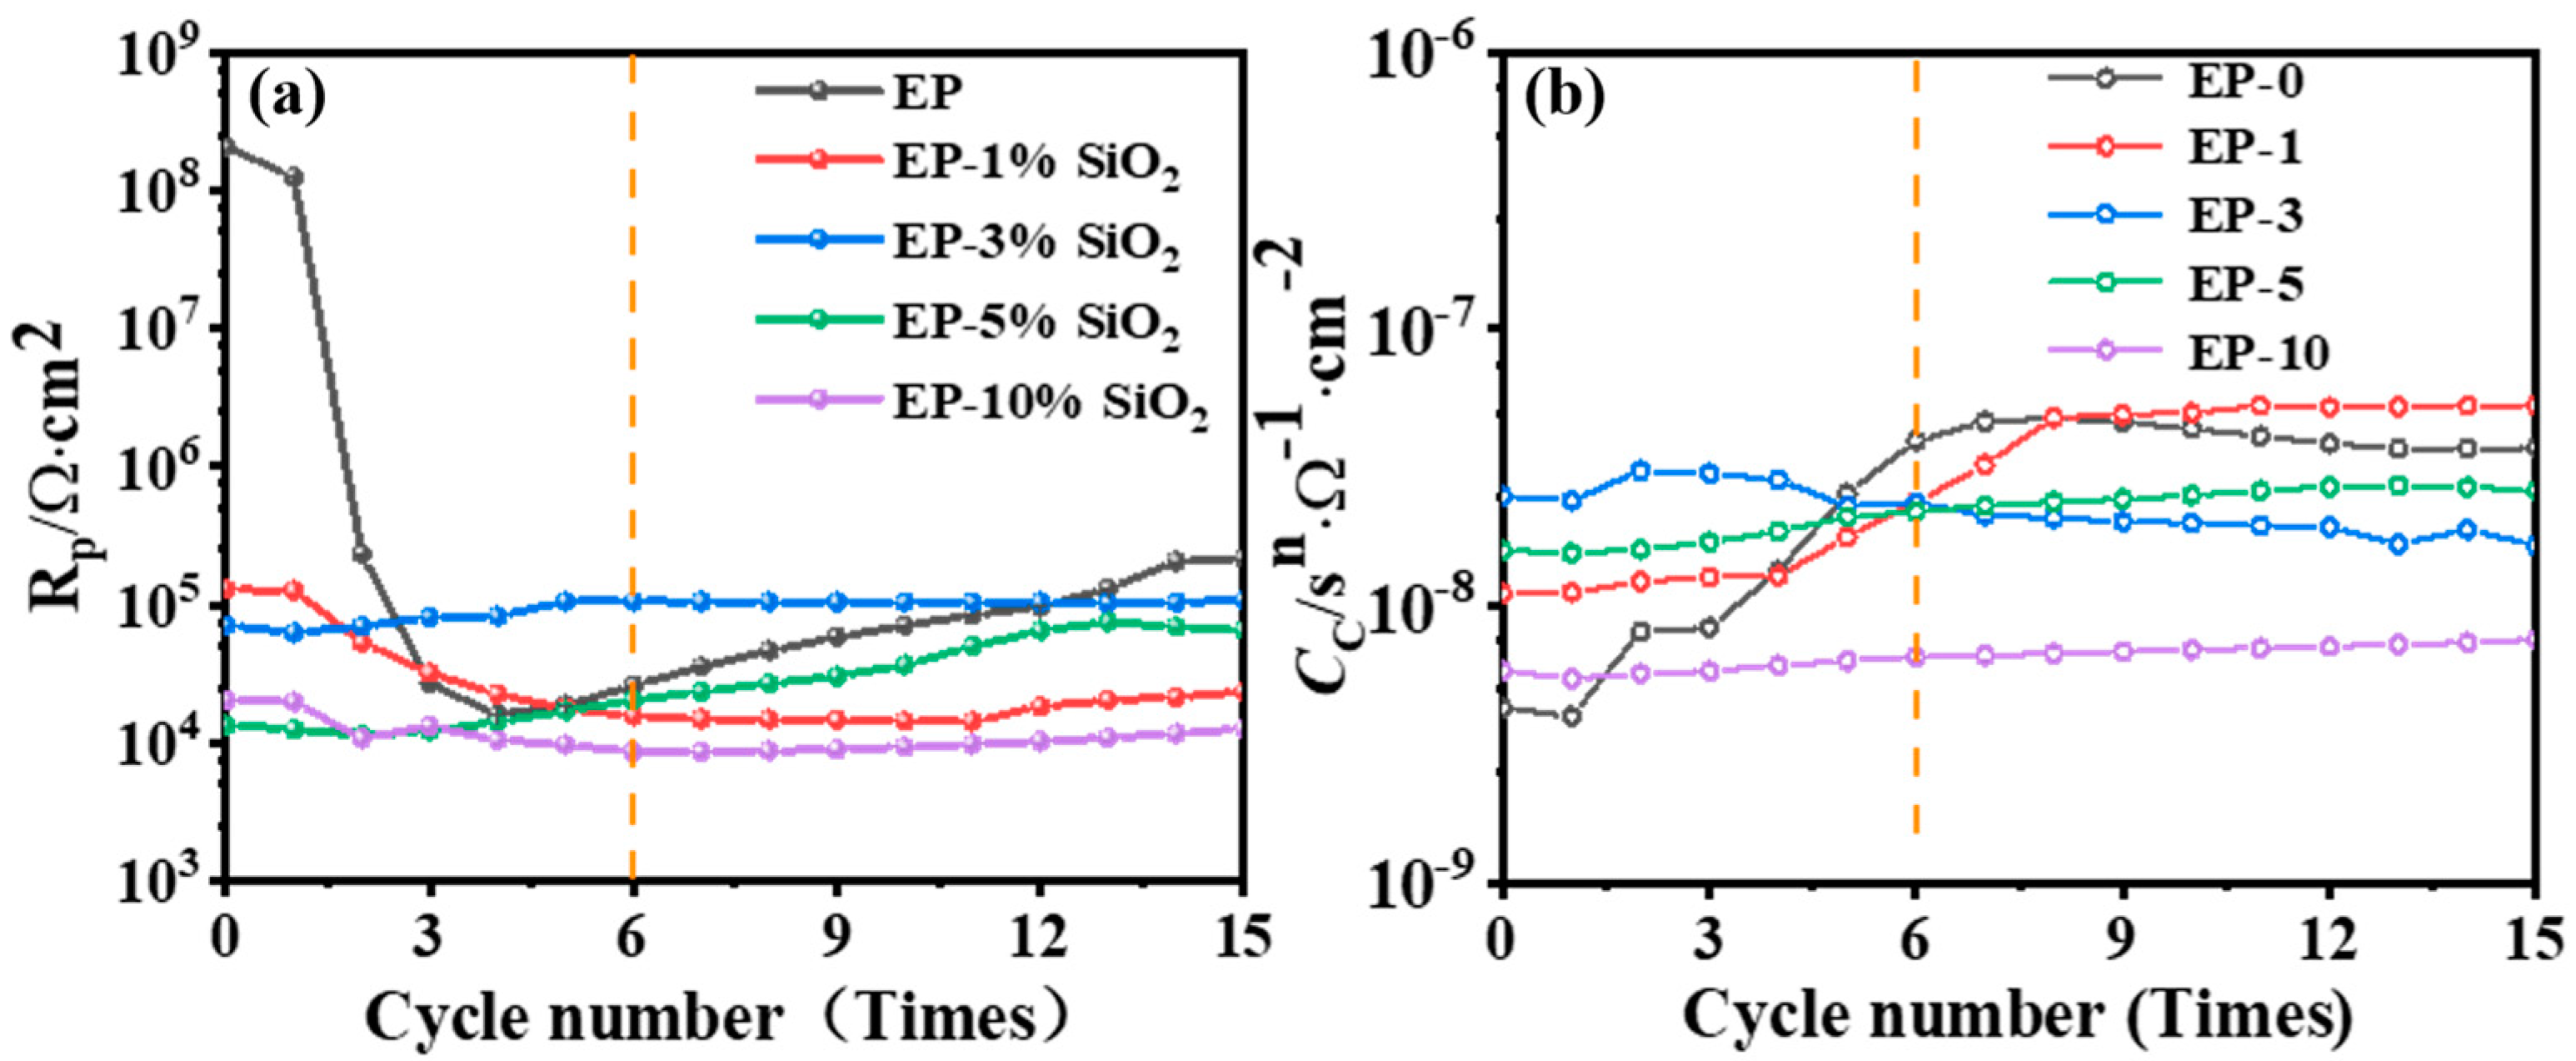
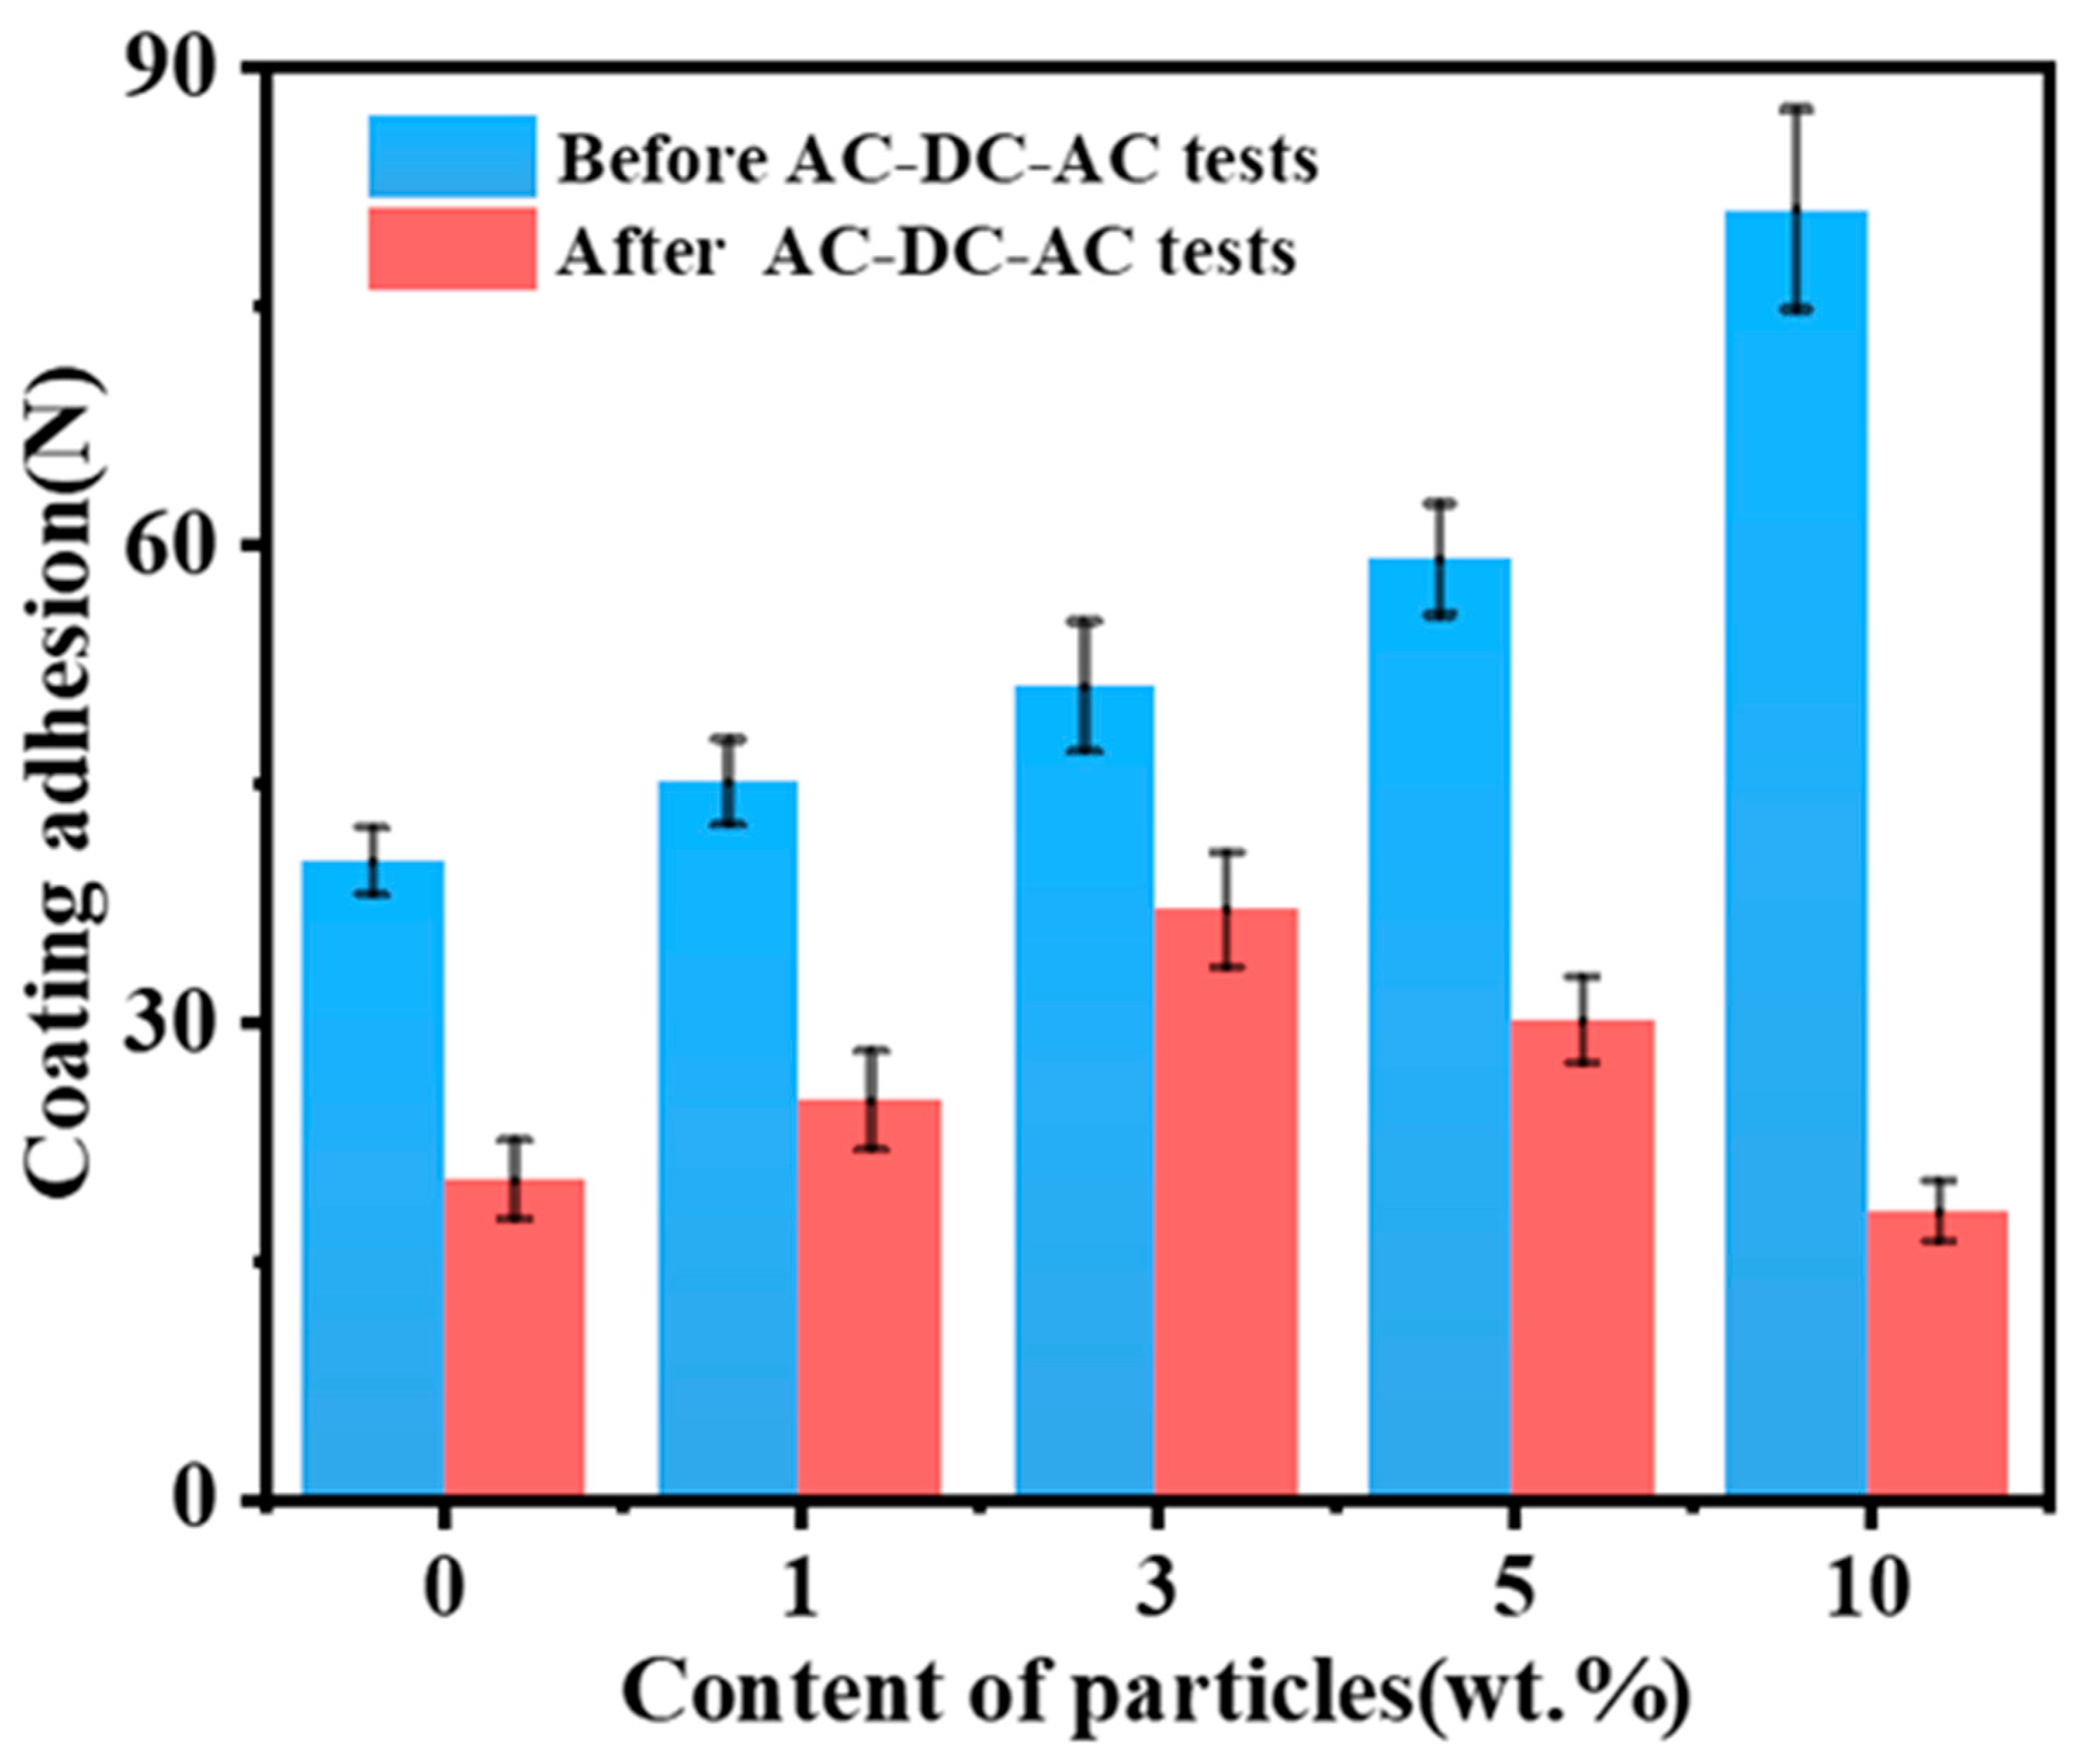
- The corrosion resistance increases first with an increase in SiO2 content in the composite coating, and then decreases as SiO2 fills the pores formed in the WBE resin coating during curing. It is observed that the composite coating has the best corrosion resistance when the addition of SiO2 amounts to 3 wt.%; it has the lowest impedance value of 9.4 × 10⁵ Ω·cm2 after the AC-DC-AC test; and its adhesion decreases the least before and after the AC-DC-AC test.
Supplementary Materials
Author Contributions
Funding
Data Availability Statement
Conflicts of Interest
References
- Song, D.; Wan, H.; Tu, X.; Li, W. A better understanding of failure process of waterborne coating/metal interface evaluated by electrochemical impedance spectroscopy. Prog. Org. Coat. 2020, 142, 105558. [Google Scholar] [CrossRef]
- Hamadi, L.; Mansouri, S.; Oulmi, K.; Kareche, A. The use of amino acids as corrosion inhibitors for metals: A review. Egypt. J. Pet. 2018, 27, 1157–1165. [Google Scholar] [CrossRef]
- Jin, B.; Xiong, D.-B.; Tan, Z.; Fan, G.; Guo, Q.; Su, Y.; Li, Z.; Zhang, D. Enhanced corrosion resistance in metal matrix composites assembled from graphene encapsulated copper nanoflakes. Carbon 2019, 142, 482–490. [Google Scholar] [CrossRef]
- Li, X.; Zhang, D.; Liu, Z.; Li, Z.; Du, C.; Dong, C.J.N. Materials science: Share corrosion data. Nature 2015, 527, 441–442. [Google Scholar] [CrossRef] [Green Version]
- Ambrosi, A.; Pumera, M. The Structural Stability of Graphene Anticorrosion Coating Materials is Compromised at Low Potentials. Chemistry 2015, 21, 7896–7901. [Google Scholar] [CrossRef]
- Faccini, M.; Bautista, L.; Soldi, L.; Escobar, A.M.; Altavilla, M.; Calvet, M.; Domènech, A.; Domínguez, E. Environmentally Friendly Anticorrosive Polymeric Coatings. Appl. Sci. 2021, 11, 3446. [Google Scholar] [CrossRef]
- Koch, G.H.; Brongers, M.P.; Thompson, N.G.; Virmani, Y.P.; Payer, J.H. Corrosion Cost and Preventive Strategies in the United States; United States; Federal Highway Administration: Washington, DC, USA, 2002.
- Rodriguez, A.A.; Miller, C.M.; Monty, C.N. Field Testing and Cost–Benefit Evaluation of Corrosion-Protective Coatings on Winter Maintenance Equipment in the State of Ohio. J. Cold Reg. Eng. 2021, 35, 04020031. [Google Scholar] [CrossRef]
- Rammelt, U.; Reinhard, G. Application of electrochemical impedance spectroscopy (EIS) for characterizing the corrosion-protective performance of organic coatings on metals. Prog. Org. Coat. 1992, 21, 205–226. [Google Scholar] [CrossRef]
- Kalita, D.J.; Tarnavchyk, I.; Chisholm, B.J.; Webster, D.C. Novel bio-based epoxy resins from eugenol as an alternative to BPA epoxy and high throughput screening of the cured coatings. Polymer 2021, 233, 124191. [Google Scholar] [CrossRef]
- Zhang, C.; Huang, K.-C.; Wang, H.; Zhou, Q. Anti-corrosion non-isocyanate polyurethane polysiloxane organic/inorganic hybrid coatings. Prog. Org. Coat. 2020, 148, 105855. [Google Scholar] [CrossRef]
- Gujjar, S.V.; Nadar, N.; Choudhary, K.; Hunashyal, A.M.; Shahapurkar, K.; Mujtaba, M.A.; Asadullah, M.; Soudagar, M.E.M.; Khan, T.M.Y.; Ismail, K.A.; et al. Investigation of Various Coating Resins for Optimal Anticorrosion and Mechanical Properties of Mild Steel Surface in NaCl Solution. Adv. Mater. Sci. Eng. 2022, 2022, 2203717. [Google Scholar] [CrossRef]
- Hakeim, O.A.; Abdelghaffar, F.; Haroun, A.A. UV-curable hyperbranched polyester acrylate encapsulation of phthalocyanine pigments for high performance synthetic fabrics printing. Dye. Pigment. 2020, 177, 108307. [Google Scholar] [CrossRef]
- Olajire, A.A. Recent advances on organic coating system technologies for corrosion protection of offshore metallic structures. J. Mol. Liq. 2018, 269, 572–606. [Google Scholar] [CrossRef]
- ESharmin; Imo, L.; Ashraf, S.M.; Ahmad, S. Acrylic-melamine modified DGEBA-epoxy coatings and their anticorrosive behavior. Prog. Org. Coat. 2004, 50, 47–54. [Google Scholar] [CrossRef]
- Grigoriev, D.; Shchukina, E.; Tleuova, A.; Aidarova, S.; Shchukin, D. Core/shell emulsion micro- and nanocontainers for self-protecting water based coatings. Surf. Coat. Technol. 2016, 303, 299–309. [Google Scholar] [CrossRef]
- Chi, J.; Zhang, G.; Xie, Q.; Ma, C.; Zhang, G. High performance epoxy coating with cross-linkable solvent via Diels-Alder reaction for anti-corrosion of concrete. Prog. Org. Coat. 2020, 139, 105473. [Google Scholar] [CrossRef]
- Wang, J.; Du, P.; Zhao, H.; Pu, J.; Yu, C. Novel nitrogen doped carbon dots enhancing the anticorrosive performance of waterborne epoxy coatings. Nanoscale Adv. 2019, 1, 3443–3451. [Google Scholar] [CrossRef]
- Wang, G.; Zhou, Z.; Hu, Q.; Shi, X.; Zhang, X.; Zhang, K.; Wu, L. Preparation of eco-friendly natural rosin-based SiO2–NH2@GO hybrid sealant and study on corrosion resistance of Fe-based amorphous coating for steel substrate. Carbon 2023, 201, 170–188. [Google Scholar] [CrossRef]
- Yan, H.; Cai, M.; Li, W.; Fan, X.; Zhu, M. Amino-functionalized Ti3C2T with anti-corrosive/wear function for waterborne epoxy coating. J. Mater. Sci. Technol. 2020, 54, 144–159. [Google Scholar] [CrossRef]
- Shibata, M.; Ishigami, N.; Shibita, A. Synthesis of sugar alcohol-derived water-soluble polyamines by the thiol-ene reaction and their utilization as hardeners of water-soluble bio-based epoxy resins. React. Funct. Polym. 2017, 118, 35–41. [Google Scholar] [CrossRef]
- Dong, C.F.; Sheng, H.; An, Y.H.; Li, X.G.; Xiao, K.; Cheng, Y.F. Corrosion of 7A04 aluminum alloy under defected epoxy coating studied by localized electrochemical impedance spectroscopy. Prog. Org. Coat. 2010, 67, 269–273. [Google Scholar] [CrossRef]
- Leal, D.A.; Kuznetsova, A.; Silva, G.M.; Tedim, J.; Wypych, F.; Marino, C.E.B. Layered materials as nanocontainers for active corrosion protection: A brief review. Appl. Clay Sci. 2022, 225, 106537. [Google Scholar] [CrossRef]
- Lyon, S.B.; Bingham, R.; Mills, D.J. Advances in corrosion protection by organic coatings: What we know and what we would like to know. Prog. Org. Coat. 2017, 102, 2–7. [Google Scholar] [CrossRef] [Green Version]
- Tian, W.; Liu, L.; Meng, F.; Liu, Y.; Li, Y.; Wang, F. The failure behaviour of an epoxy glass flake coating/steel system under marine alternating hydrostatic pressure. Corros. Sci. 2014, 86, 81–92. [Google Scholar] [CrossRef]
- Xie, Z.H.; Li, D.; Skeete, Z.; Sharma, A.; Zhong, C.J. Nanocontainer-Enhanced Self-Healing for Corrosion-Resistant Ni Coating on Mg Alloy. ACS Appl. Mater. Interfaces 2017, 9, 36247–36260. [Google Scholar] [CrossRef]
- Liu, L.; Zhao, M.; Pei, X.; Liu, S.; Luo, S.; Yan, M.; Shao, R.; Sun, Y.; Xu, W.; Xu, Z. Improving corrosion resistance of epoxy coating by optimizing the stress distribution and dispersion of SiO2 filler. Prog. Org. Coat. 2023, 179, 107522. [Google Scholar] [CrossRef]
- Daradmare, S.; Raj, S.; Bhattacharyya, A.R.; Parida, S. Factors affecting barrier performance of composite anti-corrosion coatings prepared by using electrochemically exfoliated few-layer graphene as filler. Compos. Part B Eng. 2018, 155, 1–10. [Google Scholar] [CrossRef]
- Tong, Y.; Bohm, S.; Song, M. The capability of graphene on improving the electrical conductivity and anti-corrosion properties of Polyurethane coatings. Appl. Surf. Sci. 2017, 424, 72–81. [Google Scholar] [CrossRef] [Green Version]
- Aung, M.M.; Li, W.J.; Lim, H.N. Improvement of anticorrosion coating properties in bio-based polymer epoxy acrylate incorporated with nano zinc oxide particles. Ind. Eng. Chem. Res. 2020, 59, 1753–1763. [Google Scholar] [CrossRef]
- Wang, F.; Feng, L.; Lu, M. Mechanical properties of multi-walled carbon nanotube/waterborne polyurethane conductive coatings prepared by electrostatic spraying. Polymers 2019, 11, 714. [Google Scholar] [CrossRef] [Green Version]
- Wu, Z.; Cao, S.; Sun, Q.; Zhong, F.; Zhang, M.; Duan, H. Technology, Mechanical, thermal and gas sensing properties of flexible multi-walled carbon nanotubes/waterborne polyurethane composite film. Compos. Sci. Technol. 2021, 216, 109040. [Google Scholar] [CrossRef]
- Alrashed, M.M.; Soucek, M.D.; Jana, S.C. Role of graphene oxide and functionalized graphene oxide in protective hybrid coatings. Prog. Org. Coat. 2019, 134, 197–208. [Google Scholar] [CrossRef]
- Wang, Y.; Wang, H.; Li, Z.; Yang, D.; Qiu, X.; Liu, Y.; Yan, M.; Li, Q. Fabrication of litchi-like lignin/zinc oxide composites with enhanced antibacterial activity and their application in polyurethane films. J. Colloid Interface Sci. 2021, 594, 316–325. [Google Scholar] [CrossRef] [PubMed]
- Nguyen, T.M.; Bui, T.M.A.; Nguyen, T.V. Acid and alkali resistance of Acrylic polyurethane/R-SiO2 nanocomposite coating. Vietnam. J. Chem. 2020, 58, 67–73. [Google Scholar]
- Borisova, D.; Möhwald, H.; Shchukin, G.M. Mesoporous Silica Nanoparticles for Active Corrosion Protection. ACS Nano 2011, 5, 1939–1946. [Google Scholar] [CrossRef]
- Knudsen, O.Ø.; Forsgren, A. Corrosion Control through Organic Coatings; CRC Press: Boca Raton, FL, USA, 2017. [Google Scholar]
- Jena, G.; George, R.P.; Philip, J. Fabrication of a robust graphene oxide-nano SiO2-polydimethylsiloxane composite coating on carbon steel for marine applications. Prog. Org. Coat. 2021, 161, 106462. [Google Scholar] [CrossRef]
- Wang, J.; Zhang, L.; Li, C. Superhydrophobic and mechanically robust polysiloxane composite coatings containing modified silica nanoparticles and PS-grafted halloysite nanotubes. Chin. J. Chem. Eng. 2022, 52, 56–65. [Google Scholar] [CrossRef]
- Lu, Z.; Xu, L.; He, Y.; Zhou, J. One-step facile route to fabricate functionalized nano-silica and silicone sealant based transparent superhydrophobic coating. Thin Solid Films 2019, 692, 137560. [Google Scholar] [CrossRef]
- Li, W.; Tian, H.; Hou, B. Corrosion performance of epoxy coatings modified by nanoparticulate SiO2. Mater. Corros. 2012, 63, 44–53. [Google Scholar] [CrossRef]
- Palraj, S.; Selvaraj, M.; Maruthan, K.; Rajagopal, G. Corrosion and wear resistance behavior of nano-silica epoxy composite coatings. Prog. Org. Coat. 2015, 81, 132–139. [Google Scholar] [CrossRef]
- Ke, Q.; Fu, W.; Jin, H.; Zhang, L.; Tang, T.; Zhang, J. Fabrication of mechanically robust superhydrophobic surfaces based on silica micro-nanoparticles and polydimethylsiloxane. Surf. Coat. Technol. 2011, 205, 4910–4914. [Google Scholar] [CrossRef]
- Anitha, C.; Azim, S.S.; Mayavan, S. Compounds, Influence of particle size in fluorine free corrosion resistance superhydrophobic coating-optimization and stabilization of interface by multiscale roughness. J. Alloy. Compd. 2018, 765, 677–684. [Google Scholar] [CrossRef]
- Cao, M.; Jin, M.; Qiu, J.; Zhao, X.; Liu, Y.; Zhang, X.; Cai, Q.; Zhu, W. The synthesis of a core–shell hybrid composite micro-sphere with controllable homogenous or heterogeneous multi-shell structure by multiple-growth via a combination method. Colloids Surf. A Physicochem. Eng. Asp. 2014, 444, 289–298. [Google Scholar] [CrossRef]
- Khouchaf, L.; Boulahya, K.; Das, P.P.; Nicolopoulos, S.; Kis, V.K.; Lábár, J.L. Study of the microstructure of amorphous silica nanostructures using high-resolution electron microscopy, electron energy loss spectroscopy, X-ray powder diffraction, and electron pair distribution function. Materials 2020, 13, 4393. [Google Scholar] [CrossRef]
- Tomiyama, S.; Takahashi, R.; Sato, S.; Sodesawa, T.; Yoshida, S. Preparation of Ni/SiO2 catalyst with high thermal stability for CO2-reforming of CH4. Appl. Catal. A Gen. 2003, 241, 349–361. [Google Scholar] [CrossRef]
- Stöber, W.; Fink, A.; Bohn, E. Controlled growth of monodisperse silica spheres in the micron size range. J. Colloid Interface Sci. 1968, 26, 62–69. [Google Scholar] [CrossRef]
- Lippincott, E.R.; Van Valkenburg, A.; Weir, C.E.; Bunting, E. Infrared studies on polymorphs of silicon dioxide and germanium dioxide. J. Res. Natl. Bur. Stand. 1958, 61, 61–70. [Google Scholar] [CrossRef]
- Šontevska, V.; Jovanovski, G.; Makreski, P. Minerals from Macedonia. Part XIX. Vibrational spectroscopy as identificational tool for some sheet silicate minerals. J. Mol. Struct. 2007, 834, 318–327. [Google Scholar] [CrossRef]
- Giordano, L.; Ricci, D.; Pacchioni, G.; Ugliengo, P. Structure and vibrational spectra of crystalline SiO2 ultra-thin films on Mo (112). Surf. Sci. 2005, 584, 225–236. [Google Scholar] [CrossRef]
- Huang, J.Q.; Liu, K.; Song, X.; Zheng, G.; Chen, Q.; Sun, J.; Jin, H.; Jiang, L.; Jiang, Y.; Zhang, Y.; et al. Incorporation of Al2O3, GO, and Al2O3@GO nanoparticles into water-borne epoxy coatings: Abrasion and corrosion resistance. RSC Adv. 2022, 12, 24804–24820. [Google Scholar] [CrossRef]
- Wei, B.; Chang, Q.; Bao, C.; Dai, L.; Zhang, G.; Wu, F. Surface modification of filter medium particles with silane coupling agent KH550. Colloids Surfaces A Physicochem. Eng. Asp. 2013, 434, 276–280. [Google Scholar] [CrossRef]
- Chen, H.; Lu, H.; Zhou, Y.; Zheng, M.; Ke, C.; Zeng, D. Stability, Study on thermal properties of polyurethane nanocomposites based on organo-sepiolite. Polym. Degrad. Stab. 2012, 97, 242–247. [Google Scholar] [CrossRef]
- Parida, S.K.; Dash, S.; Patel, S.; Mishra, B.K. Adsorption of organic molecules on silica surface. Adv. Colloid. Interface Sci. 2006, 121, 77–110. [Google Scholar] [CrossRef] [PubMed]
- Couchman, P.; Karasz, F.J.M. A classical thermodynamic discussion of the effect of composition on glass-transition temperatures. Macromolecules 1978, 11, 117–119. [Google Scholar] [CrossRef]
- Moynihan, C.T.; Easteal, A.J.; Wilder, J.; Tucker, J. Dependence of the glass transition temperature on heating and cooling rate. J. Phys. Chem. 1974, 78, 2673–2677. [Google Scholar] [CrossRef]
- Hakkarainen, M.; Albertsson, A.C.; Karlsson, S. Weight losses and molecular weight changes correlated with the evolution of hydroxyacids in simulated in vivo degradation of homo- and copolymers of PLA and PGA. Polym. Degrad. Stab. 1996, 52, 283–291. [Google Scholar] [CrossRef]
- Yuan, X.; Yue, Z.F.; Chen, X.; Wen, S.F.; Li, L.; Feng, T. EIS study of effective capacitance and water uptake behaviors of silicone-epoxy hybrid coatings on mild steel. Prog. Org. Coat. 2015, 86, 41–48. [Google Scholar] [CrossRef]
- Molina, J.; Puig, M.; Gimeno, M.J.; Izquierdo, R.; Gracenea, J.J.; Suay, J.J. Influence of zinc molybdenum phosphate pigment on coatings performance studied by electrochemical methods. Prog. Org. Coat. 2016, 97, 244–253. [Google Scholar] [CrossRef] [Green Version]
- Meng, F.; Liu, L.; Tian, W.; Wu, H.; Li, Y.; Zhang, T.; Wang, F. The influence of the chemically bonded interface between fillers and binder on the failure behaviour of an epoxy coating under marine alternating hydrostatic pressure. Corros. Sci. 2015, 101, 139–154. [Google Scholar] [CrossRef]
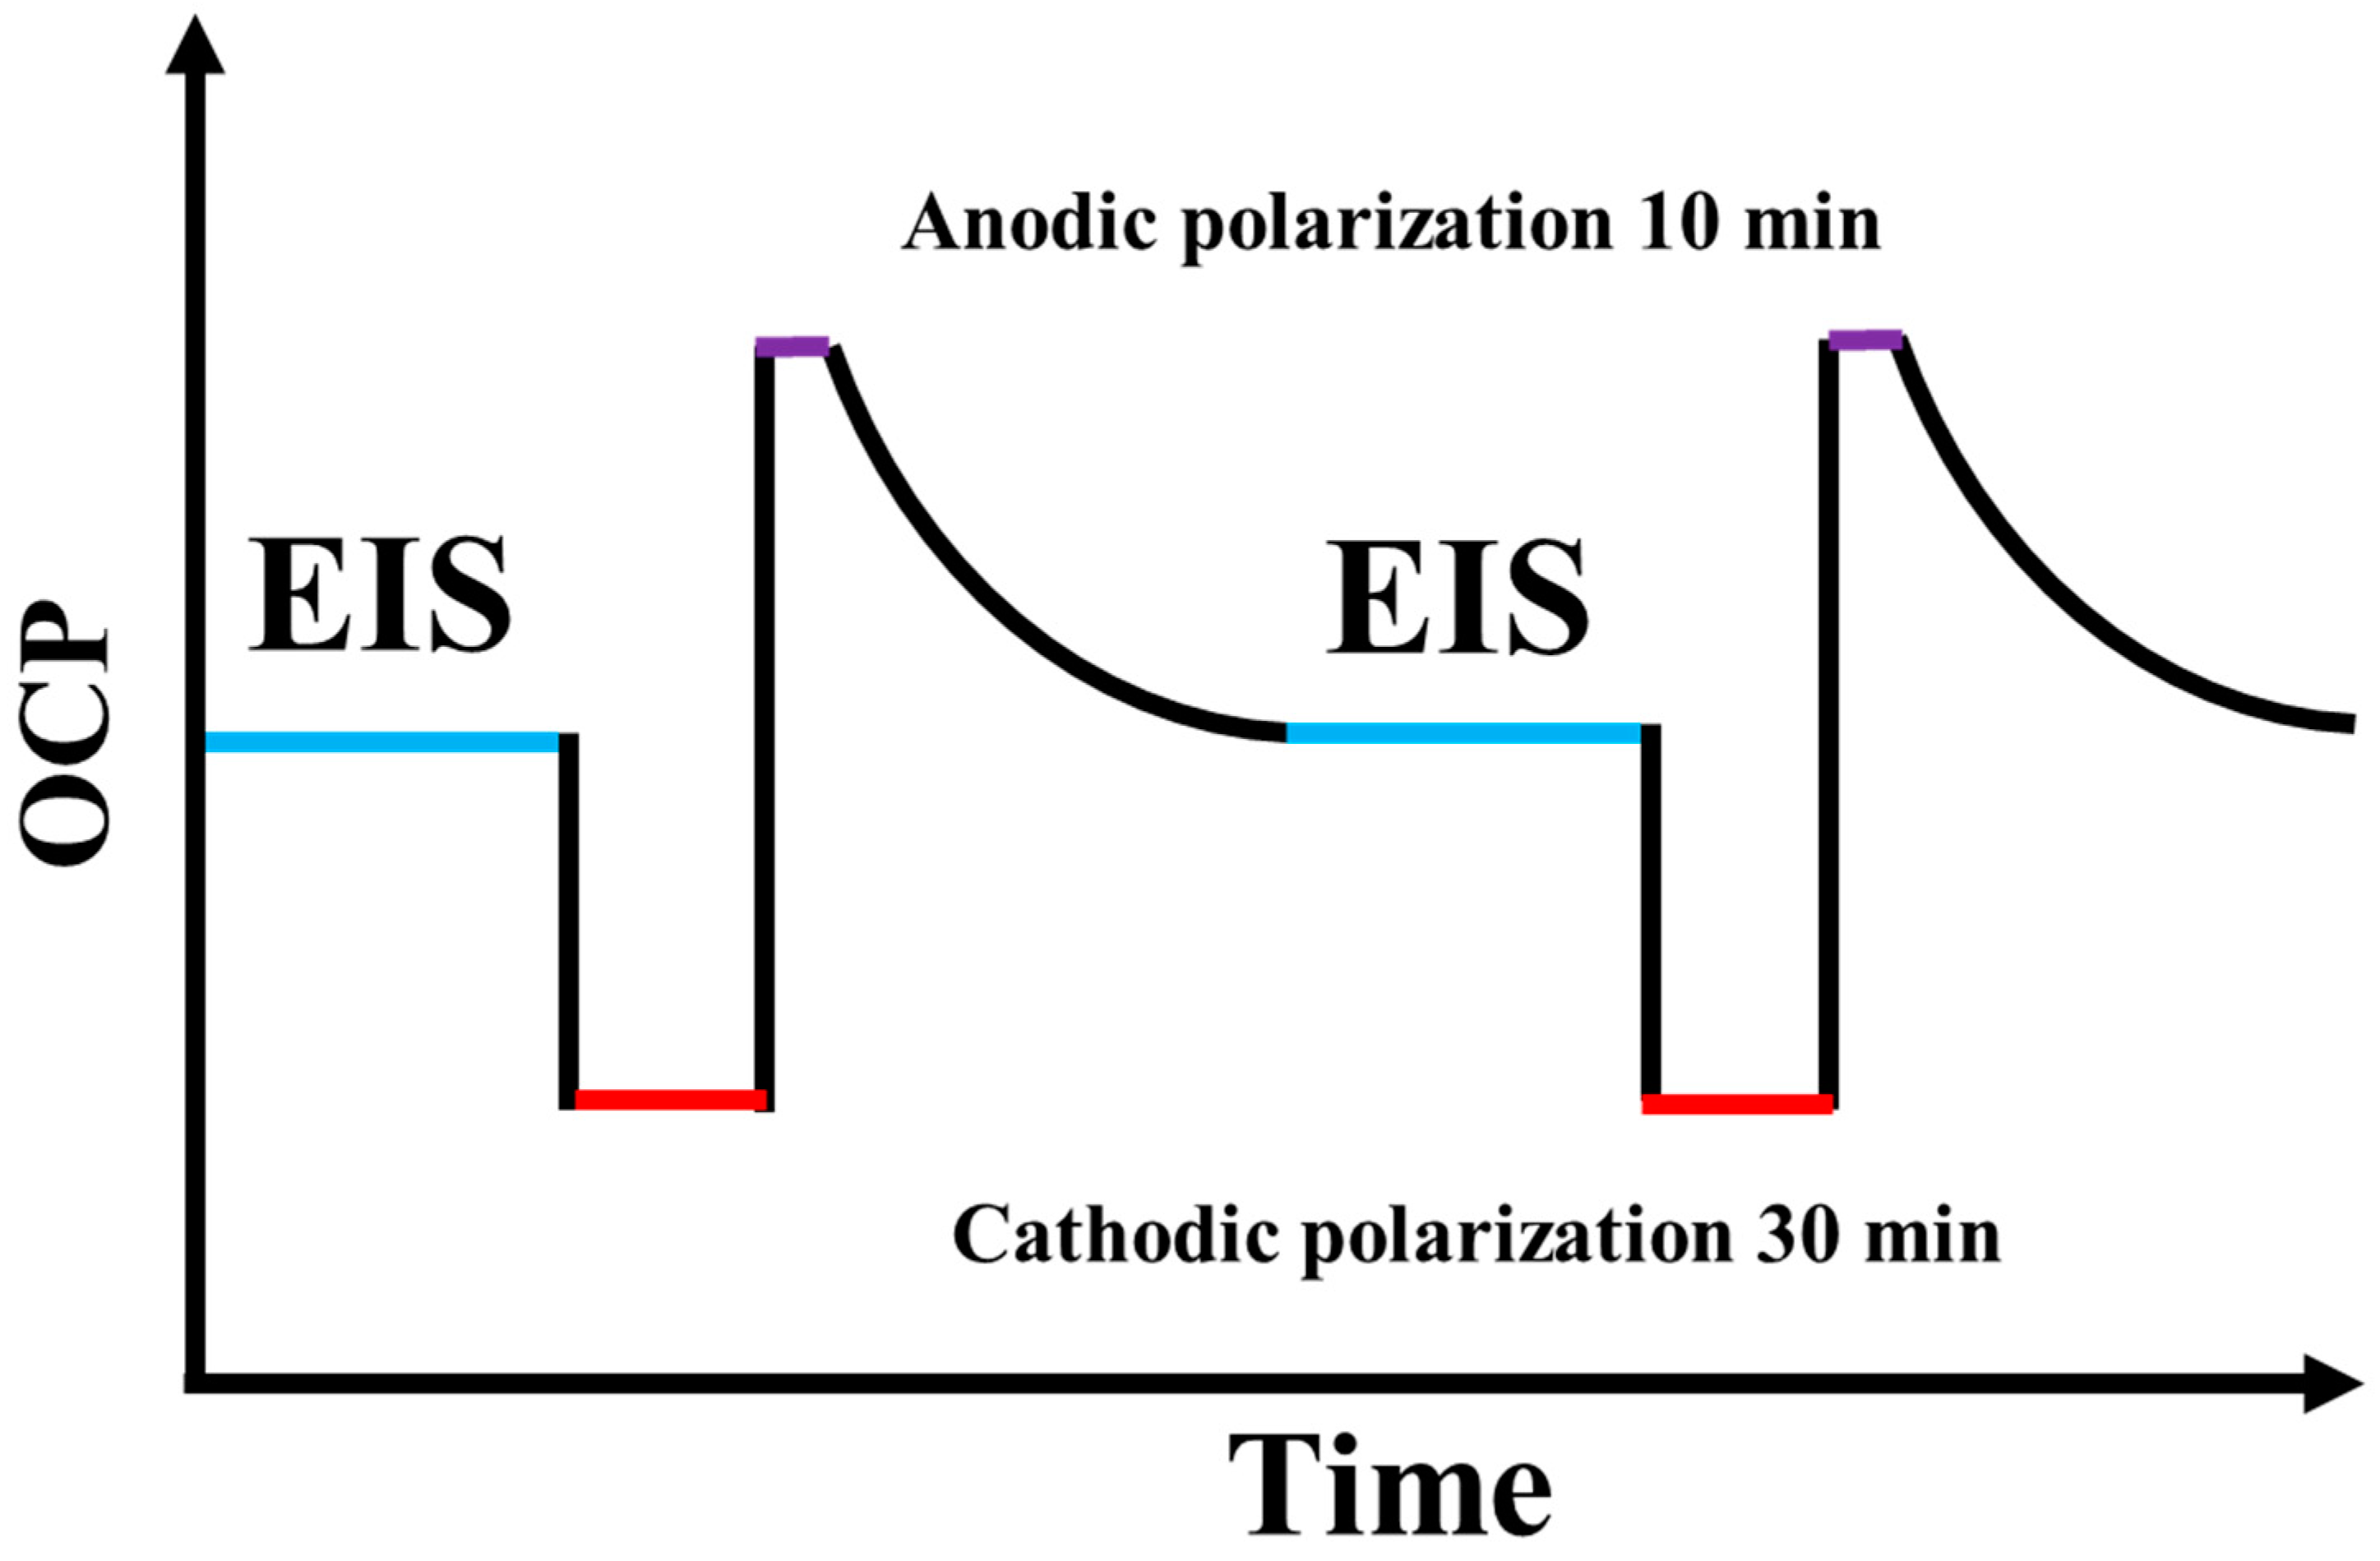
- da Silva Lopes, T.; Lopes, T.; Martins, D.; Carneiro, C.; Machado, J.; Mendes, A. Accelerated aging of anticorrosive coatings: Two-stage approach to the AC/DC/AC electrochemical method. Prog. Org. Coat. 2020, 138, 105365. [Google Scholar] [CrossRef]
- Zhang, J.; Hu, J.; Zhang, J.; Cao, C. Studies of impedance models and water transport behaviors of polypropylene coated metals in NaCl solution. Prog. Org. Coat. 2004, 49, 293–301. [Google Scholar] [CrossRef]
- Lin, H.; Wang, Y. An organic phosphonic acid doped polyaniline/zirconia/epoxy composite coating for metal protection in the marine environment. Prog. Org. Coat. 2023, 182, 107671. [Google Scholar] [CrossRef]
- Chen, J.; Zhao, W. Silk fibroin-Ti3C2TX hybrid nanofiller enhance corrosion protection for waterborne epoxy coatings under deep sea environment. Chem. Eng. J. 2021, 423, 130195. [Google Scholar] [CrossRef]
- Sun, J.; Li, W.; Li, N.; Zhan, Y.; Tian, L.; Wang, Y. Effect of surface modified nano-SiO2 particles on properties of TO@CA/SR self-healing anti-corrosion composite coating. Prog. Org. Coat. 2022, 164, 106689. [Google Scholar] [CrossRef]


| BH-532 | |
|---|---|
| Solid content (%) | 45 ± 2 |
| Amine hydrogen equivalent | 220–280 |
| VOC content (%) | <2 |
| pH | 9–10 |
| BH-653 | |
|---|---|
| Solid content (%) | 60 ± 2 |
| Epoxy equivalent | 180–230 |
| Viscosity (mpa·s/25 °C) | <2 |
| pH | 2–7 |
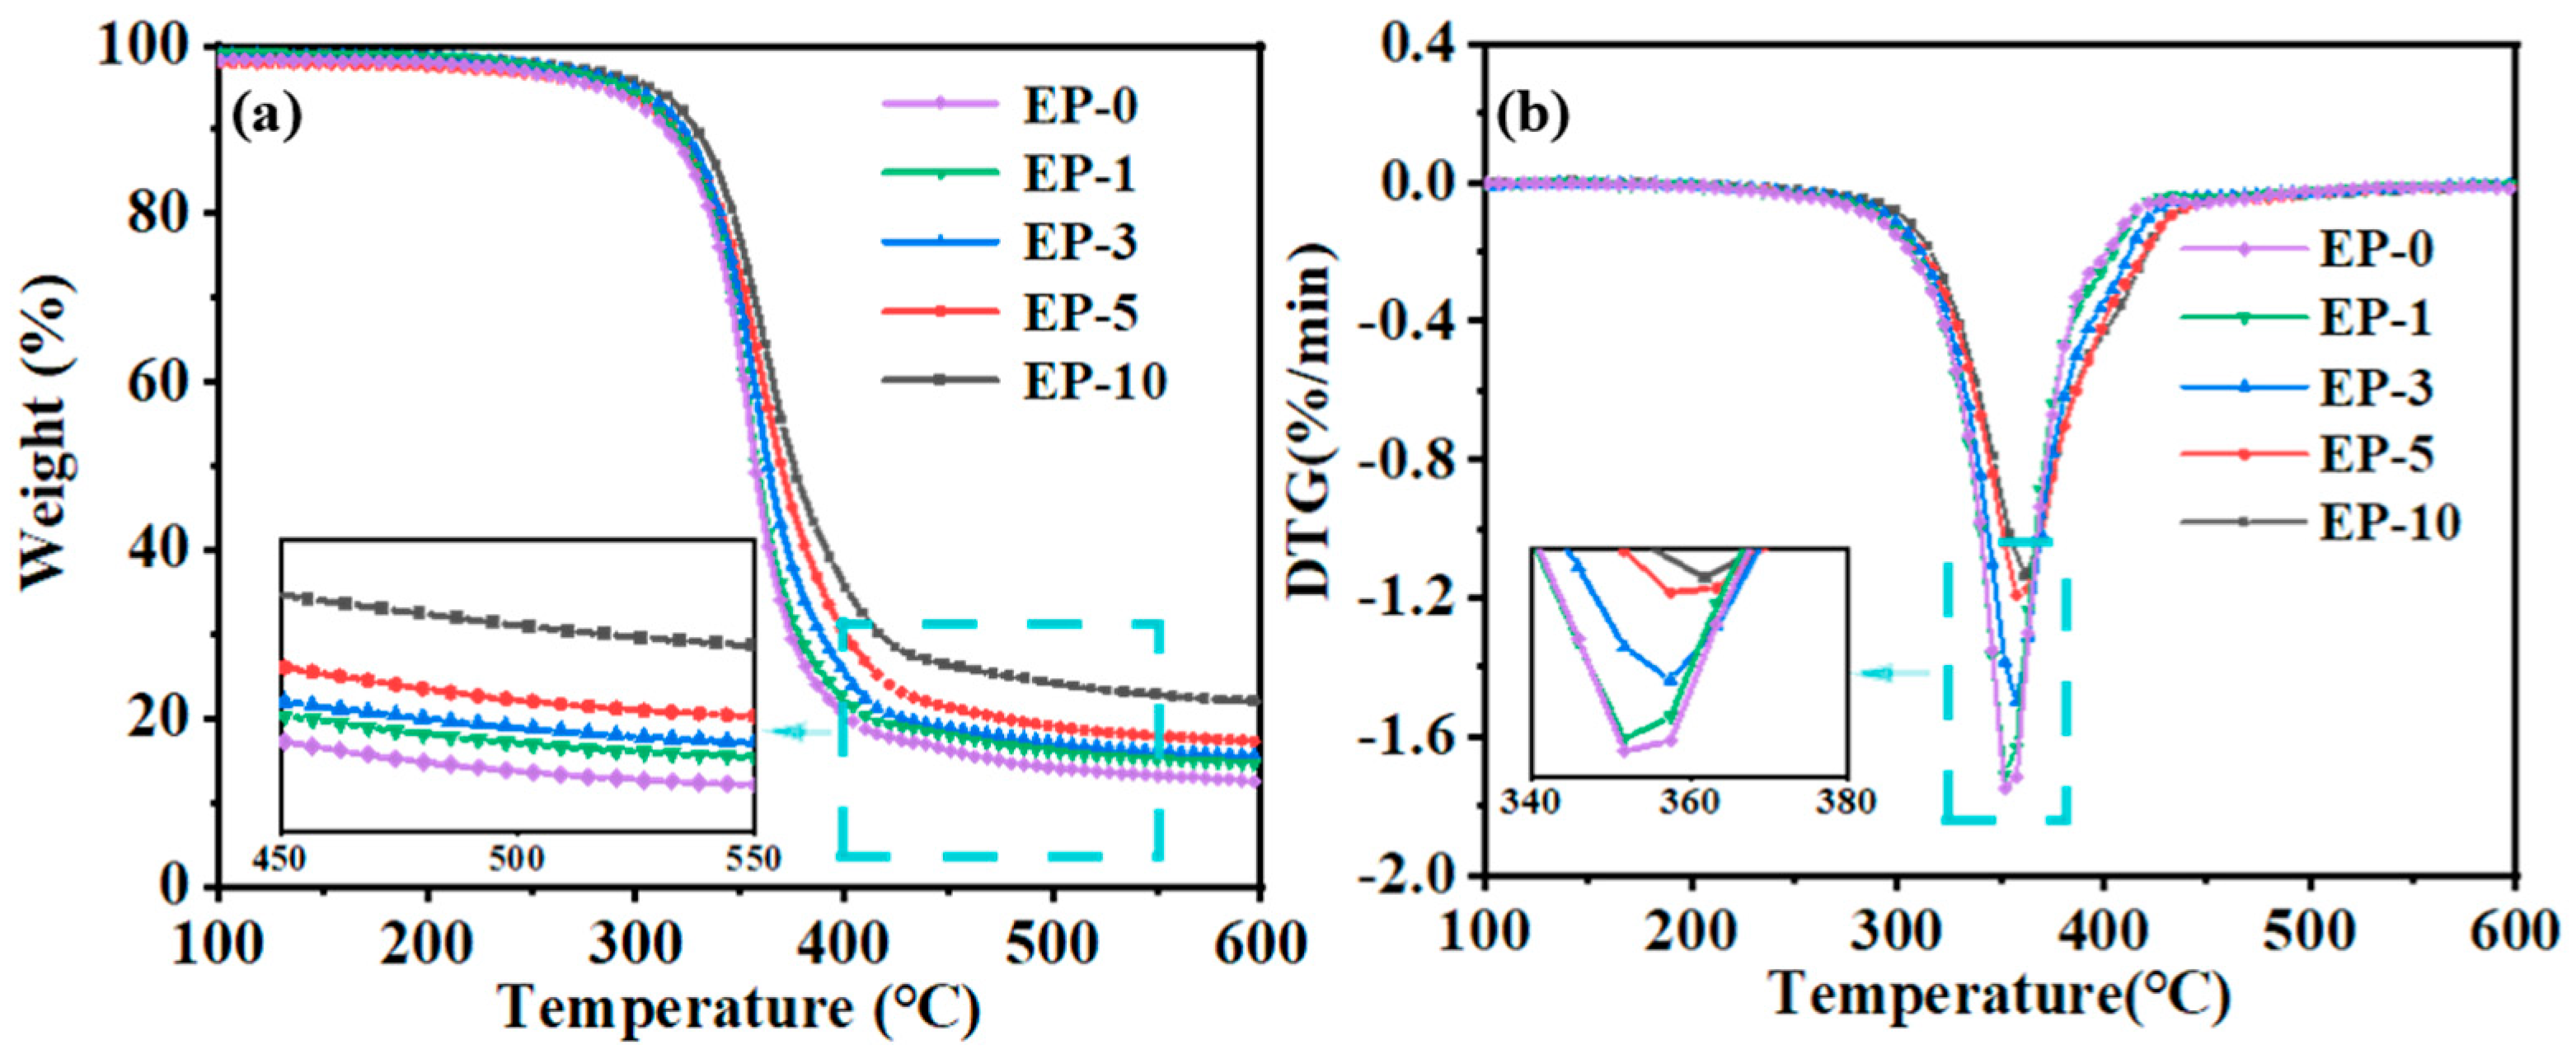
| Sample | T−50% (°C) | Tdpeak (°C) | Remain Content (%) |
|---|---|---|---|
| EP-0 | 356.1 | 351.6 | 12.5 |
| EP-1 | 357.6 | 352.1 | 14.6 |
| EP-3 | 362.3 | 356.8 | 15.6 |
| EP-5 | 369.4 | 357.4 | 17.2 |
| EP-10 | 376.3 | 361.8 | 20.7 |
Disclaimer/Publisher’s Note: The statements, opinions and data contained in all publications are solely those of the individual author(s) and contributor(s) and not of MDPI and/or the editor(s). MDPI and/or the editor(s) disclaim responsibility for any injury to people or property resulting from any ideas, methods, instructions or products referred to in the content. |
© 2023 by the authors. Licensee MDPI, Basel, Switzerland. This article is an open access article distributed under the terms and conditions of the Creative Commons Attribution (CC BY) license (https://creativecommons.org/licenses/by/4.0/).
Share and Cite
Fan, B.; Yang, J.; Cao, L.; Wang, X.; Li, J.; Yang, Y.; Wang, Q.; Zhang, P.; Vogel, F.; Li, W.; et al. Revealing the Impact of Micro-SiO2 Filer Content on the Anti-Corrosion Performance of Water-Borne Epoxy Resin. Polymers 2023, 15, 3273. https://doi.org/10.3390/polym15153273
Fan B, Yang J, Cao L, Wang X, Li J, Yang Y, Wang Q, Zhang P, Vogel F, Li W, et al. Revealing the Impact of Micro-SiO2 Filer Content on the Anti-Corrosion Performance of Water-Borne Epoxy Resin. Polymers. 2023; 15(15):3273. https://doi.org/10.3390/polym15153273
Chicago/Turabian StyleFan, Bifeng, Junjie Yang, Lin Cao, Xiao Wang, Jie Li, Yingfei Yang, Qiwei Wang, Peng Zhang, Florin Vogel, Wei Li, and et al. 2023. "Revealing the Impact of Micro-SiO2 Filer Content on the Anti-Corrosion Performance of Water-Borne Epoxy Resin" Polymers 15, no. 15: 3273. https://doi.org/10.3390/polym15153273
APA StyleFan, B., Yang, J., Cao, L., Wang, X., Li, J., Yang, Y., Wang, Q., Zhang, P., Vogel, F., Li, W., & Lin, Z. (2023). Revealing the Impact of Micro-SiO2 Filer Content on the Anti-Corrosion Performance of Water-Borne Epoxy Resin. Polymers, 15(15), 3273. https://doi.org/10.3390/polym15153273