
Tensile Behavior of Chain Links Made of Polymeric Materials Manufactured by 3D Printing

 ,
, 
Abstract
1. Introduction
2. Materials and Methods
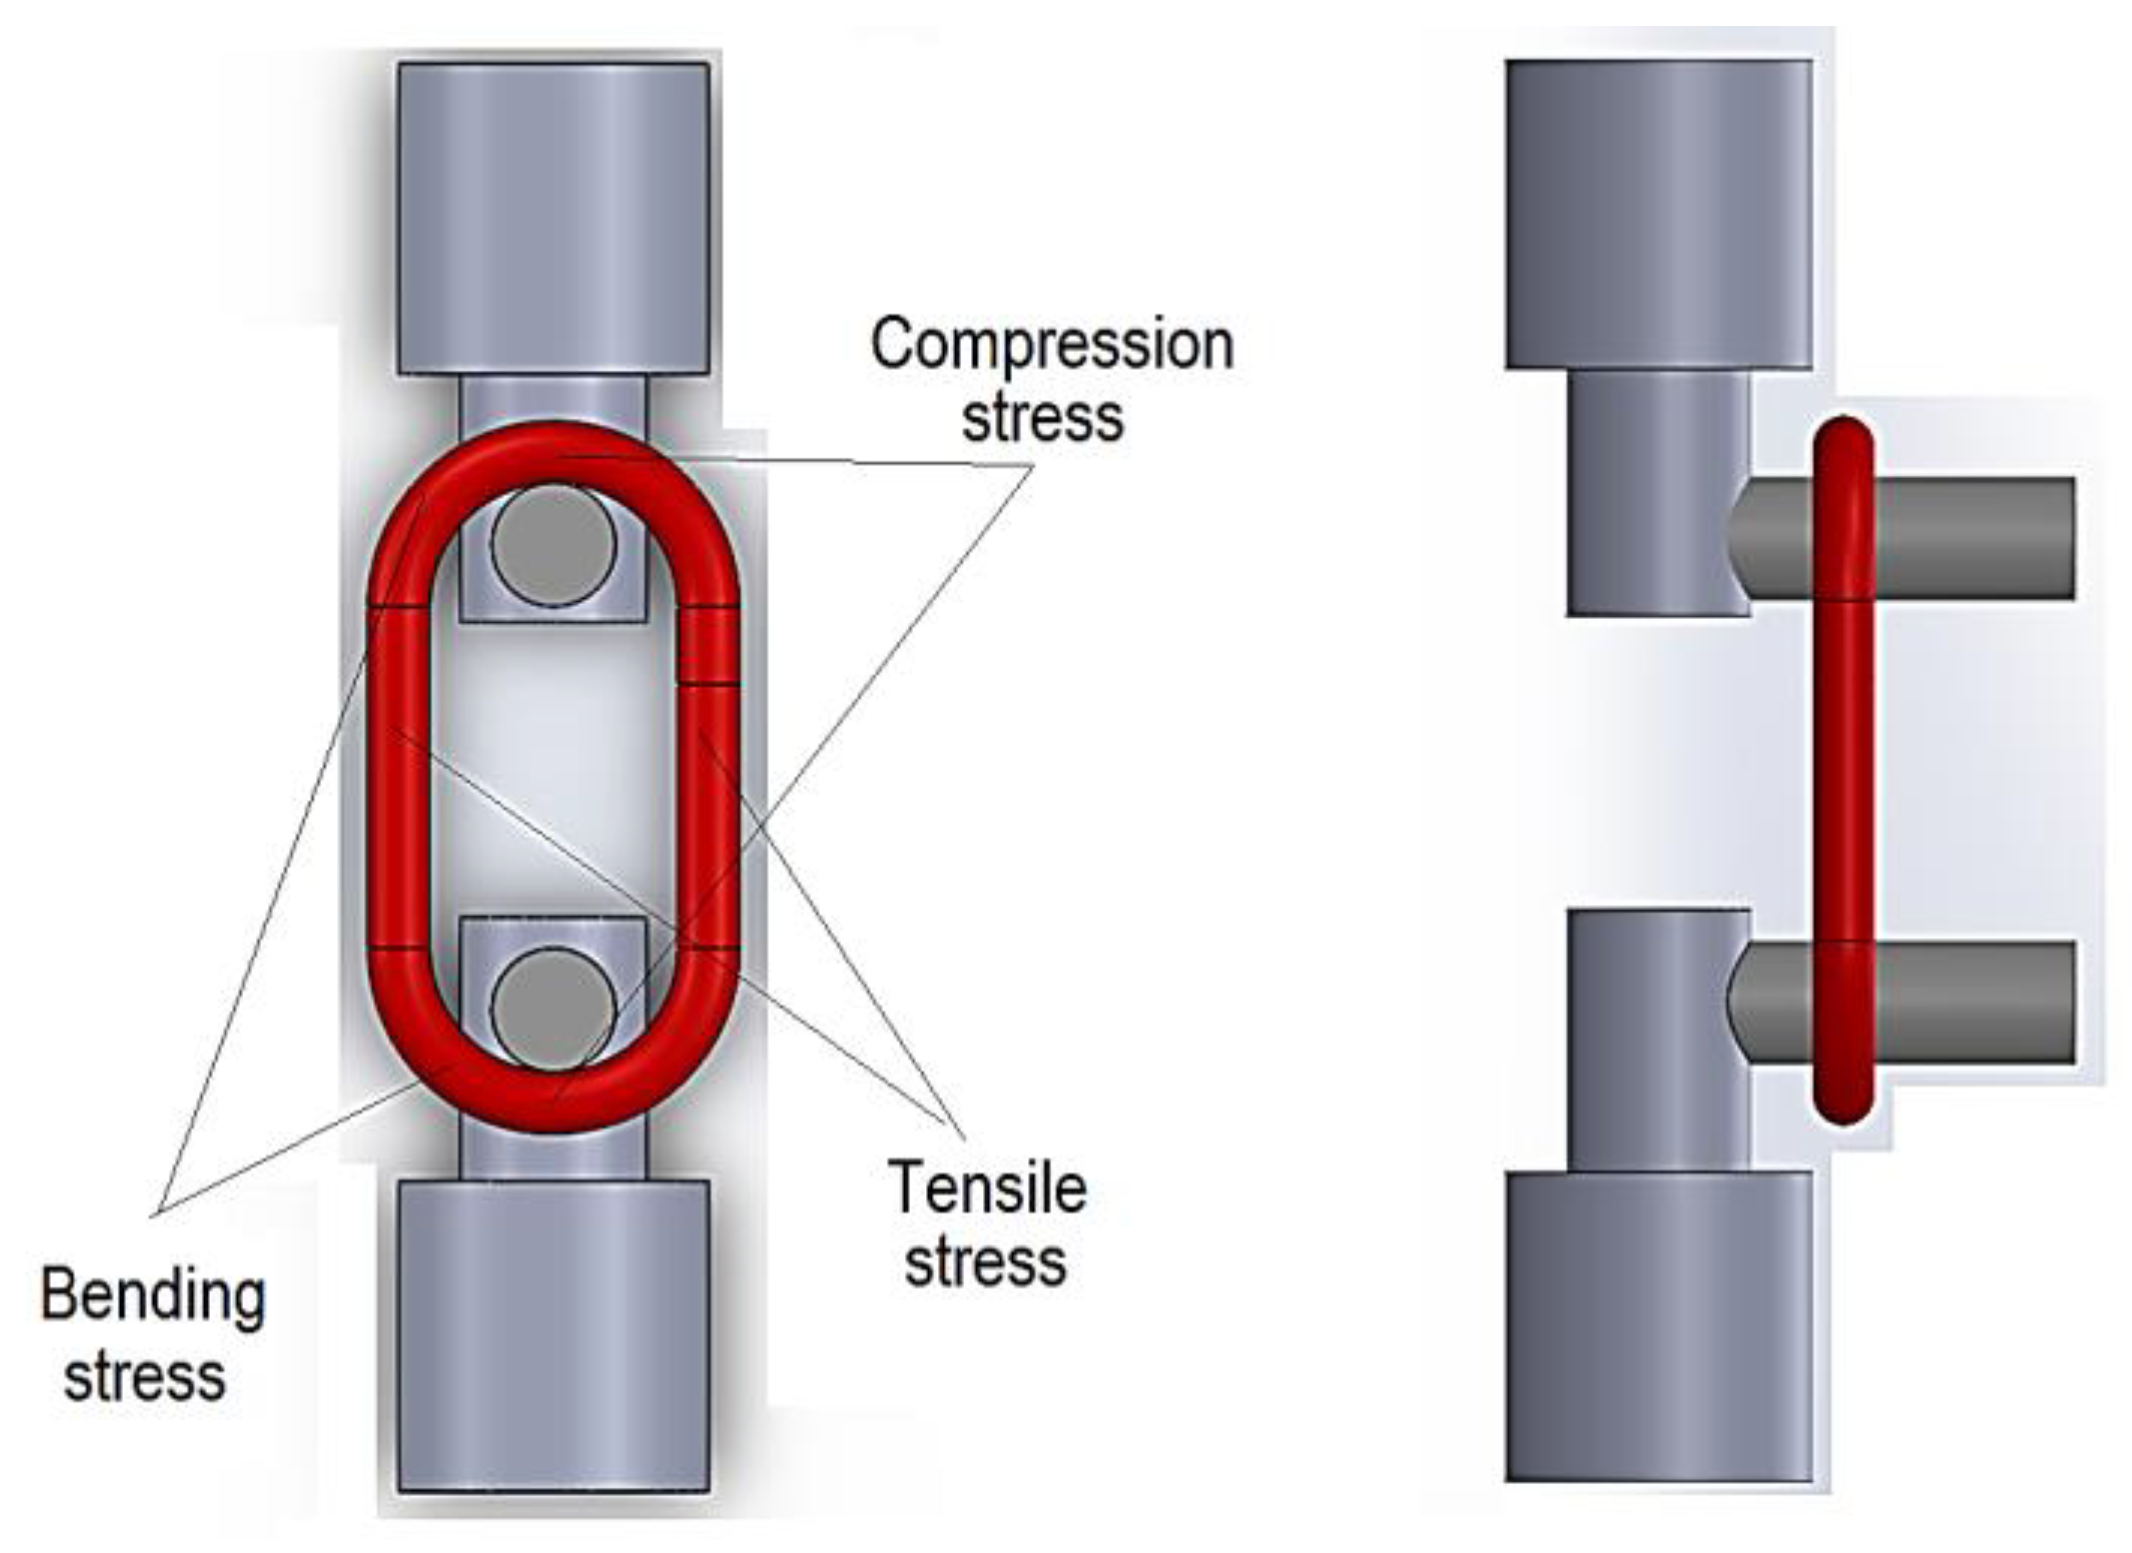
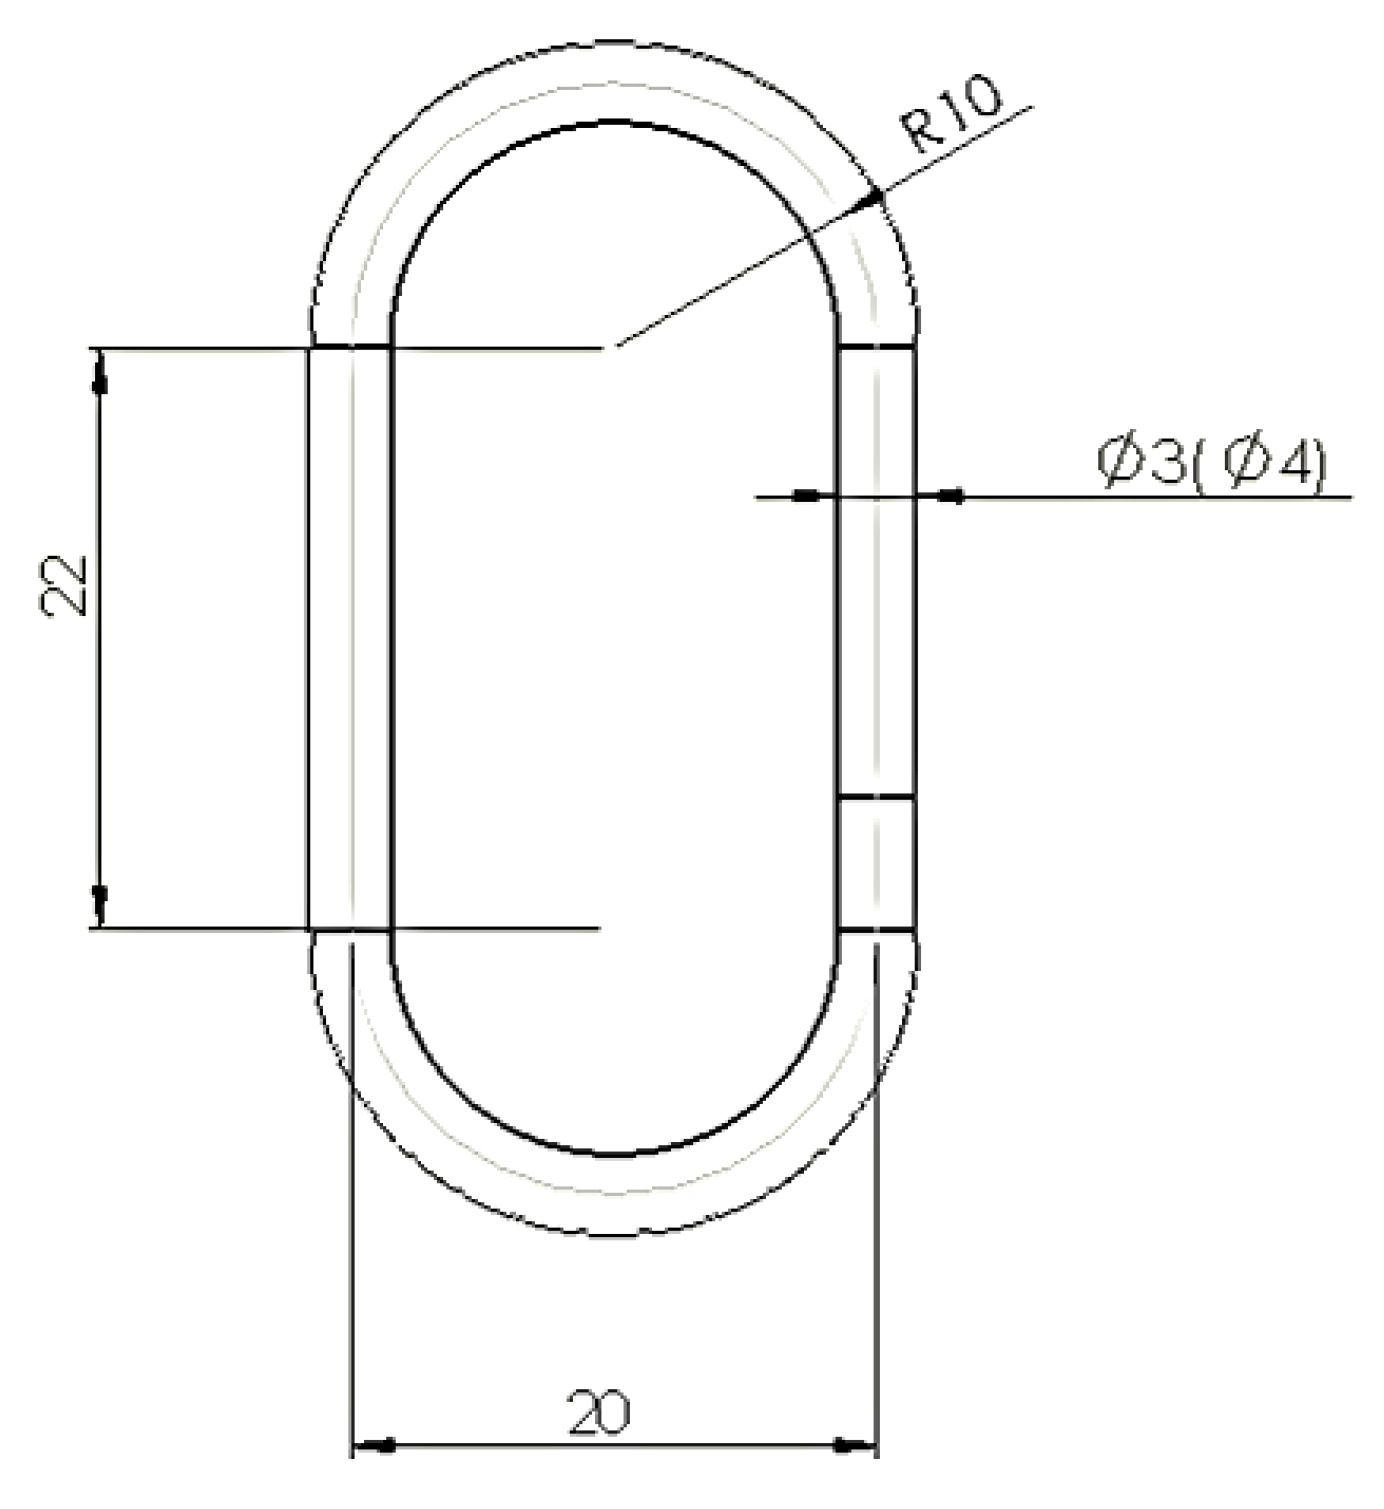
2.1. The Mechanical Loading of a Chain Link
- The sizes and shapes of the chain links;
- The nature and physical-mechanical properties of the polymer material or the composite material with a polymer matrix;
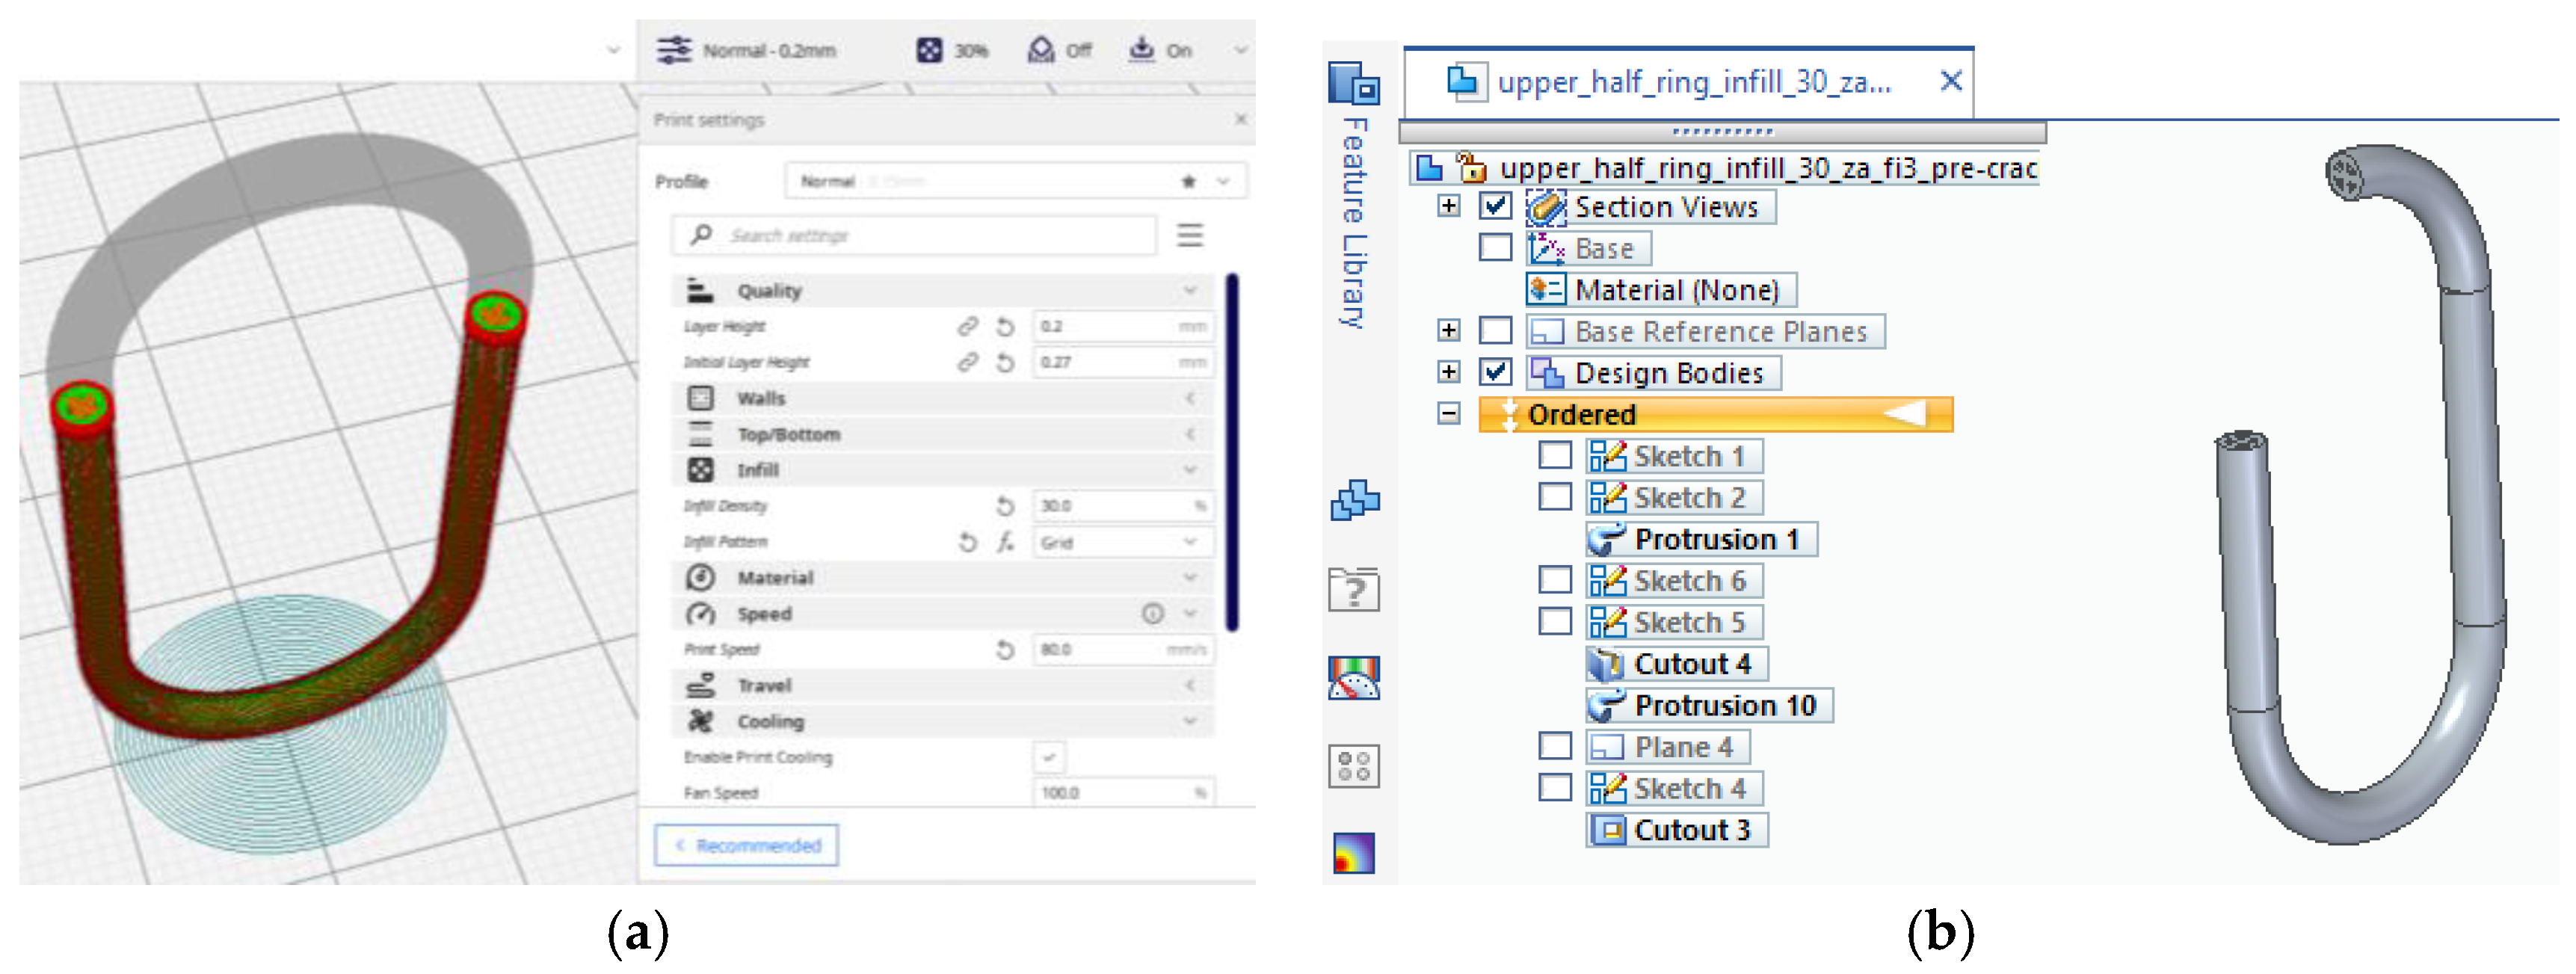
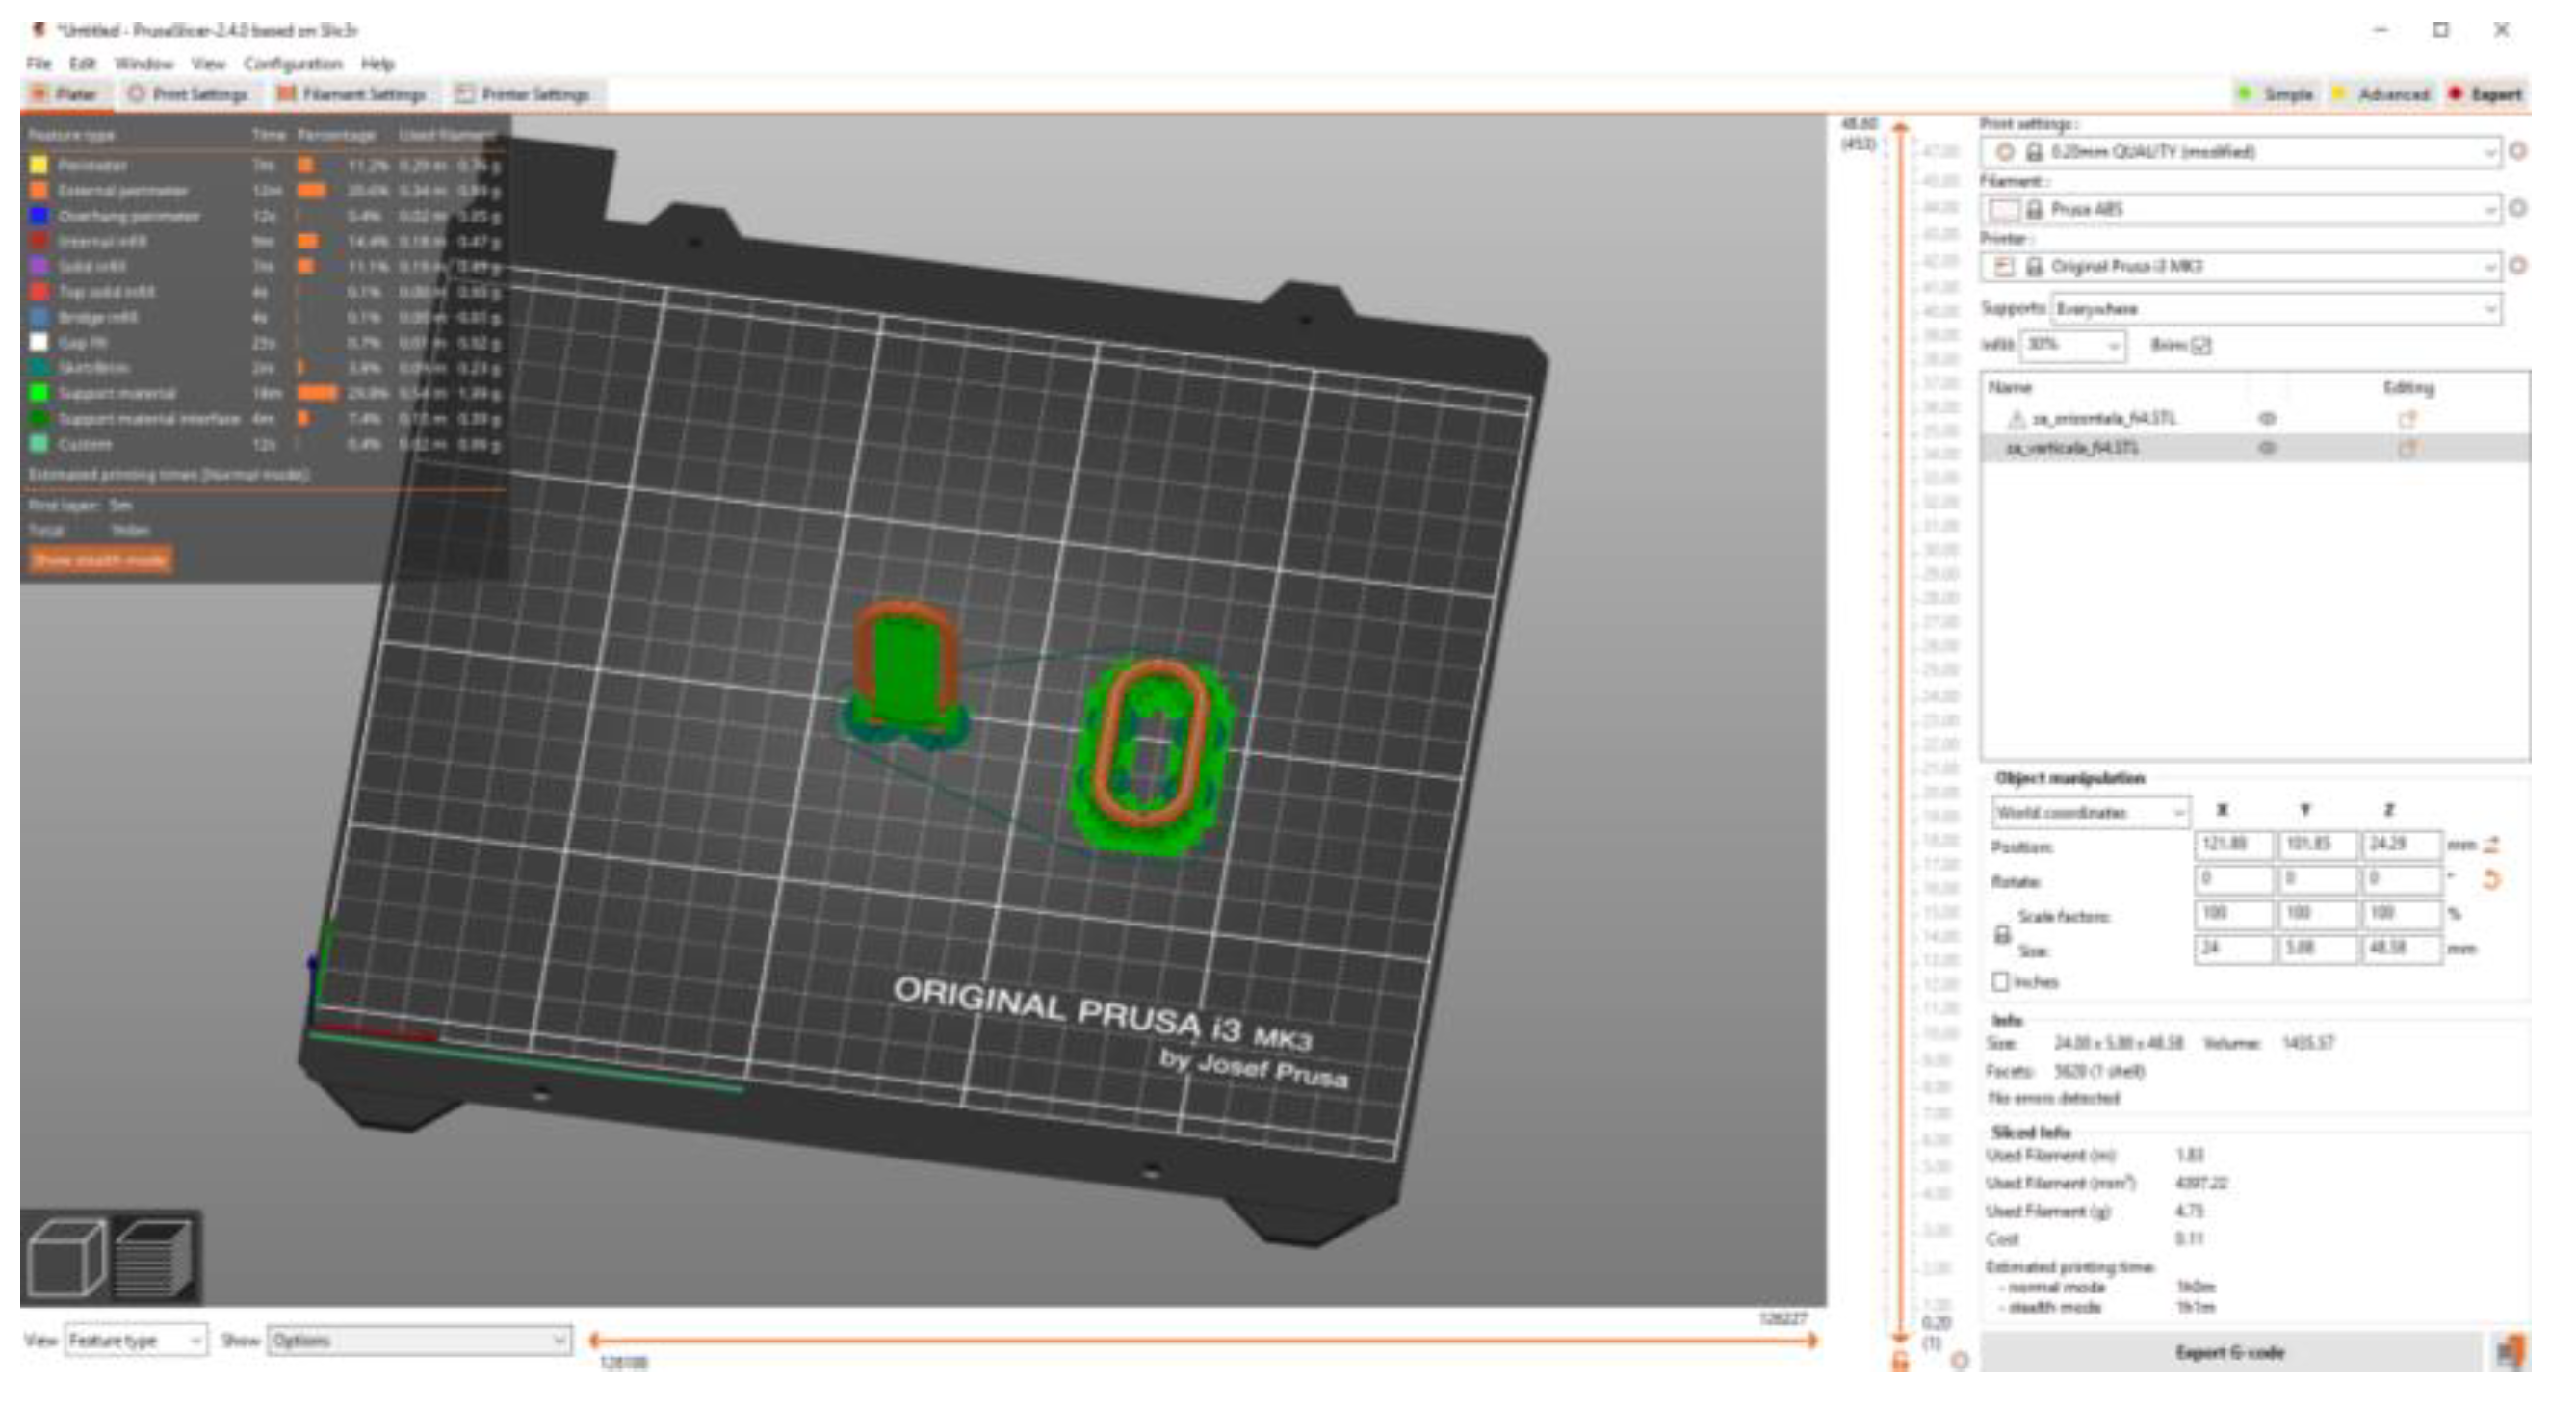
- Some parameters that characterize the conditions for carrying out the 3D printing process;
- The way to load chain links, the nature of these loads, etc.
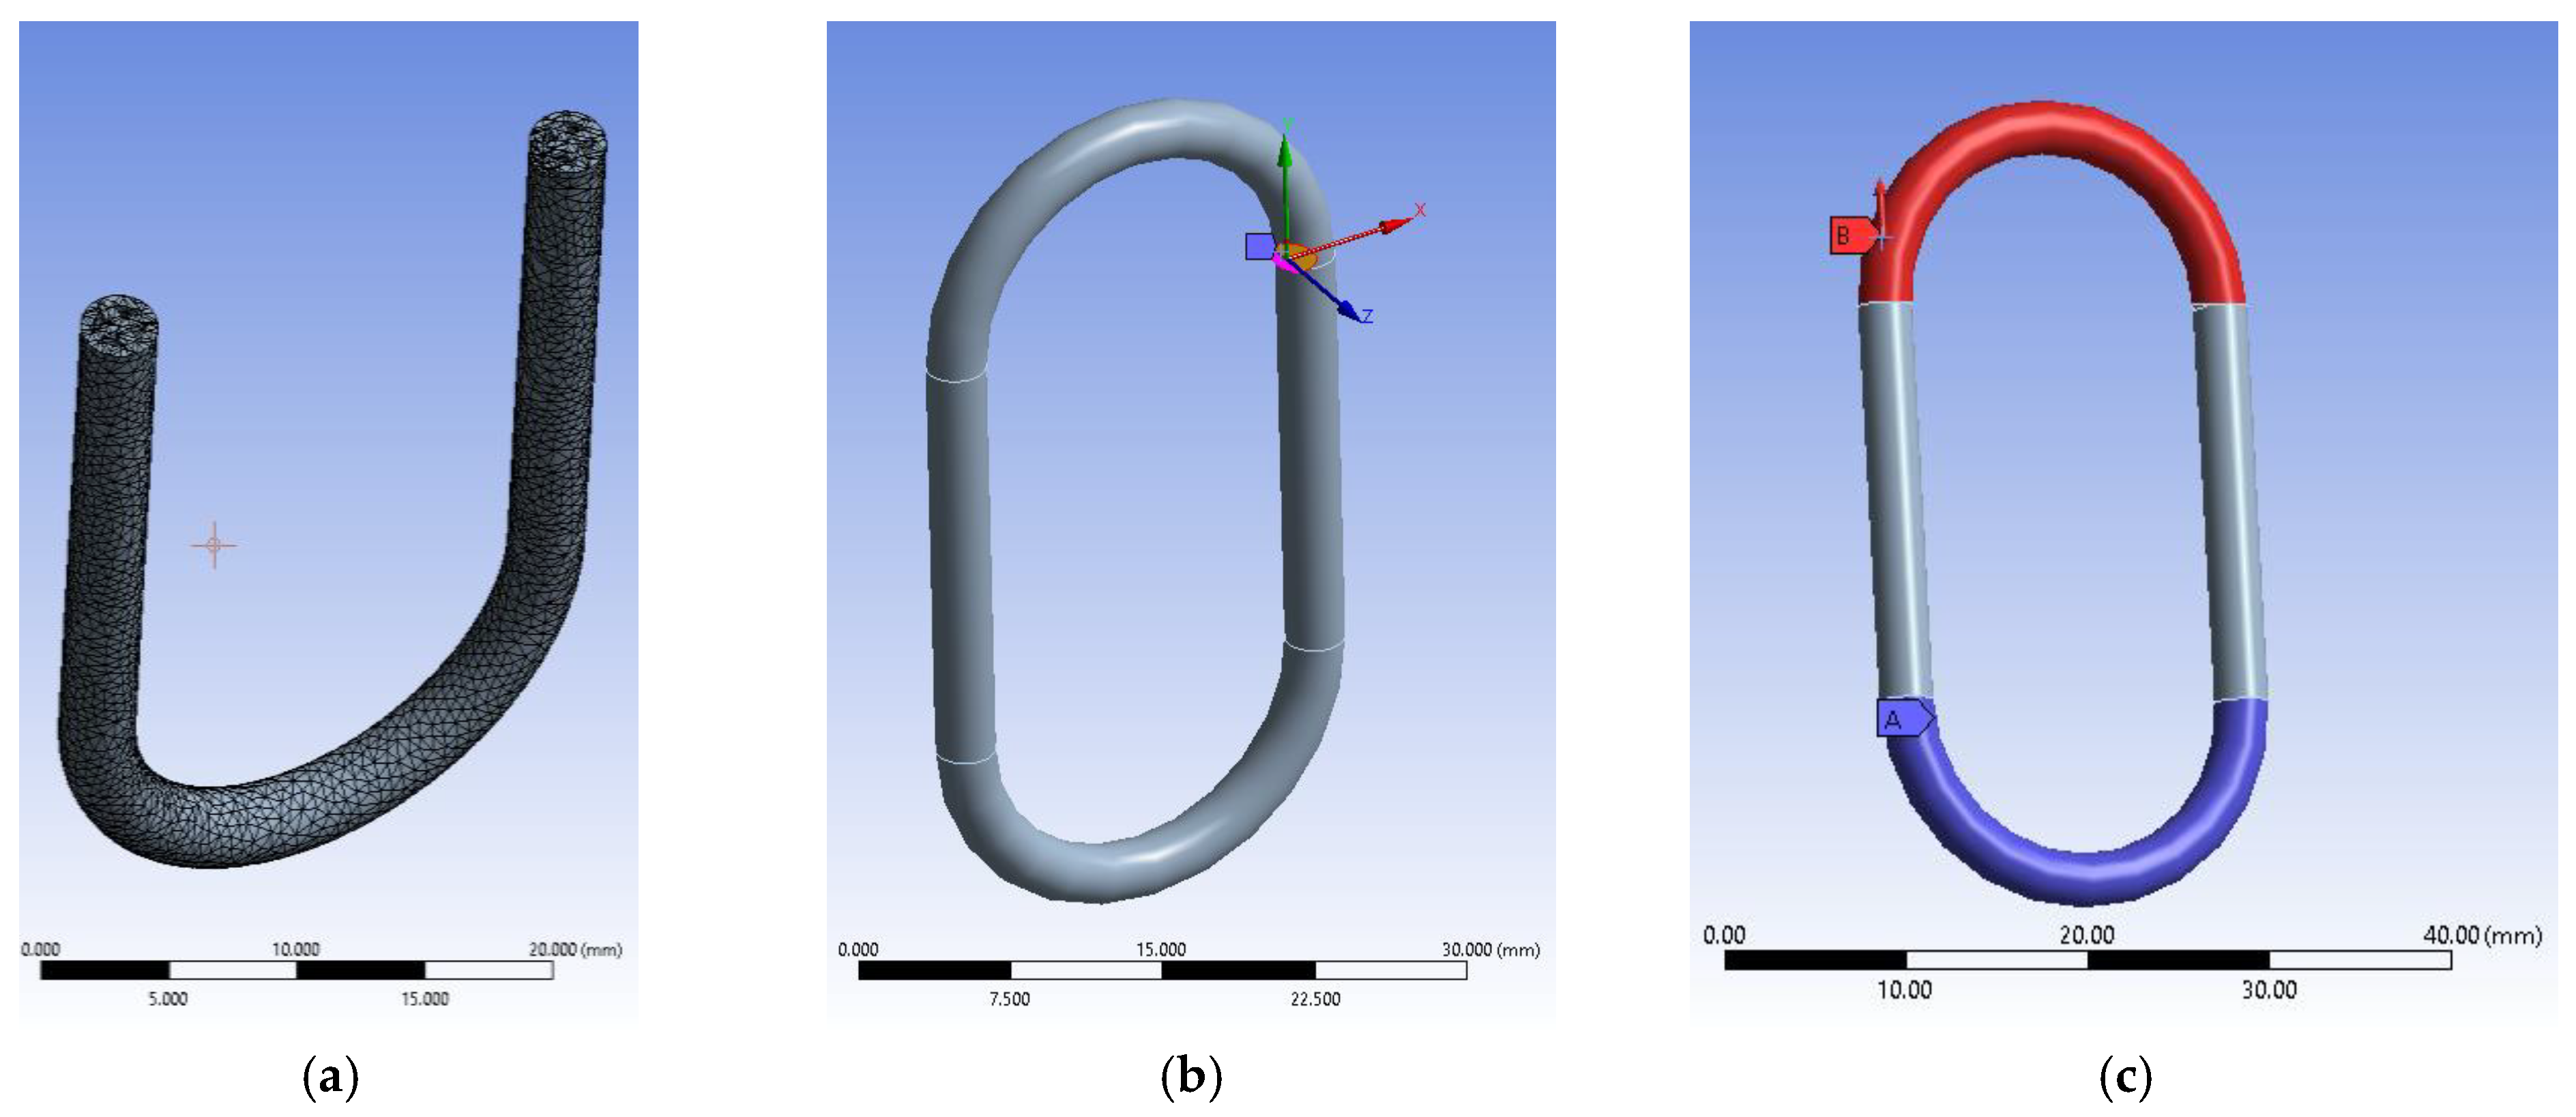
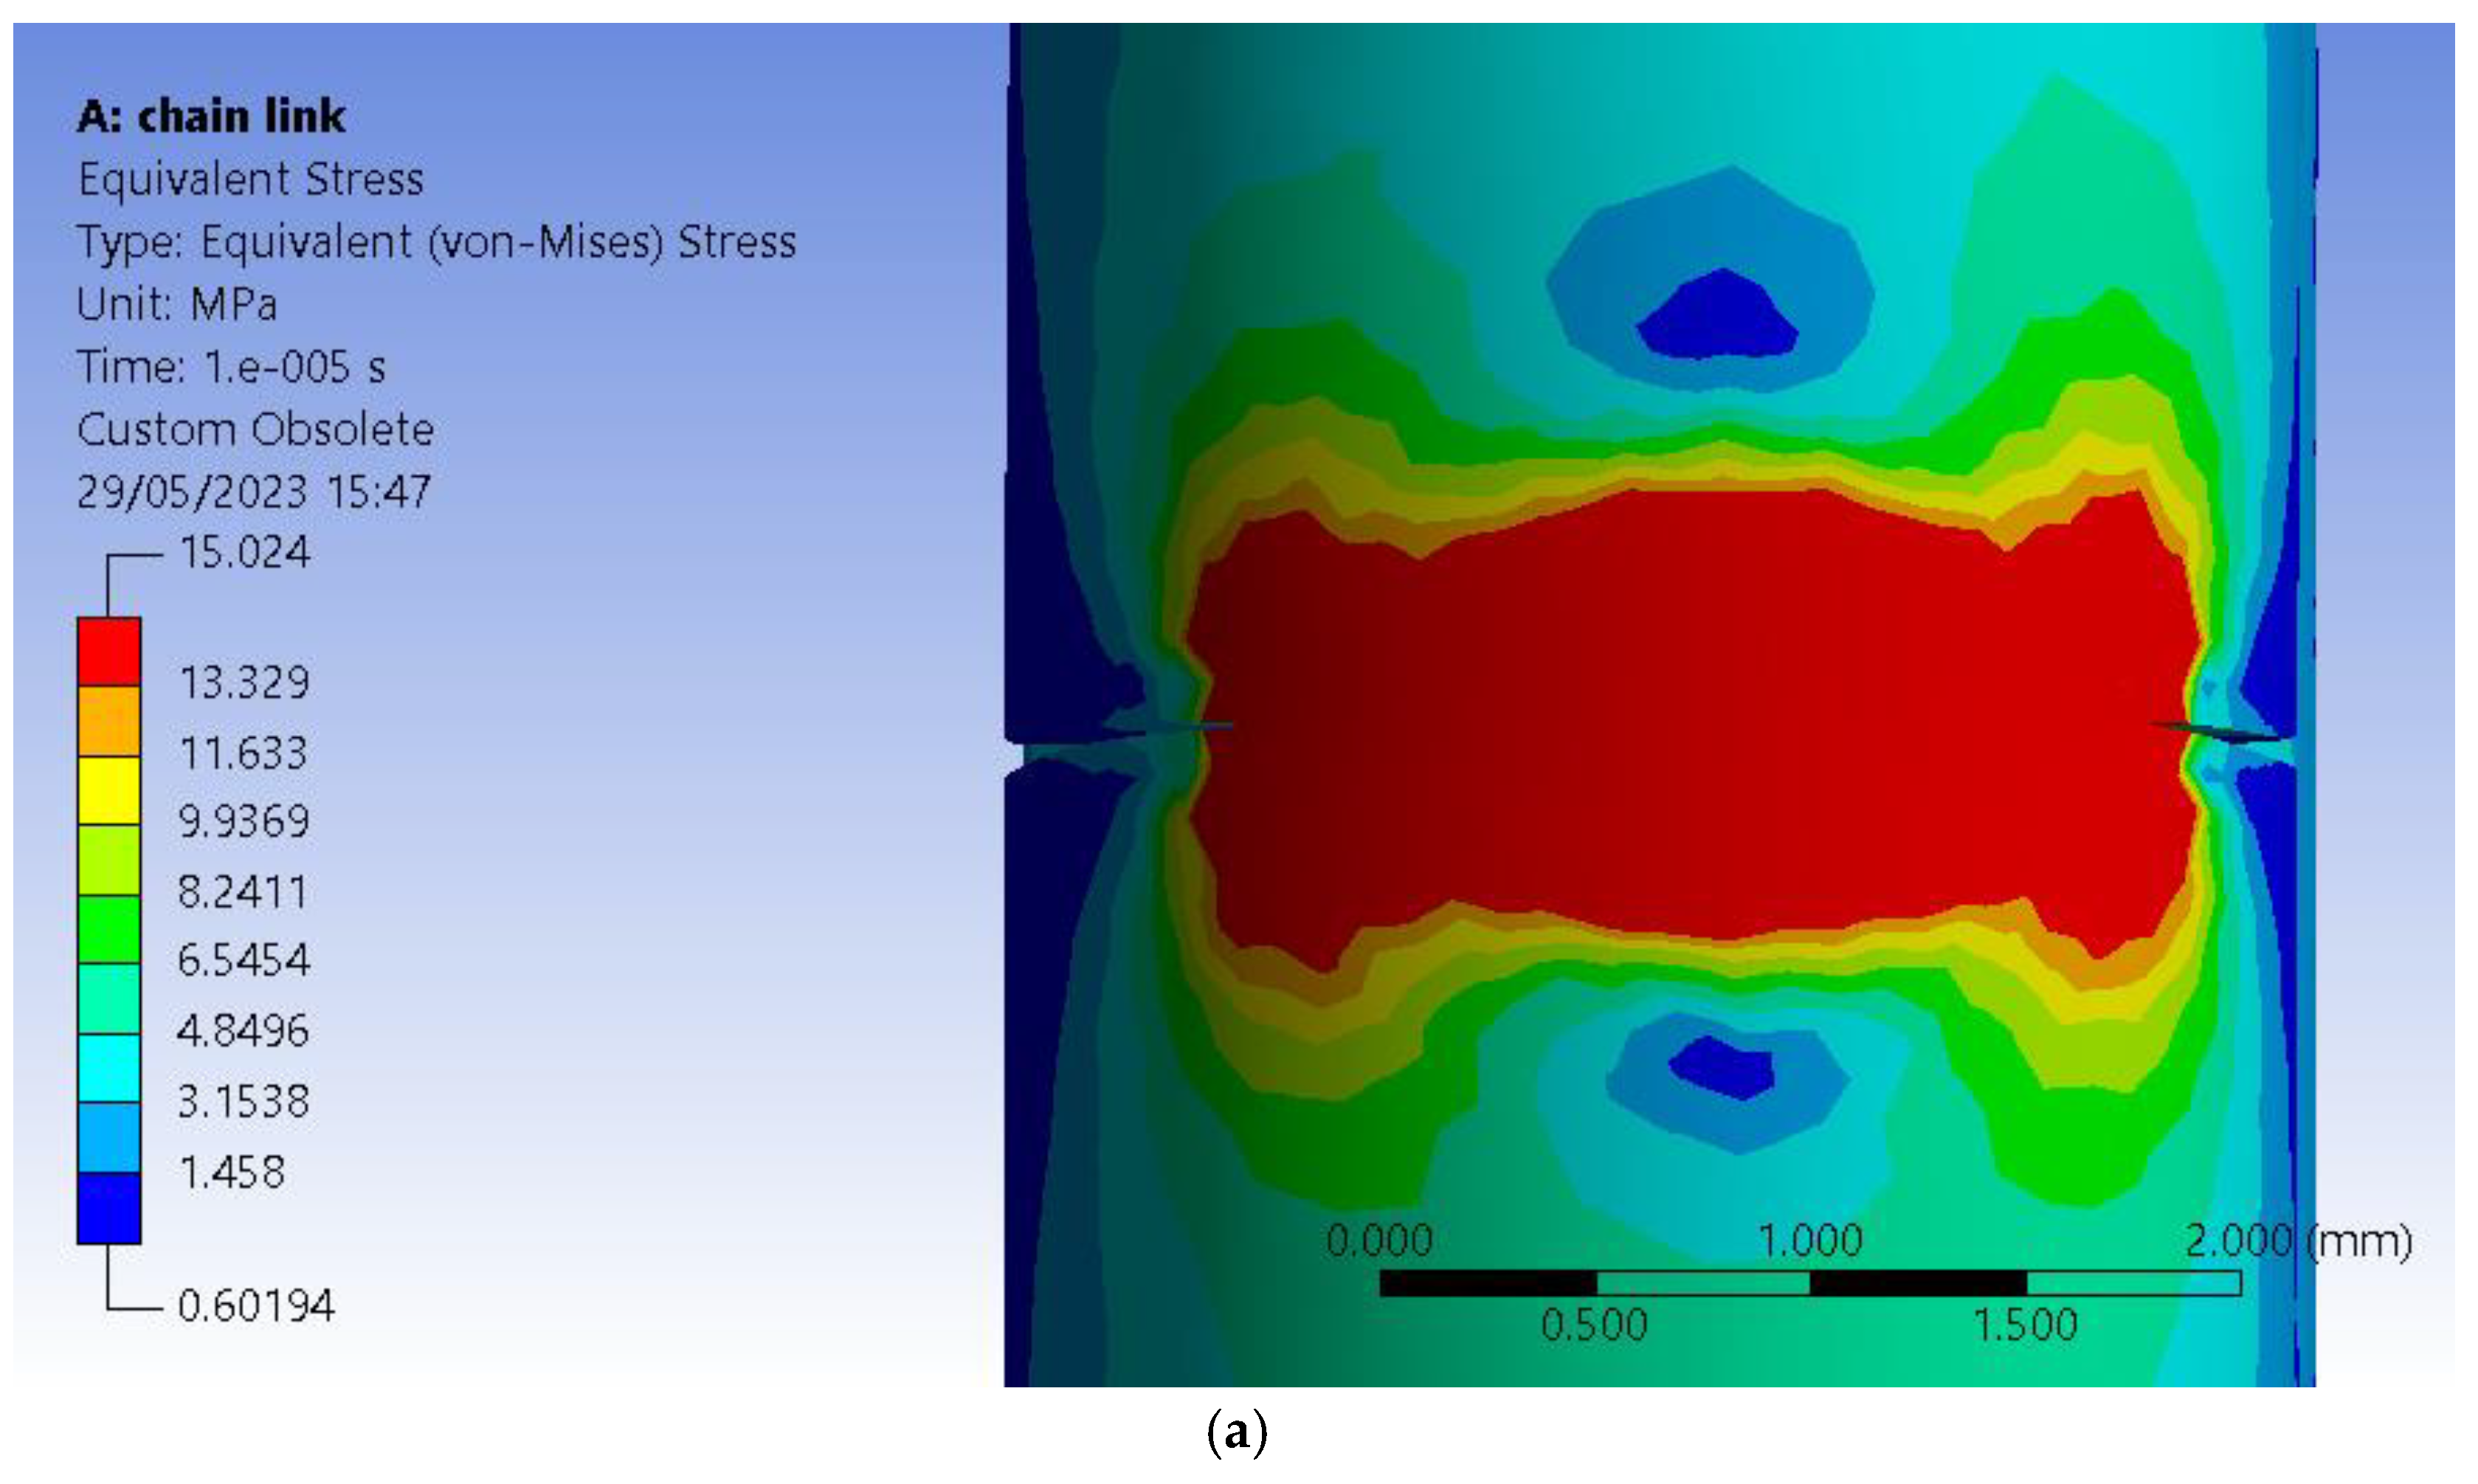
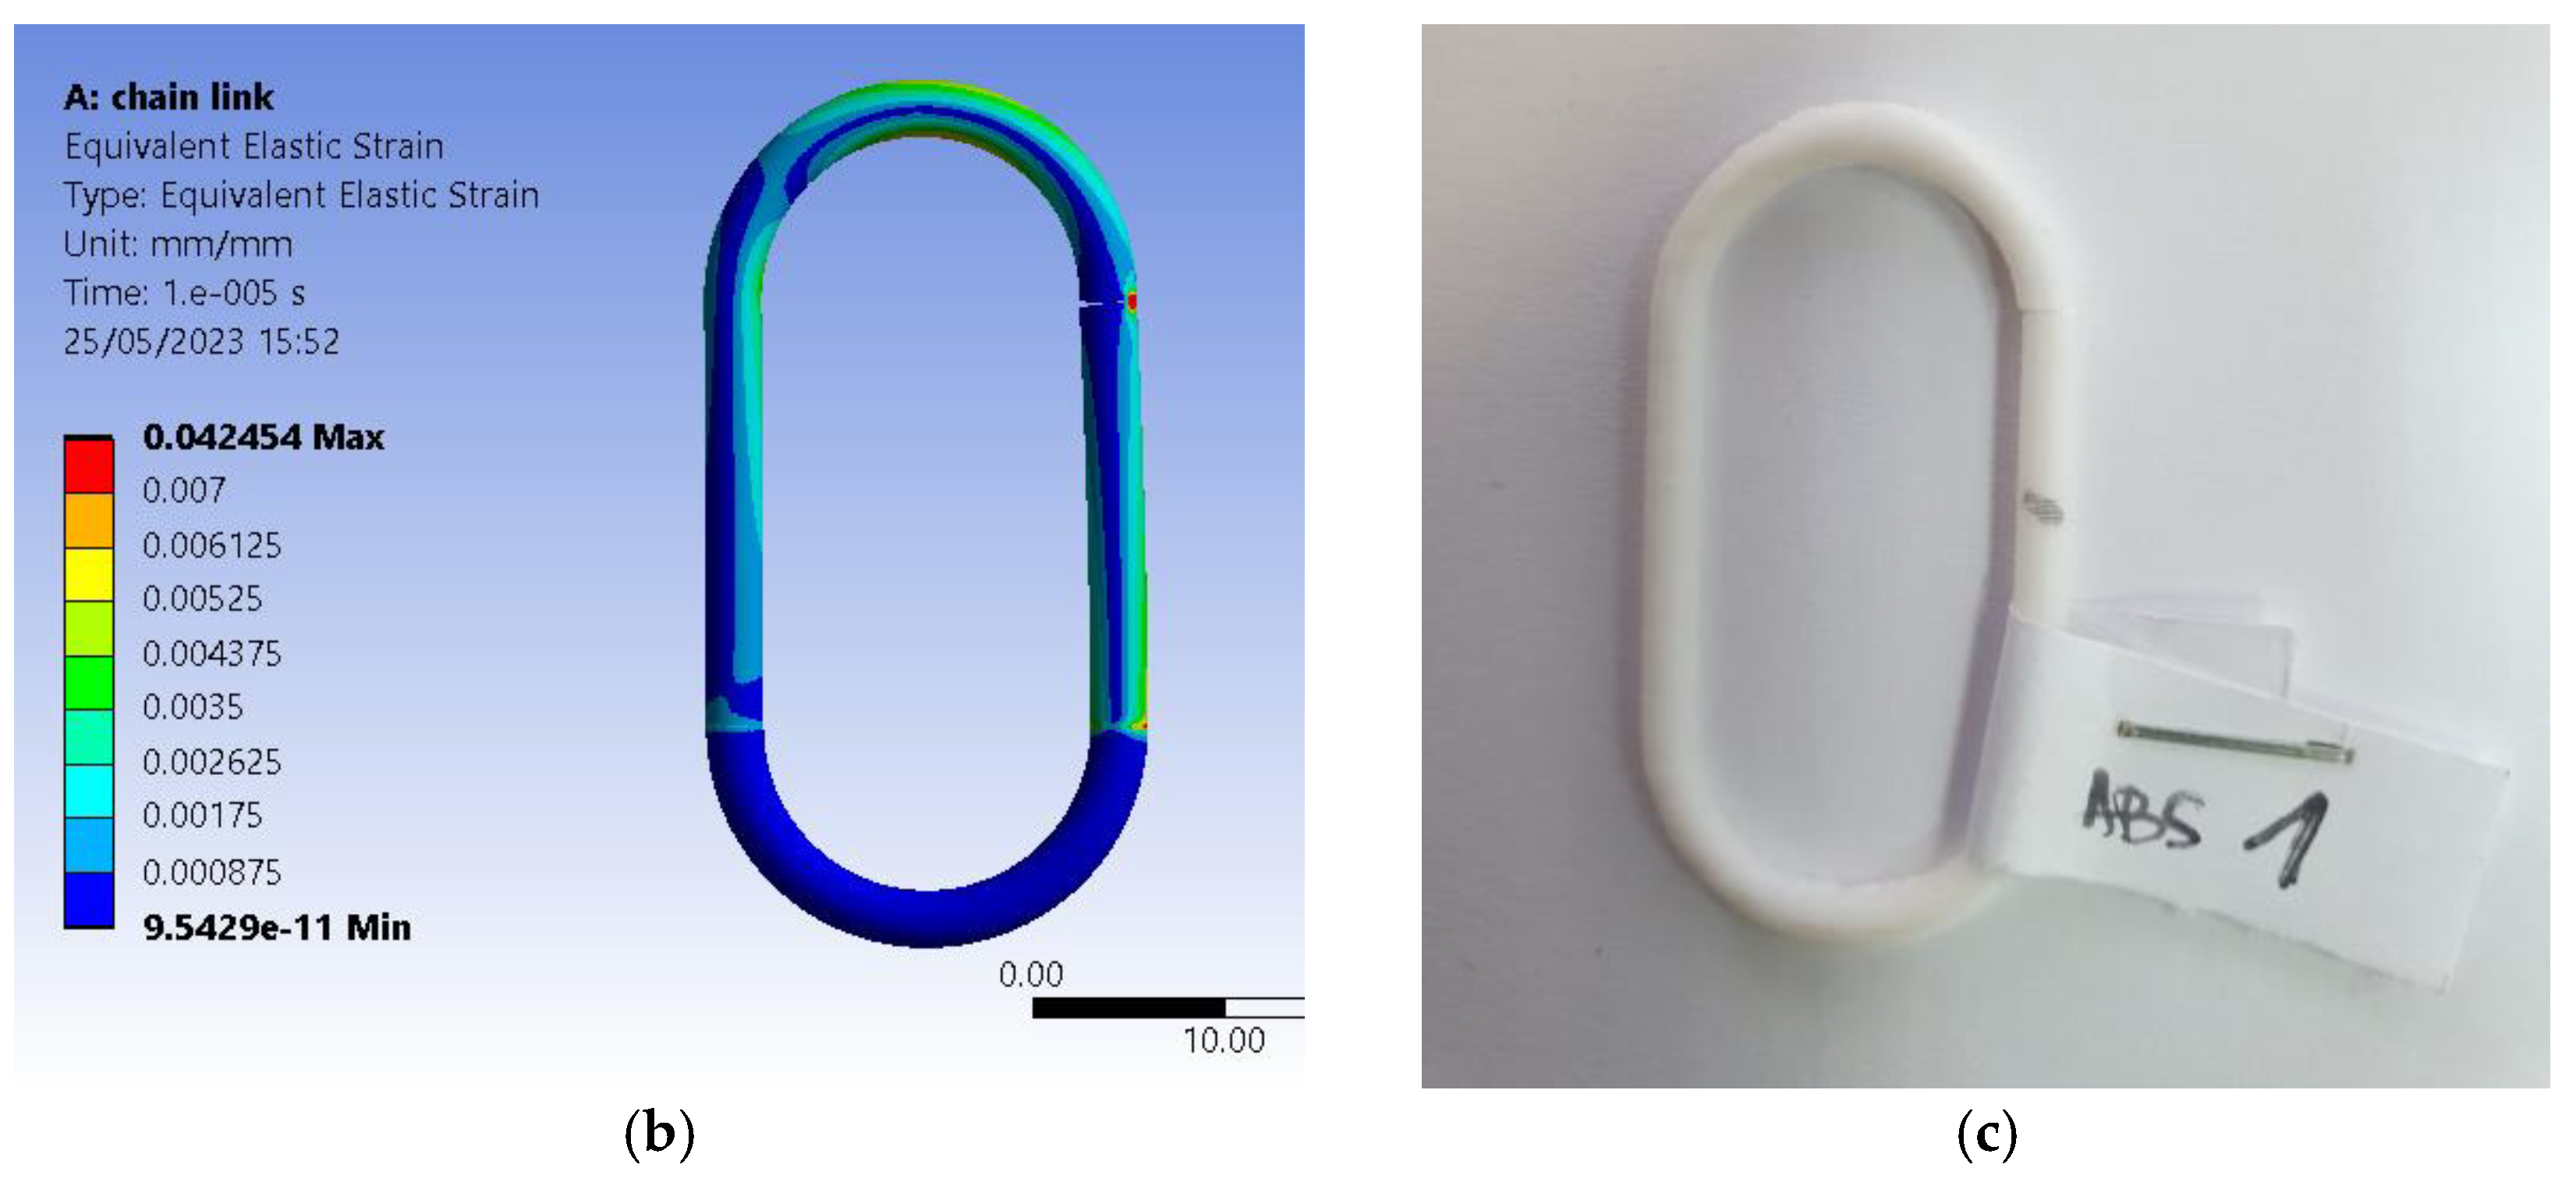
2.2. Finite Element Modeling of the Behavior of a Plastic or Composite Chain Link
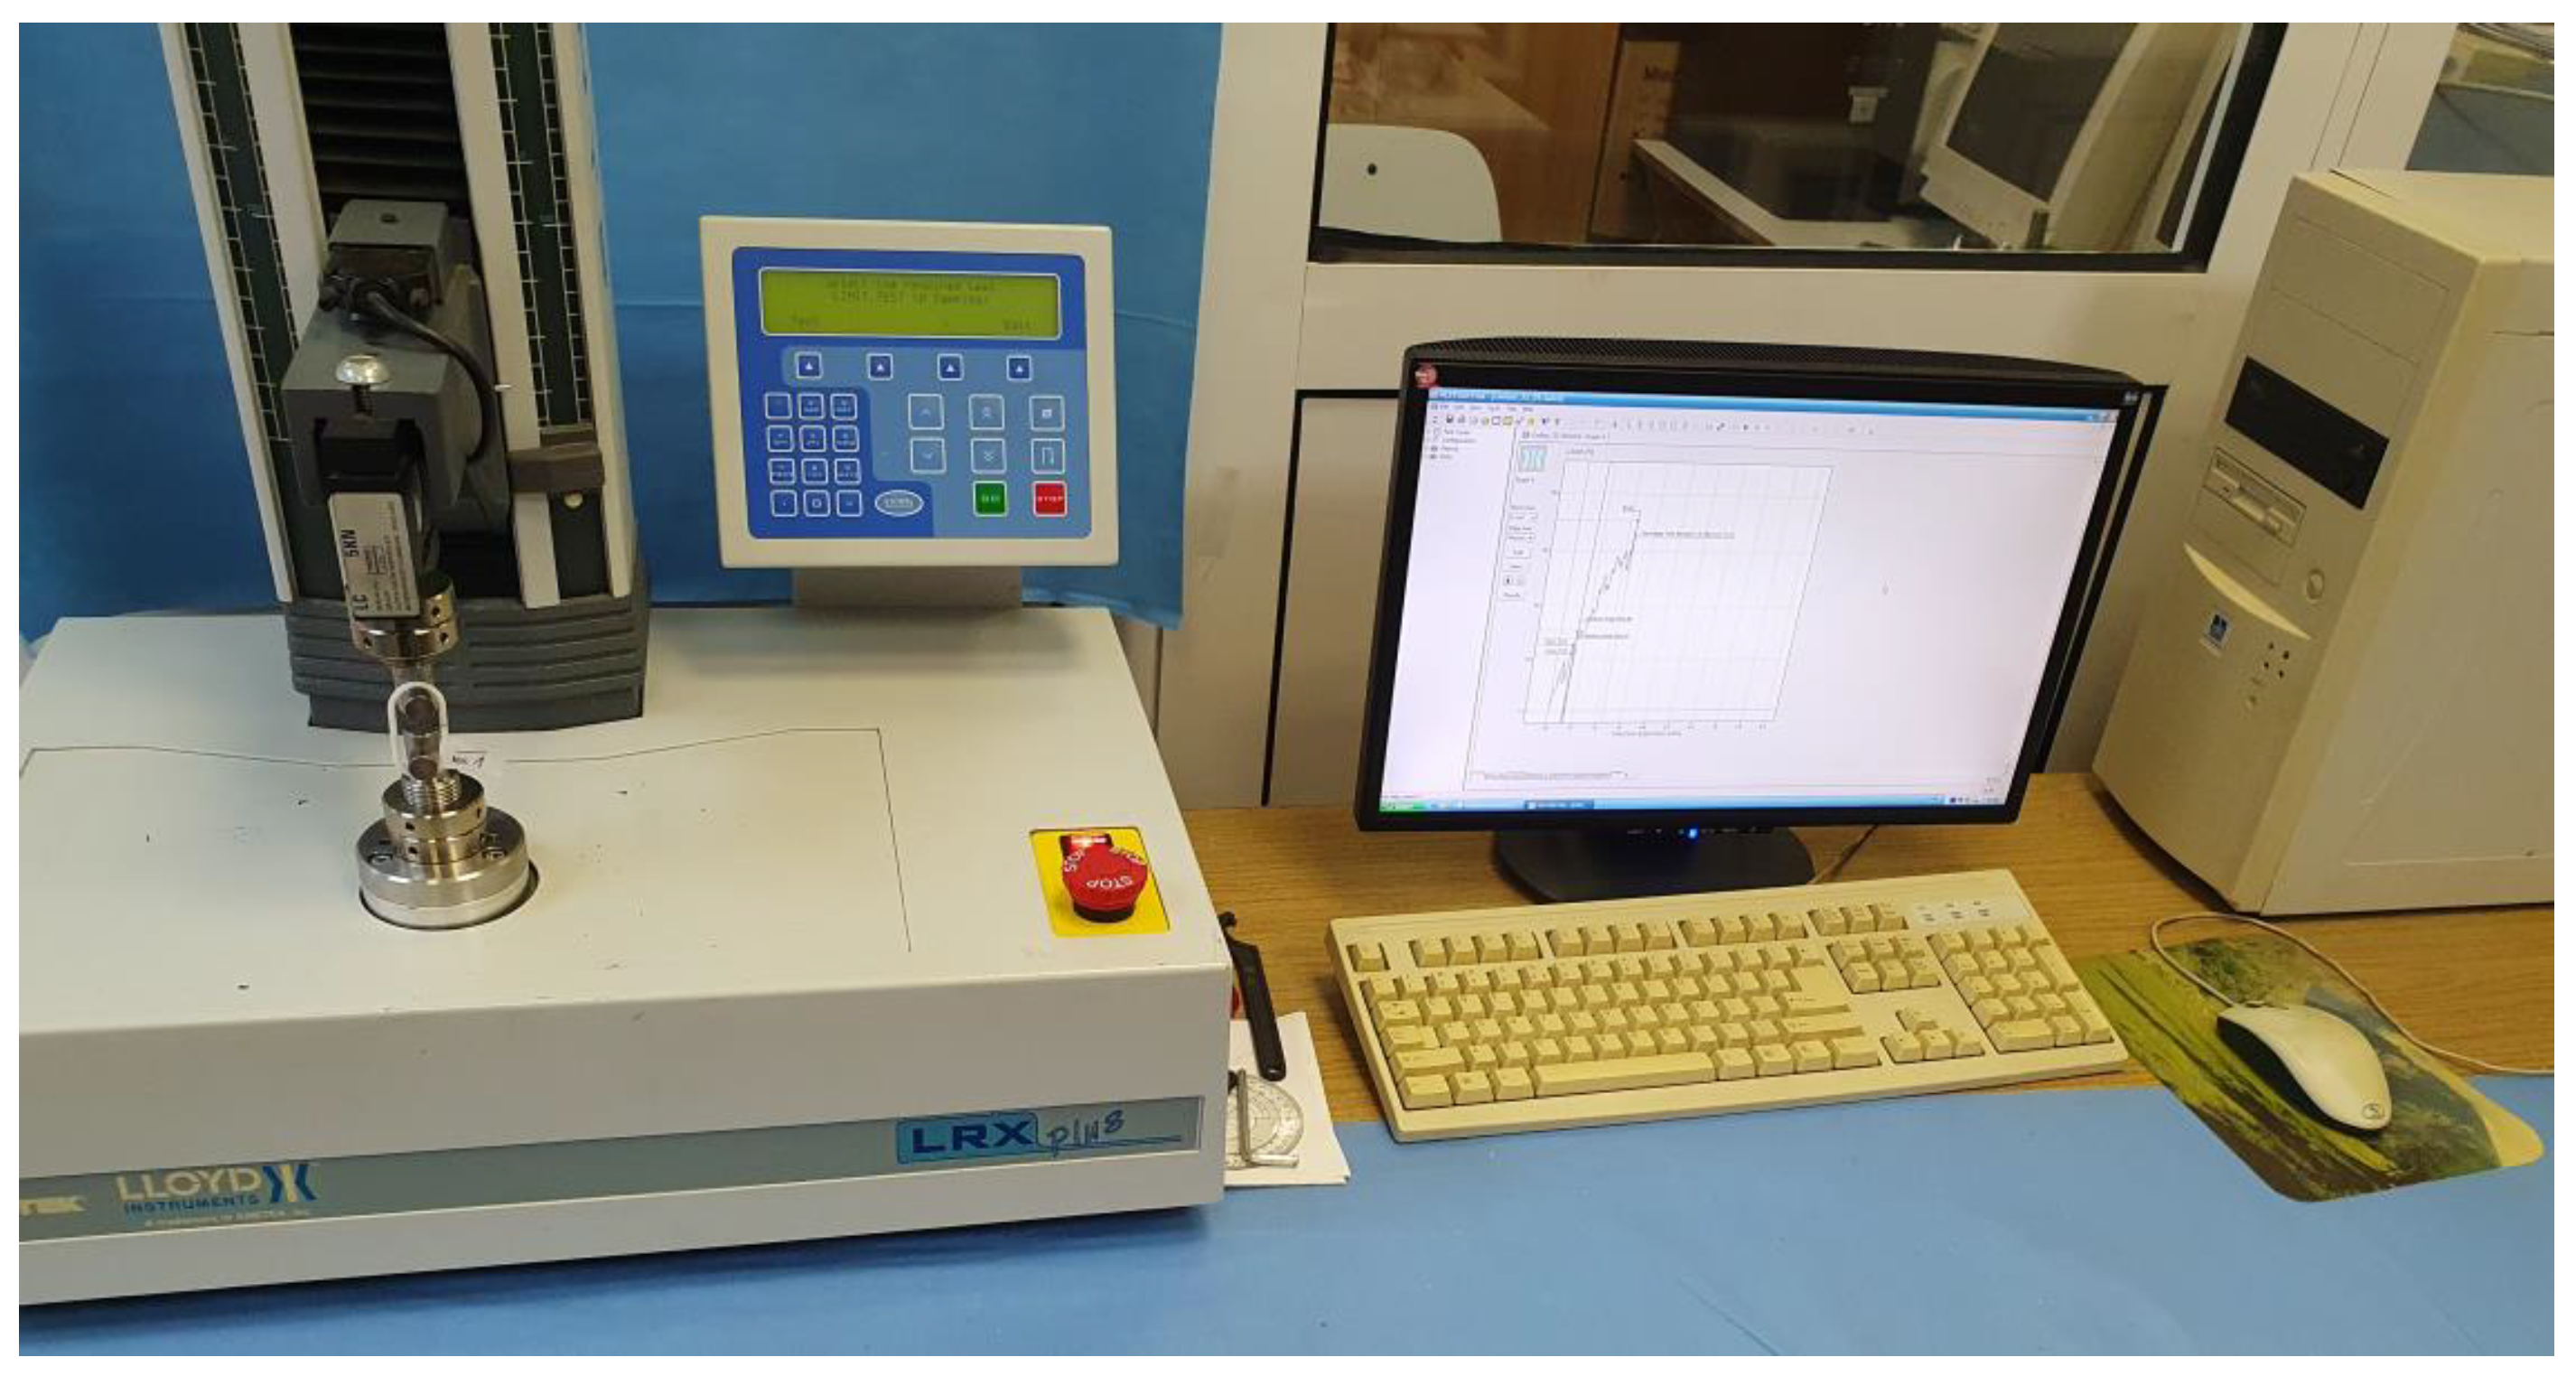
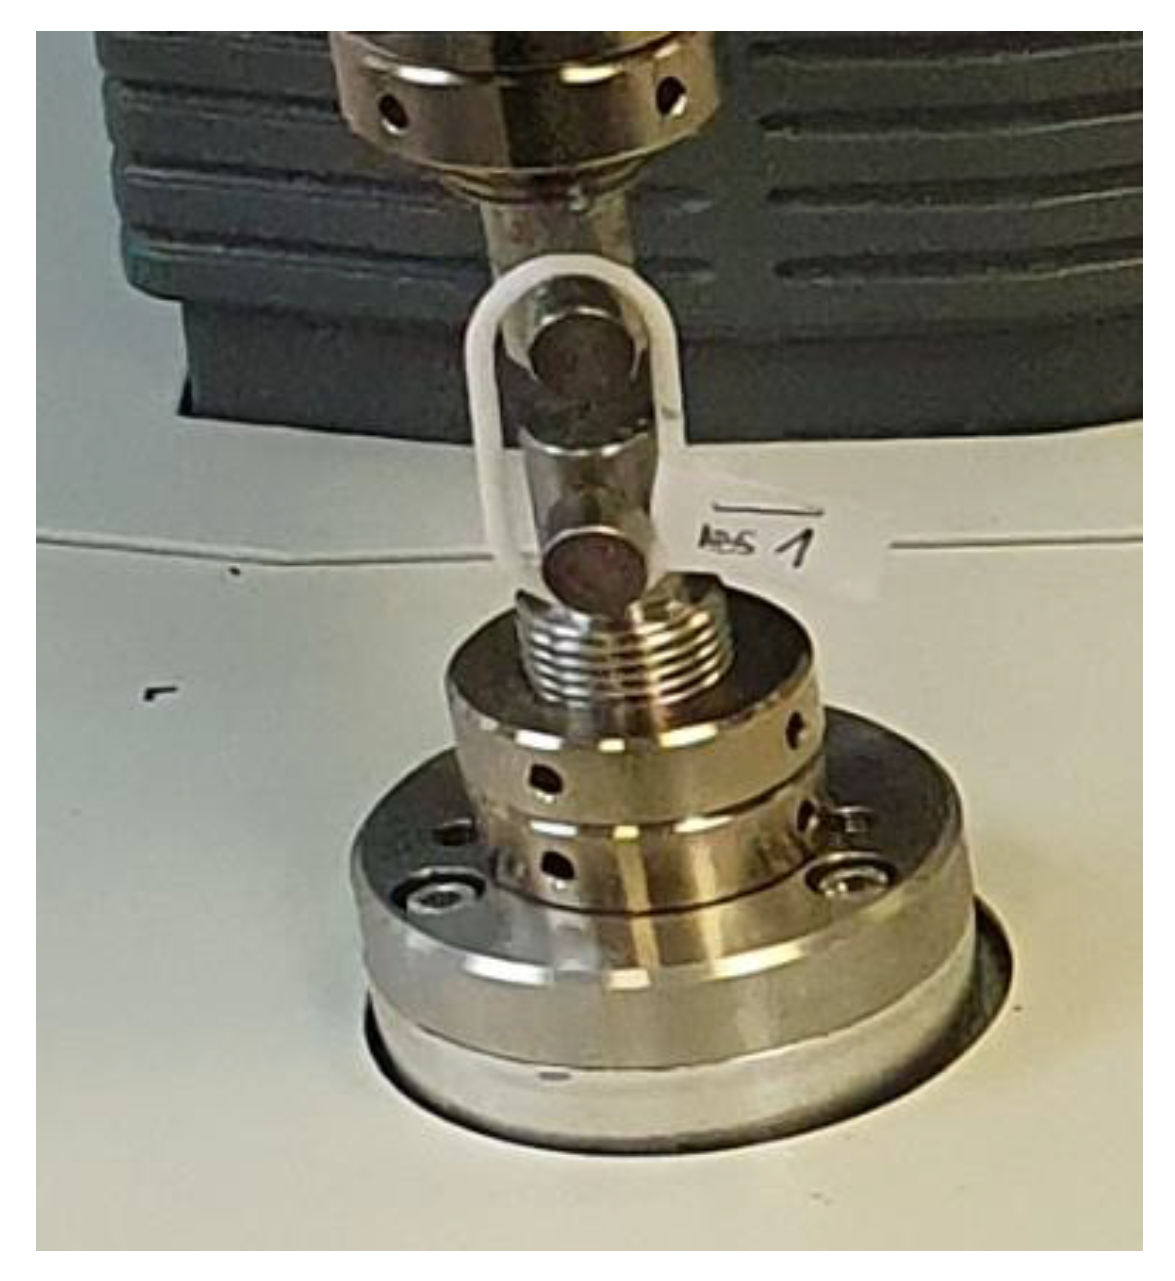
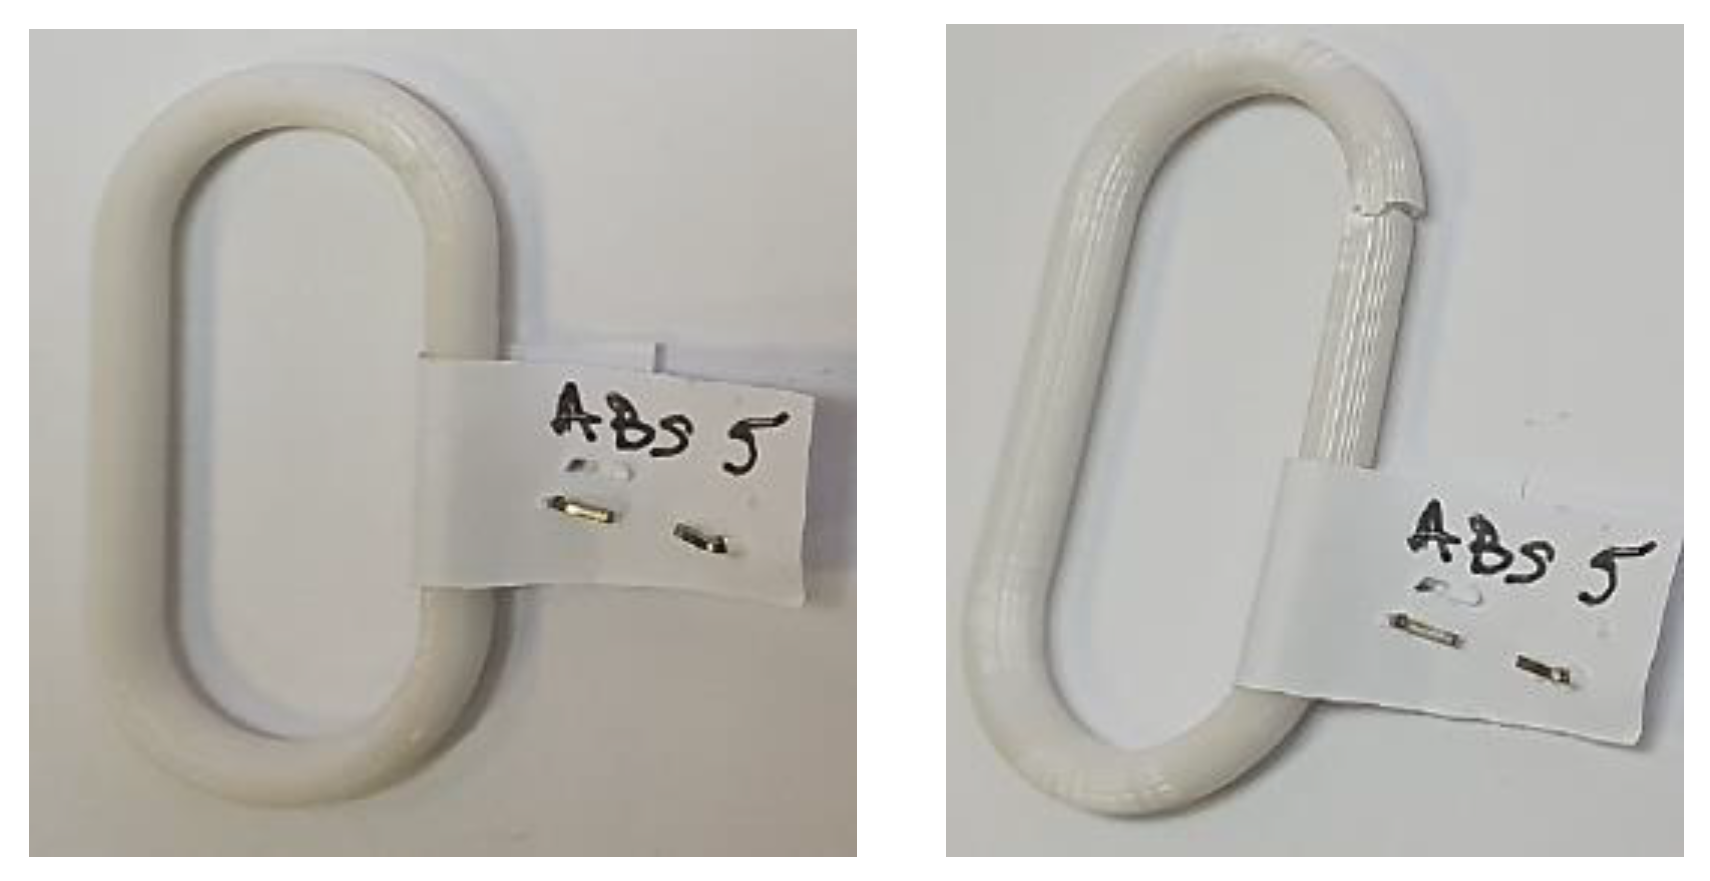
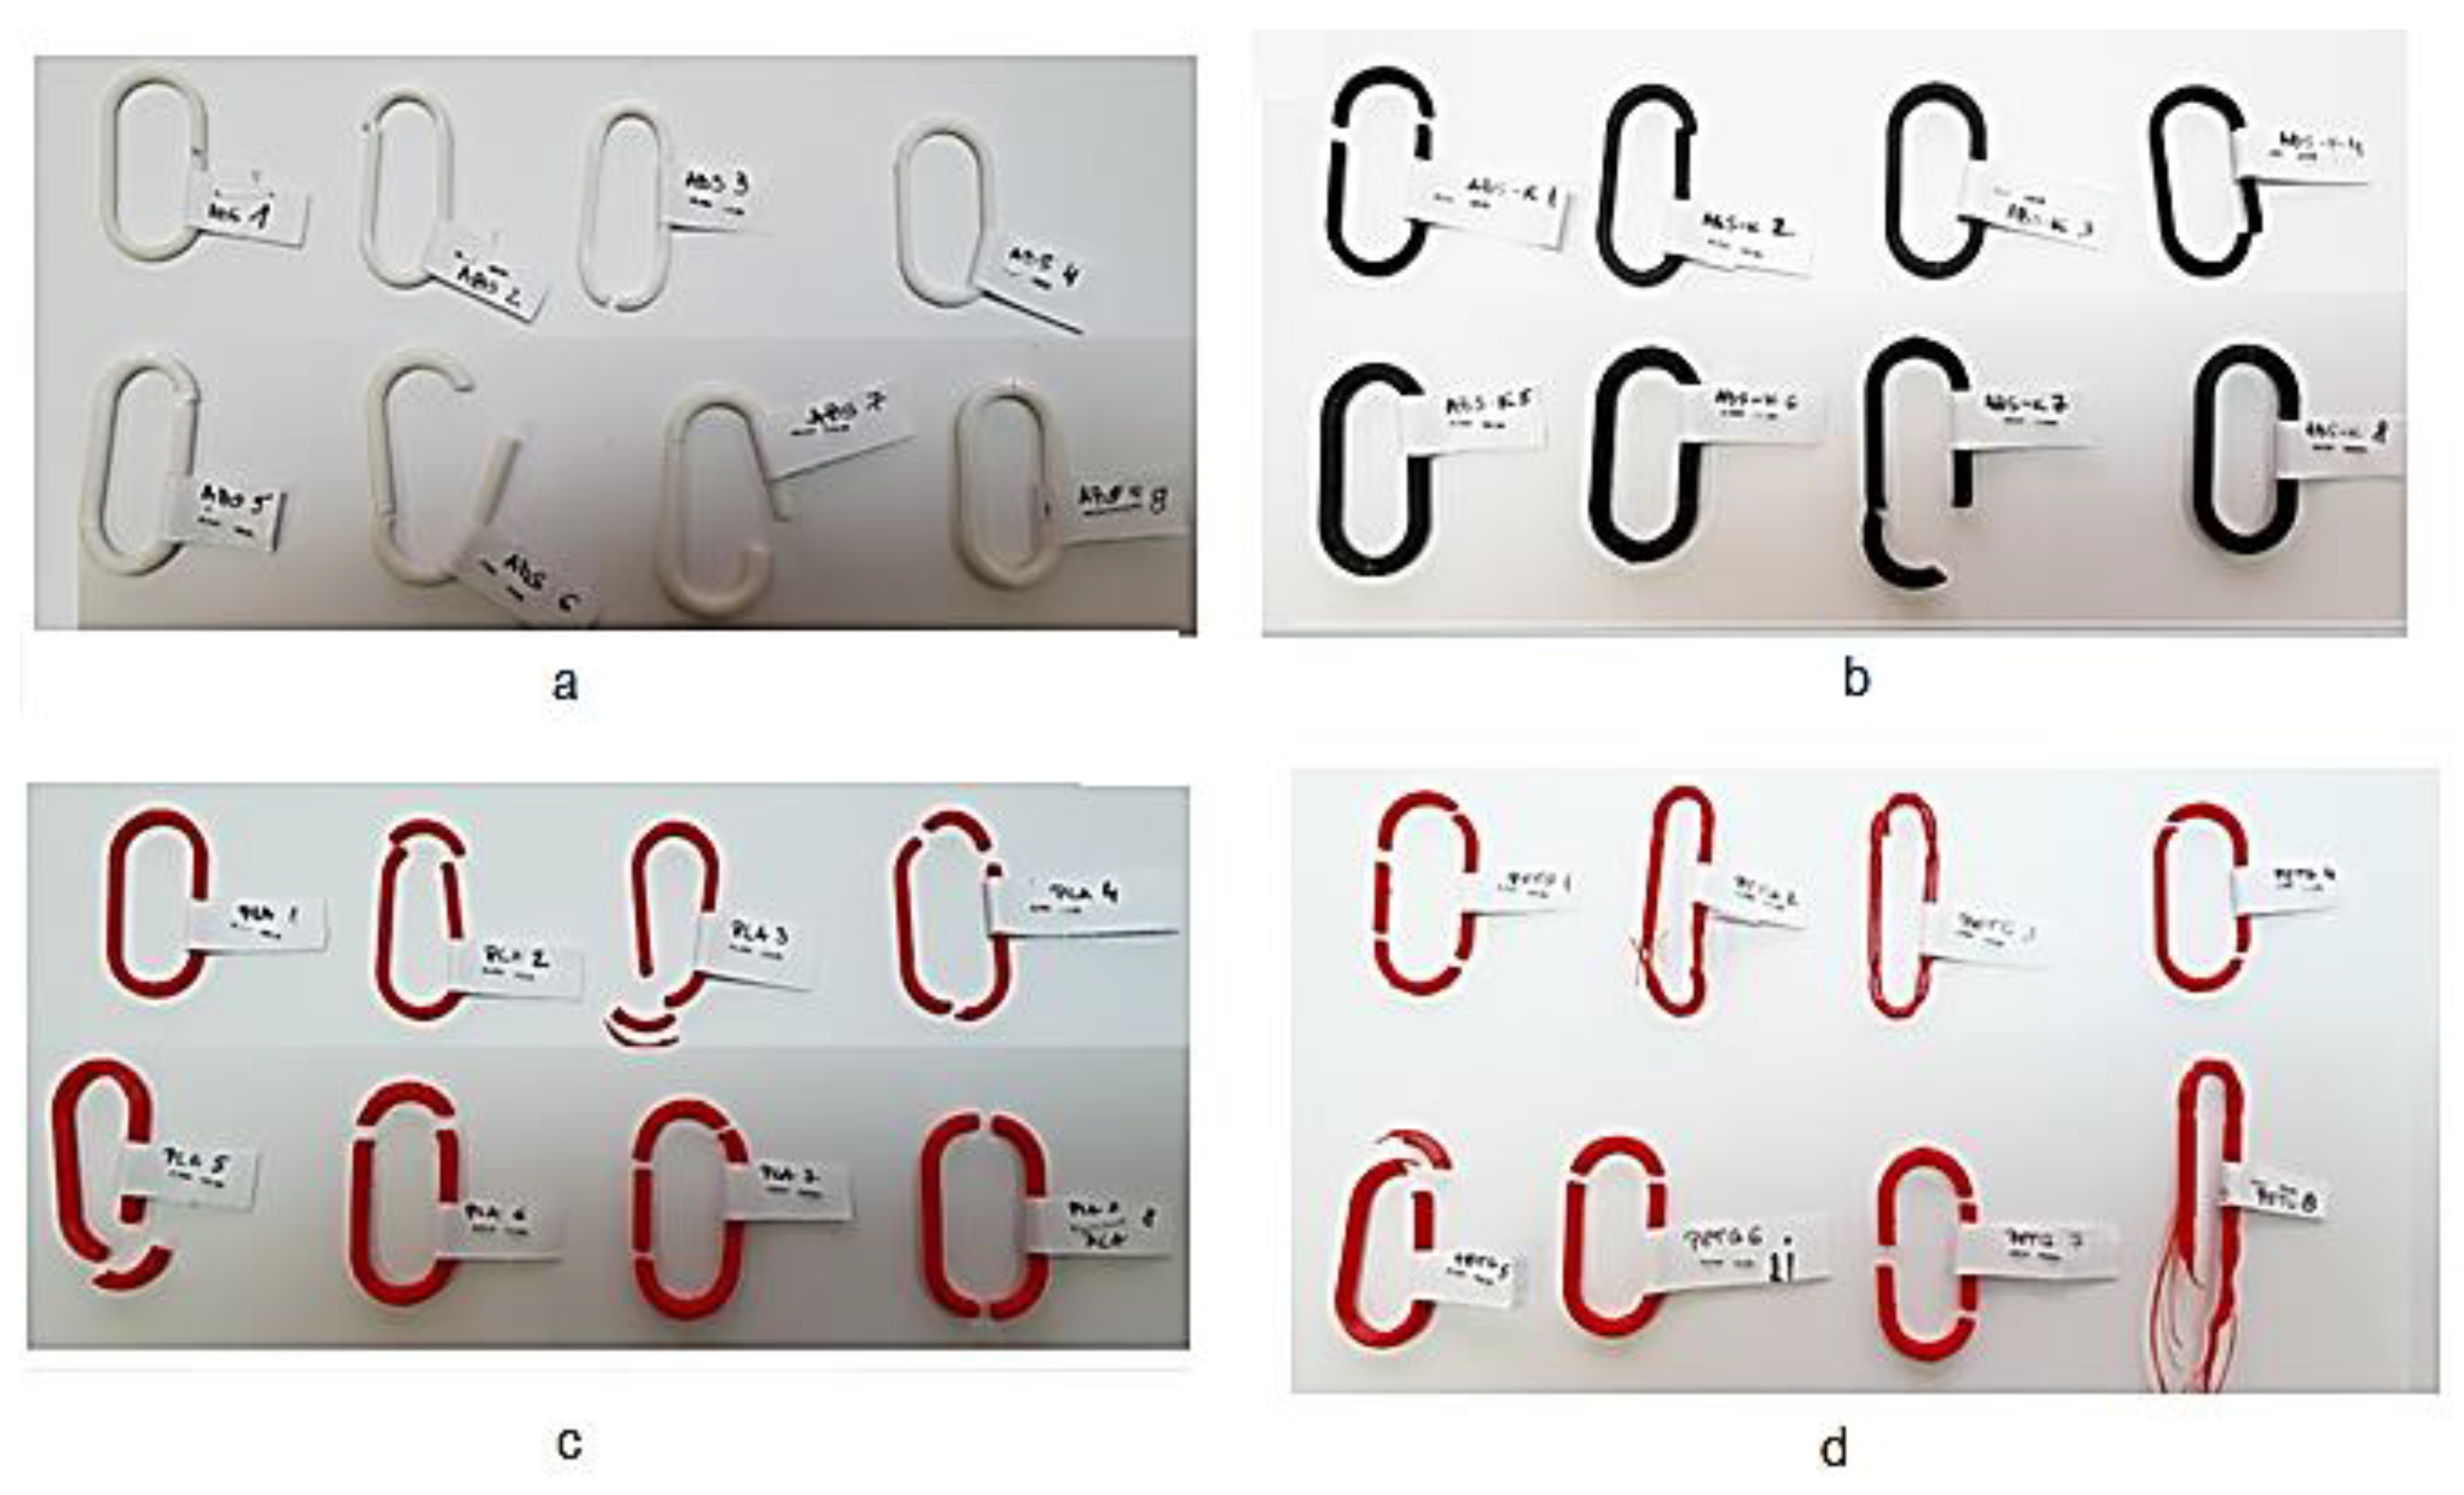
2.3. Experimental Conditions

| Part/ Exp no. | Values of the Input Factors | Values of the Output Parameter (Maximum Force F, N) | |||||||||
|---|---|---|---|---|---|---|---|---|---|---|---|
| Chain Link Diameter, d, mm | Printing Speed, v, mm/s | Layer Thickness, t, mm | Infill Density, i, % | Temperature Build Plate, θp, °C | Extrusion Temperature, θe, °C | Printing Position, p | ABS | ABS-K | PLA | PETG | |
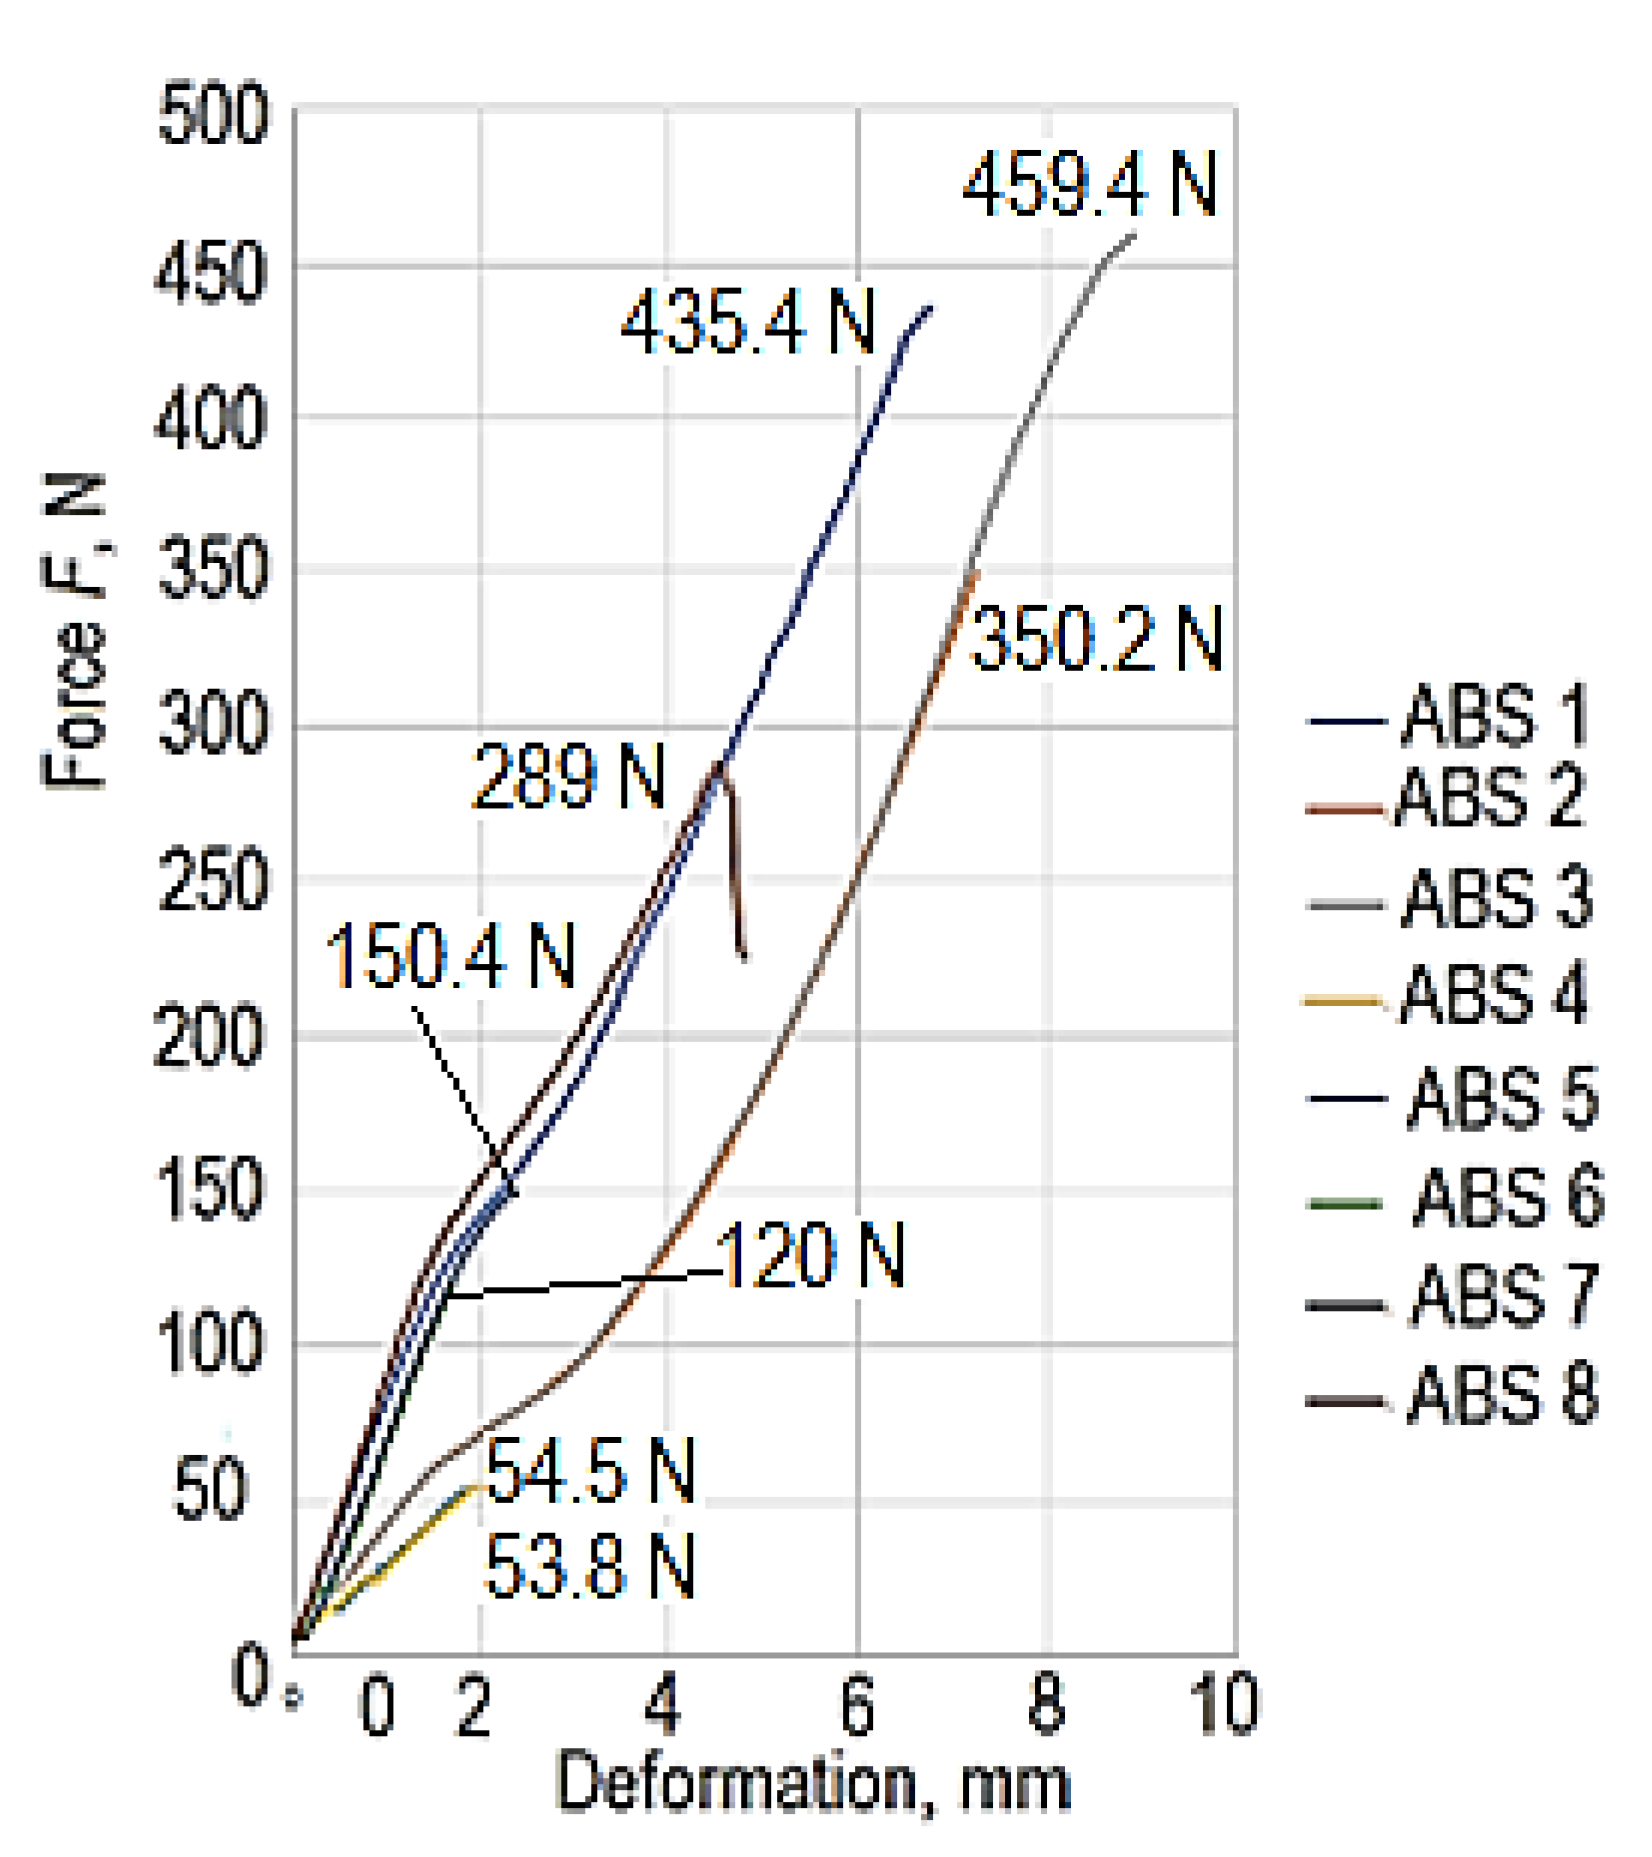
| 1 | 3 | 80 | 0.2 | 30 | 90 | 245 | 1 | 53.809 | 51.415 | 4.7005 | 40.96 |
| 2 | 3 | 80 | 0.2 | 60 | 110 | 265 | 2 | 350.23 | 216.41 | 235.7 | 414.93 |
| 3 | 3 | 120 | 0.3 | 30 | 90 | 265 | 2 | 459.45 | 94.09 | 252.02 | 414.3 |
| 4 | 3 | 120 | 0.3 | 60 | 110 | 245 | 1 | 54.519 | 47.876 | 302.2 | 16.923 |
| 5 | 4 | 80 | 0.3 | 30 | 110 | 245 | 2 | 435.48 | 208.47 | 403.73 | 273.56 |
| 6 | 4 | 80 | 0.3 | 60 | 90 | 265 | 1 | 120.03 | 124.44 | 121.78 | 80.394 |
| 7 | 4 | 120 | 0.2 | 30 | 110 | 265 | 1 | 150.47 | 113.51 | 141.96 | 103.43 |
| 8 | 4 | 120 | 0.2 | 60 | 90 | 245 | 2 | 289.04 | 233.66 | 257.23 | 612.66 |
3. Discussion
- For an ABS chain link, where the variables took the values d = 4 mm, v = 80 mm/s, t = 0.2 mm, i = 60%, θp = 90 °C, θe = 265°, p = 2 (printing in horizontal position), the maximum force F values were 460.84 N for the experimental test and 469 N when the empirical mathematical model was used. The difference between the two values is 1.9%.
- For a chain link made of ABS-K, where the variables took the values d = 4 mm, v = 80 mm/s, t = 0.2 mm, i = 30%, θp = 90 °C, θe = 245°, p = 2 (printing in horizontal position), the values of the maximum force F were 192.66 N for the experimental test and 284.21 N when the empirical mathematical model was used. The difference between the two values is 32.2%.
- For a chain link made of PETG, where the variables took the values d = 4 mm, v = 80 mm/s, t = 0.2 mm, i = 30%, θp = 90 °C, θe = 245°, p = 2 (printing in horizontal position), the maximum force F values were 564.53 N for the experimental test and 556.36 N when the empirical mathematical model was used. The difference between the two values is 1.46%.
4. Conclusions
Author Contributions
Funding
Institutional Review Board Statement
Data Availability Statement
Conflicts of Interest
References
- Fafenrot, S.; Grimmelsmann, N.; Wortmann, M.; Ehrmann, A. Three-dimensional (3D) printing of polymer-metal hybrid materials by fused deposition modeling. Materials 2017, 10, 1199. [Google Scholar] [CrossRef]
- Abdalla, A.; Patel, B.A. 3D Printed Electrochemical Sensors. Annu. Rev. Anal. Chem. 2021, 14, 47–63. [Google Scholar] [CrossRef]
- Kalva, R.S. 3D Printing—The future of manufacturing (the next industrial revolution). Int. J. Innov. Eng. Technol. 2015, 5, 185–190. [Google Scholar]
- Mareș, M. Additive manufacturing technologies. A concise introduction. Bul. Institutului Politeh. Din Iaşi. Secţia Construcţii De Maşini 2018, 64, 27–57. [Google Scholar]
- Wang, L.; Alexander, C.A. Additive manufacturing and big data. Int. J. Math. Eng. Manag. Sci. 2016, 1, 107–121. [Google Scholar] [CrossRef]
- Veness, R.; Andreazza, W.; Gudkov, D.; Miarnau Marin, A.; Samuelsson, S. Metal 3D Additive Machining for in-Vacuum Beam Instrumentation. In Proceedings of the 10th Mechanical Engineering Design of Synchrotron Radiation Equipment and Instrumentation Conference, Paris, France, 25–29 June 2018; pp. 121–124. [Google Scholar] [CrossRef]
- Wójcicki, M.; Wieczorek, A.N.; Głuszek, G. Concept of the facility for testing the wear of chain links in the aspect of synergism of environmental factors. Min. Mach. 2021, 39, 71–81. [Google Scholar] [CrossRef]
- Aliakbari, M. Additive Manufacturing: State-of-the-Art, Capabilities, and Sample Applications with Cost Analysis. Master’s Thesis, KTH Royal Institute of Technology, Stockholm, Sweden, 2012. Available online: https://www.diva-portal.org/smash/get/diva2:560827/FULLTEXT02.pdf (accessed on 15 May 2023).
- Mešić, A.; Čolić, M.; Mešić, E.; Pervan, N. Stress analysis of chain links in different operating conditions. Int. J. Eng. Sci. Invention 2016, 5, 43–49. [Google Scholar]
- Román-Manso, B.; Weeks, R.D.; Truby, R.L.; Lewis, J.A. Embedded 3D printing of architected ceramics via microwave-activated polymerization. Adv. Mater. 2023, 35, 2209270. [Google Scholar] [CrossRef]
- Woodman, C. 3D Printing for Animal Welfare. A Report for the Animal Welfare Institute; Texas A&M University: College Station, TX, USA, 2021; p. 17. Available online: https://awionline.org/sites/default/files/uploads/documents/3d-printing-animal-welfare.pdf (accessed on 15 May 2023).
- Noguchi, S.; Nagasaki, K.; Nakayama, S.; Kanda, T.; Nishino, T.; Ohtani, T. Static stress analysis of link plate of roller chain using finite element method and some design proposals for weight saving. J. Adv. Mech. Des. Syst. Manuf. 2009, 3, 159–170. [Google Scholar] [CrossRef]
- Das, N. Models to Explain out-of-Plane Bending Mechanism in Mooring Chain Links. Master’s Thesis, Delft University of Technology, Delft, The Nederlands, 2016. Available online: http://resolver.tudelft.nl/uuid:f387281a-1365-4121-a2cf-3f0b59448f67 (accessed on 15 May 2023).
- Berthelsen, K. Out of Plane Bending of Mooring Chains Finite Element. Analysis of a 7-link model. Master’s Thesis, Norwegian University of Science and Technology, Trondheim, Norway, 2017. Available online: https://ntnuopen.ntnu.no/ntnu-xmlui/handle/11250/2453087 (accessed on 15 May 2023).
- Kim, S.; Won, D.-H. Bending behavior of the mooring chain links subjected to high tensile forces. J. Korean Soc. Steel Const. 2017, 29, 99–110. [Google Scholar] [CrossRef][Green Version]
- Choung, J.; Lee, J.B.; Kim, Y.H. Out-of-plane bending stiffnesses in offshore mooring chain links based on conventional and advanced numerical simulation techniques. J. Ocean Eng. Technol. 2018, 32, 297–309. [Google Scholar] [CrossRef]
- Chung, W.; Kang, H.; Kim, M. Multi-scale approach for chain-mooring OPB-induced failure considering time-varying interlink bending stiffness and fairlead condition. Appl. Ocean Res. 2020, 98, 102128. [Google Scholar] [CrossRef]
- Chung, W.C.; Kim, M.H. Effects of various fairlead-connection parameters on chain-mooring OPB-induced failure. Mar. Struct. 2021, 76, 102926. [Google Scholar] [CrossRef]
- Chung, W.C.; Kang, H.Y.; Kim, M.H. Numerical study on OPB/IPB interlink angle with underwater chain stopper system. In Proceedings of the SNAME 24th Offshore Symposium, Houston, TX, USA, 20 February 2019. [Google Scholar]
- Perez, I.M.; Constantinescu, A.; Bastid, P.; Zhang, Y.H.; Venugopal, V. Computational fatigue assessment of mooring chains under tension loading. Eng. Fail. Anal. 2019, 106, 104043. [Google Scholar] [CrossRef]
- Zarandi, E.P. Multiaxial Fatigue Analysis of Offshore Mooring Chains, Considering the Effects of Residual Stresses and Corrosion Pits. Ph.D. Thesis, Norwegian University of Science and Technology, Trondheim, Norway, 2020. Available online: https://www.researchgate.net/publication/348200873_Multiaxial_fatigue_analysis_of_offshore_mooring_chains_considering_the_effects_of_residual_stresses_and_corrosion_pits (accessed on 15 May 2023).
- Zarandi, E.P.; Skallerud, B.H. Experimental and numerical study of mooring chain residual stresses and implications for fatigue life. Int. J. Fatigue 2020, 135, 105530. [Google Scholar] [CrossRef]
- Zarandi, E.P.; Lee, T.L.; Skallerud, B.H. Data on residual stresses of mooring chains measured by neutron diffraction and hole drilling techniques. Data Br. 2020, 30, 105587. [Google Scholar] [CrossRef]
- Xue, X.; Chen, N.-Z. Fracture mechanics analysis for a mooring system subjected to tension and out-of-plane bending. In Proceedings of the First Conference of Computational Methods in Offshore Technology (COTech2017), Stavanger, Norway, 30 November–1 December 2017; Volume 276, p. 012036. [Google Scholar] [CrossRef]
- Xue, X.; Chen, N.-Z.; Pu, Y.; Chen, L.; Wang, L. Fracture mechanics assessment for mooring chain links tensioned over a curved surface. Appl. Ocean Res. 2021, 117, 102900. [Google Scholar] [CrossRef]
- Takeuchi, T.; Utsunomiya, T.; Gotoh, K.; Sato, I. Development of interlink wear estimation method for mooring chain of floating structures: Validation and new approach using three-dimensional contact response. Mar. Struct. 2021, 77, 102927. [Google Scholar] [CrossRef]
- Vanaei, H.R.; Magri, A.E.; Rastak, M.A.; Vanaei, S.; Vaudreuil, S.; Tcharkhtchi, A. Numerical-experimental analysis toward the strain rate sensitivity of 3D-printed nylon reinforced by short carbon fiber. Materials 2022, 15, 8722. [Google Scholar] [CrossRef]
- Egli, E. Link Chain for Transmitting a Mechanical Load. U.K. Patent GB1191225A, 13 May 1970. Available online: https://patents.google.com/patent/GB1191225A/en?oq=GB1191225A (accessed on 15 May 2023).
- Dietrich, W.; Roelof, M.; Bergsma, O.; Gruber, J.M.; Mehdi, H.; Licup, A.J.; Van Keulen, A.; Van Rijssel, J.; Yalcin, A.O.; Van Eden, G.G.; et al. Polymeric Chain Link. Canada Patent CA2984062A1, 1 December 2016. Available online: https://patents.google.com/patent/CA2984062A1/en?oq=CA2984062A1 (accessed on 15 May 2023).
- Van Loon, M.A.Y. Chain Link Formed of Polymeric Material. European Patent EP0404224A1 (B1), 27 December 1990. Available online: https://patents.google.com/patent/EP0404224A1/en?oq=EP0404224A1 (accessed on 15 May 2023).
- Bastid, P.; Smith, S.D. Numerical analysis of contact stresses between mooring chain links and potential consequences for fatigue damage. Paper OMAE2013-11360. In Proceedings of the 32nd International Conference on Ocean, Offshore and Arctic Engineering, Nantes, France, 9–15 June 2013; Available online: https://www.twi-global.com/technical-knowledge/published-papers/numerical-analysis-of-contact-stresses-between-mooring-chain-links-and-potential-consequences-for-fatigue-damage (accessed on 15 May 2023).
- Hamanaka Group. Chain Manufacturing Process Outline Drawing. Available online: http://www.hamanaka-chain.co.jp/en/products/products3/ (accessed on 16 April 2023).
- Jha, N.K.; Avinash, G.; Siddharth, V. Design and structural analysis of plastic chain link with polypropylene and polyoxymethylene material. Mater. Today Proc. 2021, 38, 3066–3076. [Google Scholar] [CrossRef]
- Technical Data Sheet. Ultrafuse ABS. Available online: https://www.ultrafusefff.com/wp-content/uploads/2016/05/Ultrafuse_ABS_TDS_EN_v5.2.pdf (accessed on 5 June 2023).
- Pillet, M. Introduction Aux Plans D’expériences par la Méthode Taguchi; Les Éditions d’Organisation: Paris, France, 1992. [Google Scholar]
- Chauveau, J.-C.; Chassaing, J.-P. Introduction à la Methode des Plans D’expériences par la Méthode Taguchi. Available online: https://eduscol.education.fr/sti/sites/eduscol.education.fr.sti/files/ressources/techniques/3870/3870-introtaguchi-cned.pdfamanaka-chain.co.jp/en/products/products3/ (accessed on 27 May 2023).
- Torii, D.; Nagahara, T.; Okihara, T. Suppression of the Secondary Flow in a Suction Channel of a Large Centrifugal Pump. IOP Conf. Ser. Mater. Sci. Eng. 2013, 52, 032005. [Google Scholar]
- Donnelly, T. Efficient simulation using design of experiments (DOE). Available online: https://community.jmp.com (accessed on 27 May 2023).
- Lakshminarayanan, A.K.; Annamalai, V.E.; Elangovan, K. Identification of optimum friction stir spot welding process parameters controlling the properties of low carbon automotive steel joints. J. Mater. Res. Technol. 2015, 4, 262–272. [Google Scholar] [CrossRef]
- Tinsson, W. Plans d’expérience: Constructions et analyses statistiques. Mathématiques et Applications; Springer: Berlin/Heidelberg, Germany, 2010; Volume 67, Available online: https://link.springer.com/book/10.1007/978-3-642-11472-4 (accessed on 27 May 2023). (In French)
- Crețu, G.; Varvara, G. Methods of Experimental Research in Machine Manufacturing; Publishing House Junimea: Iași, România, 1999. (In Romanian) [Google Scholar]
- Worthing, A.G.; Geffner, J. Processing the Experimental Data; Technical Publishing House: Bucharest, Romania, 1959. (In Romanian) [Google Scholar]
- Agarwal, S.; Tyagi, I.; Gupta, V.K.; Jafari, M.; Edrissi, M.; Javadian, H. Taguchi L8 orthogonal array design method for the optimization of synthesis conditions of manganese phosphate (Mn3(PO4)2) nanoparticles using water-in-oil microemulsion method. J. Mol. Liq. 2016, 219, 1131–1136. [Google Scholar] [CrossRef]
- Krishnaiah, K.; Shahabudeen, P. Applied Design of Experiments and TAGUCHI Methods; Ghosh, A.K., Ed.; PHI Learning Pvt. Ltd.: New Delhi, India, 2012; Available online: https://eko.staff.uns.ac.id/files/2014/09/Buku-Alternatif.pdf (accessed on 27 May 2023).
- Mohamed, H.; Lee, M.H.; Sanugi, B.; Sarahintu, M. Taguchi approach for performance evaluation of routing protocols in mobile ad hoc networks. J. Stat. Modeling Anal. 2010, 1, 10–18. [Google Scholar]
- Limon-Romero, J.; Tlapa, D.; Baez-Lopez, Y.; Maldonado-Macias, A.; Rivera-Cadavid, L. Application of the Taguchi method to improve a medical device cutting process. Int. J. Adv. Manuf. Technol. 2016, 87, 3569–3577. [Google Scholar] [CrossRef]
- Vanaei, H.; Shirinbayan, M.; Deligant, M.; Raissi, K.; Fitoussi, J.; Khelladi, S.; Tcharkhtchi, A. Influence of process parameters on thermal andmechanical properties of polylactic acid fabricated by fused filament fabrication. Polym. Eng. Sci. 2020, 60, 1822–1831. [Google Scholar]
- Jackson, B.; Fouladi, K.; Eslami, B. Multi-parameter optimization of 3D printing condition for enhanced quality and strength. Polymers 2022, 14, 1586. [Google Scholar] [CrossRef]
- Meram, A.; Sözen, B. Investigation on the manufacturing variants influential on the strength of 3D printed products. Res. Eng. Struct. Mater. 2020, 6, 293–313. [Google Scholar] [CrossRef][Green Version]
- Cho, E.E.; Hein, H.H.; Lynn, Z.; Hla, S.; Saw, J.; Tran, T. Investigation on influence of infill pattern and layer thickness on mechanical strength of PLA material in 3D printing technology. J. Eng. Sci. Res. 2019, 3, 27–37. [Google Scholar] [CrossRef]
- Müller, M.; Jirků, P.; Šleger, V.; Mishra, R.K.; Hromasová, M.; Novotný, J. Effect of infill density in FDM 3D printing on low-cycle stress of bamboo-filled PLA-based material. Polymers 2022, 14, 4930. [Google Scholar] [CrossRef]


| Properties | ABS | ABS-Kevlar | PLA | PETG |
|---|---|---|---|---|
| Tensile modulus [GPa] | 1.6815 (ISO 527) | 1.775 (ISO 527) | 2.3 (ASTM D638—Type V) | 1.6 ± 0.1 (ISO 527-1—vertical XZ) |
| Tensile strength [GPa] | 0.0436 (ISO 527—at yield) | 0.0311 (ISO 527—at yield) | 0.0359 (ASTM D638—Type V—at yield) | 0.05 (ISO 527-1—vertical XZ) |
| Elongation | 3.5 % (ISO 527—at yield) | 2.3 % (ISO 527—tensile strength) | 2 % (ASTM D638—Type V—at yield) | 5.1 % (ISO 527-1—at yield) |
| Hardness | 97 (Shore A) | 65.2 (Shore D) | 95 (Shore D) | 74 (Shore D) |
Disclaimer/Publisher’s Note: The statements, opinions and data contained in all publications are solely those of the individual author(s) and contributor(s) and not of MDPI and/or the editor(s). MDPI and/or the editor(s) disclaim responsibility for any injury to people or property resulting from any ideas, methods, instructions or products referred to in the content. |
© 2023 by the authors. Licensee MDPI, Basel, Switzerland. This article is an open access article distributed under the terms and conditions of the Creative Commons Attribution (CC BY) license (https://creativecommons.org/licenses/by/4.0/).
Share and Cite
Rădulescu, B.; Mihalache, A.M.; Păduraru, E.; Hriţuc, A.; Rădulescu, M.C.; Slătineanu, L.; Ermolai, V. Tensile Behavior of Chain Links Made of Polymeric Materials Manufactured by 3D Printing. Polymers 2023, 15, 3178. https://doi.org/10.3390/polym15153178
Rădulescu B, Mihalache AM, Păduraru E, Hriţuc A, Rădulescu MC, Slătineanu L, Ermolai V. Tensile Behavior of Chain Links Made of Polymeric Materials Manufactured by 3D Printing. Polymers. 2023; 15(15):3178. https://doi.org/10.3390/polym15153178
Chicago/Turabian StyleRădulescu, Bruno, Andrei Marius Mihalache, Emilian Păduraru, Adelina Hriţuc, Mara Cristina Rădulescu, Laurenţiu Slătineanu, and Vasile Ermolai. 2023. "Tensile Behavior of Chain Links Made of Polymeric Materials Manufactured by 3D Printing" Polymers 15, no. 15: 3178. https://doi.org/10.3390/polym15153178
APA StyleRădulescu, B., Mihalache, A. M., Păduraru, E., Hriţuc, A., Rădulescu, M. C., Slătineanu, L., & Ermolai, V. (2023). Tensile Behavior of Chain Links Made of Polymeric Materials Manufactured by 3D Printing. Polymers, 15(15), 3178. https://doi.org/10.3390/polym15153178