

Effect of Different Standard Geometry Shapes on the Tensile Properties of 3D-Printed Polymer


 ,
, 
Abstract
1. Introduction
2. Materials and Methods
2.1. Manufacturing of 3D-Printed Specimens
2.2. Experimental
2.3. Modeling of Tensile Tests by Using Finite Element Method
2.3.1. Modeling
2.3.2. Meshing and Boundary Conditions
3. Results and Discussion
3.1. Experimental Results
3.2. Numerical Results
4. Conclusions
- Preferred specimen geometries: Existing standards recommend dumbbell and rectangular shapes for tensile testing of FDM parts. However, our analysis suggests that rectangular samples with straight edges, such as those conforming to ASTM D3039, exhibit more favorable mechanical characteristics compared to dumbbell-shaped samples with curved edges (ASTM D638). Experimental data indicate that the use of ASTM D3039 rectangular specimens with straight edges reduces the occurrence of stress concentration-induced failures and abrupt transition zones. It is important to note that conflicting results for different geometry shapes may arise due to factors such as feedstock material type, printer configuration, printing parameters, and test procedures.
- Effect of print orientation: The on-edge build orientation specimens demonstrated the best tensile properties, surpassing the flat orientation specimens by 39.4%. This improvement can be attributed to the robust inner structure achieved with the on-edge orientation.
- Numerical analysis of stress concentration: The finite element simulations revealed significant stress concentration in the transition area near the gripping location for specimen types ASTM D638 and ASTM D3039. In contrast, the ISO 527-2 specimens exhibited minimal stress raisers near the gripping area, with higher stresses concentrated in the narrow/gauge section away from the clamping location.
Author Contributions
Funding
Institutional Review Board Statement
Data Availability Statement
Acknowledgments
Conflicts of Interest
References
- Rahmatabadi, D.; Soltanmohammadi, K.; Aberoumand, M.; Soleyman, E.; Ghasemi, I.; Baniassadi, M.; Abrinia, K.; Bodaghi, M.; Baghani, M. Development of Pure Poly Vinyl Chloride (PVC) with Excellent 3D Printability and Macro- and Micro-Structural Properties. Macromol. Mater. Eng. 2023, 308, 2200568. [Google Scholar] [CrossRef]
- Wohlers, T.; Gornet, T. History of Additive Manufacturing. Wohlers Report. In History of Additive Manufacturing; Wohlers Associates, Inc.: Fort Collins, CO, USA, 2014. [Google Scholar]
- Zukas, V.; Zukas, J.A. An Introduction to 3D Printing; First Edition Design Publishing, Inc.: Sarasota, FL, USA, 2015. [Google Scholar]
- Auhl, D.; Rohnstock, F.; Löschke, O.; Schäfer, K.; Wang, P.; Wagner, M.H. 3D-Printing Quality in Relation to Melt Flow and Fusion Behavior of Polymer Materials. AIP Conf. Proc. 2019, 2107, 030004. [Google Scholar]
- Thompson, M.K.; Moroni, G.; Vaneker, T.; Fadel, G.; Campbell, R.I.; Gibson, I.; Bernard, A.; Schulz, J.; Graf, P.; Ahuja, B.; et al. Design for Additive Manufacturing: Trends, Opportunities, Considerations, and Constraints. CIRP Ann. 2016, 65, 737–760. [Google Scholar] [CrossRef]
- Hanon, M.M.; Ghaly, A.; Zsidai, L.; Szakál, Z.; Szabó, I.; Kátai, L. Investigations of the Mechanical Properties of DLP 3D Printed Graphene/Resin Composites. Acta Polytech. Hung. 2021, 18, 143–161. [Google Scholar] [CrossRef]
- Hanon, M.M.; Ghaly, A.; Zsidai, L.; Klébert, S. Tribological Characteristics of Digital Light Processing (DLP) 3D Printed Graphene/Resin Composite: Influence of Graphene Presence and Process Settings. Mater. Des. 2022, 218, 110718. [Google Scholar] [CrossRef]
- Hanon, M.M.; Zsidai, L. Sliding Surface Structure Comparison of 3D Printed Polymers Using FDM and DLP Technologies. IOP Conf. Ser. Mater. Sci. Eng. 2020, 749, 012015. [Google Scholar] [CrossRef]
- Fernandez-Vicente, M.; Calle, W.; Ferrandiz, S.; Conejero, A. Effect of Infill Parameters on Tensile Mechanical Behavior in Desktop 3D Printing. 3D Print. Addit. Manuf. 2016, 3, 183–192. [Google Scholar] [CrossRef]
- Ayrilmis, N.; Kariz, M.; Šernek, M.; Kuzman, M.K. Effects of Sandwich Core Structure and Infill Rate on Mechanical Properties of 3D-Printed Wood/PLA Composites. Int. J. Adv. Manuf. Technol. 2021, 115, 3233–3242. [Google Scholar] [CrossRef]
- Akhoundi, B.; Behravesh, A.H. Effect of Filling Pattern on the Tensile and Flexural Mechanical Properties of FDM 3D Printed Products. Exp. Mech. 2019, 59, 883–897. [Google Scholar] [CrossRef]
- Rybachuk, M.; Alice Mauger, C.; Fiedler, T.; Öchsner, A. Anisotropic Mechanical Properties of Fused Deposition Modeled Parts Fabricated by Using Acrylonitrile Butadiene Styrene Polymer. J. Polym. Eng. 2017, 37, 699–706. [Google Scholar] [CrossRef]
- Guessasma, S.; Belhabib, S.; Nouri, H. Understanding the Microstructural Role of Bio-Sourced 3D Printed Structures on the Tensile Performance. Polym. Test. 2019, 77, 105924. [Google Scholar] [CrossRef]
- Lanzotti, A.; Grasso, M.; Staiano, G.; Martorelli, M. The Impact of Process Parameters on Mechanical Properties of Parts Fabricated in PLA with an Open-Source 3-D Printer. Rapid Prototyp. J. 2015, 21, 604–617. [Google Scholar] [CrossRef]
- Dupaix, R.B.; Boyce, M.C. Finite Strain Behavior of Poly(Ethylene Terephthalate) (PET) and Poly(Ethylene Terephthalate)-Glycol (PETG). Polymer 2005, 46, 4827–4838. [Google Scholar] [CrossRef]
- Guo, J.; Xiao, R.; Tian, C.; Jiang, M. Optimizing Physical Aging in Poly(Ethylene Terephthalate)-Glycol (PETG). J. Non-Cryst. Solids 2018, 502, 15–21. [Google Scholar] [CrossRef]
- Soleyman, E.; Rahmatabadi, D.; Soltanmohammadi, K.; Aberoumand, M.; Ghasemi, I.; Abrinia, K.; Baniassadi, M.; Wang, K.; Baghani, M. Shape Memory Performance of PETG 4D Printed Parts under Compression in Cold, Warm, and Hot Programming. Smart Mater. Struct. 2022, 31, 085002. [Google Scholar] [CrossRef]
- Soleyman, E.; Aberoumand, M.; Soltanmohammadi, K.; Rahmatabadi, D.; Ghasemi, I.; Baniassadi, M.; Abrinia, K.; Baghani, M. 4D Printing of PET-G via FDM Including Tailormade Excess Third Shape. Manuf. Lett. 2022, 33, 1–4. [Google Scholar] [CrossRef]
- Onwubolu, G.C.; Rayegani, F. Characterization and Optimization of Mechanical Properties of ABS Parts Manufactured by the Fused Deposition Modelling Process. Int. J. Manuf. Eng. 2014, 2014, 598531. [Google Scholar] [CrossRef]
- Cojocaru, V.; Frunzaverde, D.; Miclosina, C.-O.; Marginean, G. The Influence of the Process Parameters on the Mechanical Properties of PLA Specimens Produced by Fused Filament Fabrication—A Review. Polymers 2022, 14, 886. [Google Scholar] [CrossRef]
- Pereira, T.; Potgieter, J.; Kennedy, J.V. A Fundamental Study of 3D Printing Testing Methods for the Development of New Quality Management Strategies. In Proceedings of the 2017 24th International Conference on Mechatronics and Machine Vision in Practice (M2VIP), Auckland, New Zealand, 21–23 November 2017; IEEE: New York, NY, USA, 2017; pp. 1–6. [Google Scholar]
- Torrado, A.R.; Roberson, D.A. Failure Analysis and Anisotropy Evaluation of 3D-Printed Tensile Test Specimens of Different Geometries and Print Raster Patterns. J. Fail. Anal. Prev. 2016, 16, 154–164. [Google Scholar] [CrossRef]
- Shojib Hossain, M.; Espalin, D.; Ramos, J.; Perez, M.; Wicker, R. Improved Mechanical Properties of Fused Deposition Modeling-Manufactured Parts through Build Parameter Modifications. J. Manuf. Sci. Eng. 2014, 136, 061002. [Google Scholar] [CrossRef]
- Tymrak, B.M.; Kreiger, M.; Pearce, J.M. Mechanical Properties of Components Fabricated with Open-Source 3D Printers under Realistic Environmental Conditions. Mater. Des. 2014, 58, 242–246. [Google Scholar] [CrossRef]
- Lubombo, C.; Huneault, M.A. Effect of Infill Patterns on the Mechanical Performance of Lightweight 3D-Printed Cellular PLA Parts. Mater. Today Commun. 2018, 17, 214–228. [Google Scholar] [CrossRef]
- Kiendl, J.; Gao, C. Controlling Toughness and Strength of FDM 3D-Printed PLA Components through the Raster Layup. Compos. B Eng. 2020, 180, 107562. [Google Scholar] [CrossRef]
- Gao, C.; Kiendl, J. Short Review on Architectured Materials with Topological Interlocking Mechanisms. Mater. Des. Process. Commun. 2019, 1, e31. [Google Scholar] [CrossRef]
- Chacón, J.M.; Caminero, M.A.; García-Plaza, E.; Núñez, P.J. Additive Manufacturing of PLA Structures Using Fused Deposition Modelling: Effect of Process Parameters on Mechanical Properties and Their Optimal Selection. Mater. Des. 2017, 124, 143–157. [Google Scholar] [CrossRef]
- Torrado Perez, A.R.; Roberson, D.A.; Wicker, R.B. Fracture Surface Analysis of 3D-Printed Tensile Specimens of Novel ABS-Based Materials. J. Fail. Anal. Prev. 2014, 14, 343–353. [Google Scholar] [CrossRef]
- ISO ISO/TC 261; Additive Manufacturing. ISO: Berlin, Germany, 2011. Available online: https://committee.iso.org/home/tc261 (accessed on 6 July 2023).
- ASTM D3039/D3039M-08; Standard Test Method for Tensile Properties of Polymer Matrix Composite Materials. ASTM International: Singapore, 2008.
- ISO E. 527-1; Plastics—Determination of Tensile Properties—Part 1: General Principles. International Organization of Standardization: Geneva, Switzerland, 2012.
- ISO E.N. 527-4; Plastics—Determination of Tensile Properties—Part 4: Test Conditions for Isotropic and Orthotropic Fibre-Reinforced Plastic Composites. International Organization for Standardization (ISO): Geneva, Switzerland, 1997.
- ISO B. 527-5; Plastics—Determination of Tensile Properties—Part 5: Test Conditions for Unidirectional Fibre-Reinforced Plastic Composites. European Committee for Standardisation: Brussels, Belgium, 2009.
- Moura, L.S.; Vittoria, G.D.; Gabriel, A.H.G.; Fonseca, E.B.; Gabriel, L.P.; Webster, T.J.; Lopes, É.S.N. A Highly Accurate Methodology for the Prediction and Correlation of Mechanical Properties Based on the Slimness Ratio of Additively Manufactured Tensile Test Specimens. J. Mater. Sci. 2020, 55, 9578–9596. [Google Scholar] [CrossRef]
- ASTM D. 638-14; Standard Test Method for Tensile Properties of Plastics. American Society for Testing and Materials: West Conshohocken, PA, USA, 2014.
- Auffray, L.; Gouge, P.-A.; Hattali, L. Design of Experiment Analysis on Tensile Properties of PLA Samples Produced by Fused Filament Fabrication. Int. J. Adv. Manuf. Technol. 2022, 118, 4123–4137. [Google Scholar] [CrossRef]
- Shanmugam, V.; Rajendran, D.J.J.; Babu, K.; Rajendran, S.; Veerasimman, A.; Marimuthu, U.; Singh, S.; Das, O.; Neisiany, R.E.; Hedenqvist, M.S.; et al. The Mechanical Testing and Performance Analysis of Polymer-Fibre Composites Prepared through the Additive Manufacturing. Polym. Test. 2021, 93, 106925. [Google Scholar] [CrossRef]
- Özen, A.; Auhl, D.; Völlmecke, C.; Kiendl, J.; Abali, B.E. Optimization of Manufacturing Parameters and Tensile Specimen Geometry for Fused Deposition Modeling (FDM) 3D-Printed PETG. Materials 2021, 14, 2556. [Google Scholar] [CrossRef]
- Álvarez, K.; Lagos, R.F.; Aizpun, M. Investigating the Influence of Infill Percentage on the Mechanical Properties of Fused Deposition Modelled ABS Parts. Ing. Investig. 2016, 36, 110. [Google Scholar] [CrossRef]
- Chandran, V.; Kalman, J.; Fayazbakhsh, K.; Bougherara, H. A Comparative Study of the Tensile Properties of Compression Molded and 3D Printed PLA Specimens in Dry and Water Saturated Conditions. J. Mech. Sci. Technol. 2021, 35, 1977–1985. [Google Scholar] [CrossRef]
- Miller, A.; Brown, C.; Warner, G. Guidance on the Use of Existing ASTM Polymer Testing Standards for ABS Parts Fabricated Using FFF. Smart Sustain. Manuf. Syst. 2019, 3, 20190051. [Google Scholar] [CrossRef]
- Ahn, S.; Montero, M.; Odell, D.; Roundy, S.; Wright, P.K. Anisotropic Material Properties of Fused Deposition Modeling ABS. Rapid Prototyp. J. 2002, 8, 248–257. [Google Scholar] [CrossRef]
- Montero, M.; Roundy, S.; Odell, D.; Ahn, S.-H.; Wright, P.K. Material Characterization of Fused Deposition Modeling (FDM) ABS by Designed Experiments. Soc. Manuf. Eng. 2001, 10, 18464193. [Google Scholar]
- Rankouhi, B.; Javadpour, S.; Delfanian, F.; Letcher, T. Failure Analysis and Mechanical Characterization of 3D Printed ABS with Respect to Layer Thickness and Orientation. J. Fail. Anal. Prev. 2016, 16, 467–481. [Google Scholar] [CrossRef]
- Milosevic, M.; Stoof, D.; Pickering, K. Characterizing the Mechanical Properties of Fused Deposition Modelling Natural Fiber Recycled Polypropylene Composites. J. Compos. Sci. 2017, 1, 7. [Google Scholar] [CrossRef]
- Croccolo, D.; De Agostinis, M.; Olmi, G. Experimental Characterization and Analytical Modelling of the Mechanical Behaviour of Fused Deposition Processed Parts Made of ABS-M30. Comput. Mater. Sci. 2013, 79, 506–518. [Google Scholar] [CrossRef]
- Somireddy, M.; Czekanski, A. Mechanical Characterization of Additively Manufactured Parts by FE Modeling of Mesostructure. J. Manuf. Mater. Process. 2017, 1, 18. [Google Scholar] [CrossRef]
- ASTM D3039/D3039M-07; Standard Test Method for Tensile Properties of Polymer Matrix Composite Materials. ASTM International: Singapore, 2007.
- Czél, G.; Jalalvand, M.; Wisnom, M.R. Hybrid Specimens Eliminating Stress Concentrations in Tensile and Compressive Testing of Unidirectional Composites. Compos. Part A Appl. Sci. Manuf. 2016, 91, 436–447. [Google Scholar] [CrossRef]
- Zienkiewicz, O.C.; Taylor, R.L. The Finite Element Method for Solid and Structural Mechanics; Elsevier: Amsterdam, The Netherlands, 2005. [Google Scholar]
- Ryan Kay Effect of Raster Orientation on the Structural Properties of Components Fabricated by Fused Deposition Modeling. Ph.D. Thesis, The Ohio State University, Columbus, OH, USA, 2014.
- Aliheidari, N.; Tripuraneni, R.; Ameli, A.; Nadimpalli, S. Fracture Resistance Measurement of Fused Deposition Modeling 3D Printed Polymers. Polym. Test. 2017, 60, 94–101. [Google Scholar] [CrossRef]


| Tensile Standard Name | Standard Designation | Description |
|---|---|---|
| ISO 527-2-2012 [32] | Determination of tensile properties for plastic. Part 2: Test conditions for extrusion and molding plastics. | Similar to ASTM D638, it is split into five sections, taking into account the various sample types, such as film, isotropic fiber composites, and unidirectional composites. |
| ISO 527-4:1997 [33] | Determination of tensile properties for fiber-reinforced plastic composite. Part 4: Test conditions for isotropic and orthotropic. | Specific to fiber-reinforced composites. The use of this part may be necessary for specific reinforcements or manufacturing procedures. |
| ASTM D638 [36] | Standard test method for tensile properties of plastics. | Basic test method to produce tensile properties of plastics. There are several types of dog-bone geometry. Need for high-strength reinforcing. |
| ASTM D3039 [31] | Standard test method for tensile properties of polymer matrix composite. | The basic test procedure for high modulus fiber composites’ tensile characteristics. Requires a specimen with a rectangular form. Although additive materials do not match reinforcing standards, flaws are reduced by rectangular form. |
| Parameter | Value | Unit |
|---|---|---|
| Layer thickness | 0.2 | mm |
| Initial layer height | 0.24 | mm |
| Print speed | 60 | mm/s |
| Infill speed | 30 | mm/s |
| Wall speed | 25 | mm/s |
| Printing temperature | 230 | °C |
| Building plate temperature | 70 | °C |
| Infill density | 100 | % |
| Properties | Value | Unite of Measure | Standard |
|---|---|---|---|
| Density | 1.3 | g/cm3 | ISO 1183 |
| Tensile strength | 42 | MPa | ISO 527 |
| Tensile modulus | 5250 | MPa | ISO 527 |
| Elongation at break | 7.4 | % | ISO 527 |
| Flexural strength | 70 | MPa | ISO 178 |
| Heat resistance | 75 | °C | ISO 75 |
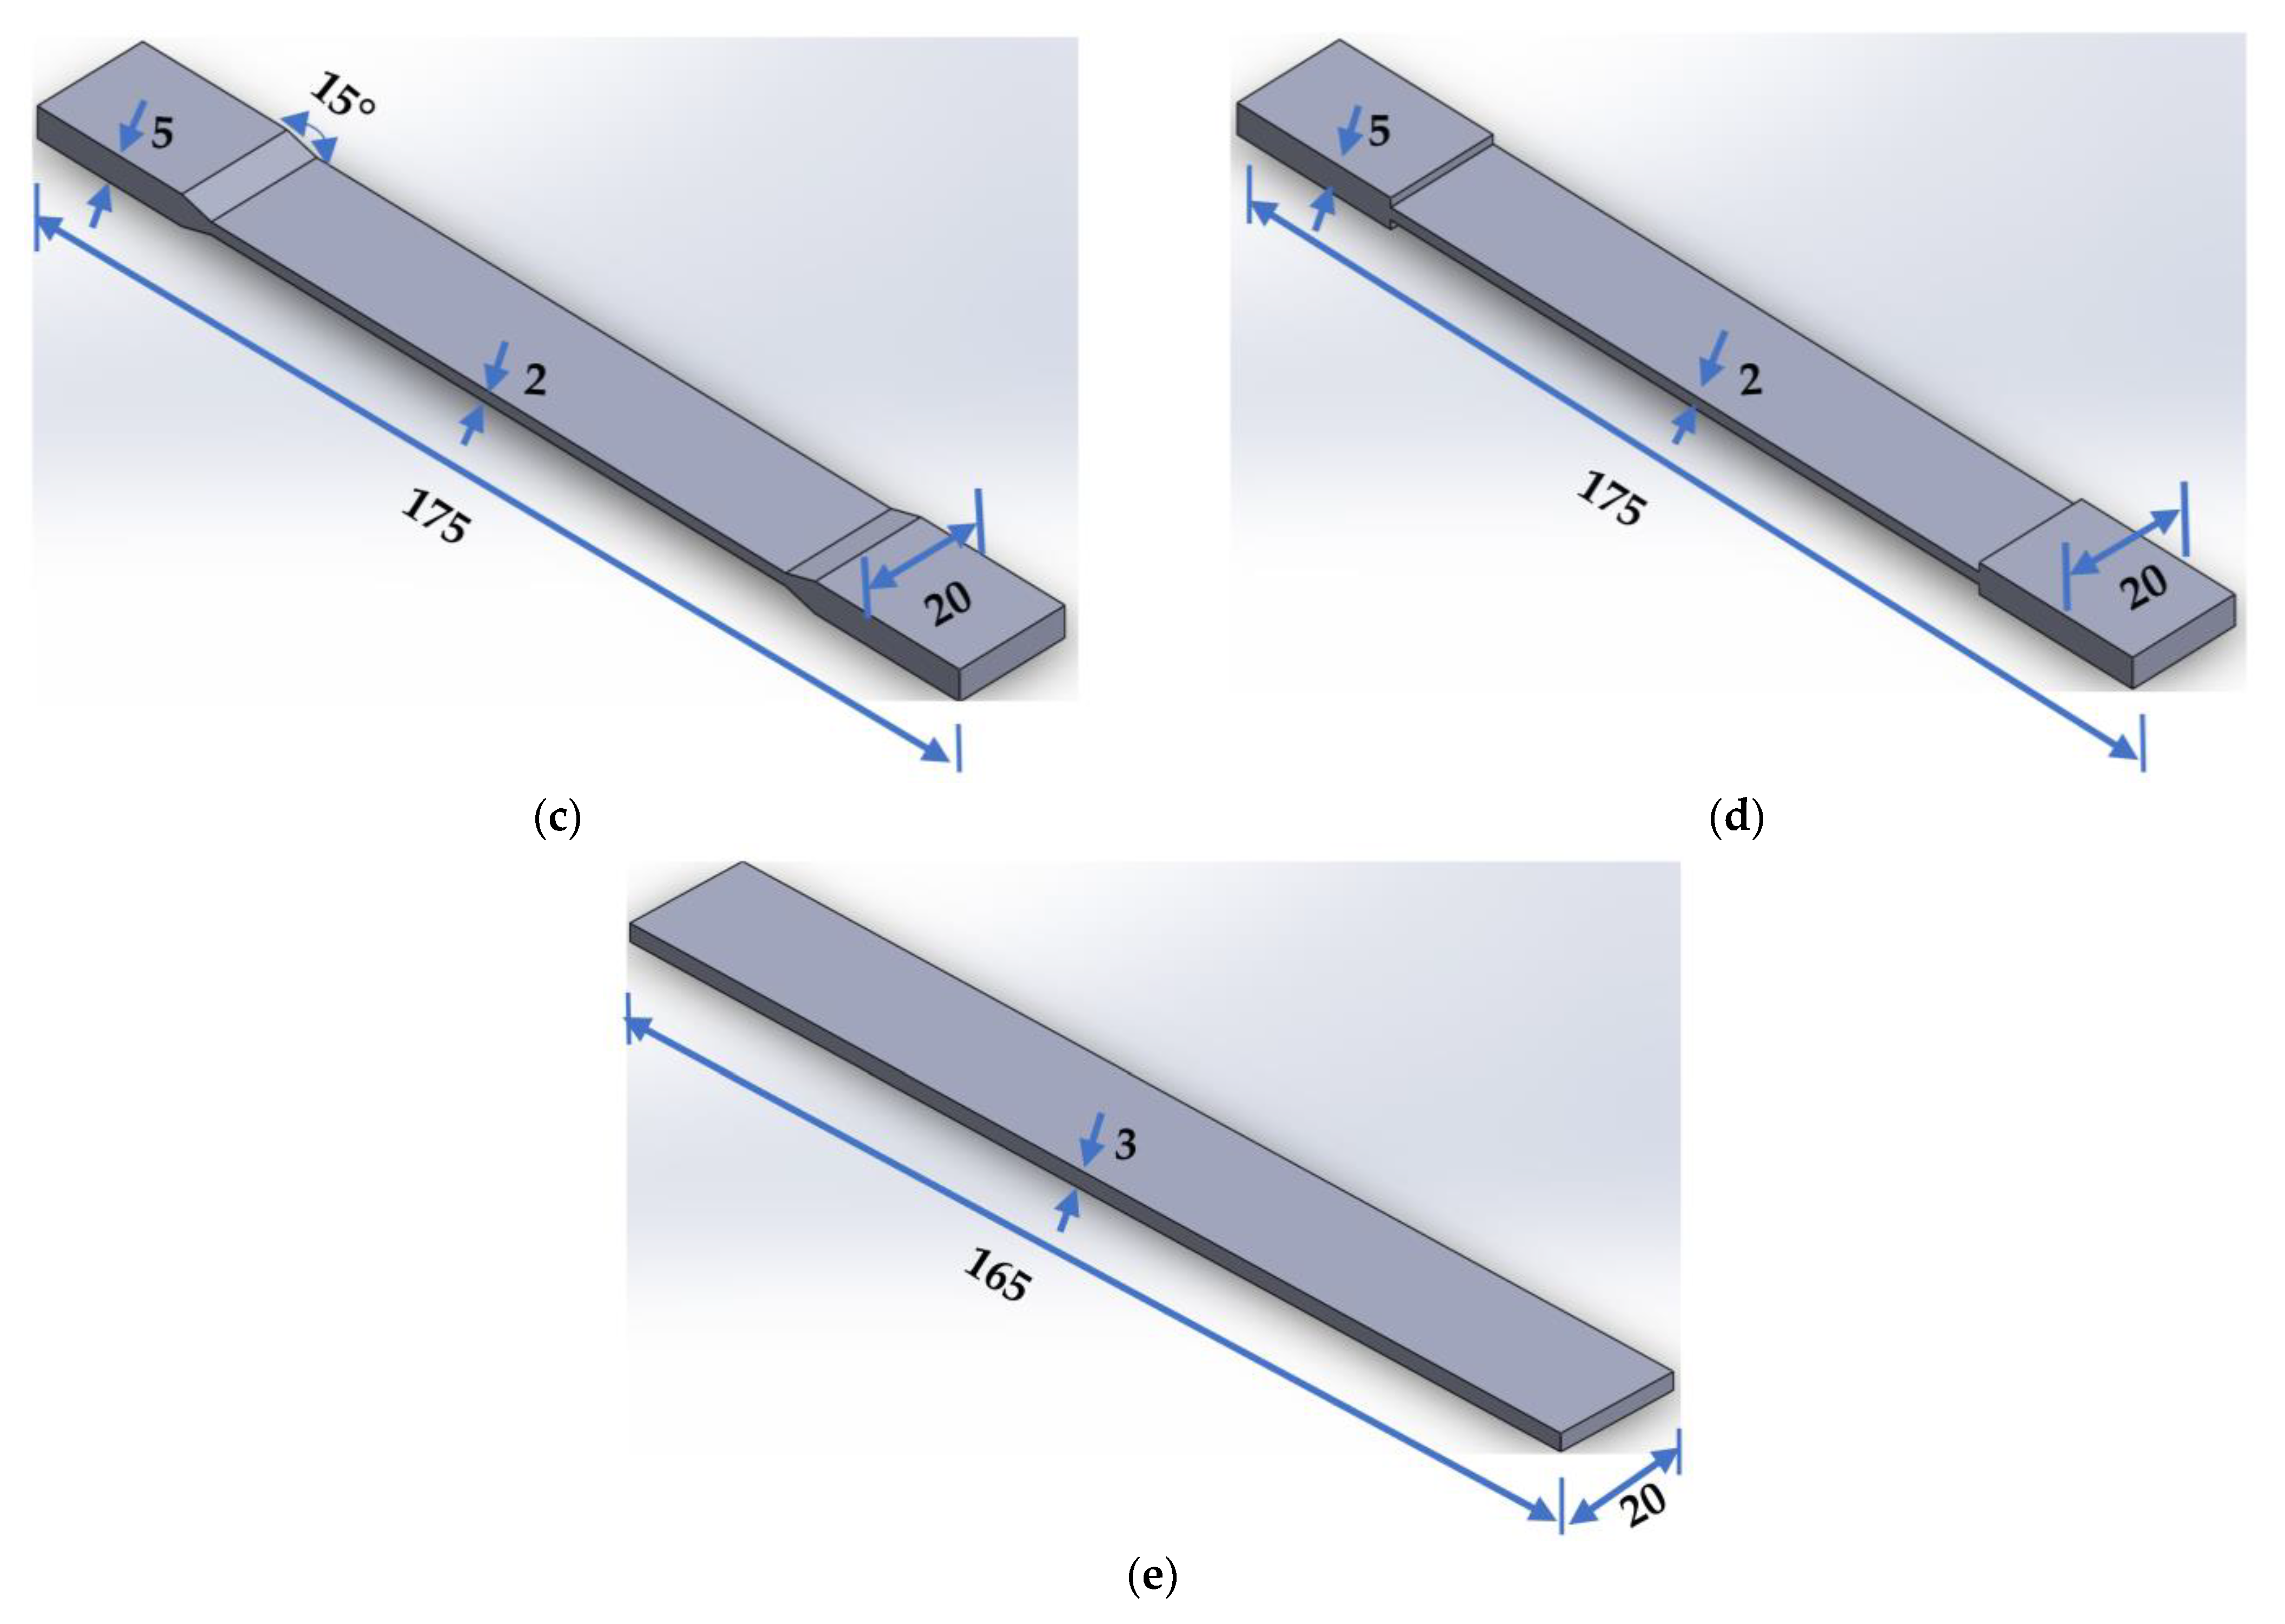
| Standard | Width of Narrow Section (mm) | Width Overall (mm) | Length Overall (mm) | Thickness of Narrow Section (mm) | Thickness Overall (mm) | Radius of Curvature (mm) | Tab Bevel Angle () |
|---|---|---|---|---|---|---|---|
| ASTM D638 | 13 | 19 | 165 | 3 | 3 | R76 | - |
| ISO 527-2 | 10 | 20 | 150 | 3 | 3 | R60 | - |
| ASTM 3039/3039M | 20 | 20 | 165 | 3 | 3 | - | 0° |
| ASTM 3039 angle | 20 | 20 | 175 | 2 | 5 | - | 15° |
| ASTM 3039 angle | 20 | 20 | 175 | 2 | 5 | - | 90° |
| Specimen’s Standard | εtm (%) | σb (MPa) | εb (%) | εtb (%) |
|---|---|---|---|---|
| ASTM-D638-Flat | 4.7 | 19.5 | 4.7 | 5.7 |
| ASTM-D638-On-edge | 5.9 | 19.9 | 9.5 | 11.2 |
| ISO 527-Flat | 4.6 | 13.4 | 4.4 | 5.6 |
| ISO 527-On-edge | 5.6 | 17.1 | 7.5 | 9.2 |
| ASTM-D3039-0°-Flat | 4.2 | 22.79 | 7 | 7.5 |
| ASTM-D3039-0°-On-edge | 5.23 | 44.3 | 4.5 | 5.2 |
| ASTM-D3039-15°-Flat | 3.9 | 23.3 | 5.2 | 5.8 |
| ASTM-D3039-15°-On-edge | 5.4 | 48.3 | 4 | 5.4 |
| ASTM-D3039-90°-Flat | 3.7 | 16.8 | 3.8 | 4.2 |
| ASTM-D3039-90°-On-edge | 4.4 | 37.9 | 2.7 | 4.4 |
| Specimen | Linear Model | Nonlinear Model | ||
|---|---|---|---|---|
| Maximum Stress (MPa) | Multiplier Factor % | Maximum Stress (MPa) | Multiplier Factor % | |
| ASTM D638 | 115.64 | 39.47 | 89.17 | 21.50 |
| ASTM D3039-0° | 149.11 | 53.05 | 77.18 | 9.30 |
| ASTM D3039-15° | 77.27 | 9.41 | 71.51 | 2.11 |
| ASTM D3039-90° | 337.1 | 79.23 | 71.33 | 1.86 |
| ISO 527-2 | 77.18 | 9.30 | 71.32 | 1.85 |
Disclaimer/Publisher’s Note: The statements, opinions and data contained in all publications are solely those of the individual author(s) and contributor(s) and not of MDPI and/or the editor(s). MDPI and/or the editor(s) disclaim responsibility for any injury to people or property resulting from any ideas, methods, instructions or products referred to in the content. |
© 2023 by the authors. Licensee MDPI, Basel, Switzerland. This article is an open access article distributed under the terms and conditions of the Creative Commons Attribution (CC BY) license (https://creativecommons.org/licenses/by/4.0/).
Share and Cite
Faidallah, R.F.; Hanon, M.M.; Vashist, V.; Habib, A.; Szakál, Z.; Oldal, I. Effect of Different Standard Geometry Shapes on the Tensile Properties of 3D-Printed Polymer. Polymers 2023, 15, 3029. https://doi.org/10.3390/polym15143029
Faidallah RF, Hanon MM, Vashist V, Habib A, Szakál Z, Oldal I. Effect of Different Standard Geometry Shapes on the Tensile Properties of 3D-Printed Polymer. Polymers. 2023; 15(14):3029. https://doi.org/10.3390/polym15143029
Chicago/Turabian StyleFaidallah, Rawabe Fatima, Muammel M. Hanon, Varun Vashist, Ahmad Habib, Zoltán Szakál, and István Oldal. 2023. "Effect of Different Standard Geometry Shapes on the Tensile Properties of 3D-Printed Polymer" Polymers 15, no. 14: 3029. https://doi.org/10.3390/polym15143029
APA StyleFaidallah, R. F., Hanon, M. M., Vashist, V., Habib, A., Szakál, Z., & Oldal, I. (2023). Effect of Different Standard Geometry Shapes on the Tensile Properties of 3D-Printed Polymer. Polymers, 15(14), 3029. https://doi.org/10.3390/polym15143029