


Magnetic Filler Polymer Composites—Morphology Characterization and Experimental and Stochastic Finite Element Analyses of Mechanical Properties


Abstract
1. Introduction
2. Materials and Methods
2.1. Materials
2.2. Material Fabrication
2.3. Material Characterization
2.4. Numerical Modeling
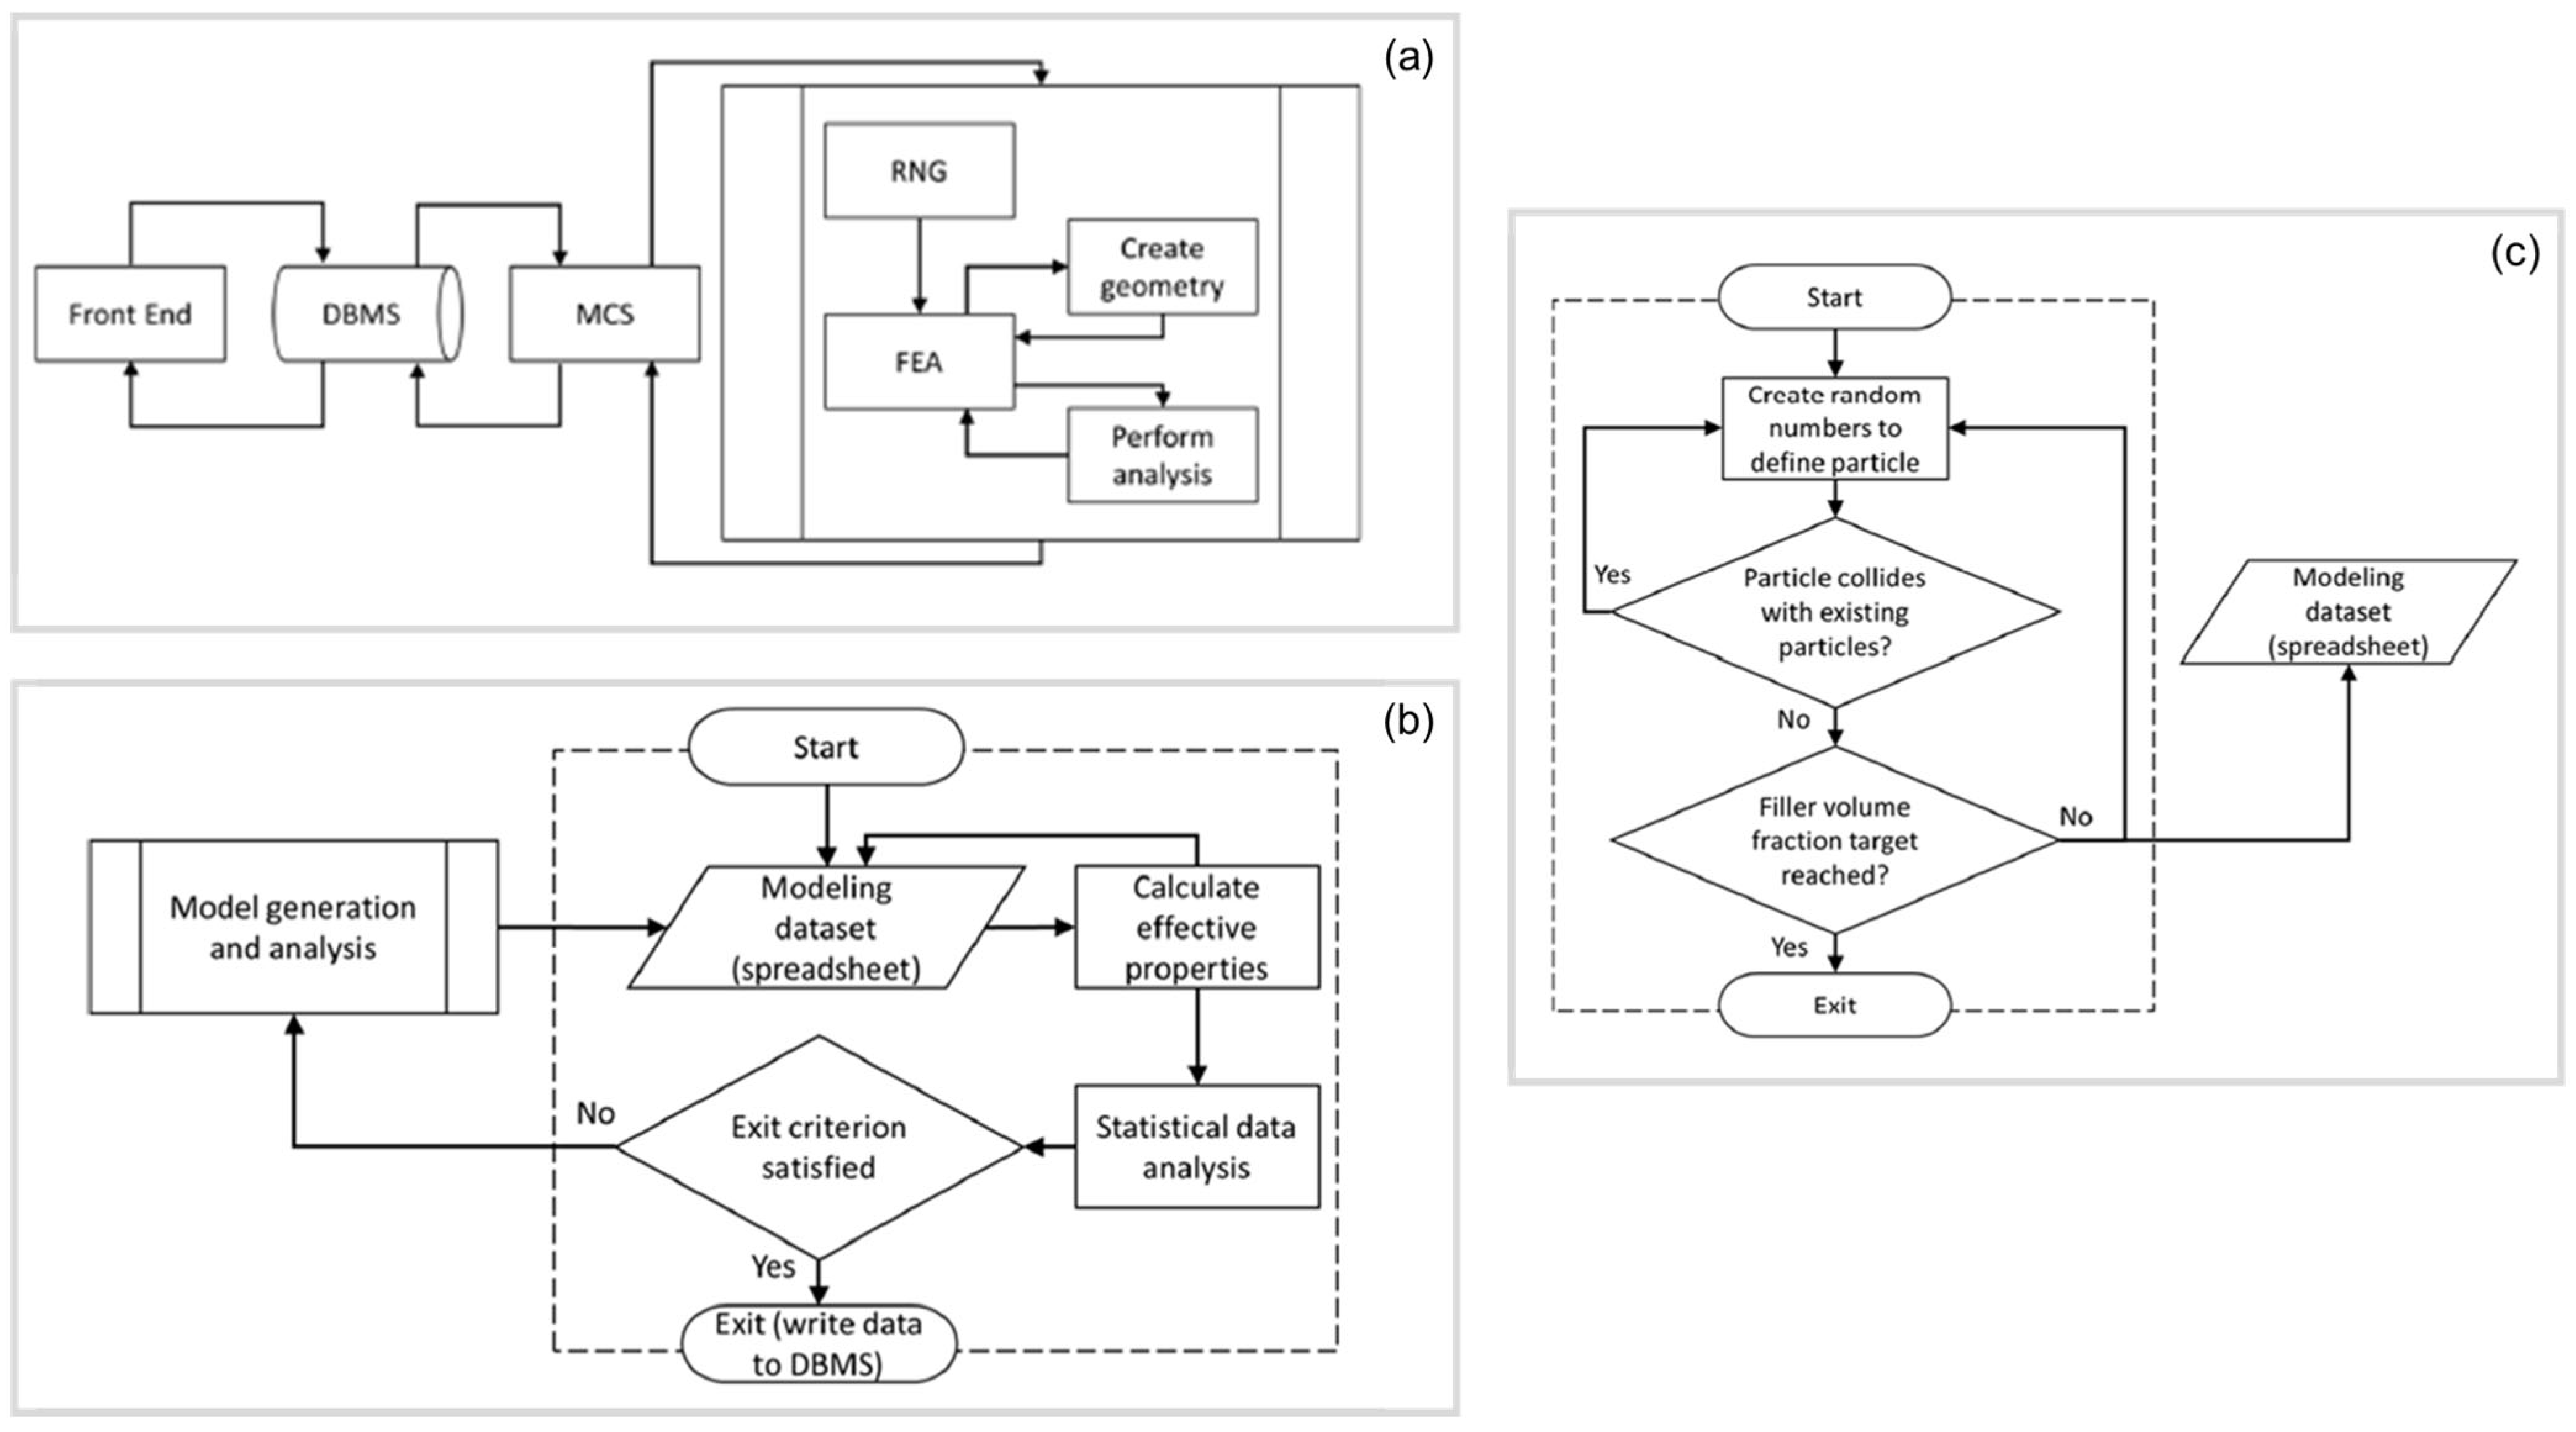
- The “Front End” module is designed to capture all the input parameters (i.e., size of the representative volume element (RVE), filler and matrix properties, filler particle distribution, etc.), and store them in a database management system (DBMS).
- The DBMS is developed by an Open Database Connectivity method to ensure the independence of the database for providing accurate information to the MCS module.
- The MCS module enables storing the information of interest obtained by the analysis sub-process and the model generation. The algorithm in this module (see Figure 1b) is repeated until reaching desired values that satisfy the acceptance criteria (i.e., standard deviation). Once the MCS process stops, the desired property is calculated. Results are calculated in each iteration, and mean values are saved to the database.
- The random number generator module (RNG), shown in Figure 1c, is created using the programming environment MATLAB (MathWorks, Natick, MA, USA), which facilitates the generation of random numbers required for input variables. These variables are Cartesian coordinates for particle locations (X, Y, Z), and particle dimension and orientation, which enables a random distribution within the RVE. The RNG module also performs collision detection among the particles inside the RVE.
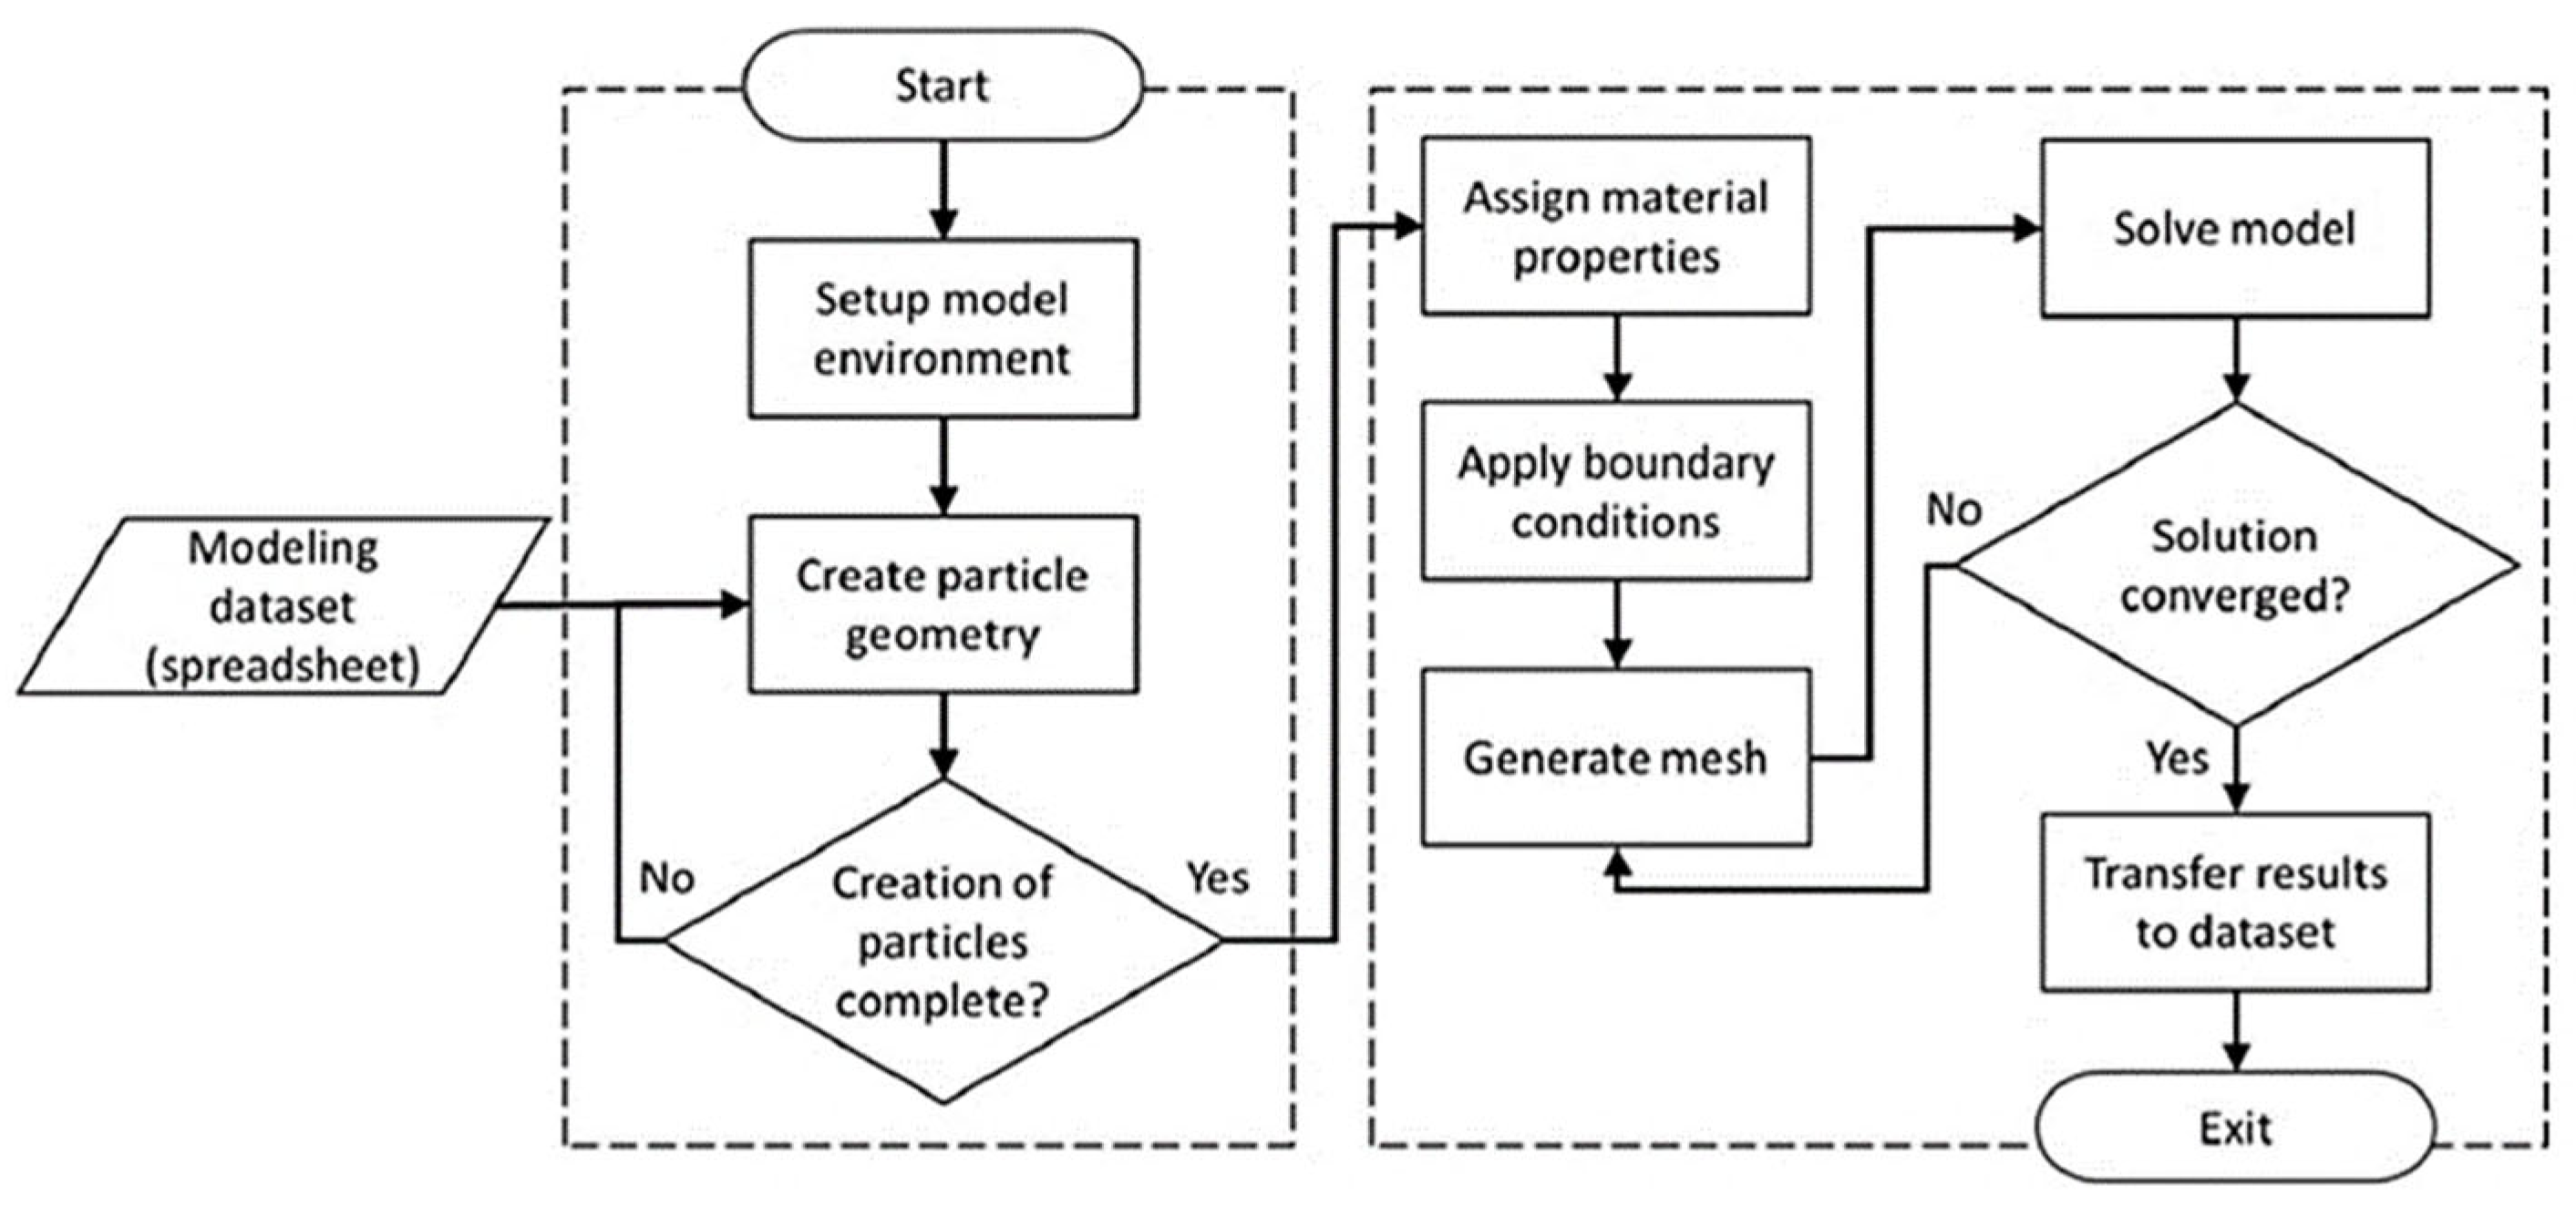
- The FEA platform is developed using the commercial FEA software ANSYS Workbench (Version 2022R2, ANSYS, Canonsburg, PA, USA). As depicted in Figure 2, the FEA platform possesses two sub-modules to create the three-dimensional geometry and the full FEA model. In the first module, ANSYS DesignModeler in conjunction with scripting in JavaScript language is utilized to read the data generated by the RNG module and create geometries for particles and the RVE. The resulting geometric representation is then transferred to the FEA modeling environment. In the second module, the FEA environment is generated using ANSYS Mechanical in conjunction with JavaScript programming language. In this FEA environment, a convergence study is performed by refining the mesh size and extracting results to check if the convergence is satisfactory. Finally, the results obtained are transferred to the MCS module and saved for further statistical analysis.
3. Results and Discussion
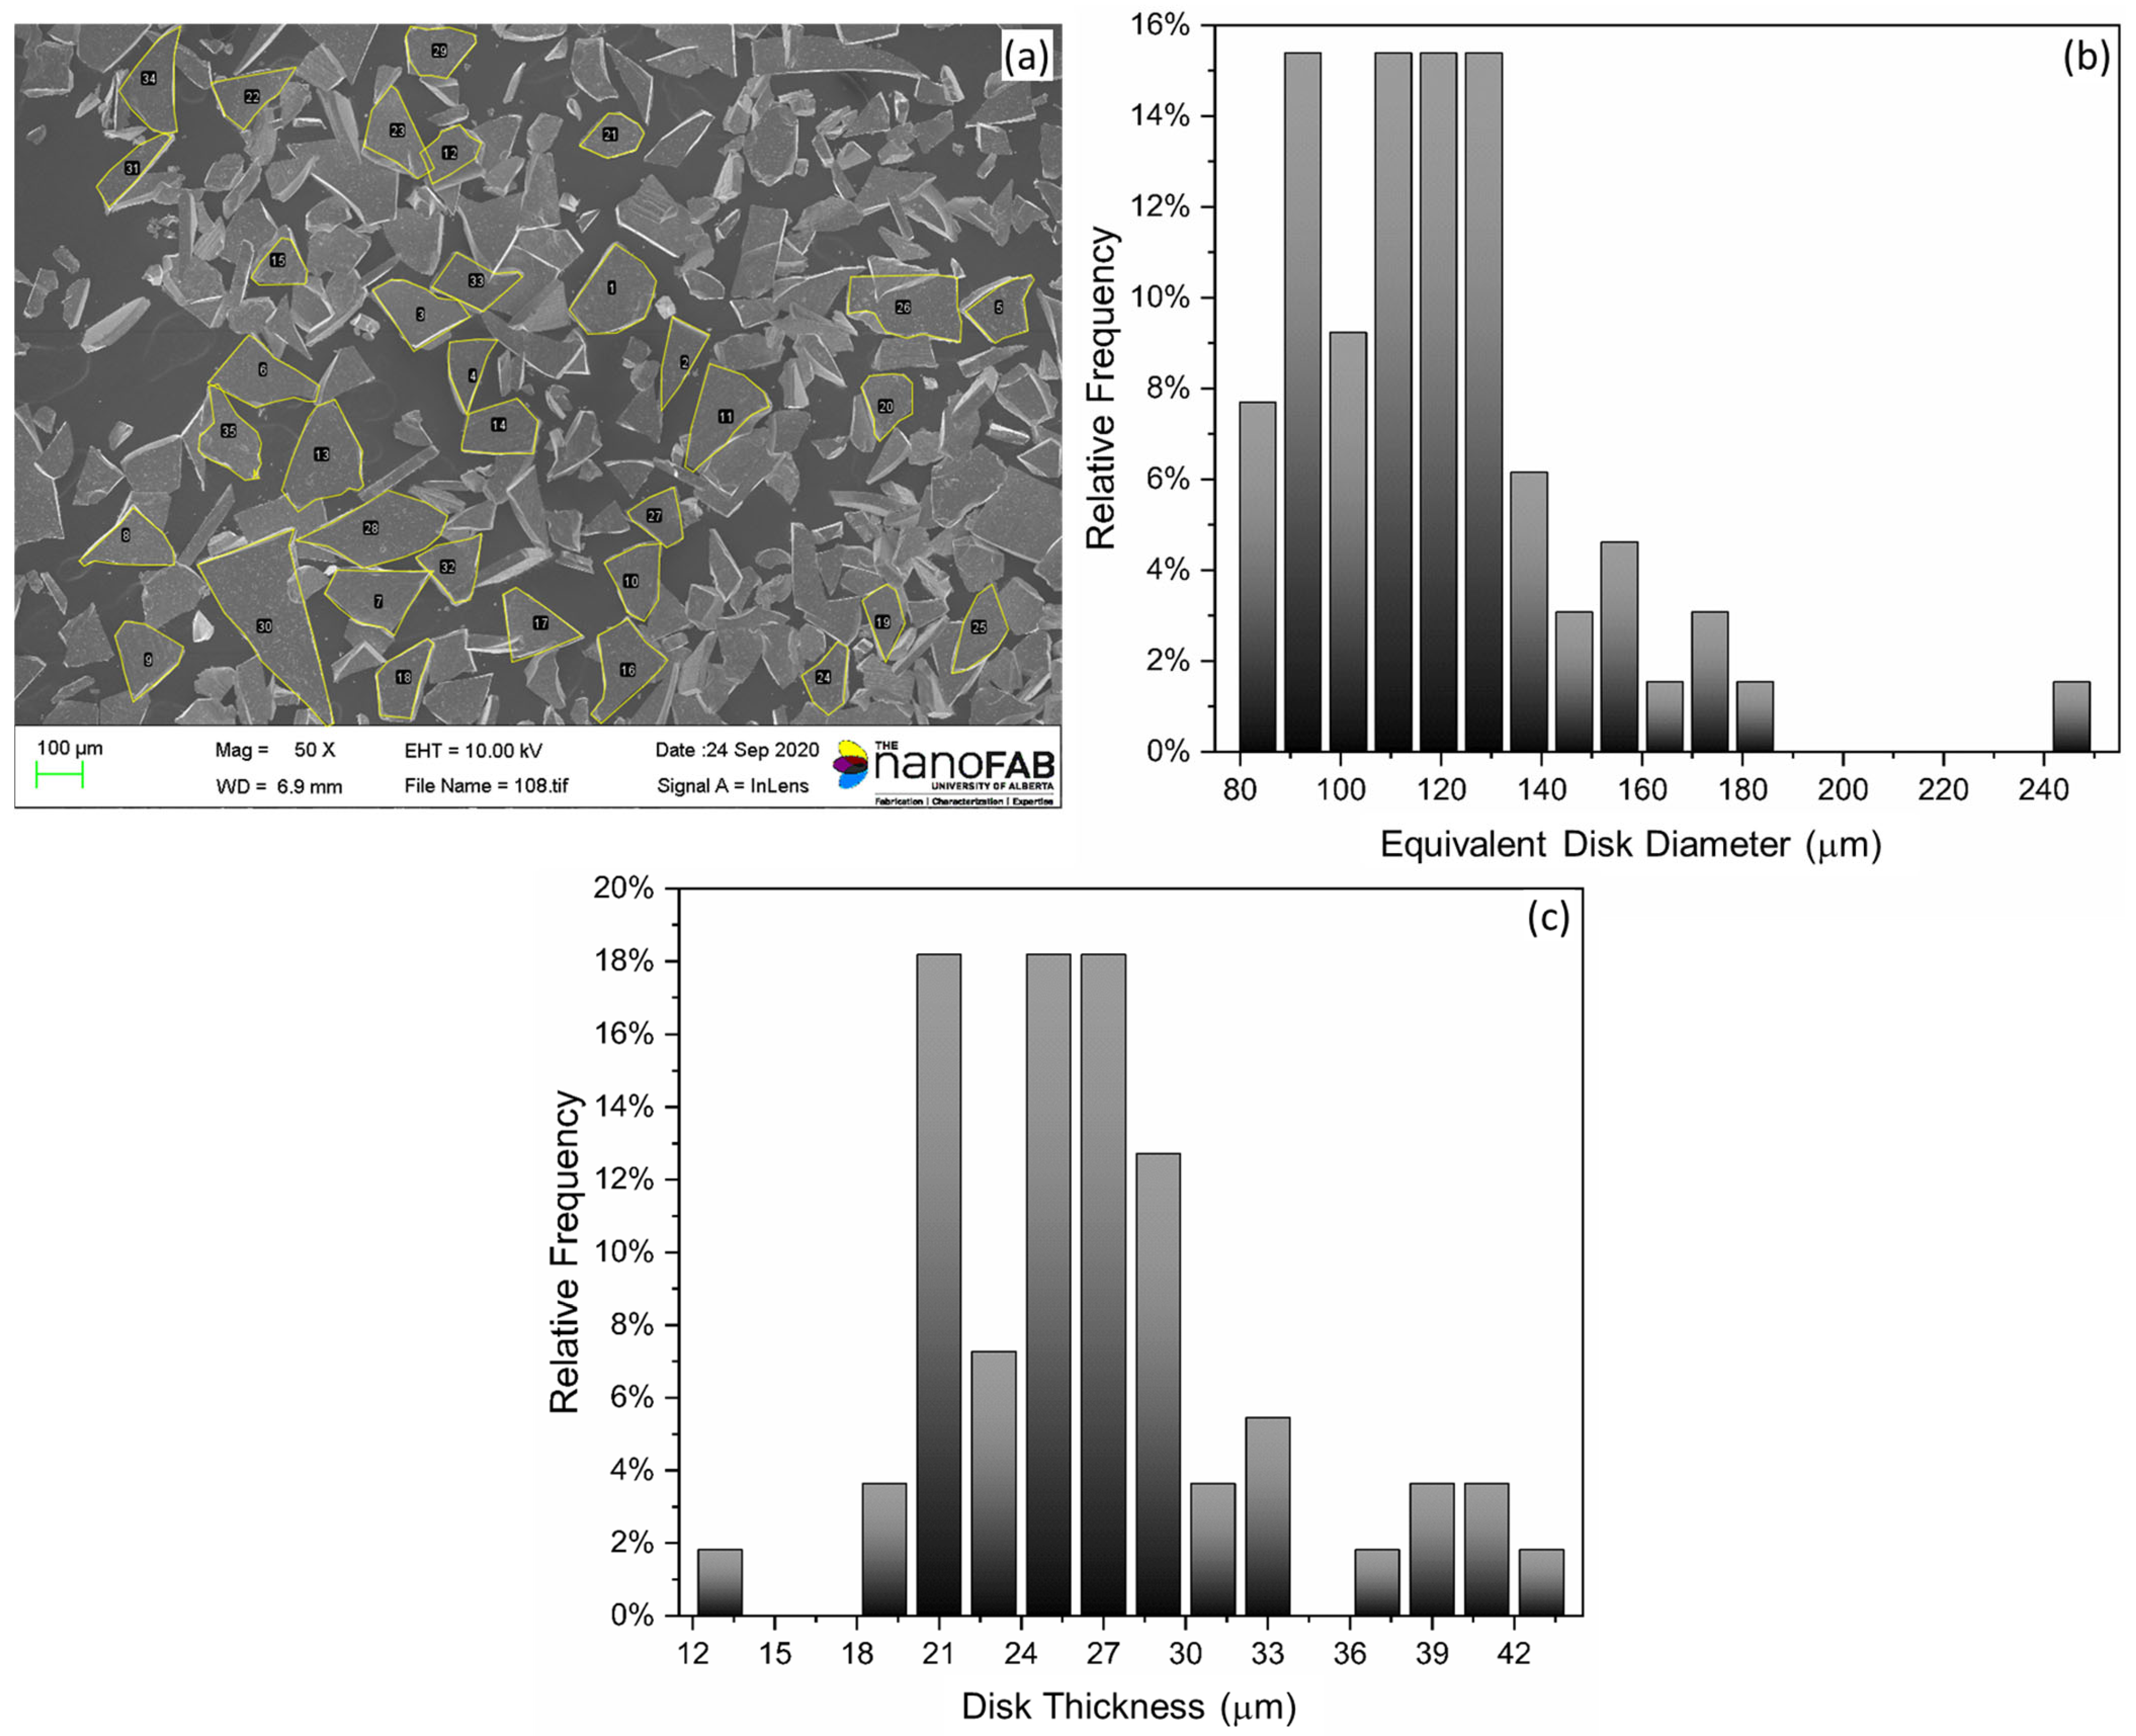
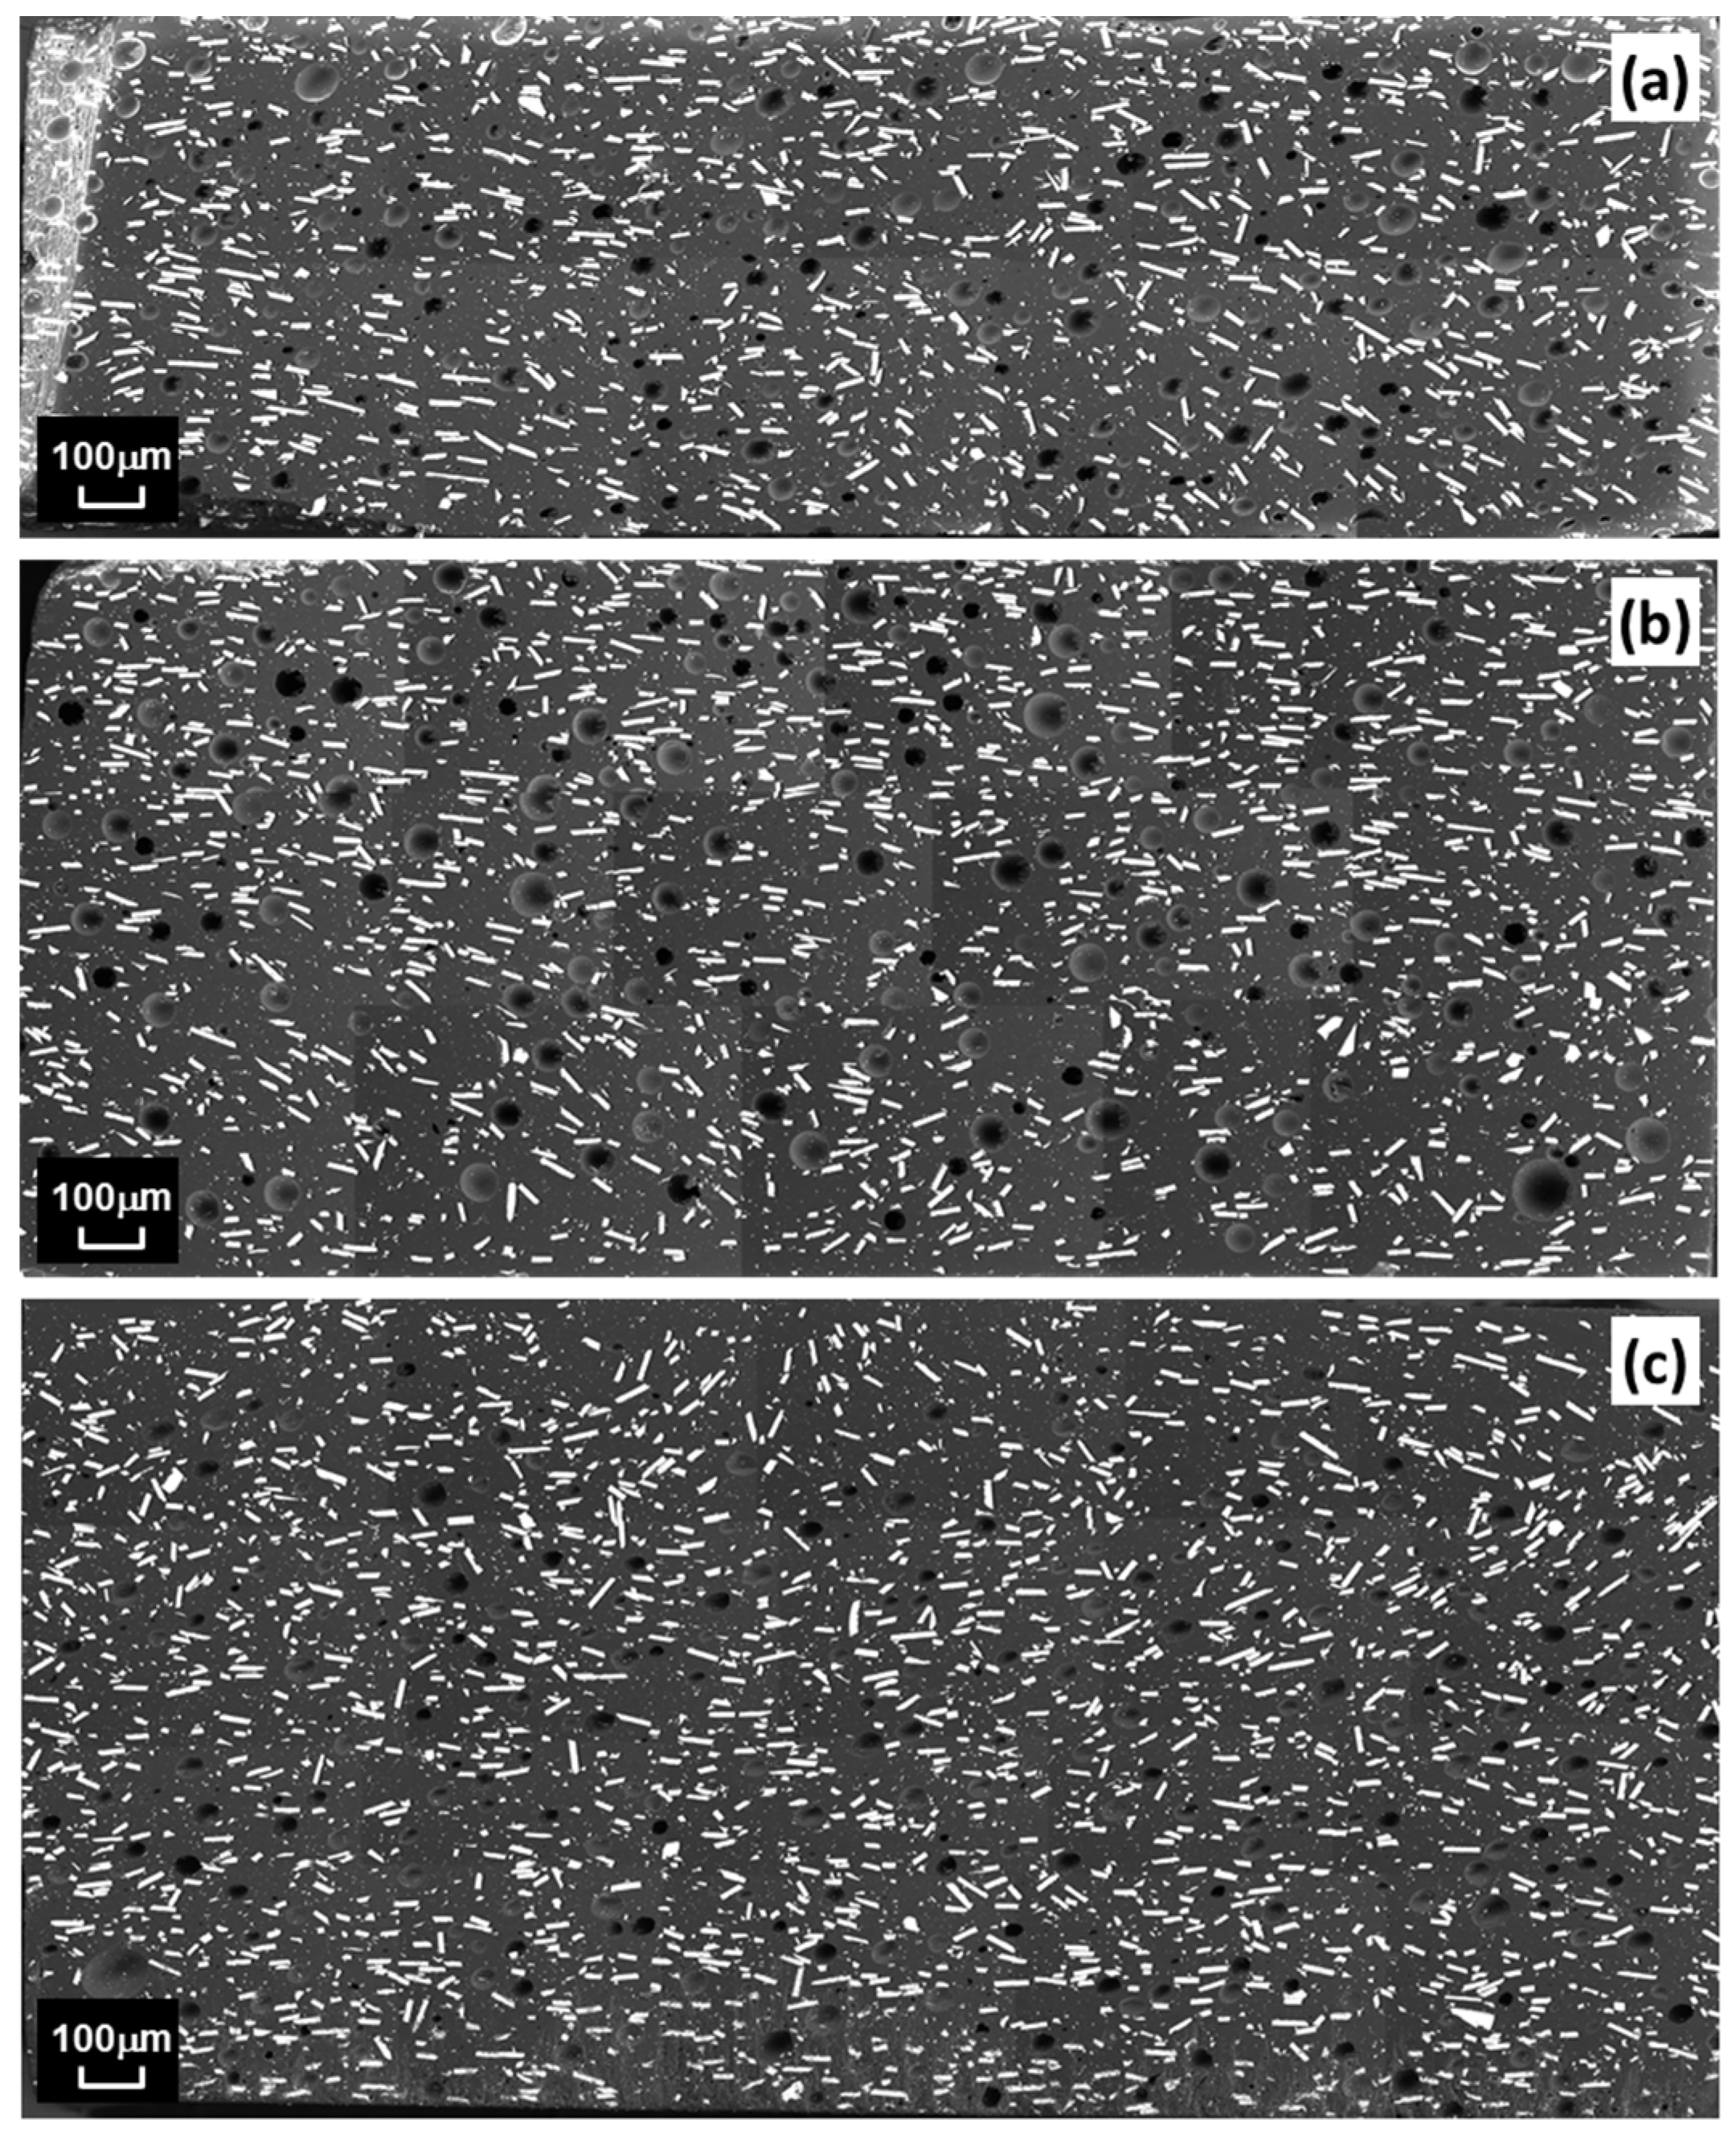
3.1. Composite Microstructure Characterization
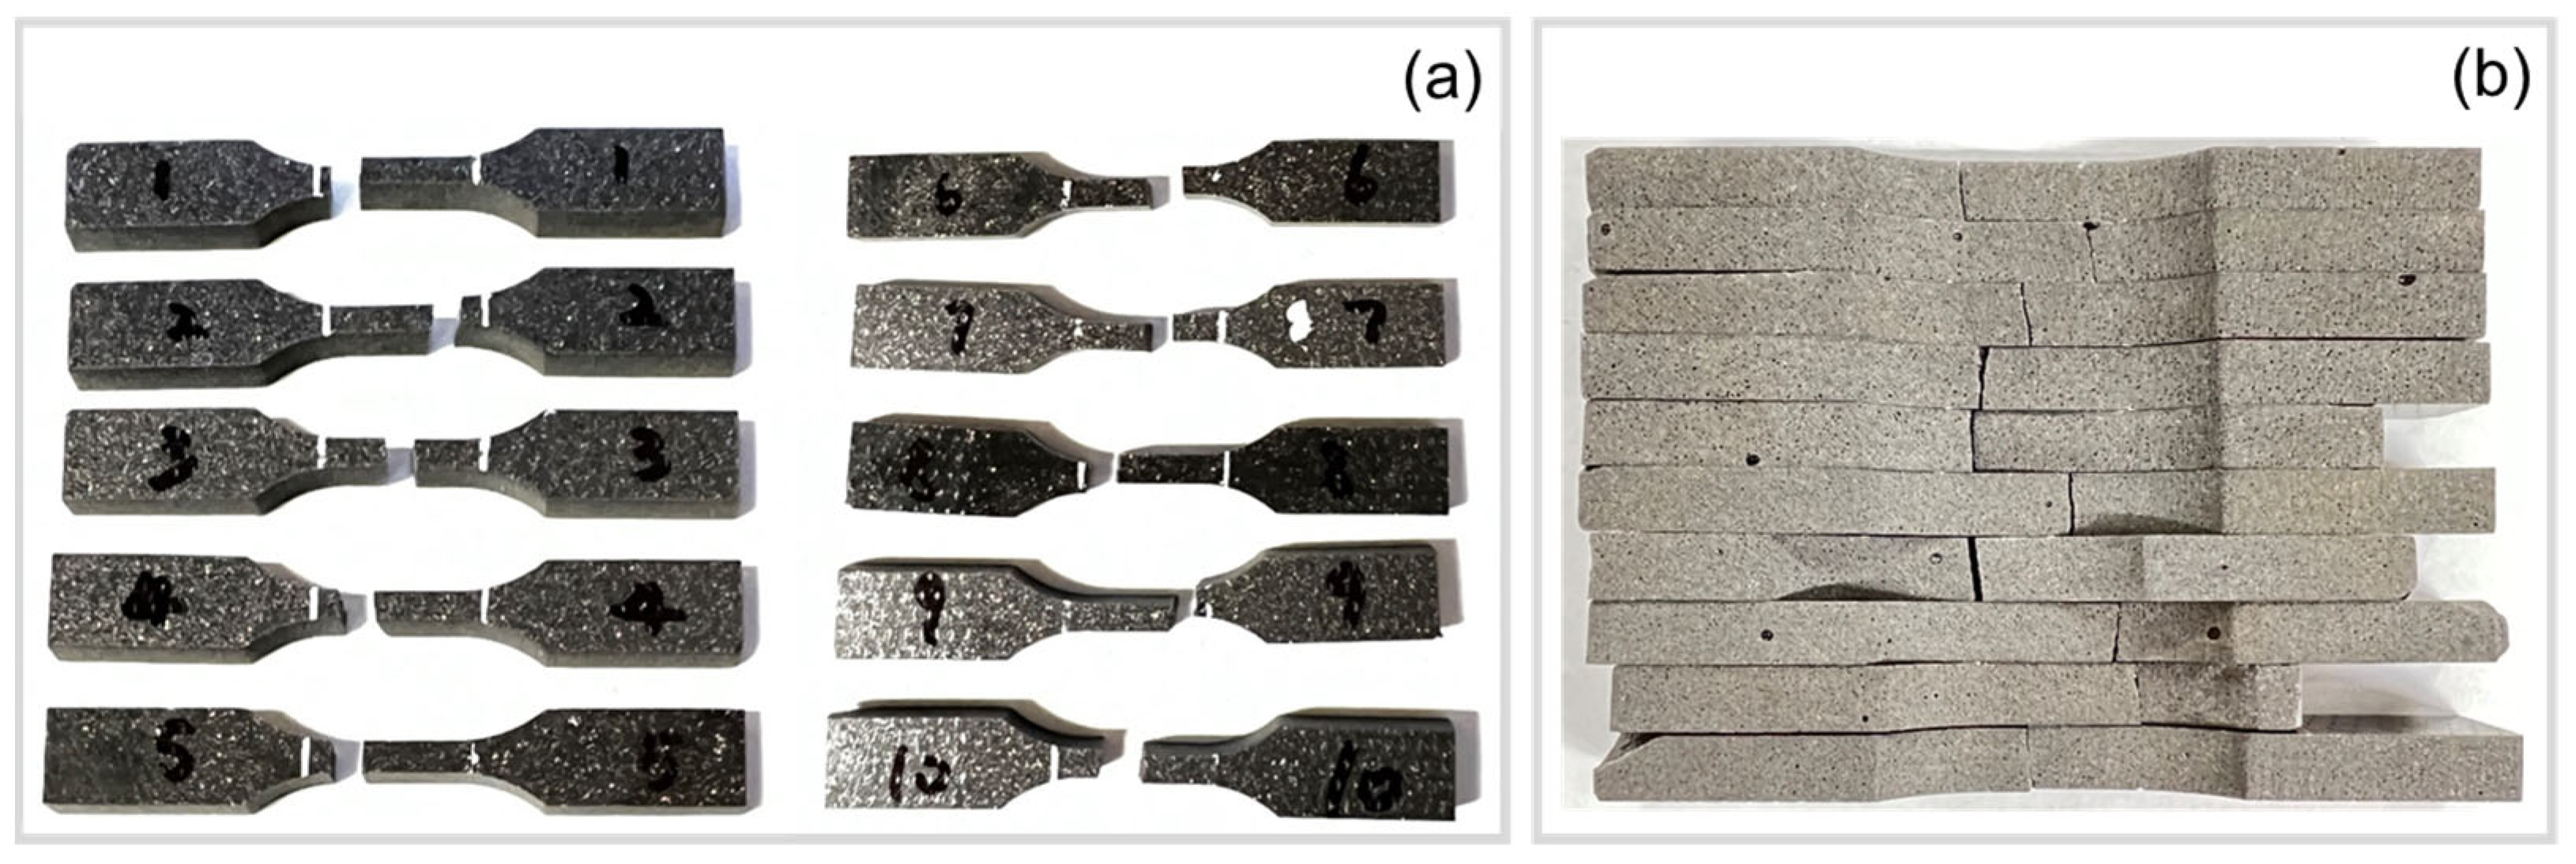
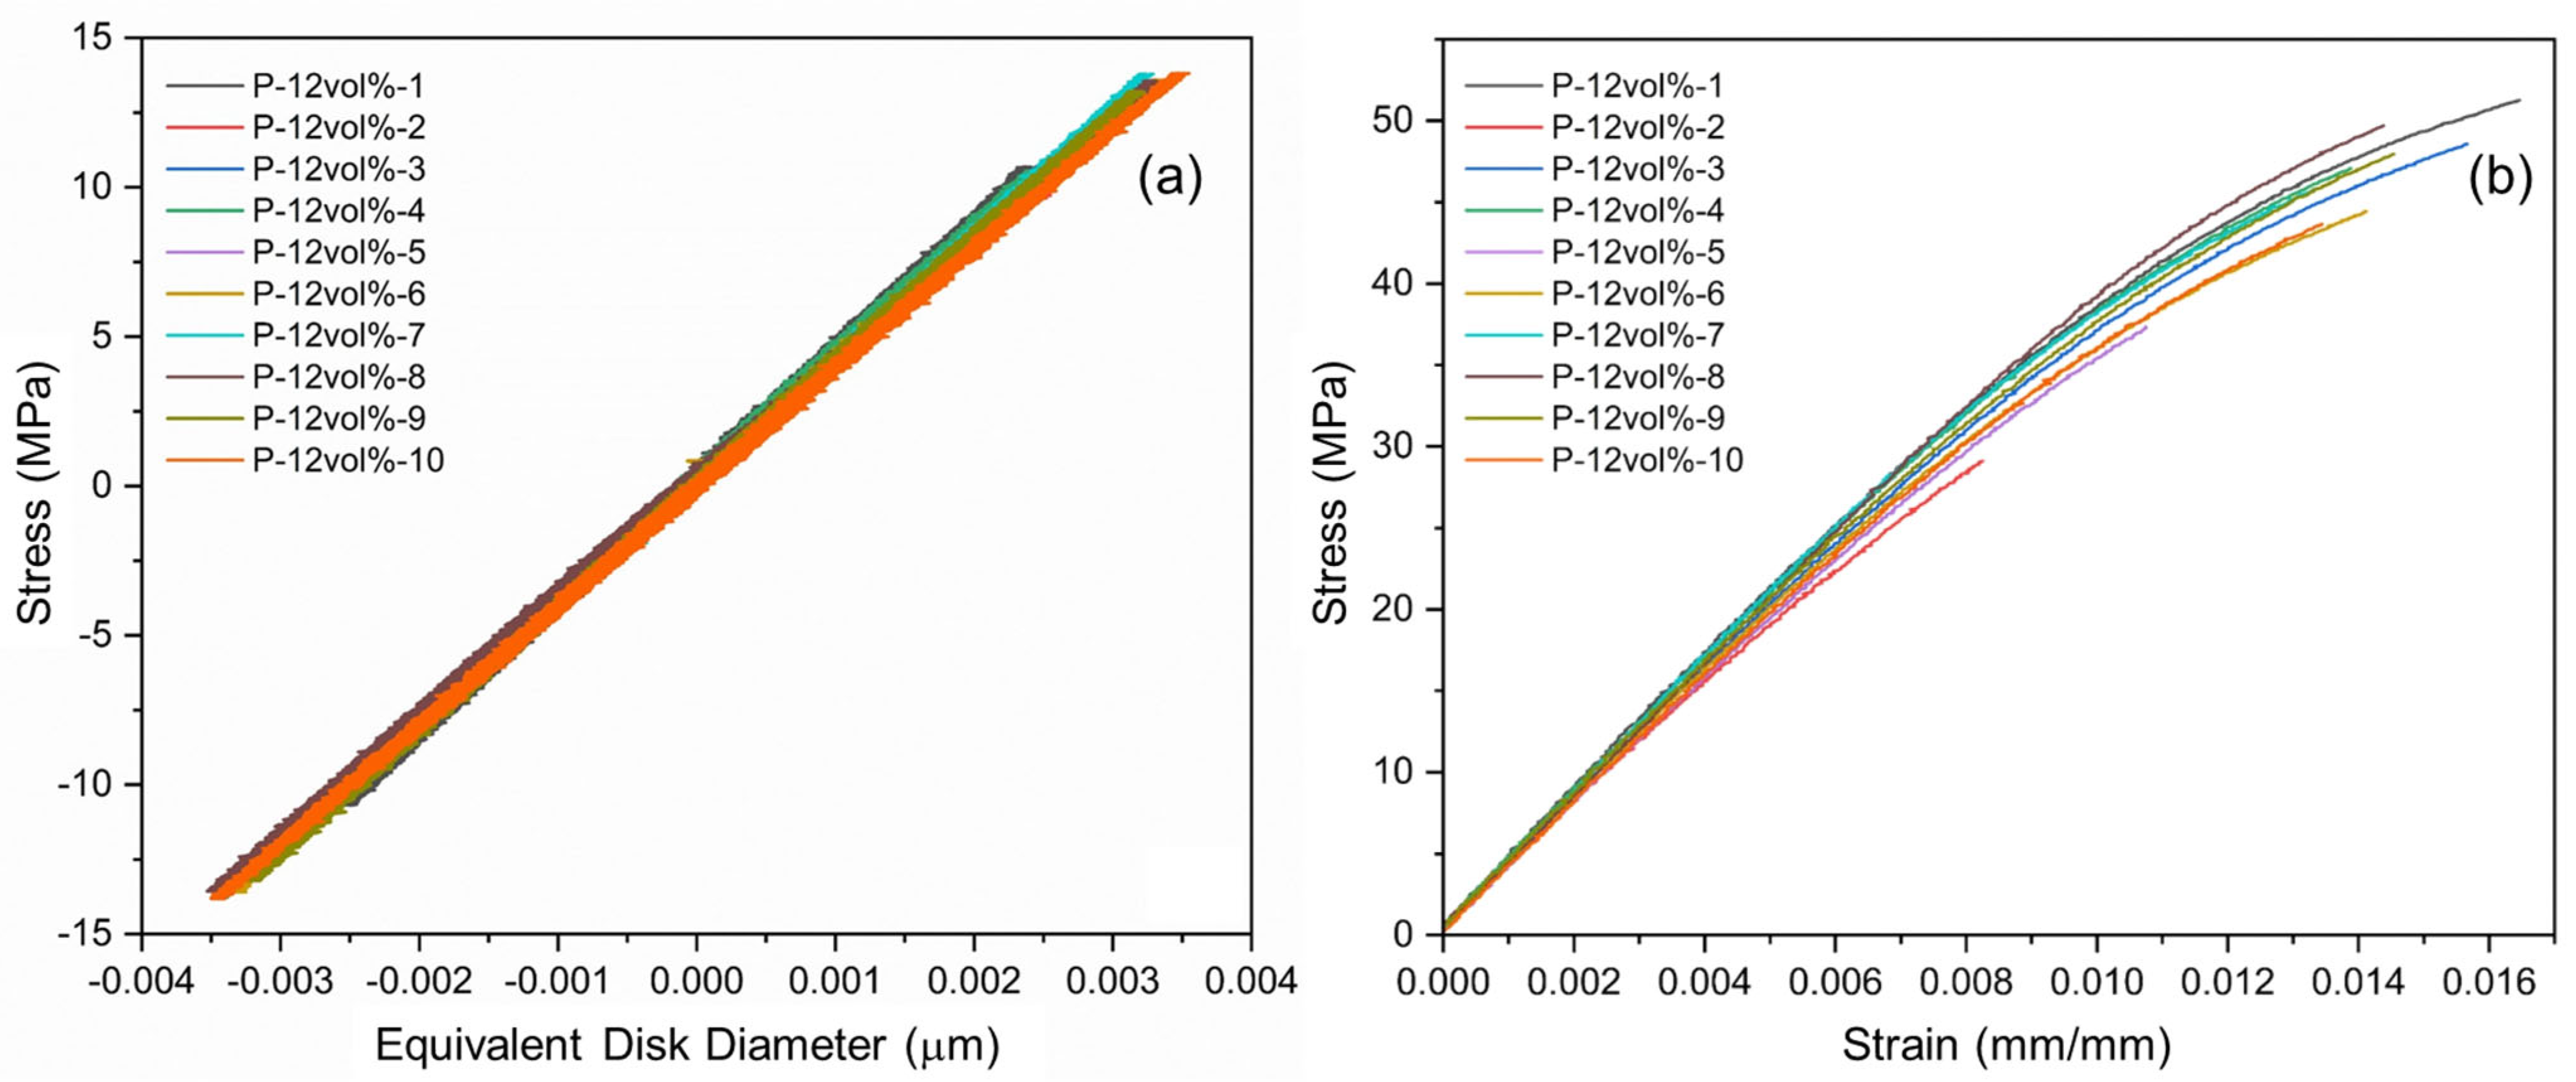
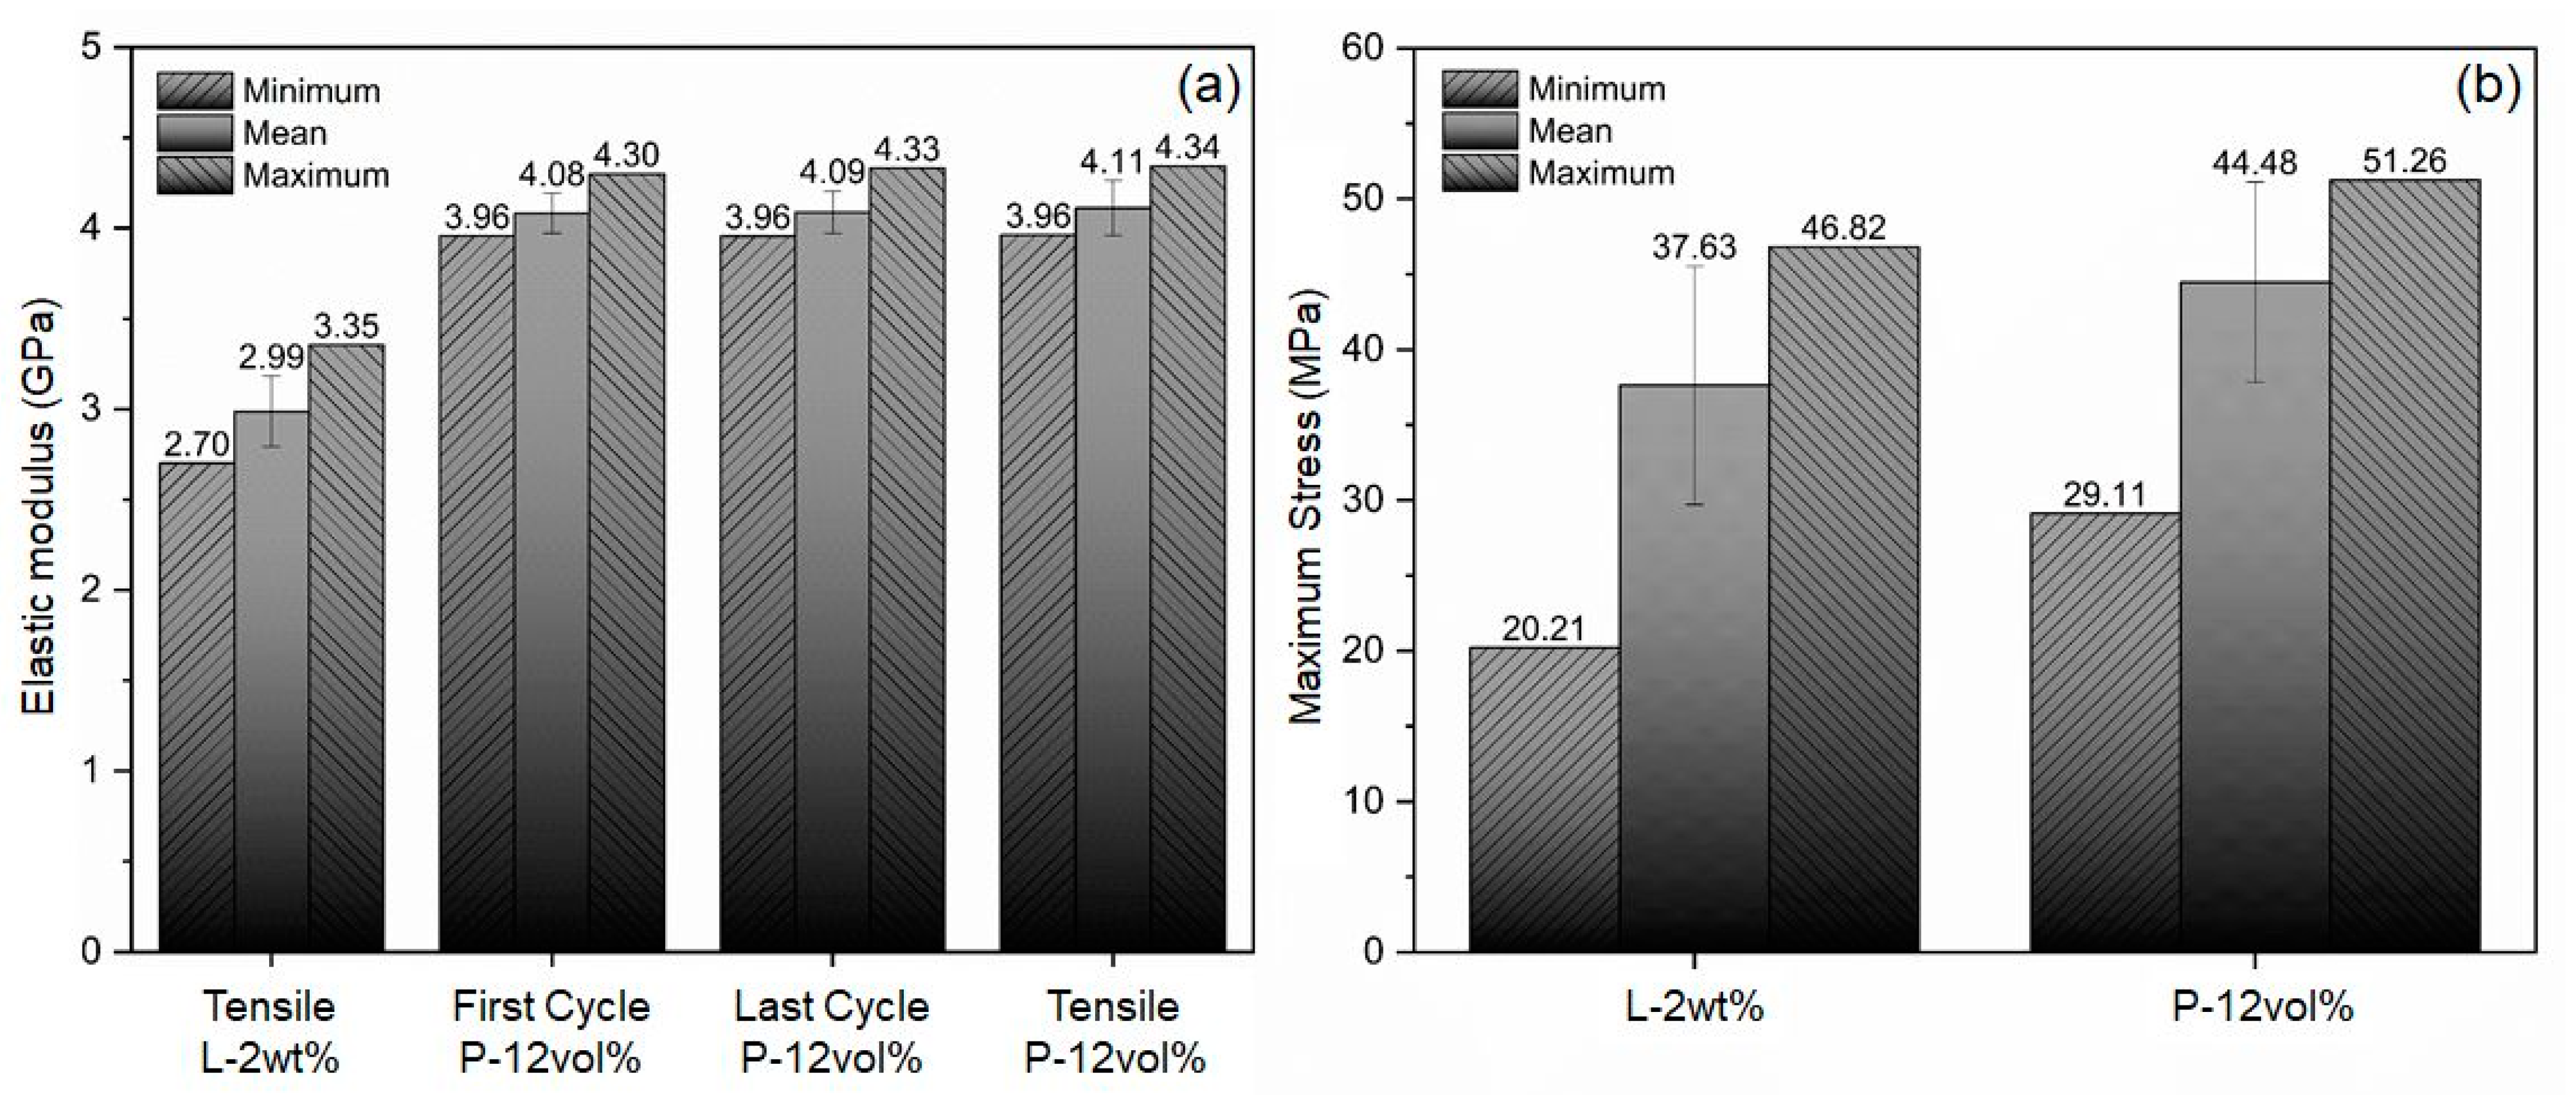
3.2. Mechanical Testing
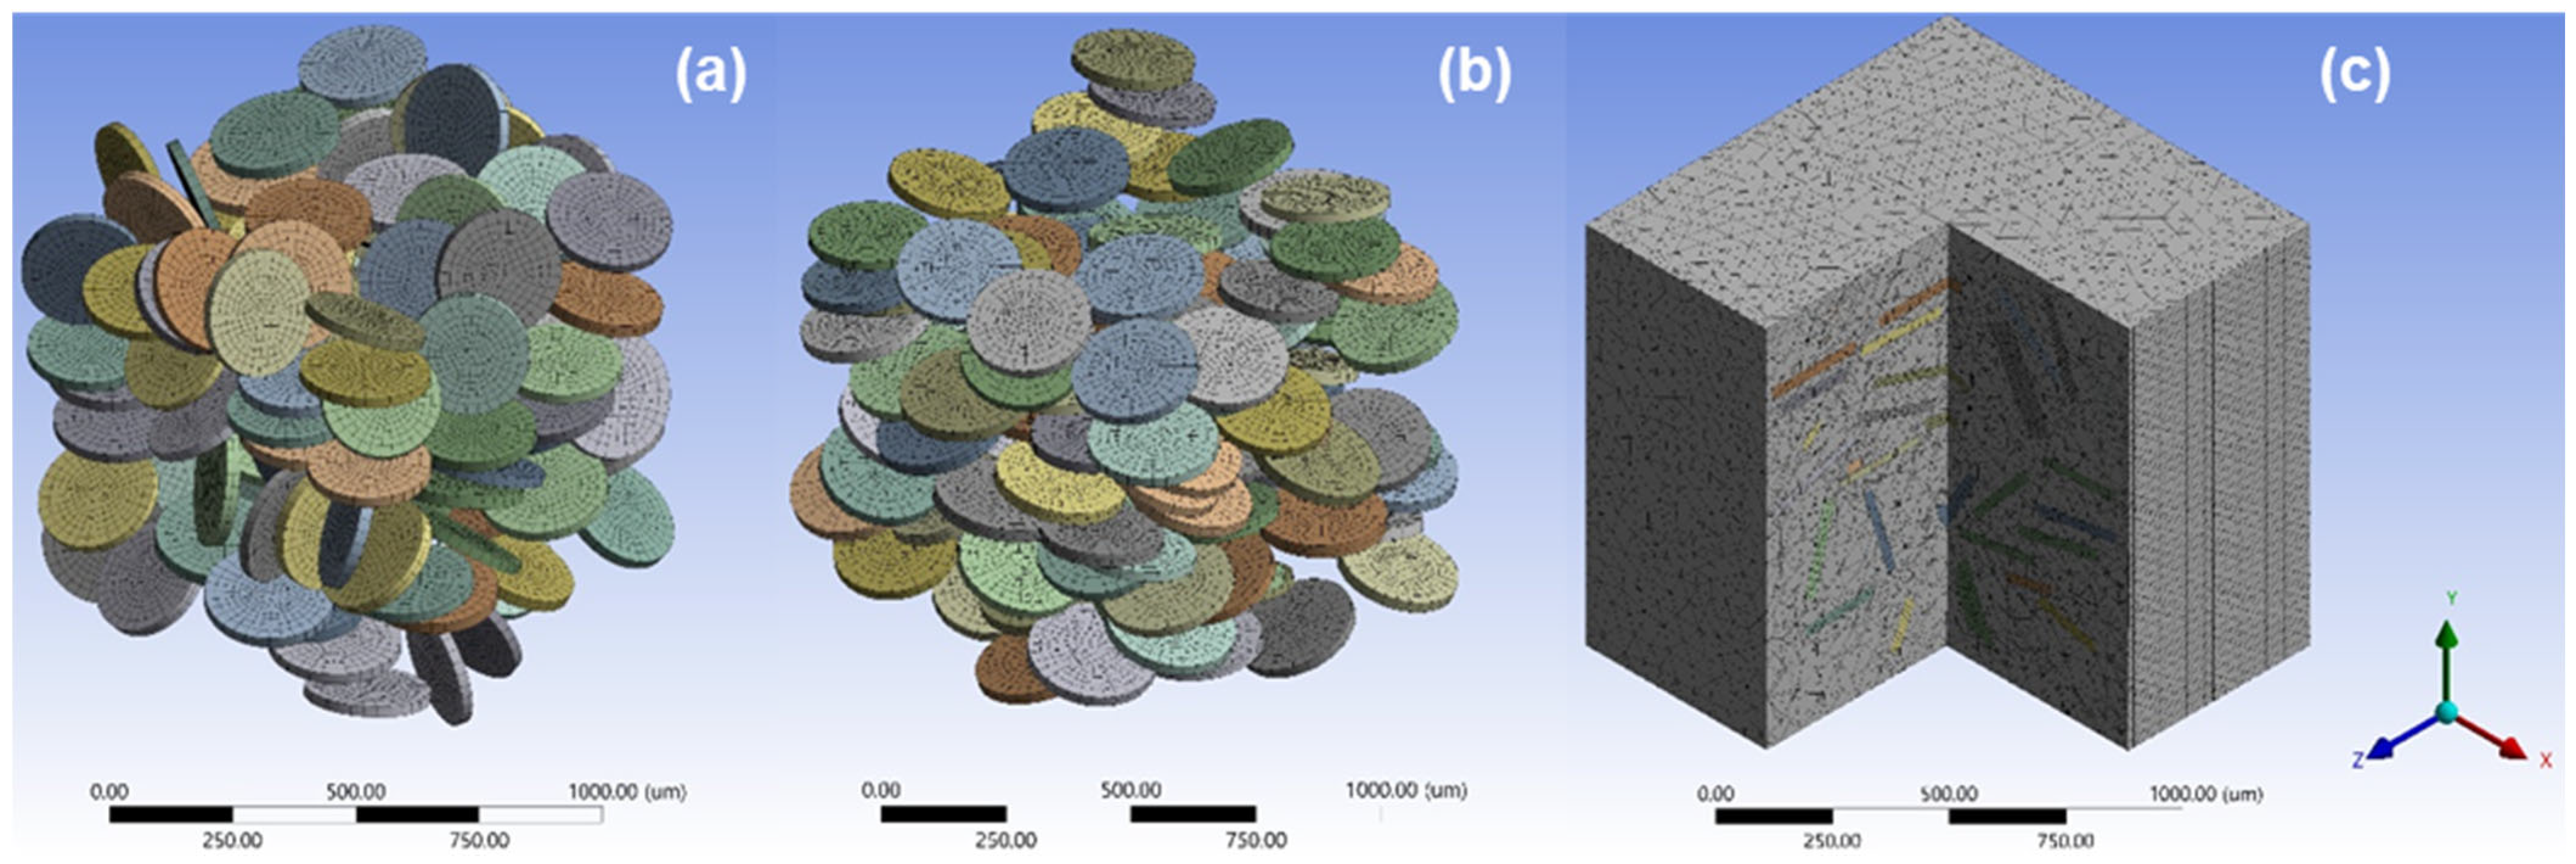
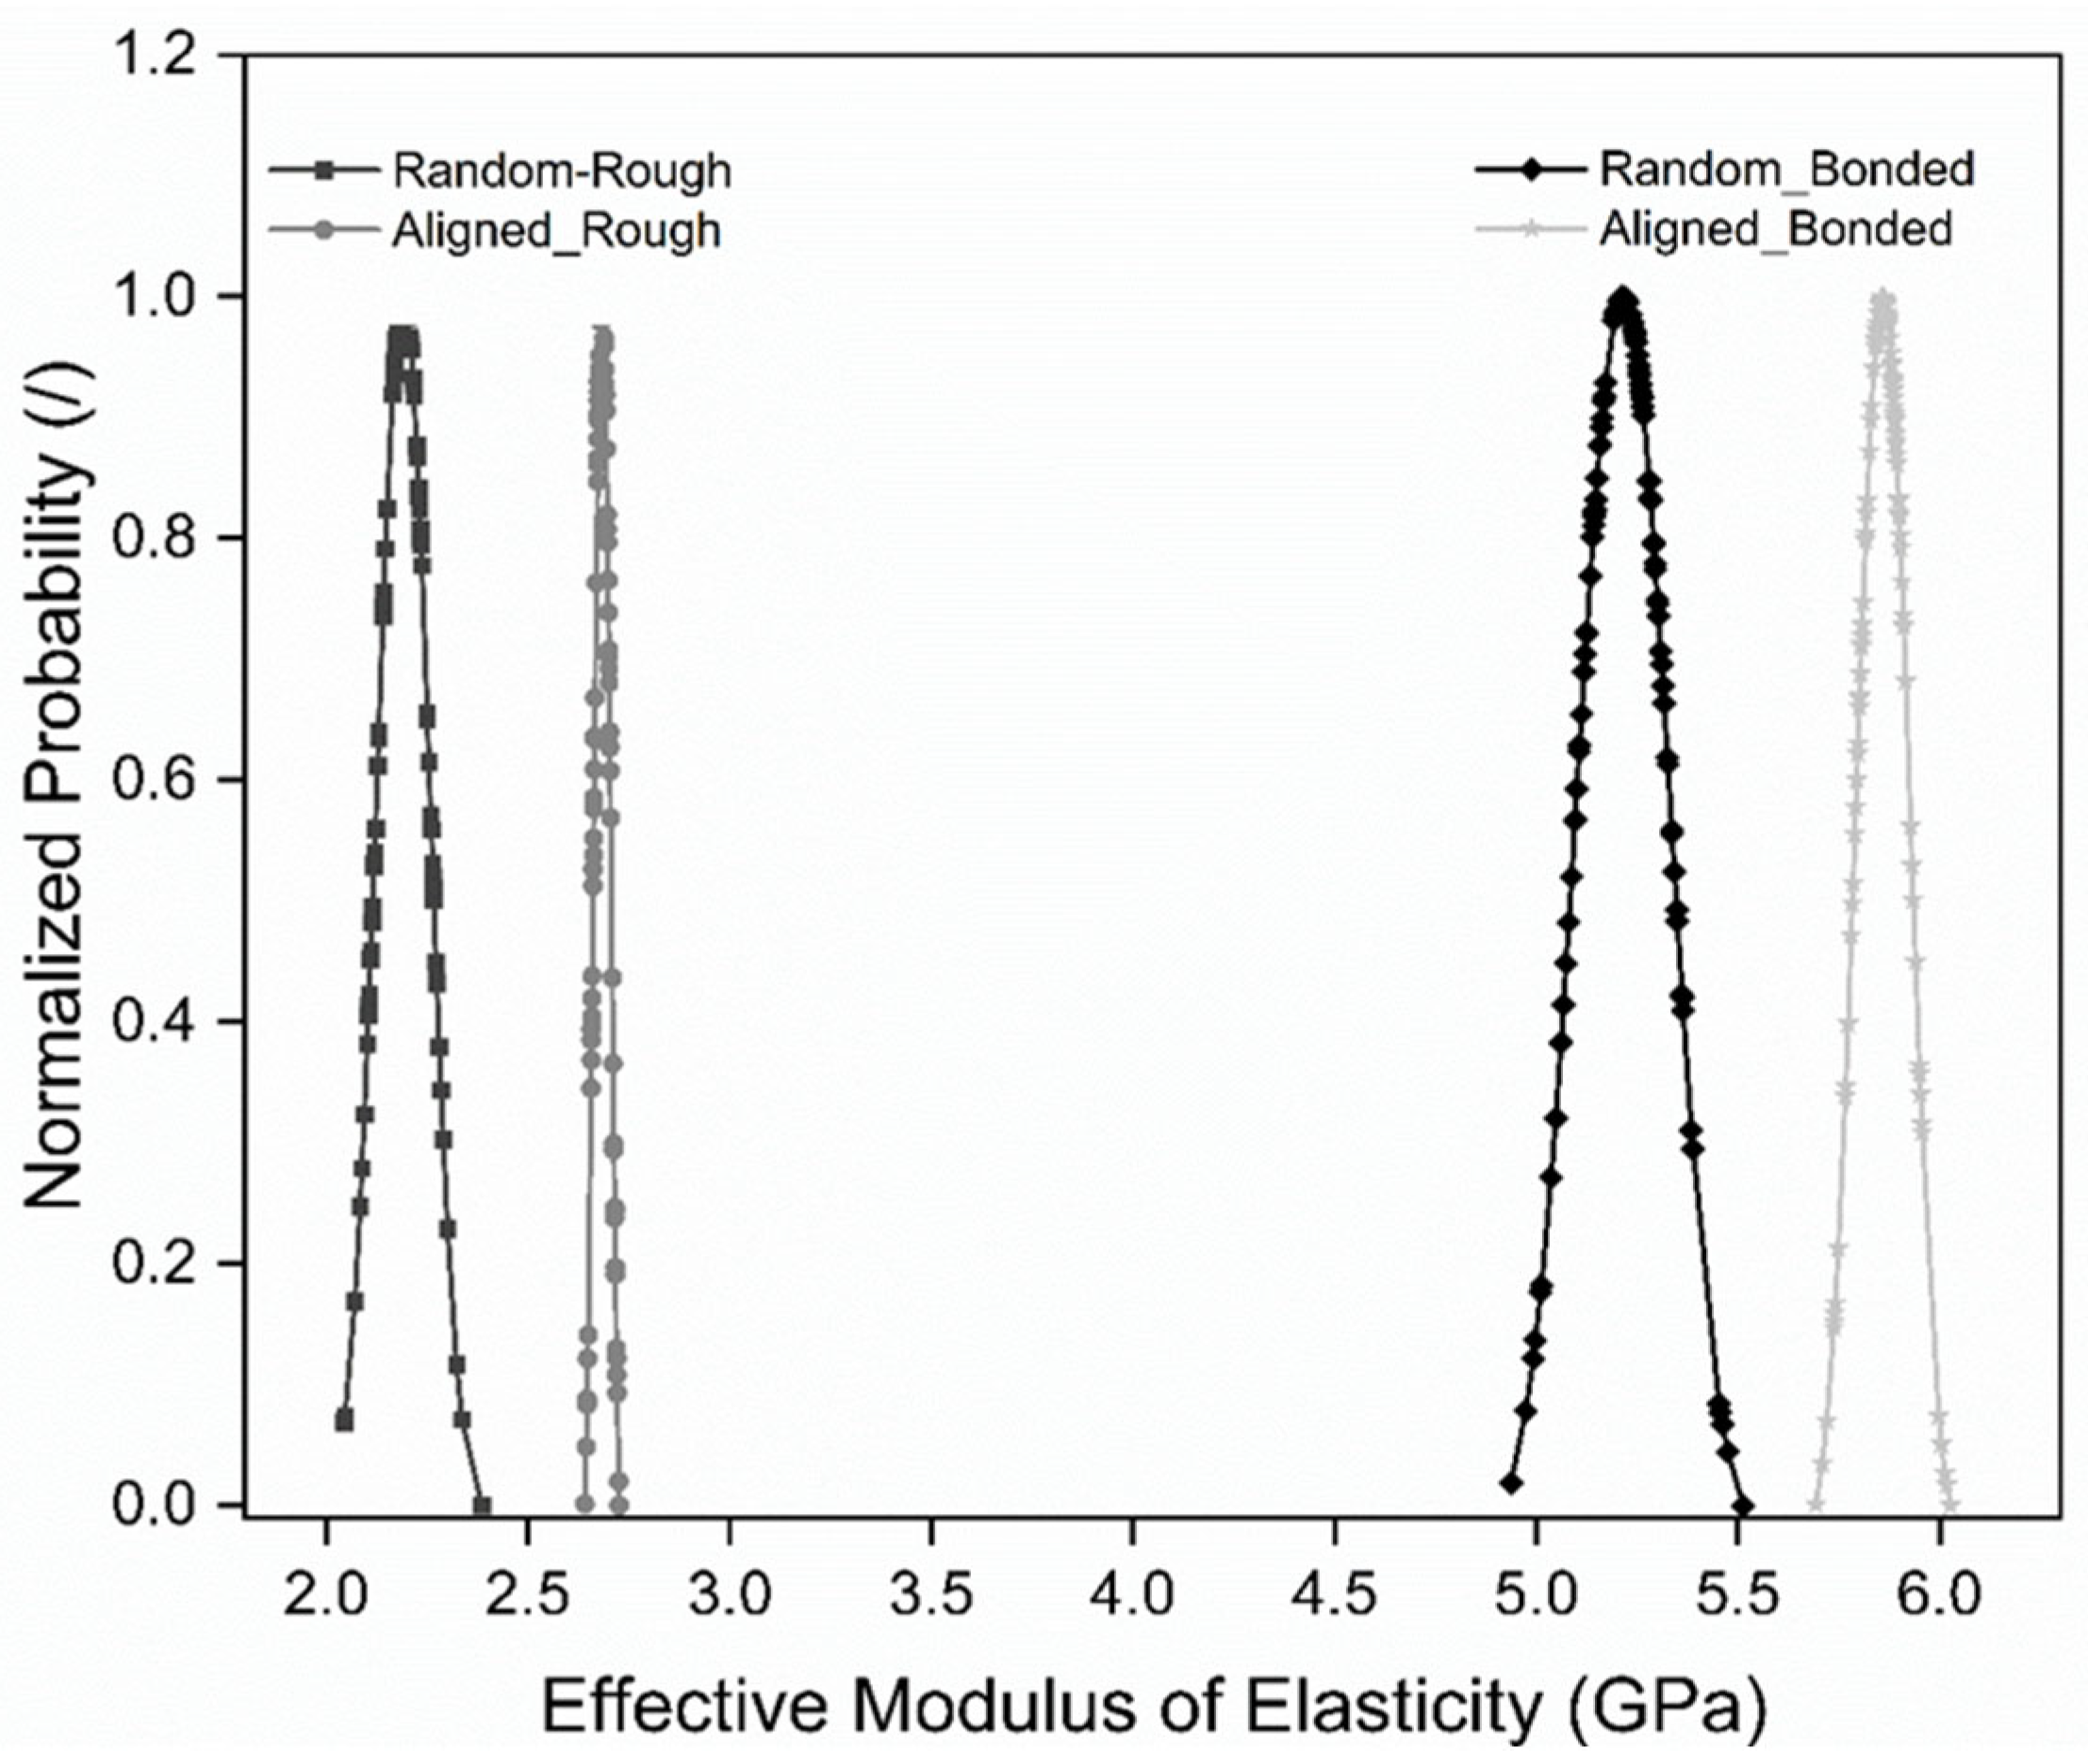
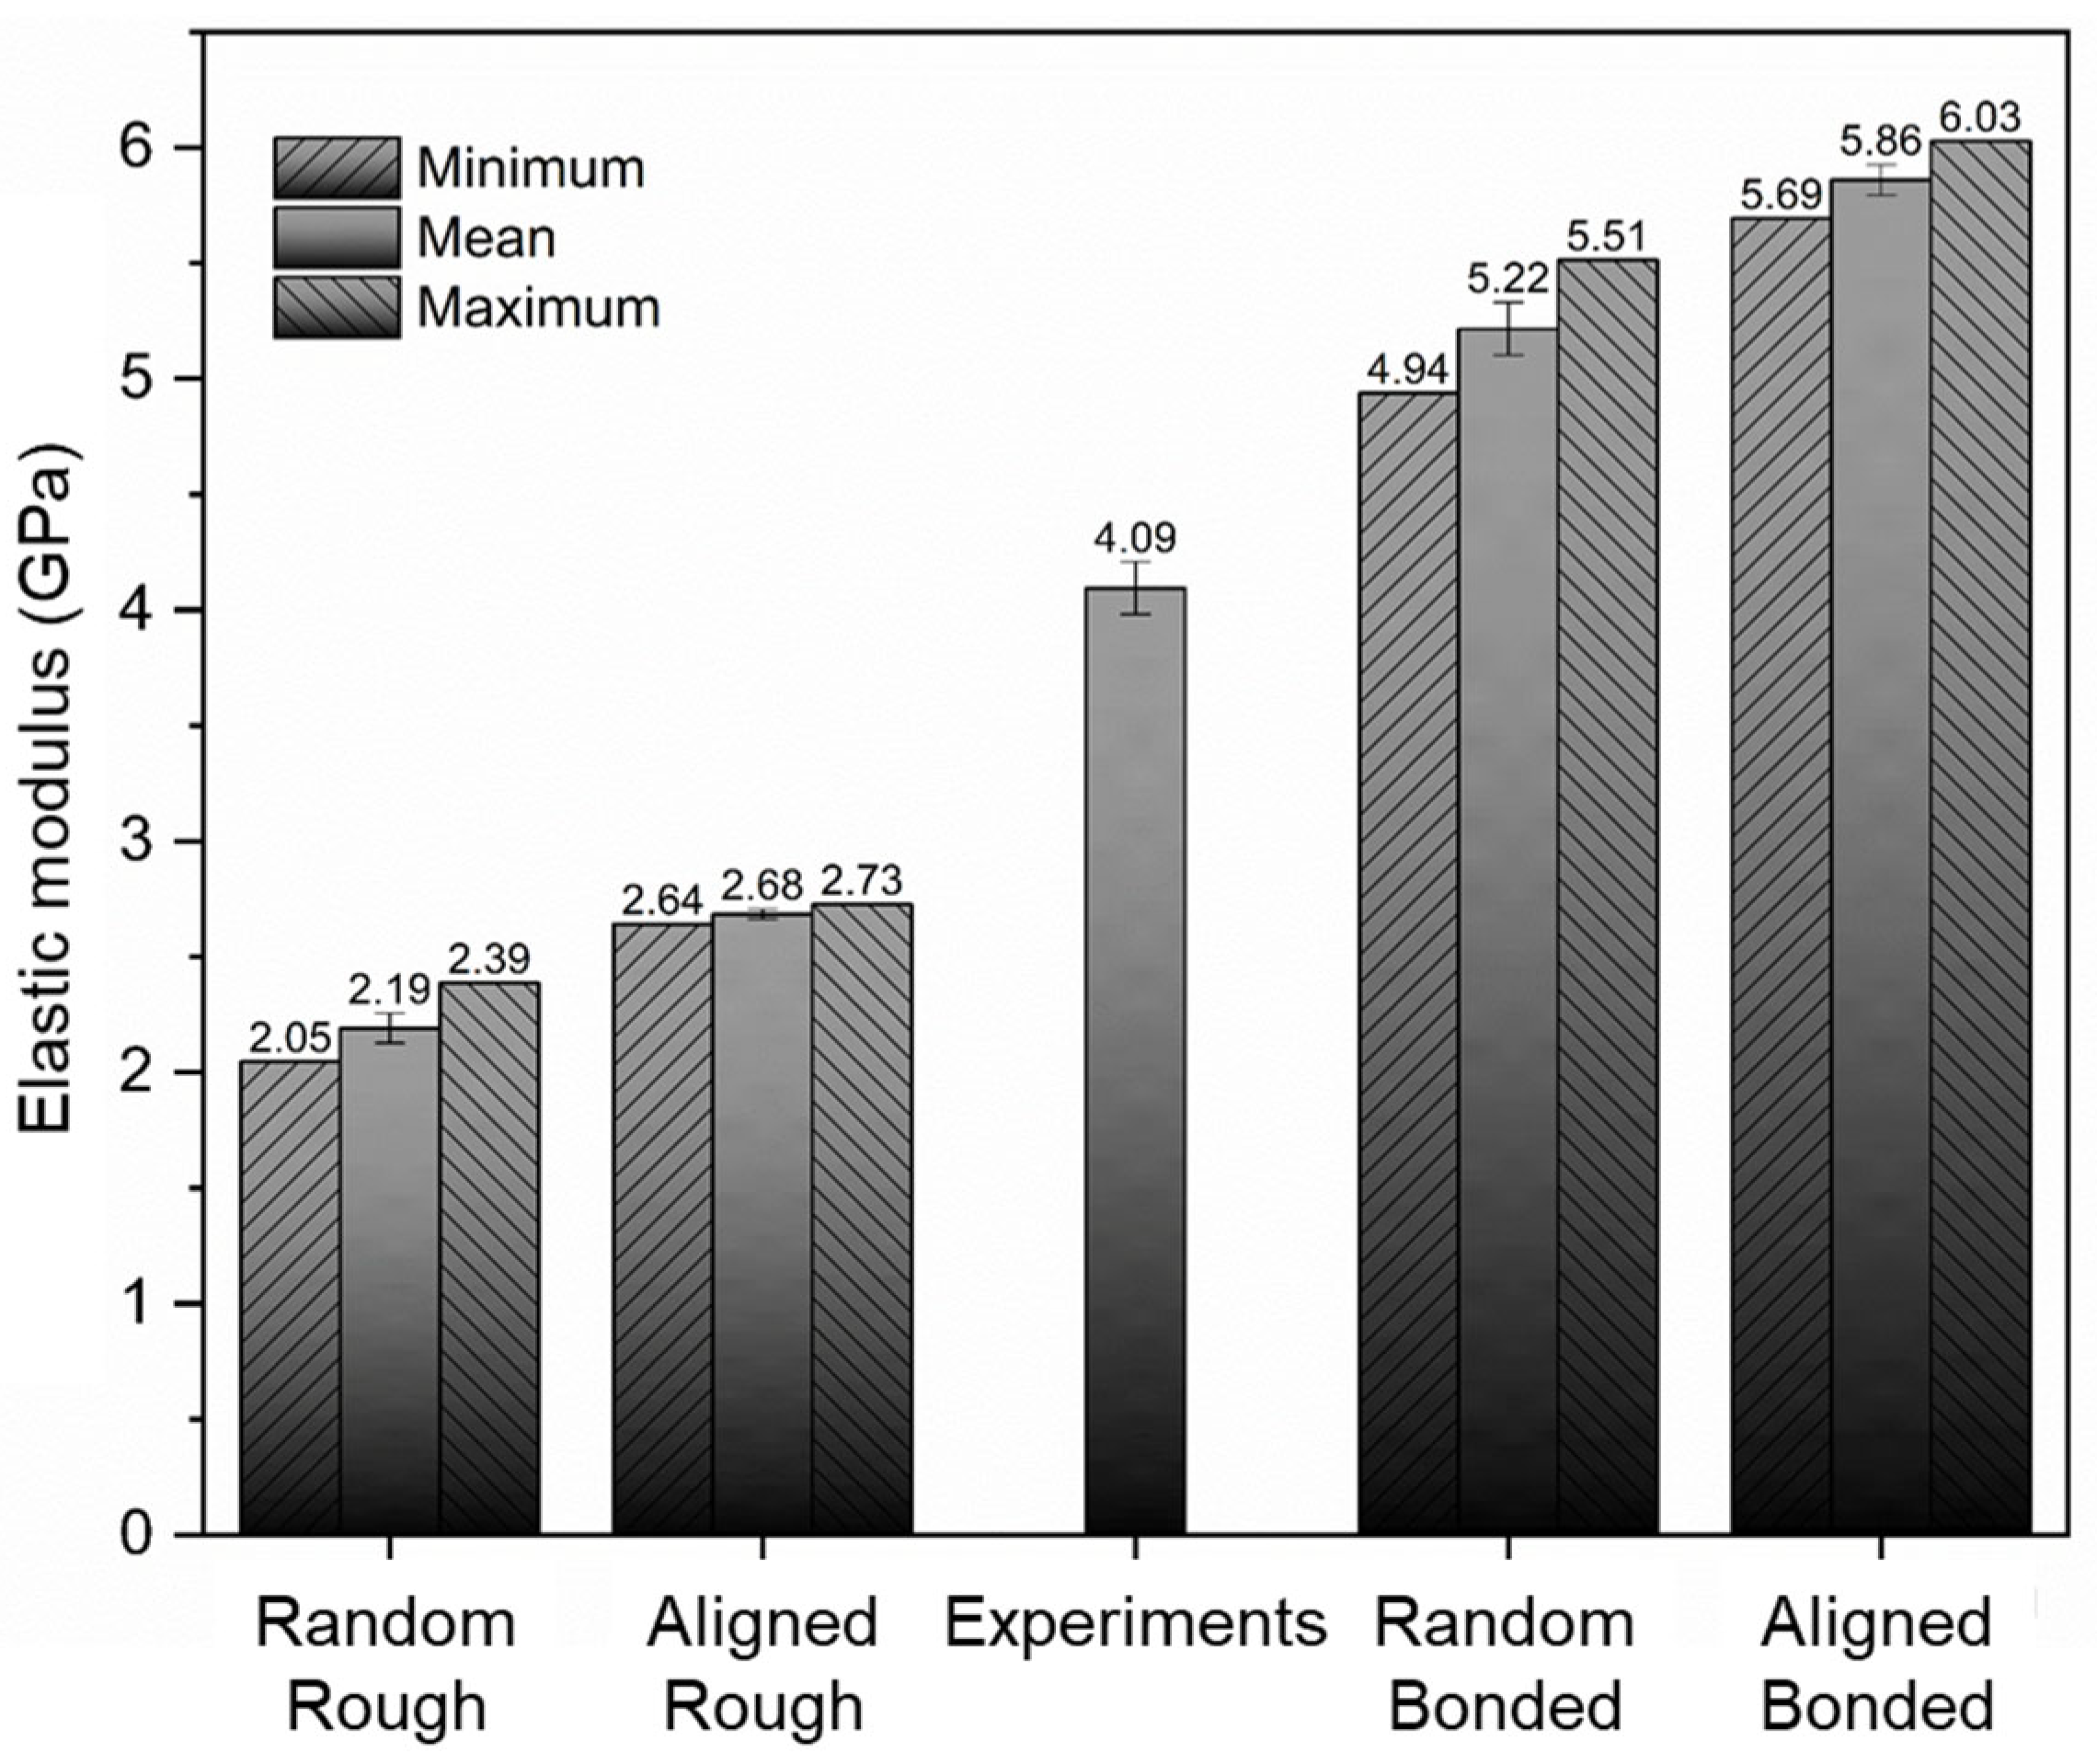
3.3. Numerical Modeling and Comparison with Experimental Results
4. Conclusions
Author Contributions
Funding
Data Availability Statement
Acknowledgments
Conflicts of Interest
References
- Hsissou, R.; Seghiri, R.; Benzekri, Z.; Hilali, M.; Rafik, M.; Elharfi, A. Polymer composite materials: A comprehensive review. Compos. Struct. 2021, 262, 113640. [Google Scholar] [CrossRef]
- Zare, E.N.; Agarwal, T.; Zarepour, A.; Pinelli, F.; Zarrabi, A.; Rossi, F.; Ashrafizadeh, M.; Maleki, A.; Shahbazi, M.A.; Maiti, T.K.; et al. Electroconductive multi-functional polypyrrole composites for biomedical applications. Appl. Mater. Today 2021, 24, 101117. [Google Scholar] [CrossRef]
- Osman, A.; Elhakeem, A.; Kaytbay, S.; Ahmed, A. A comprehensive review on the thermal, electrical, and mechanical properties of graphene-based multi-functional epoxy composites. Adv. Compos. Hybrid Mater. 2022, 5, 547–605. [Google Scholar] [CrossRef]
- Zhu, Z.Q.; Ng, K.; Howe, D. Design and analysis of high-speed brushless permanent magnet motors. In Proceedings of the Eighth International Conference on Electrical Machines and Drives, Cambridge, UK, 1–3 September 1997. [Google Scholar] [CrossRef]
- Su, J.; Xu, W.; Zhang, Y.; Liu, Y. Design and analysis of high-speed permanent magnet machine with low rotor loss for flywheel energy storage system. In Proceedings of the 23rd International Conference on Electrical Machines and Systems (ICEMS), Hamamatsu, Japan, 24–27 November 2020. [Google Scholar] [CrossRef]
- Sung, T.H.; Han, S.C.; Han, Y.H.; Lee, J.S.; Jeong, N.H.; Hwang, S.D.; Choi, S.K. Designs and analyses of flywheel energy storage systems using high-Tc superconductor bearings. Cryogenics 2002, 42, 357–362. [Google Scholar] [CrossRef]
- Rahman, M.M.; Gemechu, E.; Oni, A.O.; Kumar, A. Energy and environmental footprints of flywheels for utility-scale energy storage applications. e-Prime-Adv. Electr. Eng. Electron. Energy 2021, 1, 100020. [Google Scholar] [CrossRef]
- Wang, W.; Hofmann, H.; Bakis, C.E. Ultrahigh speed permanent magnet motor/generator for aerospace flywheel energy storage applications. In Proceedings of the IEEE International Conference on Electric Machines and Drives, San Antonio, TX, USA, 15 May 2005. [Google Scholar] [CrossRef]
- Ehrmann, G.; Blachowicz, T.; Ehrmann, A. Magnetic 3D-Printed Composites—Production and Applications. Polymers 2022, 14, 3895. [Google Scholar] [CrossRef]
- Iacovacci, V.; Lucarini, G.; Innocenti, C.; Comisso, N.; Dario, P.; Ricotti, L.; Menciassi, A. Polydimethylsiloxane films doped with NdFeB powder: Magnetic characterization and potential applications in biomedical engineering and microrobotics. Biomed. Microdevices 2015, 17, 112. [Google Scholar] [CrossRef]
- Li, L.; Tirado, A.; Nlebedim, I.C.; Rios, O.; Post, B.; Kunc, V.; Lowden, R.R.; Lara-Curzio, E.; Fredette, R.; Ormerod, J.; et al. Big area additive manufacturing of high performance bonded NdFeB magnets. Sci. Rep. 2016, 6, 36212. [Google Scholar] [CrossRef]
- Paranthaman, M.P.; Yildirim, V.; Lamichhane, T.N.; Begley, B.A.; Post, B.K.; Hassen, A.A.; Sales, B.C.; Gandha, K.; Nlebedim, I.C. Additive manufacturing of isotropic NdFeB PPS bonded permanent magnets. Materials 2020, 13, 3319. [Google Scholar] [CrossRef]
- Gandha, K.; Li, L.; Nlebedim, I.C.; Post, B.K.; Kunc, V.; Sales, B.C.; Bell, J.; Paranthaman, M.P. Additive manufacturing of anisotropic hybrid NdFeB-SmFeN nylon composite bonded magnets. J. Magn. Magn. Mater. 2018, 467, 8–13. [Google Scholar] [CrossRef]
- Pigliaru, L.; Rinaldi, M.; Ciccacci, L.; Norman, A.; Rohr, T.; Ghidini, T.; Nanni, F. 3D printing of high performance polymer-bonded PEEK-NdFeB magnetic composite materials. Funct. Compos. Mater. 2020, 1, 4. [Google Scholar] [CrossRef]
- Nagarajan, B.; Kamkar, M.; Schoen, M.A.; Sundararaj, U.; Trudel, S.; Qureshi, A.J.; Mertiny, P. Development and characterization of stable polymer formulations for manufacturing magnetic composites. J. Manuf. Mater. Process. 2020, 4, 4. [Google Scholar] [CrossRef]
- Palmero, E.M.; Casaleiz, D.; Jiménez, N.A.; Rial, J.; de Vicente, J.; Nieto, A.; Altimira, R.; Bollero, A. Magnetic-polymer composites for bonding and 3D printing of permanent magnets. IEEE Trans. Magn. 2018, 55, 1–4. [Google Scholar] [CrossRef]
- Nagarajan, B.; Wang, Y.; Taheri, M.; Trudel, S.; Bryant, S.; Qureshi, A.J.; Mertiny, P. Development and Characterization of Field Structured Magnetic Composites. Polymers 2021, 13, 2843. [Google Scholar] [CrossRef]
- Mungale, K.; Lamichhane, T.N.; Wang, H.; Sales, B.C.; Paranthaman, M.P.; Vaidya, U.K. Compression molding of anisotropic NdFeB bonded magnets in a polycarbonate matrix. Materialia 2021, 19, 101167. [Google Scholar] [CrossRef]
- Moghaddam, H.A.; Mertiny, P. Stochastic finite element analysis framework for modelling mechanical properties of particulate modified polymer composites. Materials 2019, 12, 2777. [Google Scholar] [CrossRef]
- Moghaddam, H.A.; Mertiny, P. Stochastic finite element analysis framework for modelling thermal conductivity of particulate modified polymer composites. Results Phys. 2018, 11, 905–914. [Google Scholar] [CrossRef]
- Moghaddam, H.A.; Mertiny, P. Stochastic Finite Element Analysis Framework for Modelling Electrical Properties of Particle-Modified Polymer Composites. Nanomaterials 2020, 10, 1754. [Google Scholar] [CrossRef]
- ASTM D638-14; Standard Test Method for Tensile Properties of Plastics. American Society for Testing and Materials. ASTM: West Conshohocken, PA, USA, 2010.
- Jiang, Y.; Fujita, T.; Uehara, M.; Zhang, D.; Cai, J.; Higuchi, K.; Maenaka, K. Characterization of mechanical properties of cantilevered Nd2Fe14B/Ta magnetic microstructures. Appl. Phys. Express 2011, 4, 128–131. [Google Scholar] [CrossRef]
- Drak, M.; Dobrzański, L.A. Hard magnetic materials Nd-Fe-B/Fe with epoxy resin matrix. J. Achiev. Mater. Manuf. Eng. 2007, 24, 63–66. [Google Scholar]
- Garrell, M.G.; Shih, A.J.; Ma, B.M.; Lara-Curzio, E.; Scattergood, R.O. Mechanical properties of Nylon bonded Nd–Fe–B permanent magnets. J. Magn. Magn. Mater. 2003, 257, 32–43. [Google Scholar] [CrossRef]
- Zhang, X.H.; Xiong, W.H.; Li, Y.F.; Song, N. Effect of process on the magnetic and mechanical properties of Nd–Fe–B bonded magnets. Mater. Des. 2009, 30, 1386–1390. [Google Scholar] [CrossRef]
- Grujić, A.; Talijan, N.; Stojanović, D.; Stajić-Trošić, J.; Burzić, Z.; Balanović, L.; Aleksić, R. Mechanical and magnetic properties of composite materials with polymer matrix. J. Min. Metall. B 2010, 46, 25–32. [Google Scholar] [CrossRef]


| Material | MQP-15-7 | EPON 826 | EPICURE W | AEROSIL R202 |
|---|---|---|---|---|
| Density (g/cm3) | 7.61 | 1.16 | 1.20 | 0.60 |
| Mass fraction (%) | 47.51 | 40.70 | 10.74 | 1.05 |
| Property | Magnetic Particles | Matrix L-2wt% |
|---|---|---|
| Modulus of elasticity (GPa) | 160 [23] | 2.99 ± 0.20 |
| Particle thickness (μm) | 22, 24, 26, 28 | / |
| Particle diameter (μm) | 122.2 to 135.0 | / |
| Property | Particle Equivalent Disk Diameter | Particle Thickness |
|---|---|---|
| Average (μm) | 128.6 | 26.2 |
| Standard deviation (μm) | 30.3 | 6.06 |
| Median (μm) | 120.4 | 26.0 |
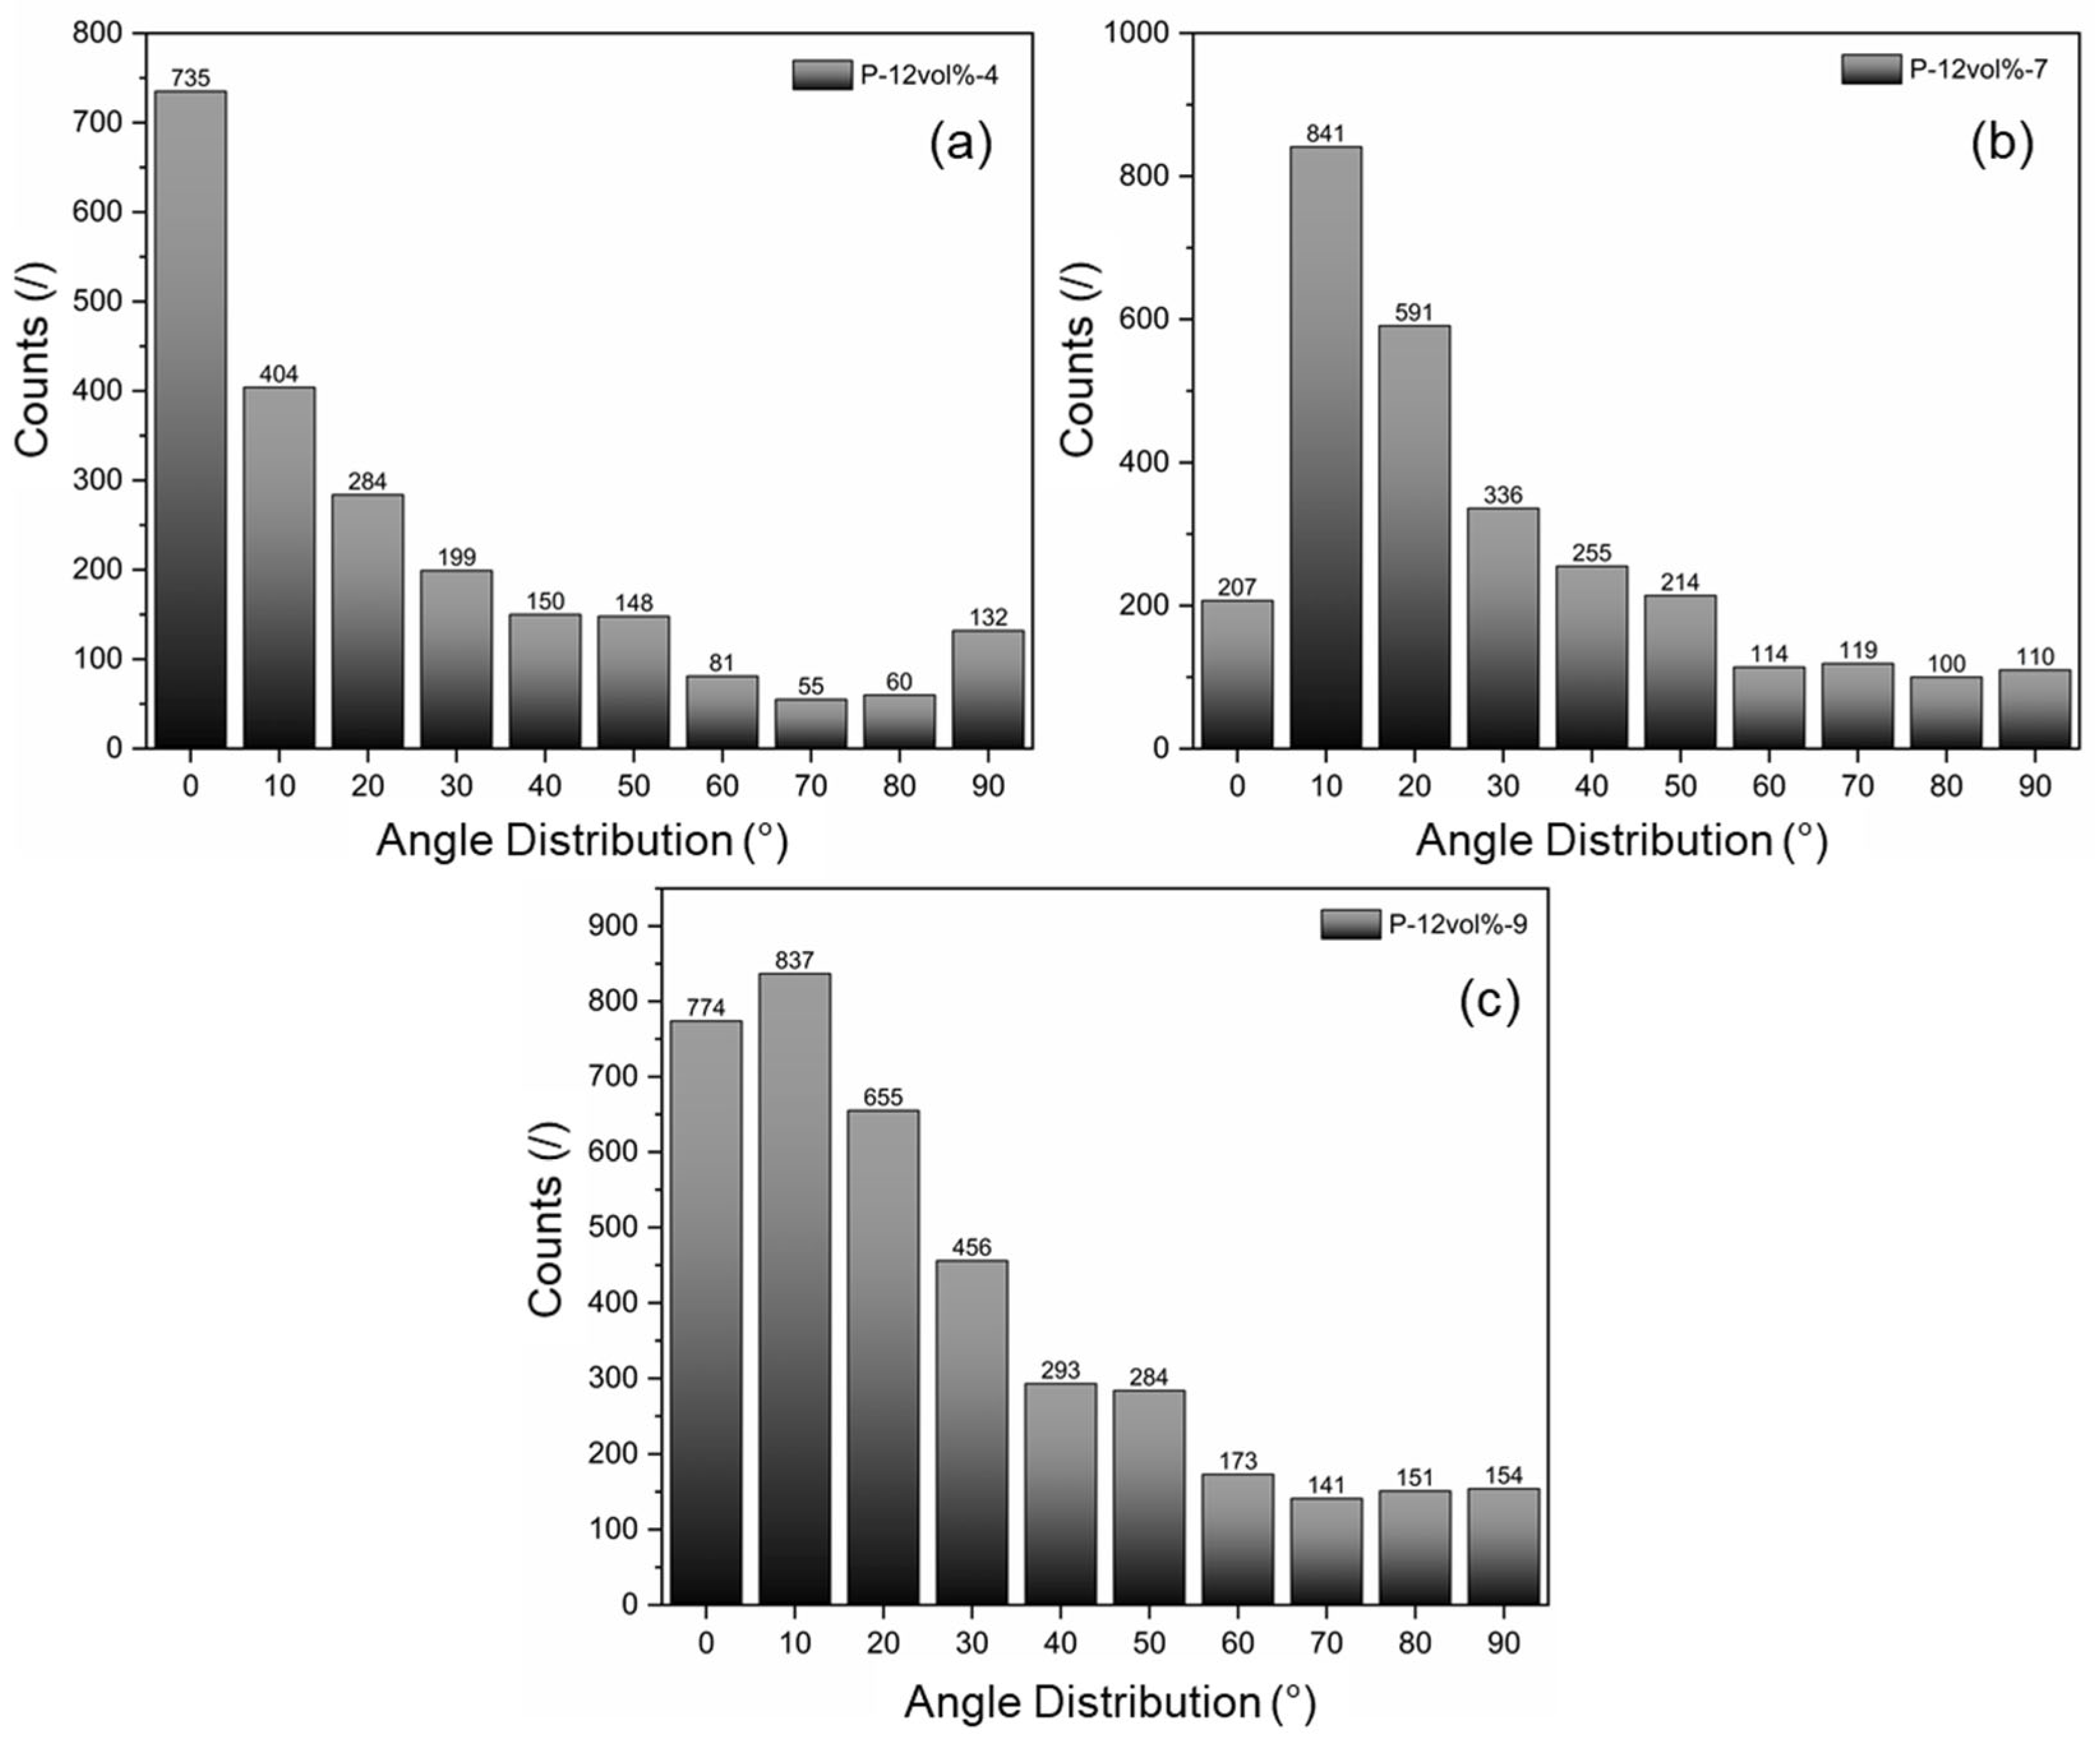
| Sample ID | Number of Particles in 0°–20° Direction | Total Number of Particles | Fraction of Particles in 0°–20° Direction |
|---|---|---|---|
| P-12vol%-4 | 1423 | 2248 | 63.3% |
| P-12vol%-7 | 1639 | 2887 | 56.8% |
| P-12vol%-9 | 2266 | 3918 | 57.8% |
| Fully Random, Rough | Aligned, Rough | Fully Random, Bonded | Aligned, Bonded | |
|---|---|---|---|---|
| Kurtosis | −0.00956 | −0.73455 | −0.09347 | 0.2888 |
| Skewness | 0.13371 | 0.07723 | 0.05985 | 0.07994 |
Disclaimer/Publisher’s Note: The statements, opinions and data contained in all publications are solely those of the individual author(s) and contributor(s) and not of MDPI and/or the editor(s). MDPI and/or the editor(s) disclaim responsibility for any injury to people or property resulting from any ideas, methods, instructions or products referred to in the content. |
© 2023 by the authors. Licensee MDPI, Basel, Switzerland. This article is an open access article distributed under the terms and conditions of the Creative Commons Attribution (CC BY) license (https://creativecommons.org/licenses/by/4.0/).
Share and Cite
Wang, Y.; Ahmadi Moghaddam, H.; Palacios Moreno, J.; Mertiny, P. Magnetic Filler Polymer Composites—Morphology Characterization and Experimental and Stochastic Finite Element Analyses of Mechanical Properties. Polymers 2023, 15, 2897. https://doi.org/10.3390/polym15132897
Wang Y, Ahmadi Moghaddam H, Palacios Moreno J, Mertiny P. Magnetic Filler Polymer Composites—Morphology Characterization and Experimental and Stochastic Finite Element Analyses of Mechanical Properties. Polymers. 2023; 15(13):2897. https://doi.org/10.3390/polym15132897
Chicago/Turabian StyleWang, Yingnan, Hamidreza Ahmadi Moghaddam, Jorge Palacios Moreno, and Pierre Mertiny. 2023. "Magnetic Filler Polymer Composites—Morphology Characterization and Experimental and Stochastic Finite Element Analyses of Mechanical Properties" Polymers 15, no. 13: 2897. https://doi.org/10.3390/polym15132897
APA StyleWang, Y., Ahmadi Moghaddam, H., Palacios Moreno, J., & Mertiny, P. (2023). Magnetic Filler Polymer Composites—Morphology Characterization and Experimental and Stochastic Finite Element Analyses of Mechanical Properties. Polymers, 15(13), 2897. https://doi.org/10.3390/polym15132897