Article

Hydrogenation of High-Density Polyethylene during Decompression of Pressurized Hydrogen at 90 MPa: A Molecular Perspective

1
Grad. School of Chemical Engineering, Chosun University, Chosundae-5-gil, Dong-gu, Gwangju 61452, Republic of Korea
2
Department of Biochemical Engineering, Chosun University, Chosundae-5-gil, Dong-gu, Gwangju 61452, Republic of Korea
*
Author to whom correspondence should be addressed.
Polymers 2023, 15(13), 2880; https://doi.org/10.3390/polym15132880
Submission received: 2 June 2023 / Revised: 26 June 2023 / Accepted: 27 June 2023 / Published: 29 June 2023
(This article belongs to the Section Polymer Analysis and Characterization)

Abstract

:
To investigate changes in the physical and chemical properties of high-density polyethylene (HDPE) upon the rapid release of hydrogen gas at a pressure of 90 MPa, several characterization techniques have been employed, including optical microscopy, scanning electron microscopy, X-ray diffraction, differential scanning thermal analysis, and attenuated total reflectance Fourier-transform infrared spectroscopy. The results showed that both physical and chemical changes occurred in HDPE upon a rapid release of hydrogen gas. Physically, a partial hexagonal phase was formed within the amorphous region, and the overall crystallinity of HDPE decreased. Chemically, hydrogenation occurred, leading to the addition of hydrogen atoms to the polymer chains. Oxidation also occurred, for example, the formation of ester -C=O groups. Crosslinking and an increase in -CH3 end termination were also observed. These changes suggest that structural transformation and chemical modification of HDPE occurred upon the rapid release of hydrogen gas.

1. Introduction

Global warming, caused by the accumulation of greenhouse gases, is the most pressing problem facing mankind in the 21st century. Therefore, efforts to reduce greenhouse gas emissions are underway globally. CO2, which has become synonymous with greenhouse gases, has increased rapidly since the industrial revolution, with the advent of hydrocarbon-based internal combustion engines. Among the various approaches for reducing CO2 emissions, converting a hydrocarbon-based internal combustion engine into an electric vehicle (EV) or a fuel-cell electric vehicle (FCEV) is the most direct method. In a hydrogen fuel-cell vehicle, hydrogen must be stored in a gaseous state in a hydrogen pressure vessel capable of withstanding a pressure of 70 MPa owing to its high energy density. It uses a Type 4 tank padded with a high-density polyethylene (HDPE) liner because HDPE is lightweight and flexible and has excellent resistance to chemicals; furthermore, it can withstand high pressures and temperatures [1,2,3,4,5,6,7]. Here, the carbon fiber exterior does not come into direct contact with hydrogen and must maintain the mechanical strength required at a hydrogen pressure of 70 MPa. The HDPE liner is in direct contact with hydrogen, and thus should play a role in preventing the leakage of hydrogen owing to the pressure difference between the inside and outside of the hydrogen pressure vessel. Because hydrogen penetrates HDPE during hydrogen charging and is released again during hydrogen discharge, mechanical, physical, and chemical deteriorations may occur in HDPE owing to dissolved hydrogen.
According to previous studies available in the literature, polymeric materials have been observed to undergo morphological deformation during the cyclic processes of high-pressure hydrogen gas charging and discharging [7,8,9]. Initially, hydrogen blistering occurs in the form of a single spherical bubble, which further develops into multiple bubbles. Some of these bubbles return to their original morphology without any cavitation structure, whereas others ultimately form a permanent cavitation structure [7,8,9,10]. Furthermore, the rupture of the main chain has been evidenced with the introduction of a fluorescent moiety at specific crosslinking sites between the nearest neighboring chains. In the case of HDPE, the initiation and development of blisters as well as the formation of the final cavitation structure have been extensively investigated using digital cameras. However, there is still a dearth of studies examining the potential differences between HDPE with and without cavitation structures [11,12,13]. Therefore, it is necessary to gain a comprehensive understanding of HDPE at the molecular level, considering both the presence and absence of void structures.
This study aimed to investigate the physical and chemical potential differences between HDPE with and without void structures after a rapid release of hydrogen gas at 90 MPa. The properties of neat HDPE before the hydrogen treatment were compared with those of HDPE after the hydrogen treatment (henceforth referred to as H2-HDPE).

2. Materials and Methods

2.1. HDPE Preparation

The bead-type HDPE used in this experiment was commercially available (HDPE bead, LG Chem, Seoul, South Korea). The procured HDPE had a density of 0.955 g/cm3 and a melt flow index of 0.028 g/min.

2.2. Hydrogen Pressure Treatment

HDPE beads with diameter and thickness of 13 and 3 mm, respectively, were subjected to hydrogen gas at a pressure of 90 MPa for more than 90 min. Subsequently, the chamber valve was opened, leading to a rapid release of H2 within 60 s. The polymer infrastructure in hydrogen fuel-cell cars is typically used at 90 MPa in hydrogen refueling stations or 70 MPa in hydrogen pressure vessels. Therefore, in the first experiment, a maximum pressure of 90 MPa was selected.

2.3. Microscopy Analysis on Surface Morphology

The surface morphology was examined using three different microscopy techniques, namely optical microscopy (OM; ECLIPSE MA200, Nikon, Tokyo, Japan), polarized optical microscopy (POM; Jenalabpol, ZEISS, Jena, Germany), and scanning electron microscopy (SEM; S-4800, HITACHI, Japan).

2.4. X-ray Diffraction (XRD)

HDPE beads were used for XRD experiments. Each diffraction pattern was obtained within a 2θ range of 3 to 90°, using a Bragg–Brentano configuration (XPERT-PRO TT, Panalytical, Malvern, England) with Cu K-α radiation (λ = 1.5406 Å). The step size was set to 0.01° and each scan lasted 1 s.

2.5. Differential Scanning Calorimetry (DSC)

Differential scanning calorimetry (DSC) measurements were performed using Shimadzu equipment (DSC-60A, Shimadzu, Kyoto, Japan). Approximately 5 mg of each sample was enclosed in a standard aluminum pan and subjected to a temperature range of 30 to 300 °C, with a heating rate of 2 °C/min under a nitrogen gas atmosphere.

2.6. Fourier Transform Infrared Spectroscopy (FTIR)

Infrared spectroscopic analyses of both HDPE and H2-HDPE beads were conducted using a spectrometer (Thermo Fisher Scientific, Waltham, MA, USA). Knife-cut beads were scanned in the wavenumber range of 4000–400 cm−1 using the attenuated total reflection (ATR) mode. The analysis consisted of 32 scans, performed at a resolution of 4 cm−1.

3. Results and Discussion

Upon rapid decompression of the hydrogen pressure from 90 to 0.1 MPa, a noticeable change occurred in the appearance of every H2-HDPE bead. A white trajectory was left behind, with a colorless and transparent background, as depicted in Figure 1.
The position of the white trajectory within each H2-HDPE bead varied significantly. However, the trajectory typically originated from a relatively central region and extended towards the outer surface of the HDPE bead. For the experiments, the H2-HDPE sample was divided into three pieces, cut perpendicular to the longitudinal axis of the bead, as shown in Figure 1b. Piece #1 represents the portion that included the termination point of the white trajectory and it was used to examine the surface morphology at that specific location. Piece #2 was used for OM, wide-angle X-ray diffraction (WXRD), and attenuated total reflection Fourier-transform infrared (ATR-FTIR) spectroscopy. Piece #3 was designated for DSC analysis. This experimental arrangement is clearly illustrated in Figure 1b.

3.1. Microscopy of Surface Morphology

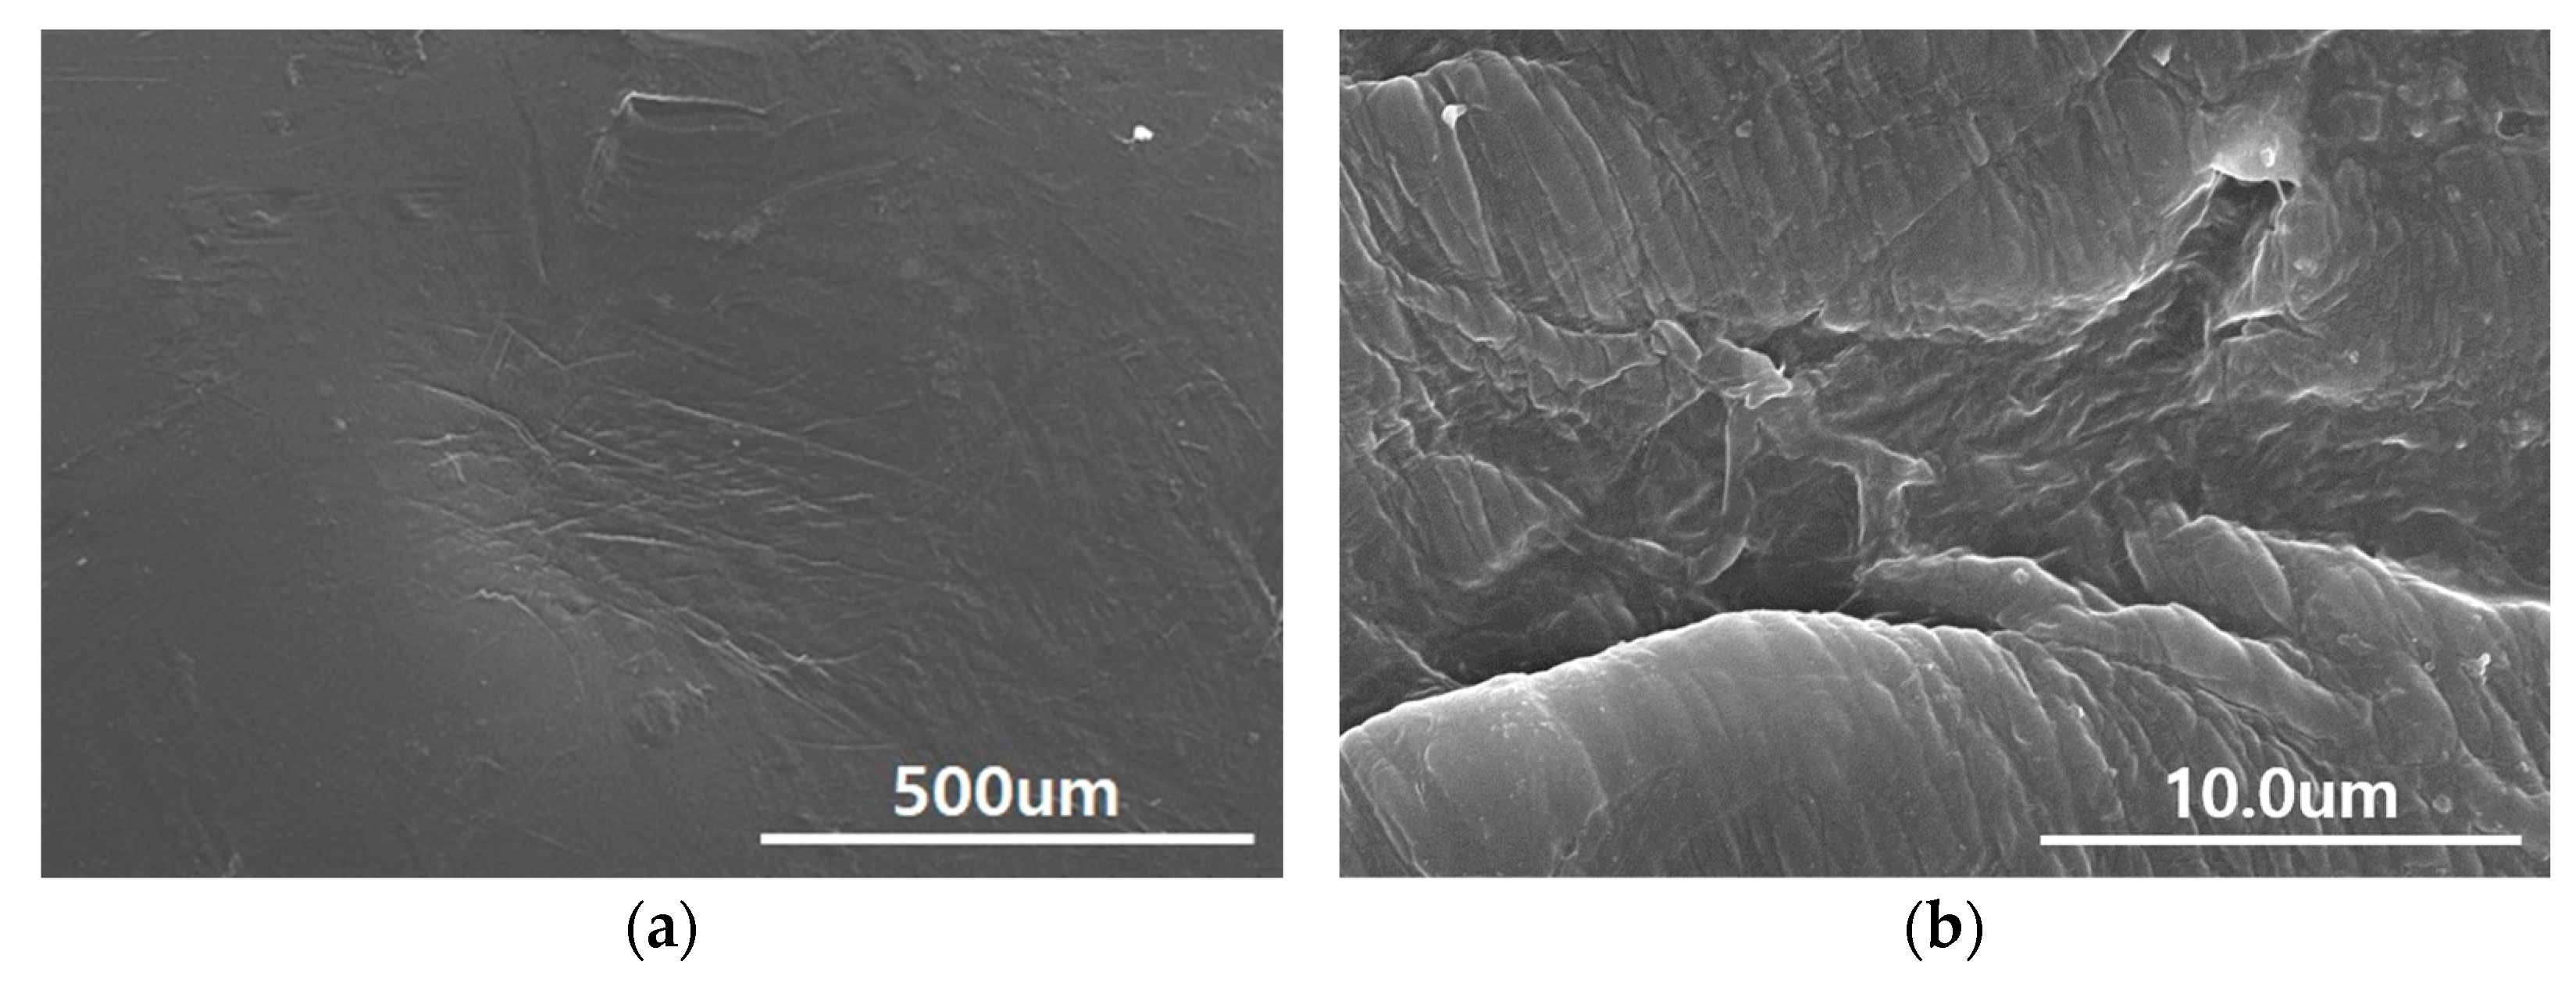
Initially, we selected Piece #1, which included the terminated surface of the white trajectory, and used OM to observe the surface morphology at the endpoint of the white trajectory. The surface morphology revealed weakly collapsed structures, indicating a pathway for the outburst of high-pressure hydrogen gas. SEM was performed for a more detailed analysis, and the results are shown in Figure 2. It is evident from Figure 2a that the entire fracture exhibited numerous tone-burst structures, indicating the occurrence of a polymer chain scission. A further magnification revealed that the orientation of the tone-burst structures was nearly parallel to the lamellar thickness, which, in turn, was aligned with the polymer chain direction, as shown in Figure 2b.
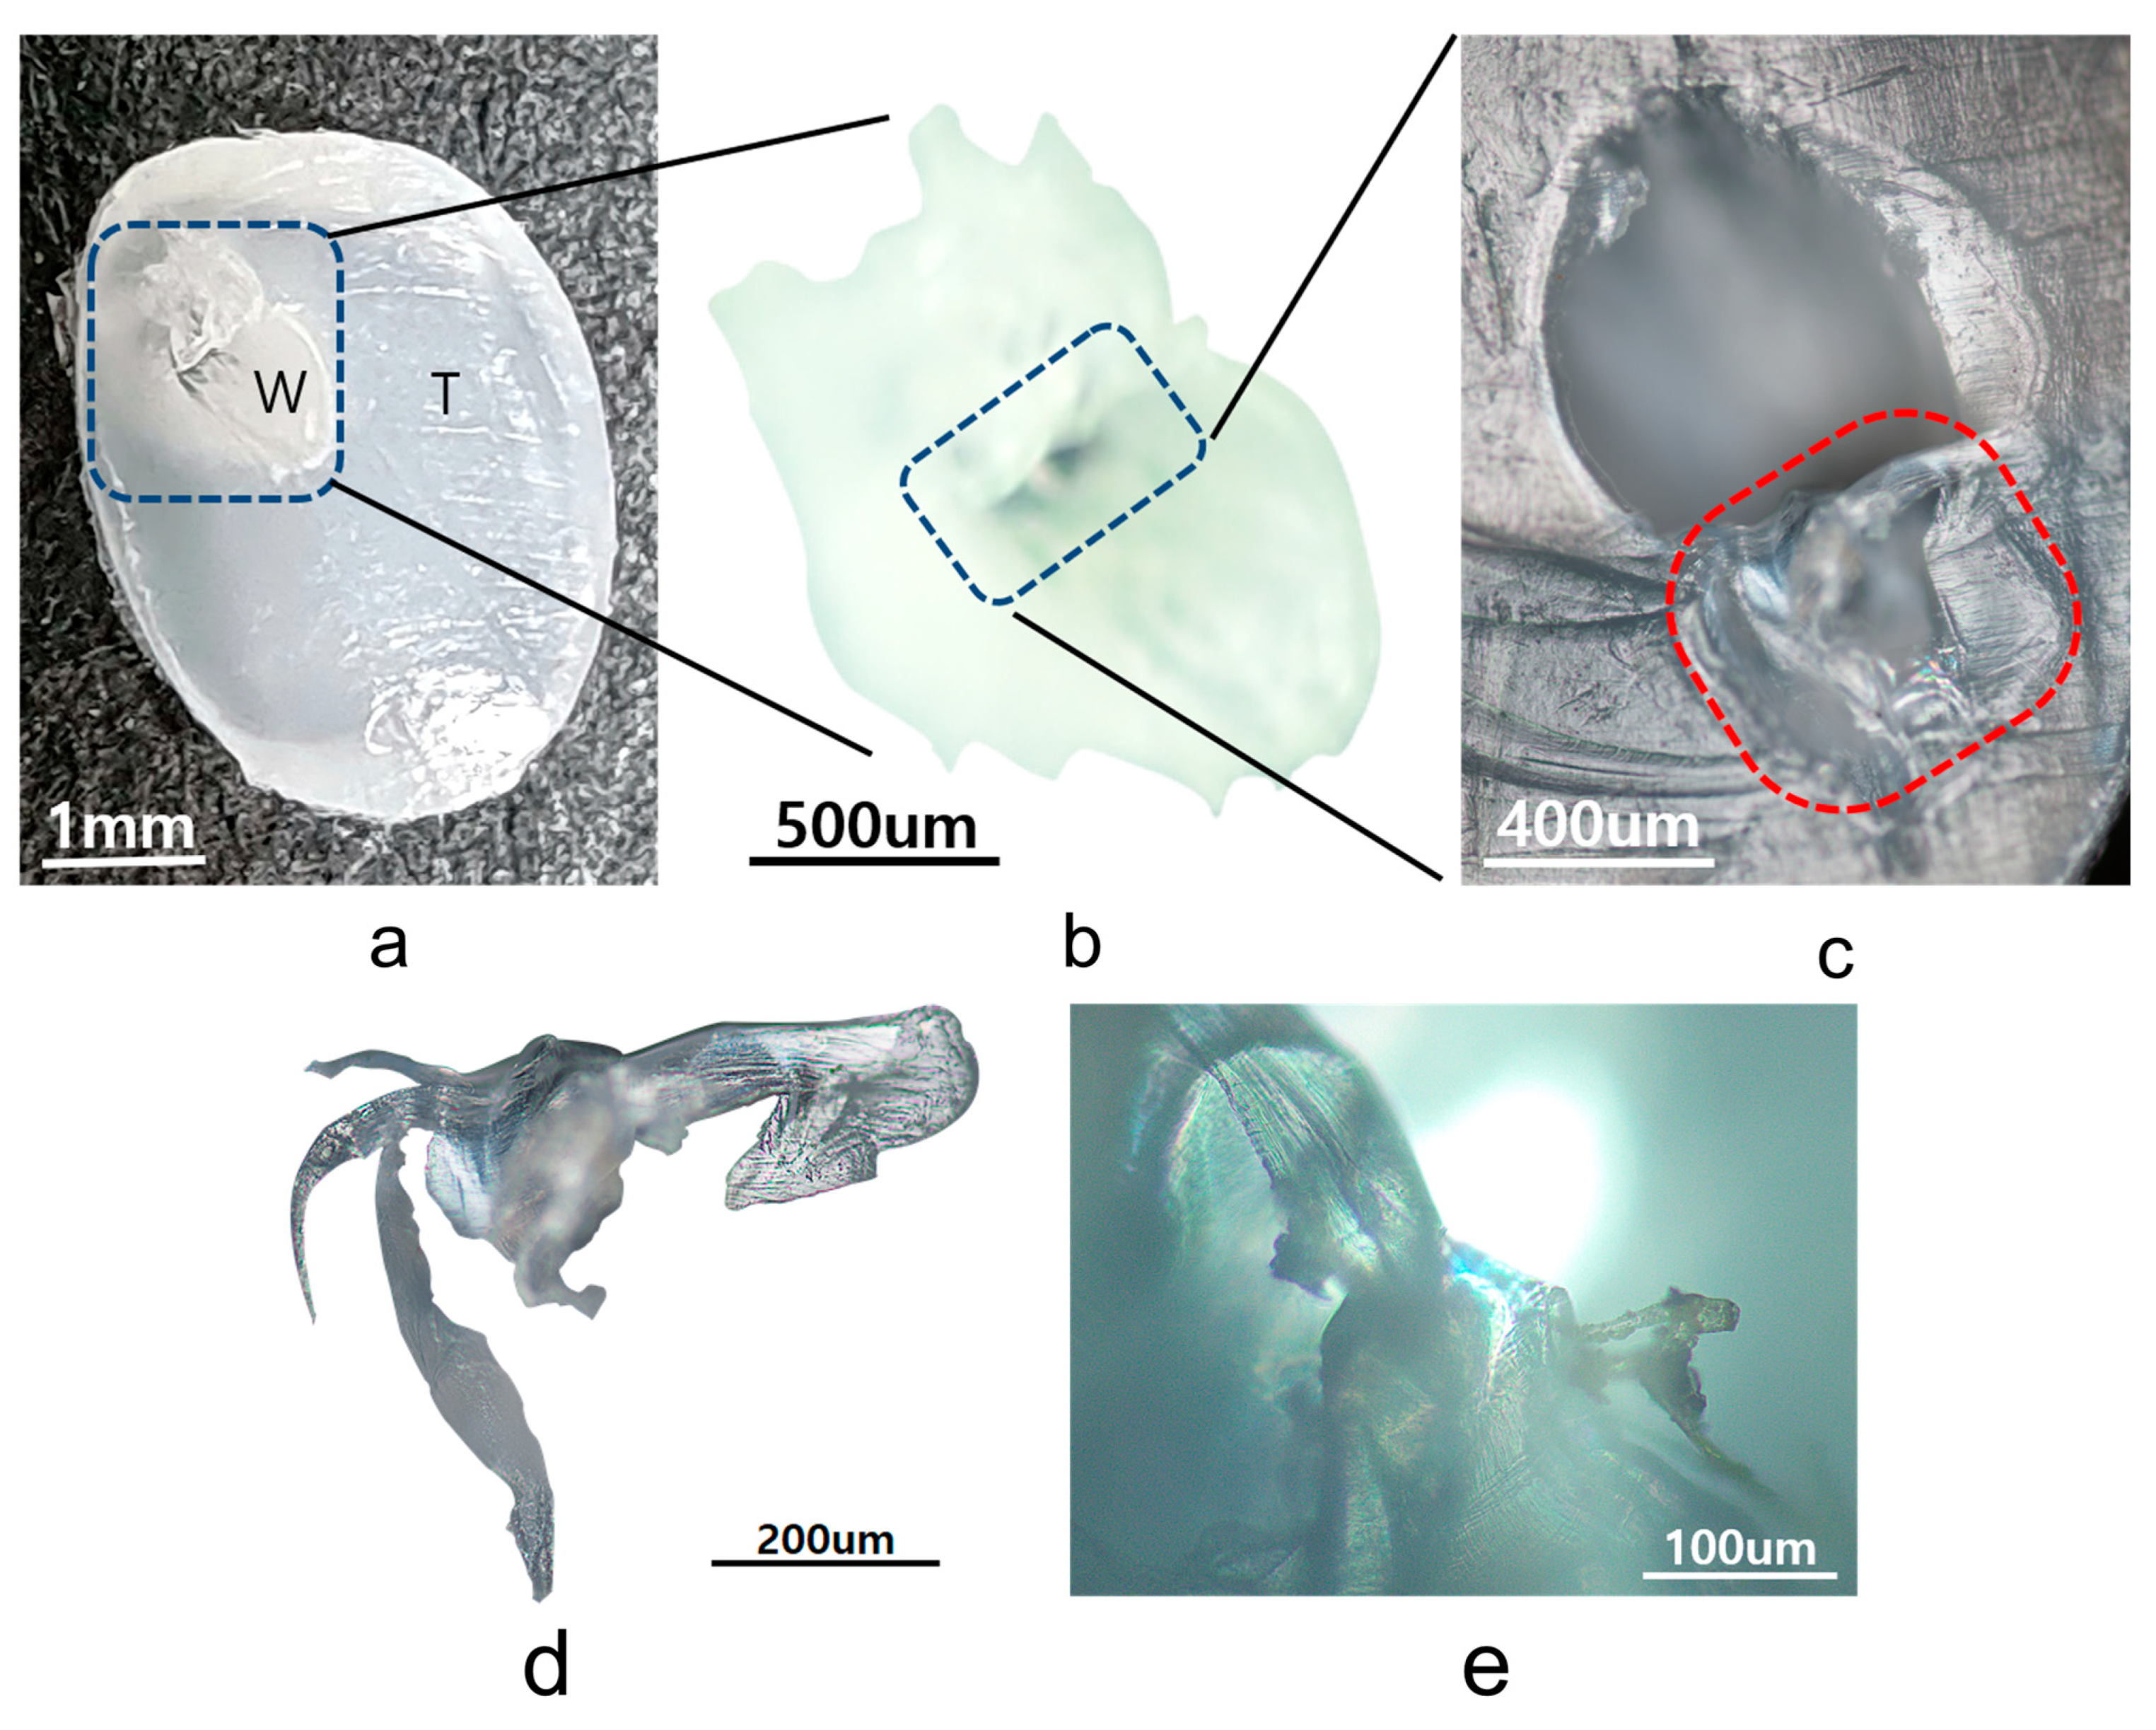
Figure 3a shows a digital camera image obtained from one cross-section of the central piece (Piece #2), which includes the evolution of the white trajectory. The white section in Figure 3b shows a cavity structure with two different spherical holes with radii of the order of μm formed in its inner space (henceforth referred to as H2-HDPE-W). In the outer part of the white cavity, which is henceforth referred to as H2-HDPE-T, the formation of channel structures during the release of the gas is evident, particularly noticeable in the lower-left corner of Figure 3c. Within the region indicated by the red line in Figure 3c, the polymer morphology exhibits a distinct semi-transparent arch-like bridge structure. This bridge structure is composed of a thin two-dimensional ribbon with embedded fibrils that maintain a consistent orientation. The bridge is surrounded by a transparent amorphous matrix [14,15]. This unique morphology extends to the left side of Figure 3c, where the bundles of fibers forming the ribbon structure are observed to be in a completely relaxed state and devoid of any elasticity. The presence of these structures indicates that the rapid decompression and subsequent gas release caused significant changes in the polymer morphology and a loss of elasticity. The formation of channels and an arch-like bridge structure suggest a complex rearrangement and deformation of the polymer during the gas release. Additionally, the splitting of the polymer morphology in the fully relaxed state into three branches, particularly in the lower-left corner, resembles the appearance of the polymer being torn apart owing to the rapid release of hydrogen pressure. This morphology indicates significant chain stretching and expansion of the polymer structure during the rapid decompression. The observed splitting and tearing suggest that the polymer experienced high mechanical stress and strain during the hydrogen release, thus leading to the deformation and rupture of the polymer chains.

3.2. XRD

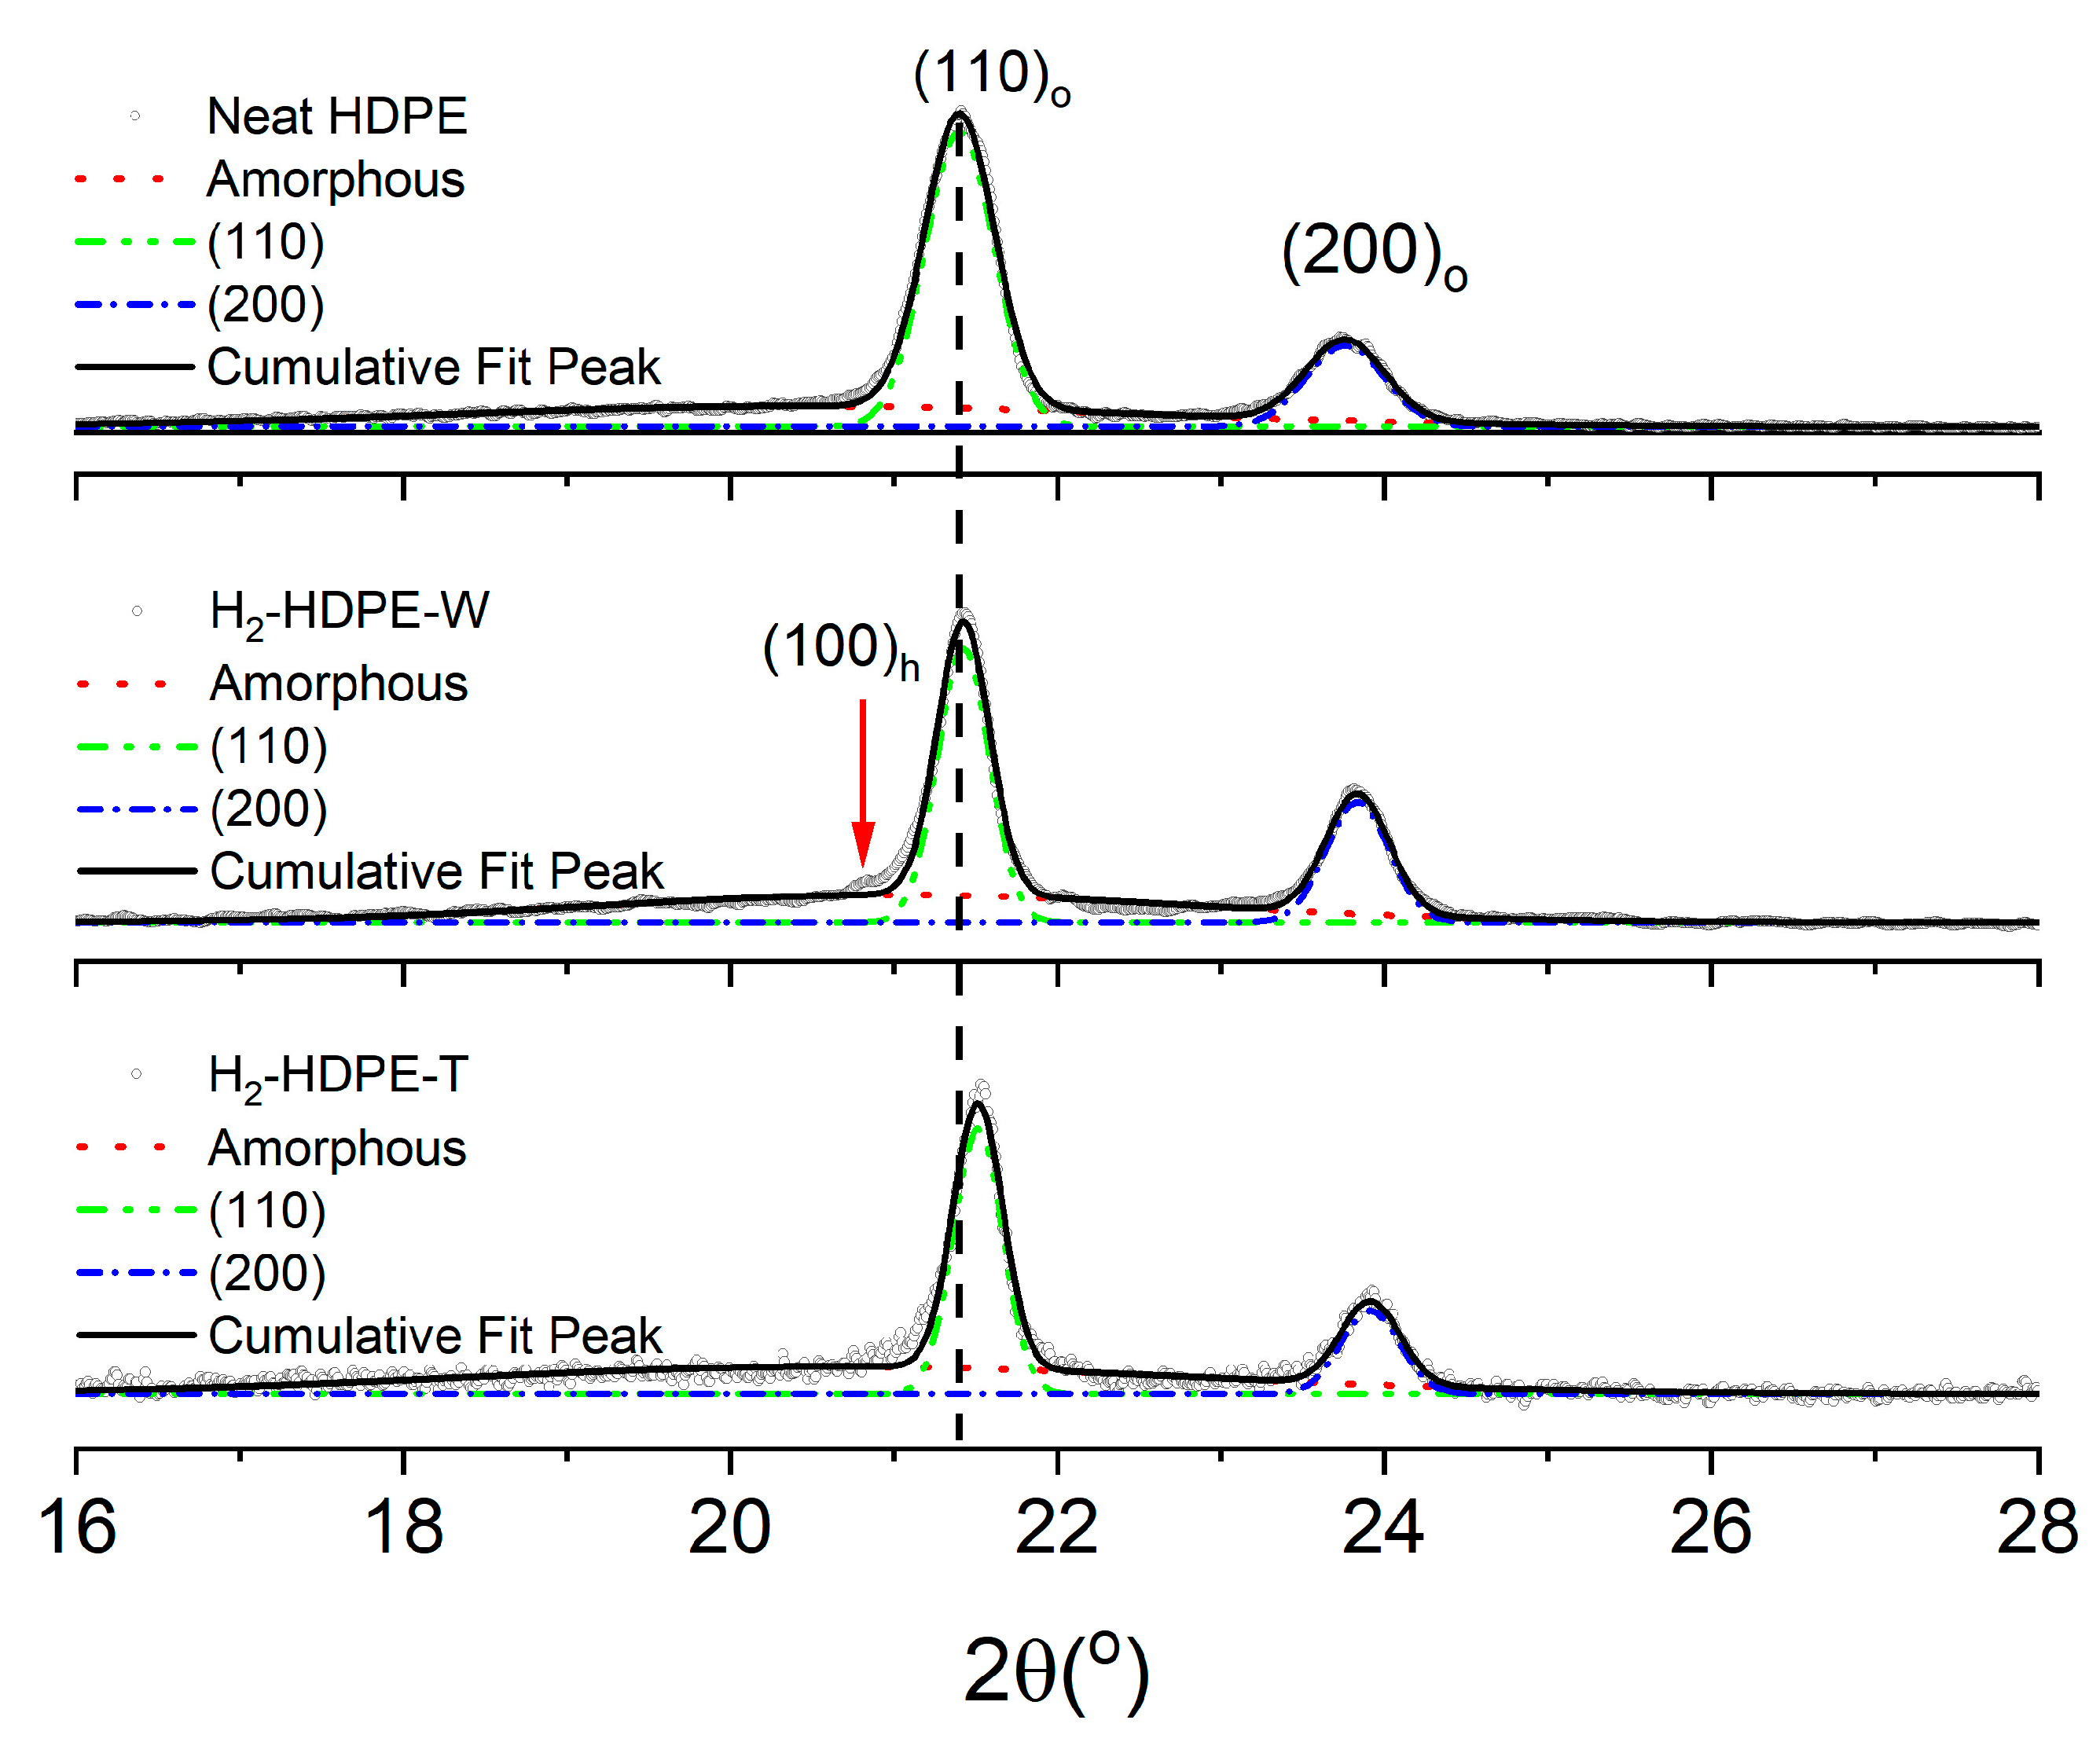
To determine the crystal structure responsible for H2-HDPE-W, WXRD analysis was performed. Figure 3a illustrates the clear separation between the white and transparent regions, thus enabling independent WXRD data collection for each region. Figure 4 displays the WXRD patterns obtained from neat HDPE, and the white cavities of H2-HDPE-W and H2-HDPE-T. The crystal structure of HDPE at the ambient temperature and 1 atm is orthorhombic and belongs to the Pnam space group, with lattice constants of a = 7.6 Å, b = 4.3 Å, and c = 2.4 Å. Diffraction angles of 2θ = 21.4 and 23.8° correspond to the (110)o and (200)o planes, respectively [16,17]. The white cavities of H2-HDPE-W and H2-HDPE-T exhibit nearly identical major XRD patterns as that of neat HDPE, although the diffraction intensity is reduced for each Miller index. In the case of H2-HDPE-T, the peak positions of the (110)o and (200)o planes are shifted by approximately Δ2θ = 0.02° towards the higher angles, indicating a compressive lattice deformation caused by the high-pressure hydrogen. Another interesting observation is the presence of a small but distinct peak at 2θ = 20.8° in the XRD pattern of H2-HDPE-W. This peak corresponds to the diffraction angle associated with the hexagonal crystal lattice of (100)h [14,18,19,20,21,22,23]. The presence of this peak suggests the partial existence of an extended chain crystal structure within the hexagonal phase of H2-HDPE-W.
Once the XRD results are deconvoluted with three Gaussian functions to obtain the respective areas and half-height widths, the % crystallinity can be calculated by substituting the obtained areas into Equation (1) given below [24].
% X c = A c r A c r + A a m × 100 % ( A c r = A 110 + A 200 : C r y s t a l l i n e ;   A a m : A m o r p h o u s   a r e a )
Next, the average size L of the HDPE crystals perpendicular to the Miller index planes (110)o and (200)o from the full width at half maximum (FWHM) of the XRD line can be calculated using the half-height width and Scherrer equation (Equation (2)) given below [25]:
L = K · λ β · c o s θ ( β : H a l f   w i d t h   i n   r a d i a n s ;   λ : X-ray   w a v e l e n g t h ;   K = 0.89 ;   θ = a   d i f f r a c t i o n   a n g l e )
The results are summarized in Table 1, which reveals that the crystallinity of the orthorhombic crystal structure decreased from 65% before the hydrogen pressure treatment to 57% for H2-HDPE-W and 47% for H2-HDPE-T after the hydrogen pressure treatment. But the lamellar thickness of the (110)o plane increased from 187 Å before the hydrogen treatment to 248 Å for H2-HDPE-W and 263 Å for H2-HDPE-T. Similarly, the lamellar thickness of the (200)o plane increased from 167 Å before the hydrogen treatment to 208 Å for H2-HDPE-W and 221 Å for H2-HDPE-T. In terms of the d-spacing value, only H2-HDPE-T showed a decrease of approximately 0.02 Å in both the (110)o and (200)o planes, indicating further compressive folding during the rapid decompression. On the other hand, the I(200)o/I(110)o ratio, which represents the chain stretching ratio, was 0.31 for neat HDPE, 0.53 for H2-HDPE-W, and 0.37 for H2-HDPE-T [26]. This indicates that the white cavity region of H2-HDPE-W exhibited a higher degree of chain stretching than that of H2-HDPE-T. The increase in the I(200)o/I(110)o ratio suggests that the hydrogen pressure treatment influenced the molecular arrangement and promoted the formation of an extended chain crystal structure in the white cavity region of H2-HDPE-W. The stretching ratio of 0.53 observed in H2-HDPE-W was significantly higher than that obtained from ultra high molecular weight polyethylene (UHMWPE) produced using the melt-drawn method at elevated temperatures. This indicates that the chain stretching in H2-HDPE-W was exceptionally pronounced. Moreover, the completely relaxed state image in Figure 3d serves as a visual representation of the internal structural changes in the polymer.
The WXRD study revealed that in the white cavity region of H2-HDPE-W, the folding degree of the polymer chain was similar to that of neat HDPE; however, the stretching ratio was remarkably high. In contrast, in the other transparent region of H2-HDPE-T, the molecular folding was even more compact than that in neat HDPE, while the stretching degree was slightly higher. This suggests that the crystalline lamellae in the white cavity of H2-HDPE-W were subjected to an extensive stretching force, whereas the lamellae in the other transparent regions of H2-HDPE-T experienced compression during the rapid decompression process.
The observed changes in the polymer morphology and crystal structure, as indicated via XRD and microscopy results, suggest significant modifications in the arrangement of the polymer chains. These modifications were likely influenced by the hydrogen pressure treatment and subsequent rapid decompression process. Therefore, the completely relaxed state observed in Figure 3d can be attributed to the rearrangement and stretching of the polymer chains, which might have led to the formation of a partially chain-extended hexagonal phase embedded in an amorphous background matrix.

3.3. DSC

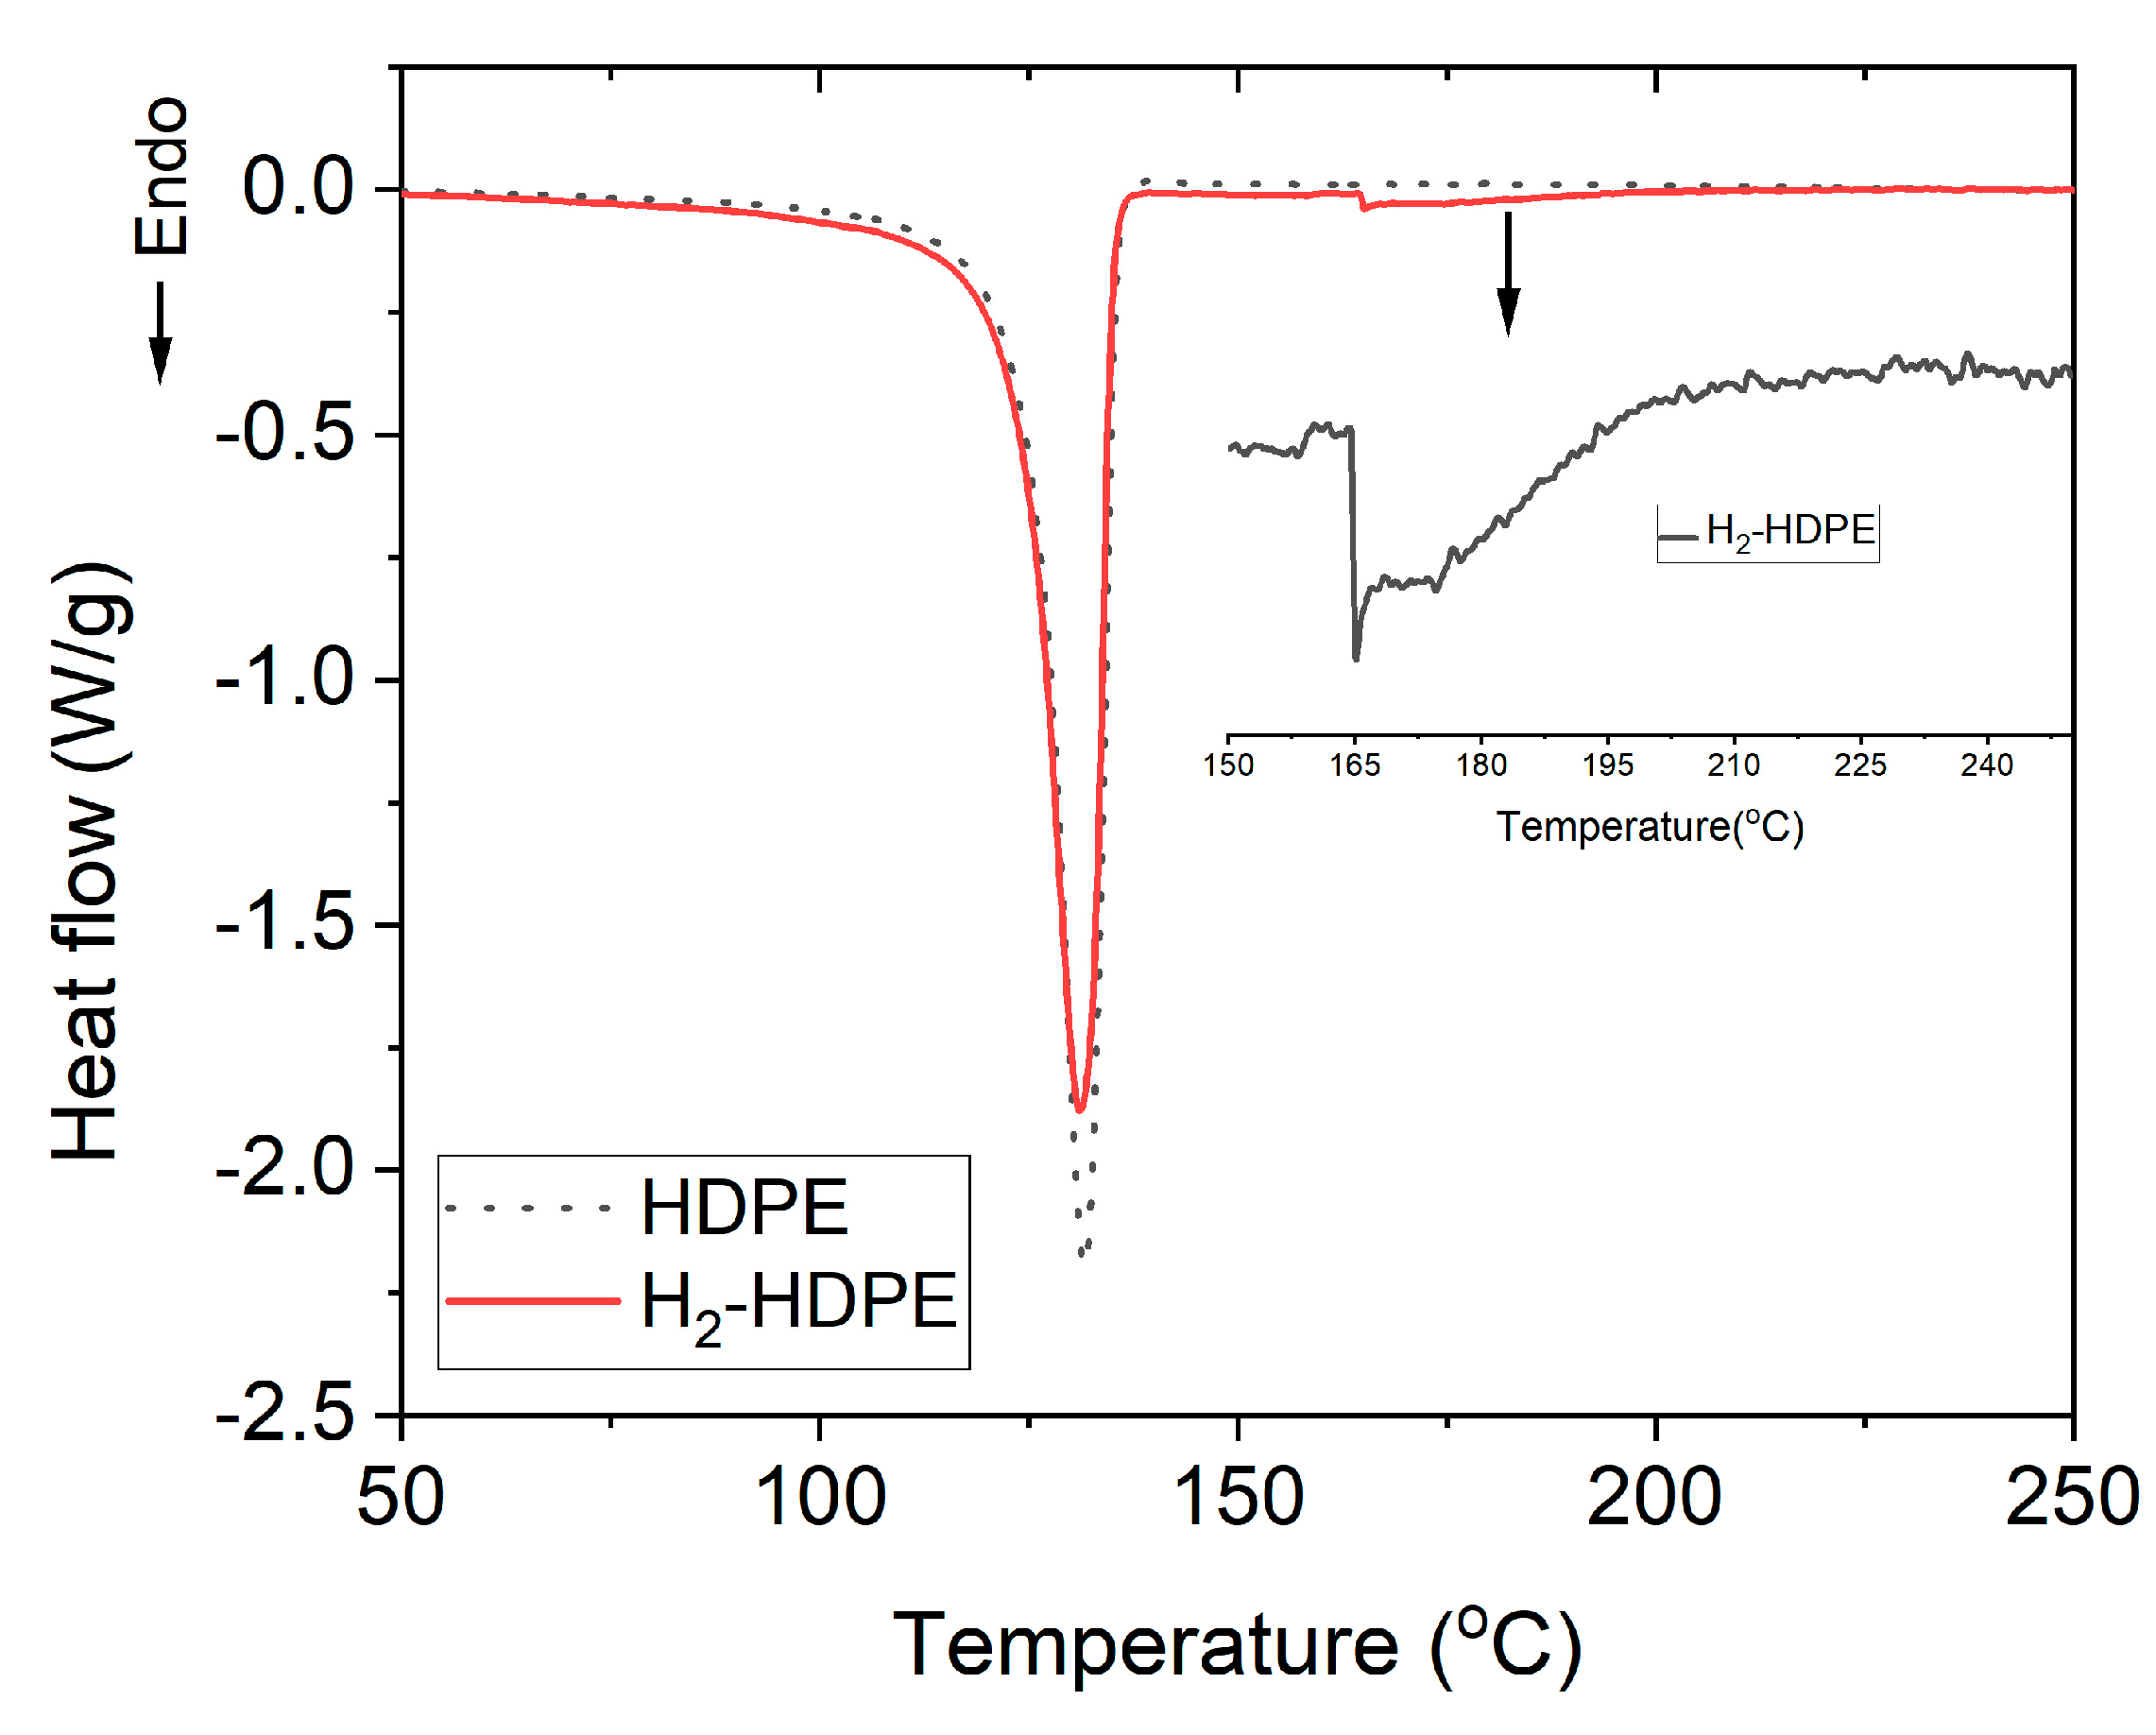
The results of the DSC experiments on Piece #3, which included the central starting point and neat HDPE, are depicted in Figure 5. Following the high-pressure hydrogen treatment, the most notable change is the occurrence of melting behavior at two different temperatures. One is the prominent melting peak at 131 °C, attributable to the orthorhombic crystal structure, while the other is a new minor weak peak that appeared at approximately 165 °C (as shown in the inset of Figure 5).
For the main melting peak, the % crystallinity (%Xdsc) can be calculated using the following equation:
% X d s c = H m H m 0 × 100
where, ΔHm is the measured heat of fusion and is equal to the area under the DSC melting curve, and ΔHm0 is the unit mass heat of fusion of 100% crystalline HDPE (293 J/g) [16,27]. Based on Equation (3), the crystallinity before hydrogen pressure treatment was calculated as 77% (ΔHm = 226.49 J/g), while the crystallinity after hydrogen pressure treatment decreased to 74% (ΔHm = 217.04 J/g).
The lamellar thickness Lc of the crystal grains can be calculated using the Gibbs–Thomson equation [28].
L c = 2 σ e T m 0 H m 0 ( T m 0 T m )
where, σe is the surface free energy (0.093 J/m2), ΔHm0 is the volumetric heat of fusion (2.88 × 10⁸ J/m3), and Tm0 is the melting temperature of an infinitely thick HDPE crystal (414.6 K). L c was approximately 311 Å (132 °C) before the hydrogen pressure treatment, and it remained almost the same at 311 Å (131 °C) after the hydrogen pressure treatment. In the case of polyethylene (PE), a decrease in the crystallinity implies a reduction in the volume of the crystalline region where -(CH2)- chains fold in parallel. This reduction leads to a decrease in the number of molecules participating in the van der Waals interactions between the folded -(CH2)- chains in the crystalline region, which should proportionally lower the melting temperature. However, in our results, although the hydrogen pressure treatment reduced the orthorhombic crystallinity by approximately 3%, the change in the melting temperature was negligible within the experimental error (±0.5 °C).
Next, we considered the minor weak peak shown in the inset of Figure 5. This peak, observed at 165 °C, cannot be attributed to the orthorhombic structure, as the fully orthorhombic crystal structure of HDPE typically exhibits a melting temperature of at least 414.6 K (141.6 °C) and a heat of fusion of 293 J/g. The enthalpy of fusion corresponding to the integral area was 6.07 J/g. The melting temperature of HDPE (165 °C) closely matched that observed in the case of the hexagonal crystal structure [14,29,30]. This observation agreed with the experimental findings from OM and WXRD analyses, which indicated the presence of a hexagonal phase in the treated HDPE sample. The similarity in the melting temperatures further supported the inference that the hydrogen pressure treatment and subsequent structural modifications influenced the crystalline arrangement of the polymer, leading to the formation of a hexagonal crystal structure with altered thermal properties [31].
The DSC analysis showed that HDPE exhibited two distinct melting phenomena. The first could be attributed to the ambient orthorhombic crystal structure with a melting temperature of 131 °C, while the second corresponded to a partial hexagonal crystal structure with a melting temperature of 165 °C. The % crystallinity associated with the low-temperature melting of the ambient orthorhombic crystal structure showed a slight decrease, indicating some structural modifications past the hydrogen pressure treatment. However, the crystalline lamellar thickness remained unchanged within the experimental error. Further details and summarized results are presented in Table 2.
According to the P–T phase diagram [17,32,33,34], pure HDPE can exist in three different physical states, namely the orthorhombic crystal structure, which is the most common state under the ambient pressure (1 atm); hexagonal crystal structure, which is typically observed under a high-pressure (>GPa) and high-temperature molten extended chain conditions, and liquid state [35]. Additionally, a monoclinic crystal structure is also possible, which can occur as a metastable phase under highly stressed ambient conditions or as a hysteretic phase at high pressures and temperatures [36,37,38]. In our case, the aforementioned conditions were not met. However, it appears that the presence of the hexagonal phase was observed. Therefore, it is necessary to investigate whether the hexagonal phase is possible under conditions other than those specified in the P–T phase diagrams. Previous research has shown that introducing crosslinking through radiation exposure can significantly lower the temperature required for hexagonal-phase formation [39]. Additionally, it has been reported that upon embedding orthorhombic-phase HDPE in an epoxy matrix [15], a transition to the hexagonal phase occurred at temperatures lower than those indicated in the P–T phase diagram. However, it is important to note that in both the cases investigated in this study, the temperature required to exhibit the hexagonal phase was considerably higher than the ambient temperature. Therefore, the currently observed hexagonal phase could not be explained by the existing research findings, thus warranting further investigation.

3.4. ATR-FTIR

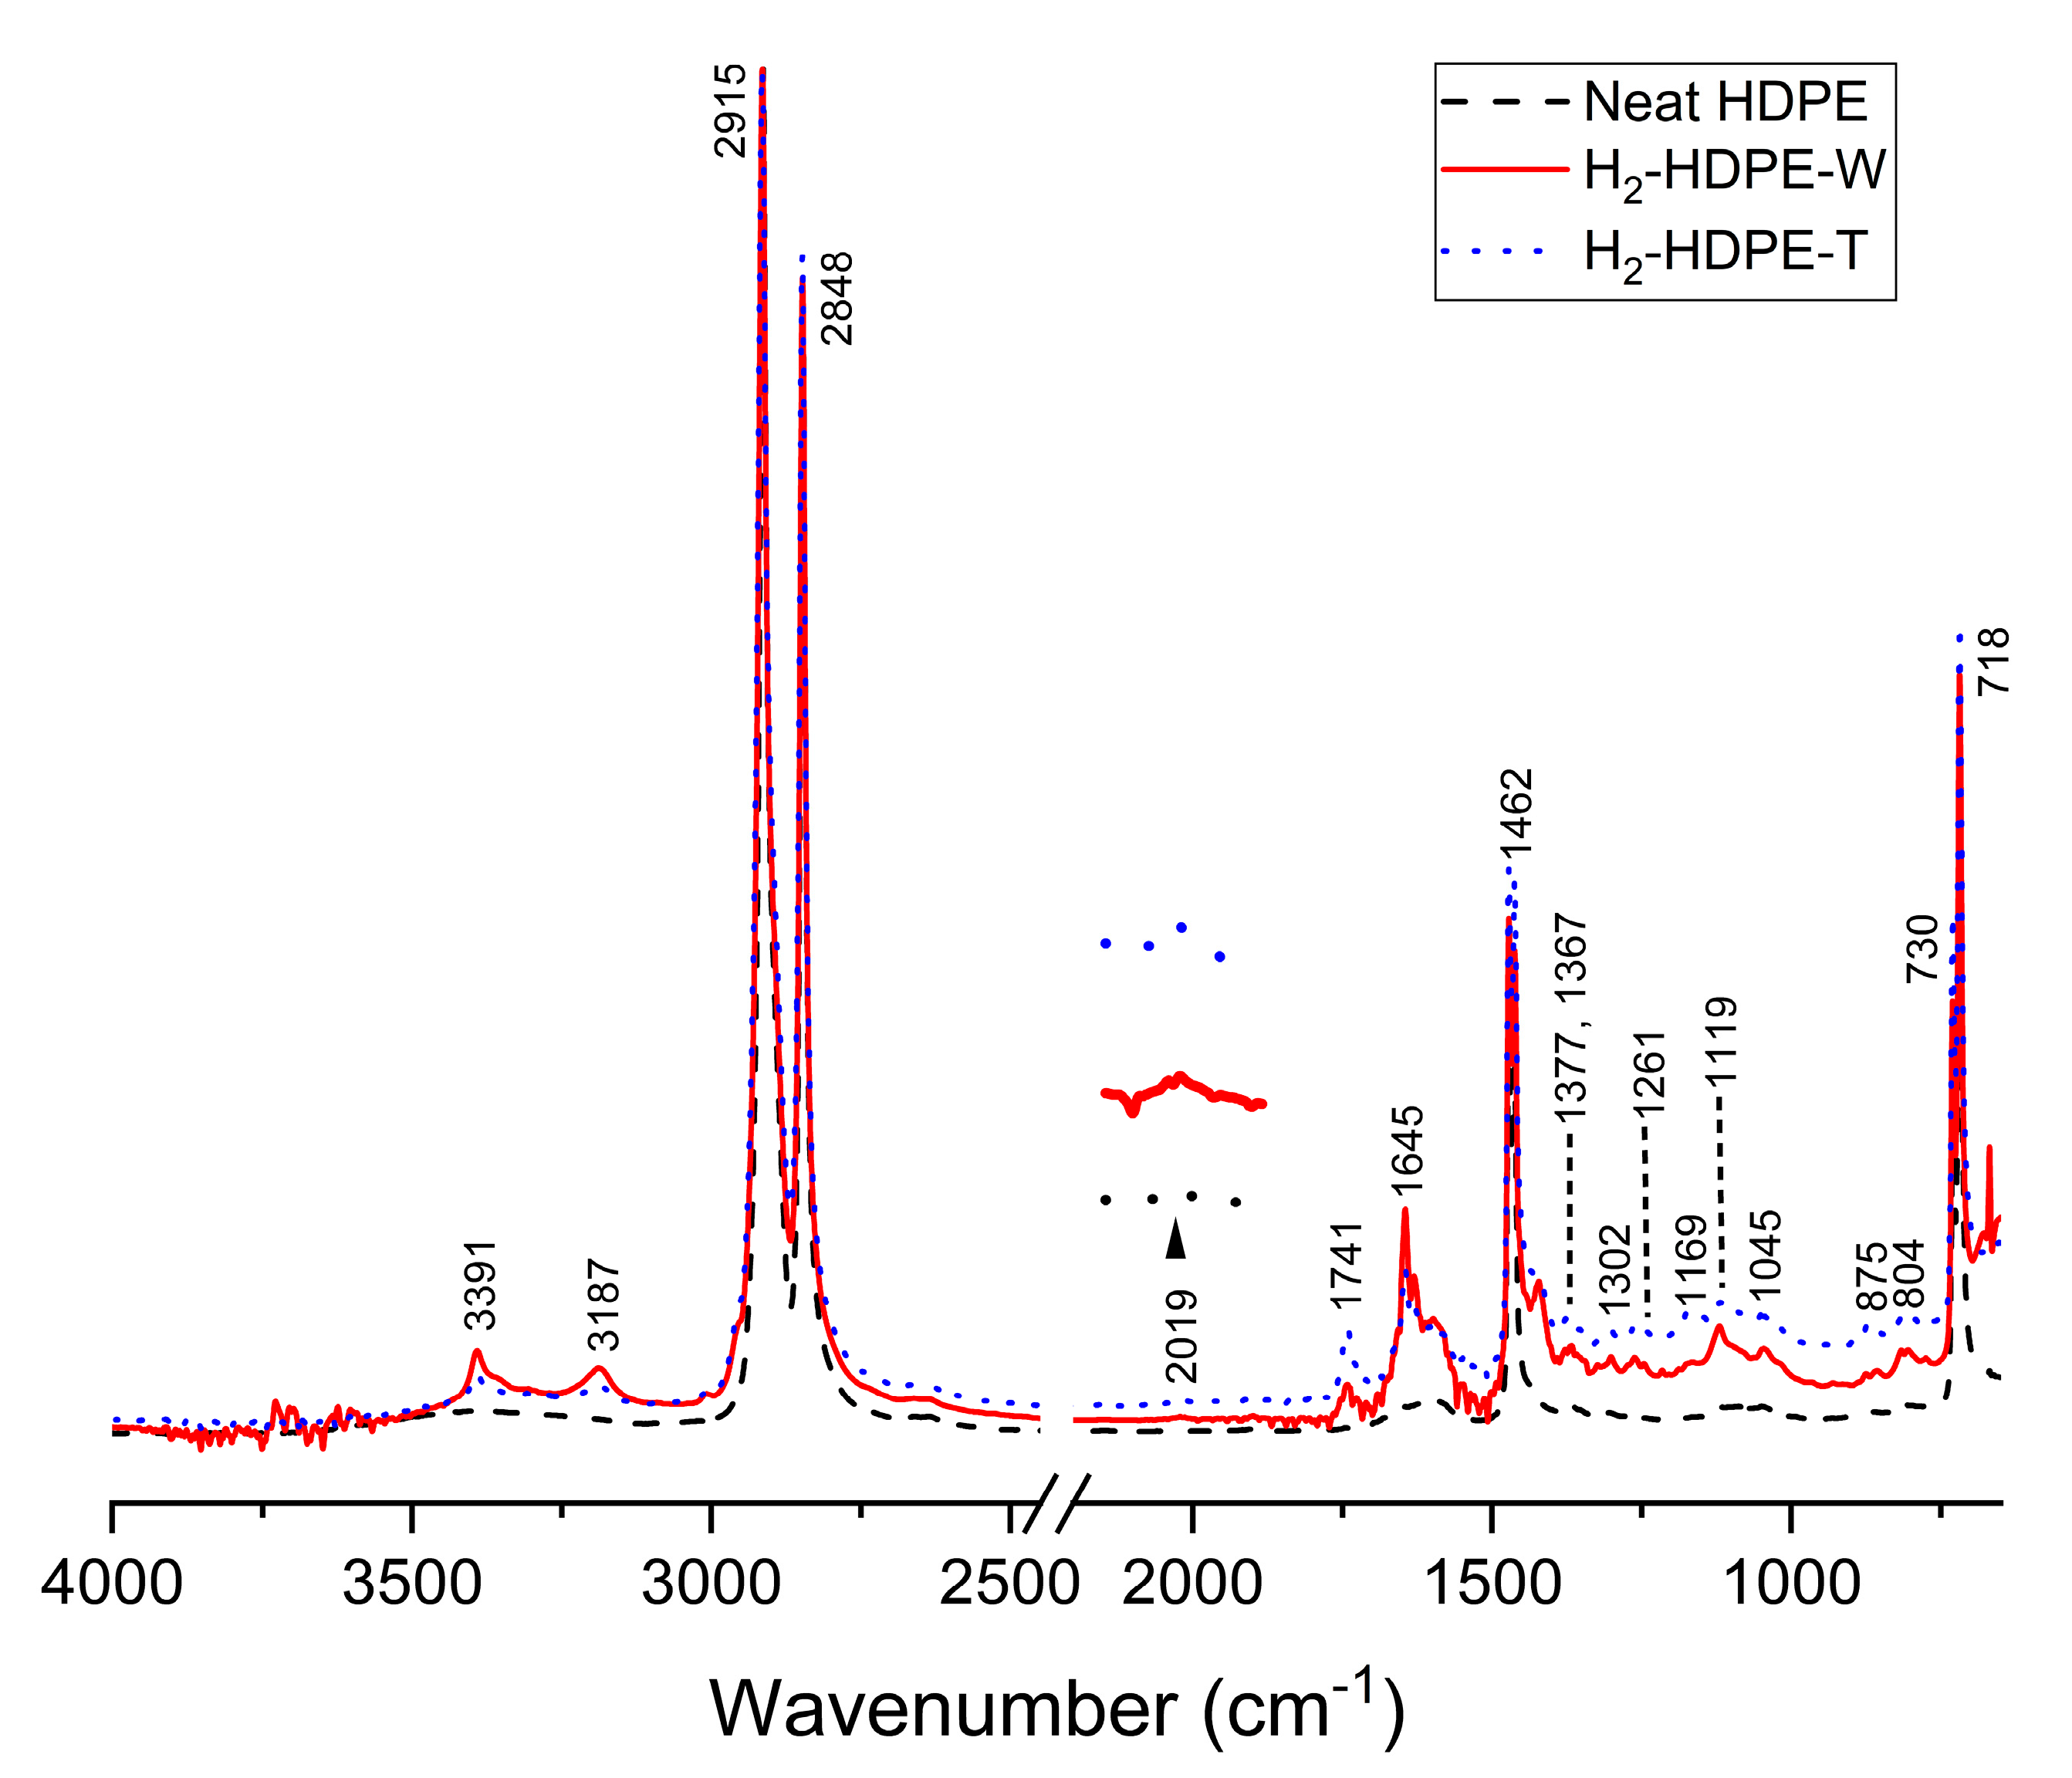
The chemical changes at the molecular level resulting from the hydrogen pressure treatment were verified for Piece #2 using ATR-FTIR spectroscopy, and are depicted in Figure 6. In simple terms, the wavenumbers of the signal are shown in the figure, and the corresponding assignments for the signals are summarized in Table 3. The ATR-FTIR spectrum of neat HDPE primarily identified the signals in four distinct regions. First, the signals at 2915 and 2848 cm−1 correspond to the asymmetric and symmetric stretching vibrations of the methylene (–CH2–) groups, respectively. The signals at 1462 and 1472 cm−1 represent the bending deformation of the methylene groups [40,41].
The presence of wagging vibrations of CH2 in the crystalline region is indicated by the signal at 1367 cm−1. Additionally, the rocking vibration of the methylene group is observed in the 700–800 cm−1 range [41,44,45]. The broad signals at 3393 and 1590 cm−1 are attributed to the symmetric stretching and bending modes of the OH groups involved in the hydrogen bond network, respectively [50]. Furthermore, the small but distinct peaks can be assigned as follows.
The peaks at 1169 and 1261 cm−1 correspond to the symmetric and asymmetric bending deformations of the -CCH-groups, respectively [44]. These peaks suggest the presence of a small amount of crosslinking in neat HDPE. The peak at 1367 cm−1 corresponds to the wagging motion of the -CH3 groups, thus confirming their presence [41]. The two distinct peaks at 1045 and 1119 cm−1 can be attributed to the secondary and tertiary alcohol groups, respectively [43]. These assignments hold true for both the H2-HDPE-W and H2-HDPE-T samples.
Additionally, in the hydrogen-treated samples, along with the signals that define neat HDPE, there were newly emerged signals as well as signals that became more pronounced. These signals indicate the presence of additional functional groups or structural changes in the polymer. Notably, the FTIR signals observed for both the H2-HDPE-W and H2-HDPE-T samples yielded similar patterns, suggesting that the hydrogen treatment induced similar chemical modifications in both the samples. Among the new peaks, the signals at 3391 and 2019 cm−1 can be assigned to the R-C≡C-H groups, indicating the presence of alkyne groups. The pairs of signals at 3187, 1645, and 875 cm−1 can be attributed to the R-CH=CH2 groups, indicating the presence of vinyl groups [47,49]. The signals at 1377, 1302, and 804 cm−1 correspond to the -CH3 groups in the R-CH=CH-CH3 moiety of HDPE [41,43,51]. These spectral changes can be explained by the introduction of hydrogenation reactions involving radical species generated after the chain rupture during the rapid decompression process. In other words, the signal at 1741 cm−1 can be attributed to the ester -C=O groups, which might have resulted from oxidation [48,50]. However, the specific assignment of the 1420 cm−1 signal has not been reported till date. To gain a better understanding, it is important to revisit the broad FTIR signal observed at 1429 cm−1 in neat HDPE. This signal is typically associated with the scissoring vibration of the -CH2–groups in the amorphous region of HDPE, which consists of disordered and randomly oriented polymer chains. When the polymer undergoes rapid decompression from high-pressure hydrogen treatment, the chains experience reorientation, resulting in a change in the degree of order within the amorphous region. This reorientation can cause a narrowing and a shift of the FTIR signal, resulting in the observed signal at 1420 cm−1. In some cases, this signal has also been observed as a peak at 1430 cm−1 [33] during the phase transition from the orthorhombic structure to the monoclinic structure, or at 1450 cm−1 [33,52] in the case of the extended chain hexagonal structure. For our specific case, considering the experimental results discussed earlier, it is more reasonable to attribute the observed signal at 1420 cm−1 to the formation of the hexagonal phase in the amorphous region. This suggests that the reorientation and ordering of the polymer chains during the decompression of high-pressure hydrogen can potentially result in the formation of a hexagonal structure within the amorphous phase; this in turn, implies a significant change in the molecular arrangement and packing of the polymer chains, which can be detected by the vibrational modes associated with the scissoring vibrations of the -CH2- groups.
In the case of signals that have become more pronounced, for example, the two prominent peaks at 1169 and 1261 cm−1, these can be attributed to the crosslinking effects [44]. These signals indicate the symmetric and asymmetric bending deformations of the -CCH- groups, which were caused by an increase in the number of crosslinks in the polymer structure. Additionally, the signal at 1367 cm−1 corresponds to the wagging motion of the -CH3 groups, indicating an increase in the number of -CH3 end groups in the polymer chains [41]. Therefore, the enhanced signals at 1169, 1261, and 1367 cm−1 suggest that hydrogen treatment led to an increase in the number of crosslinks and -CH3 end groups in the polymer.
Subsequent to the high-pressure hydrogen treatment, various chemical changes occurred in H2-HDPE, including the introduction of new functional groups and an increase in the crosslinking and -CH3 end groups. These modifications are summarized in Table 4. The aforementioned treatment led to the formation of additional functional groups, such as R-C≡C-H and R-CH=CH2, as indicated by the appearance of new peaks in the FTIR spectrum. Moreover, the presence of enhanced peaks at 1169 and 1261 cm−1 suggests an increase in the crosslinking effects, whereas the intensified signal at 1367 cm−1 indicates an increase in the -CH3 end groups [53].
The change in the crystallinity of the HDPE samples owing to the hydrogen pressure treatment can be calculated using Equation (5) together with the absorption intensities in the range of 1472 to 1462 cm−1 [54].
% X I R = I β I α 1.233 I β + I a × 100
Here, Iα and Iβ are the signal intensities of the doublet shape at wave numbers 1472 and 1462 cm−1, respectively, and the ratio of these signal intensities for a sample with 100% crystallinity is known to be 1.233. The empirical rule presented by Zerbi et al. [54] provides an equation (Equation (5) given above) to calculate the amorphous content (% amorphous) based on the crystallinity [17,54]. Therefore, the crystallinity can be obtained as a complement of the amorphous content (1 − % amorphous). After analyzing the results, it was observed that the crystallinity decreased from 69% before the hydrogen pressure treatment to 63% after the treatment. This indicates a reduction in the degree of crystallinity of the HDPE sample owing to hydrogen treatment.
The rapid decompression of high-pressure hydrogen gas in the presence of HDPE can indeed significantly affect the polymer structure. When the gas pressure was suddenly released, the spherulite structure of the polymer underwent an explosive expansion. This expansion could result in the disruption of the polymer chains and formation of numerous cavities within the polymer matrix. The violent release of the gas pressure during the decompression could lead to the generation of high shear forces and mechanical stresses within the polymer. These forces could cause a chain scission, chain entanglement, and rearrangement of the polymer segments. Consequently, the polymer structure would be disrupted and cavities or voids would be formed within the material. The formation of these cavities could lead to a decrease in the density and an increase in the porosity of the material, thus affecting the mechanical properties, for example, causing a reduction in the stiffness and strength of the polymer. Furthermore, the cavities could act as stress concentrators, thereby potentially leading to localized deformation or failure under external loads.

4. Conclusions

The experimental results and discussions presented herein provide insights into the changes observed in high-density polyethylene (HDPE) when subjected to rapid decompression of high-pressure hydrogen gas.
From a physical standpoint, the formation of a partial hexagonal phase within the amorphous region of HDPE was observed, accompanied by a decrease in orthorhombic crystallinity. This suggests a reorientation and rearrangement of the polymer chains during the rapid release of hydrogen pressure. The expansion of the spherulite structure, disruption of the polymer chains, and the presence of cavity structures further aid these physical changes.
Chemically, hydrogenation, oxidation, crosslinking, and termination of the -CH3 end groups were identified as the primary chemical transformations induced by the hydrogen treatment. Hydrogenation resulted in the addition of hydrogen atoms to the polymer chains, whereas oxidation led to the formation of oxidized groups, including ester -C=O groups. Crosslinking was evident from the characteristic bending deformations of the -CCH- groups; furthermore, an increase in the number of -CH3 end groups was observed through the wagging motion of the -CH3 groups.
Previous studies have only observed the occurrence of cavitation in HDPE after a high-pressure hydrogen treatment. However, this study demonstrated that, in addition to cavitation, there were concurrent alterations in the physical crystalline structure of HDPE and other associated chemical transformations after the chain scission. These findings offer molecular-level insights that can be utilized in the design and comprehension of the durability of pressure vessels in hydrogen fuel-cell vehicles. Further studies are warranted to explore the detailed mechanisms underlying these changes, and their implications for the properties and performance of HDPE materials.

Author Contributions

Conceptualization, M.K. and C.H.L.; methodology, M.K.; software, M.K.; validation, M.K. and C.H.L.; formal analysis, M.K. and C.H.L.; investigation, M.K. and C.H.L.; resources, C.H.L.; data curation, M.K.; writing—original draft preparation, C.H.L.; writing—review and editing, M.K.; visualization, M.K.; supervision, C.H.L.; project administration, C.H.L.; funding acquisition, C.H.L. All authors have read and agreed to the published version of the manuscript.

Funding

This research received no external funding.

Institutional Review Board Statement

Not applicable.

Data Availability Statement

The data related to this study are available upon reasonable request.

Conflicts of Interest

The authors declare no conflict of interests.

References

  1. Barthelemy, H.; Weber, M.; Barbier, F. Hydrogen storage: Recent improvements and industrial perspectives. Int. J. Hydrog. Energy 2017, 42, 7254–7262. [Google Scholar] [CrossRef]
  2. Moradi, R.; Groth, K.M. Hydrogen storage and delivery: Review of the state of the art technologies and risk and reliability analysis. Int. J. Hydrog. Energy 2019, 44, 12254–12269. [Google Scholar] [CrossRef]
  3. Berro Ramirez, J.P.; Halm, D.; Grandidier, J.-C.; Villalonga, S.; Nony, F. 700 bar type iv high pressure hydrogen storage vessel burst—Simulation and experimental validation. Int. J. Hydrog. Energy 2015, 40, 13183–13192. [Google Scholar] [CrossRef]
  4. Melnichuk, M.; Gardavaud, Q.; Thiébaud, F.; Perreux, D. Temperature effect in cavitation risk assessments of polymers for hydrogen systems. Int. J. Hydrog. Energy 2020, 45, 23020–23026. [Google Scholar] [CrossRef]
  5. Hu, Z.; Chen, M.; Pan, B. Simulation and burst validation of 70 mpa type iv hydrogen storage vessel with dome reinforcement. Int. J. Hydrog. Energy 2021, 46, 23779–23794. [Google Scholar] [CrossRef]
  6. Su, Y.; Lv, H.; Zhou, W.; Zhang, C. Review of the hydrogen permeability of the liner material of type iv on-board hydrogen storage tank. World Electr. Veh. J. 2021, 12, 130. [Google Scholar] [CrossRef]
  7. Yersak, T.A.; Baker, D.R.; Yanagisawa, Y.; Slavik, S.; Immel, R.; Mack-Gardner, A.; Herrmann, M.; Cai, M. Predictive model for depressurization-induced blistering of type iv tank liners for hydrogen storage. Int. J. Hydrog. Energy 2017, 42, 28910–28917. [Google Scholar] [CrossRef]
  8. Ono, H.; Fujiwara, H.; Onoue, K.; Nishimura, S. Influence of repetitions of the high-pressure hydrogen gas exposure on the internal damage quantity of high-density polyethylene evaluated by transmitted light digital image. Int. J. Hydrog. Energy 2019, 44, 23303–23319. [Google Scholar] [CrossRef]
  9. Kulkarni, S.S.; Choi, K.S.; Kuang, W.; Menon, N.; Mills, B.; Soulami, A.; Simmons, K. Damage evolution in polymer due to exposure to high-pressure hydrogen gas. Int. J. Hydrog. Energy 2021, 46, 19001–19022. [Google Scholar] [CrossRef]
  10. Zheng, Y.; Tan, Y.; Zhou, C.; Chen, G.; Li, J.; Liu, Y.; Liao, B.; Zhang, G. A review on effect of hydrogen on rubber seals used in the high-pressure hydrogen infrastructure. Int. J. Hydrog. Energy 2020, 45, 23721–23738. [Google Scholar] [CrossRef]
  11. Yuan, K.; Luo, X. A density functional theory study of the structural and electronic properties of pure and h2 doped polyethylene under high pressure and high temperature conditions of earth layers. AIP Adv. 2020, 10, 065326. [Google Scholar] [CrossRef]
  12. Voyiatzis, E.; Stroeks, A. Atomistic modeling of hydrogen and oxygen solubility in semicrystalline pa-6 and hdpe materials. J. Phys. Chem. B 2022, 126, 6102–6111. [Google Scholar] [CrossRef] [PubMed]
  13. Pawlak, A. Cavitation during tensile deformation of high-density polyethylene. Polymer 2007, 48, 1397–1409. [Google Scholar] [CrossRef]
  14. Rastogi, S.; Odell, J.A. Stress stabilization of the orthorhombic and hexagonal phases of uhm pe gel-spun fibres. Polymer 1993, 34, 1523–1527. [Google Scholar] [CrossRef]
  15. Pennings, A.J.; Zwijnenburg, A. Longitudinal growth of polymer crystals from flowing solutions. Vi. Melting behavior of continuous fibrillar polyethylene crystals. J. Polym. Sci. Polym. Phys. Ed. 1979, 17, 1011–1032. [Google Scholar] [CrossRef]
  16. Aggarwal, S.; Sajwan, M.; Singh, R. Crystallinity of hdpe pipes by dsc, xrd and ftir spectroscopy—A forensic comparison. Indian J. Criminol. Crim. 2008, 29, 141–148. [Google Scholar]
  17. Fontana, L.; Vinh, D.Q.; Santoro, M.; Scandolo, S.; Gorelli, F.A.; Bini, R.; Hanfland, M. High-pressure crystalline polyethylene studied by x-ray diffraction and ab initio simulations. Phys. Rev. B 2007, 75, 174112. [Google Scholar] [CrossRef]
  18. Yamamoto, T.; Miyaji, H.; Asai, K. Structure and properties of high pressure phase of polyethylene. Jpn. J. Appl. Phys. 1977, 16, 1891. [Google Scholar] [CrossRef]
  19. Tsubakihara, S.; Nakamura, A.; Yasuniwa, M. Hexagonal phase of polyethylene fibers under high pressure. Polym. J. 1991, 23, 1317–1324. [Google Scholar] [CrossRef]
  20. Uehara, H.; Kanamoto, T.; Kawaguchi, A.; Murakami, S. Real-time X-ray diffraction study on two-stage drawing of ultra-high molecular weight polyethylene reactor powder above the static melting temperature. Macromolecules 1996, 29, 1540–1547. [Google Scholar] [CrossRef]
  21. Pae, K.D.; Newman, B.A.; Sham, T.P. High pressure x-ray studies of polymers. J. Mater. Sci. 1977, 12, 1793–1797. [Google Scholar] [CrossRef]
  22. Bassett, D.C.; Block, S.; Piermarini, G.J. A high-pressure phase of polyethylene and chain-extended growth. J. Appl. Phys. 2003, 45, 4146–4150. [Google Scholar] [CrossRef]
  23. Tsubakihara, S.; Nakamura, A.; Yasuniwa, M. Melting and crystallization of ultra-high molecular weight polyethylene with appearance of hexagonal phase i. Melting processes of fibers under constrained state. Polym. J. 1996, 28, 489–495. [Google Scholar] [CrossRef]
  24. Hindeleh, A.M.; Johnson, D.J. The resolution of multipeak data in fibre science. J. Phys. D Appl. Phys. 1971, 4, 259. [Google Scholar] [CrossRef]
  25. Monshi, A.; Foroughi, M.R.; Monshi, M.R. Modified scherrer equation to estimate more accurately nano-crystallite size using xrd. World J. Nano Sci. Eng. 2012, 2, 154–160. [Google Scholar] [CrossRef]
  26. Loomis, J.; Ghasemi, H.; Huang, X.; Thoppey, N.; Wang, J.; Tong, J.K.; Xu, Y.; Li, X.; Lin, C.-T.; Chen, G. Continuous fabrication platform for highly aligned polymer films. Technology 2014, 2, 189–199. [Google Scholar] [CrossRef]
  27. Wunderlich, B.; Czornyj, G. A study of equilibrium melting of polyethylene. Macromolecules 1977, 10, 906–913. [Google Scholar] [CrossRef]
  28. Weeks, J.J. Melting temperature and change of lamellar thickness with time for bulk polyethylene. J. Res. Natl. Bur. Stand. A Phys. Chem. 1963, 67, 441–451. [Google Scholar] [CrossRef]
  29. Kuwabara, K.; Horii, F. Solid-state 13c nmr analyses of the orthorhombic-to-hexagonal phase transition for constrained ultradrawn polyethylene fibers. Macromolecules 1999, 32, 5600–5605. [Google Scholar] [CrossRef]
  30. Roiron, C.; Lainé, E.; Grandidier, J.-C.; Garois, N.; Vix-Guterl, C. A review of the mechanical and physical properties of polyethylene fibers. Textiles 2021, 1, 86–151. [Google Scholar] [CrossRef]
  31. Rein, D.M.; Khalfin, R.L.; Cohen, Y. Analysis of melting transitions in extended-chain polymer crystals. J. Polym. Sci. Part B Polym. Phys. 2004, 42, 2238–2244. [Google Scholar] [CrossRef]
  32. Hikosaka, M.; Tsukijima, K.; Rastogi, S.; Keller, A. Equilibrium triple point pressure and pressure-temperature phase diagram of polyethylene. Polymer 1992, 33, 2502–2507. [Google Scholar] [CrossRef]
  33. Fontana, L.; Santoro, M.; Bini, R.; Vinh, D.Q.; Scandolo, S. High-pressure vibrational properties of polyethylene. J. Chem. Phys. 2010, 133, 204502. [Google Scholar] [CrossRef] [PubMed]
  34. Pereira, R.A.; Dias, M.L.; Mano, E.B. Orthorhombic-hexagonal phase transition in high density polyethylene crystals. Int. J. Polym. Mater. 2000, 45, 69–78. [Google Scholar] [CrossRef]
  35. Bassett, D.C.; Khalifa, B.A.; Turner, B. Chain-extended crystallization of polyethylene. Nat. Phys. Sci. 1972, 239, 106–108. [Google Scholar] [CrossRef]
  36. Wang, Z.; Liu, Y.; Liu, C.; Yang, J.; Li, L. Understanding structure-mechanics relationship of high density polyethylene based on stress induced lattice distortion. Polymer 2019, 160, 170–180. [Google Scholar] [CrossRef]
  37. Seto, T.; Hara, T.; Tanaka, K. Phase transformation and deformation processes in oriented polyethylene. Jpn. J. Appl. Phys. 1968, 7, 31. [Google Scholar] [CrossRef]
  38. Russell, K.E.; Hunter, B.K.; Heyding, R.D. Monoclinic polyethylene revisited. Polymer 1997, 38, 1409–1414. [Google Scholar] [CrossRef]
  39. Keller, A.; Ungar, G. Radiation effects and crystallinity in polyethylene. Radiat. Phys. Chem. (1977) 1983, 22, 155–181. [Google Scholar] [CrossRef]
  40. Da Silva, D.J.; Wiebeck, H. Atr-ftir spectroscopy combined with chemometric methods for the classification of polyethylene residues containing different contaminants. J. Polym. Environ. 2022, 30, 3031–3044. [Google Scholar] [CrossRef]
  41. Motawie, M.; Hanafi, S.A.; Elmelawy, M.S.; Ahmed, S.M.; Mansour, N.A.; Darwish, M.S.A.; Abulyazied, D.E. Wax co-cracking synergism of high density polyethylene to alternative fuels. Egypt. J. Pet. 2015, 24, 353–361. [Google Scholar] [CrossRef]
  42. Pagés, P. Characterization of Polymer Materials Using Ft-Ir and Dsc Techniques. Universiadae da Coruna, Presented at 01 01 2005. Available online: https://core.ac.uk/works/34077741 (accessed on 25 June 2023).
  43. Charles, J.; Ramkumaar, G.R. Qualitative analysis of high density polyethylene using ftir spectroscopy. Asian J. Chem. 2009, 21, 4477–4484. [Google Scholar]
  44. Alsabbagh, A.; Saleem, R.A.; Almasri, R.; Aljarrah, S.; Awad, S. Effects of gamma irradiation on 3d-printed polylactic acid (pla) and high-density polyethylene (hdpe). Polym. Bull. 2020, 78, 4931–4945. [Google Scholar] [CrossRef]
  45. Vasylieva, A.; Doroshenko, I.; Vaskivskyi, Y.; Chernolevska, Y.; Pogorelov, V. Ftir study of condensed water structure. J. Mol. Struct. 2018, 1167, 232–238. [Google Scholar] [CrossRef]
  46. Smith, B. The infrared spectroscopy of alkenes. Spectroscopy 2016, 31, 28–34. [Google Scholar]
  47. Yang, R.; Liu, Y.; Yu, J.; Wang, K. Thermal oxidation products and kinetics of polyethylene composites. Polym. Degrad. Stab. 2006, 91, 1651–1657. [Google Scholar] [CrossRef]
  48. Winter, A. How to Identify Carbonyls, Alkenes, Alkynes, and Aromatics in the ir Spectrum. Dummies. 2020. Available online: https://www.dummies.com/education/science/chemistry/how-to-identify-carbonyls-alkenes-alkynes-and-aromatics-inthe-ir-spectrum/ (accessed on 22 March 2021).
  49. Gulmine, J.V.; Janissek, P.R.; Heise, H.M.; Akcelrud, L. Polyethylene characterization by ftir. Polym. Test. 2002, 21, 557–563. [Google Scholar] [CrossRef]
  50. Yang, R.; Li, Y.; Yu, J. Photo-stabilization of linear low density polyethylene by inorganic nano-particles. Polym. Degrad. Stab. 2005, 88, 168–174. [Google Scholar] [CrossRef]
  51. Sarker, M.; Rashid, M.M.; Molla, M. Abundant high-density polyethylene (hdpe-2) turns into fuel by using of hzsm-5 catalyst. J. Fundam. Renew. Energy Appl. 2011, 1, 1–12. [Google Scholar] [CrossRef]
  52. Pischedda, V.; Dawe, A.M.; Lowther, J.E.; Hearne, G.R. Study of the high pt phase diagram of crystalline polyethylene. Found. Crystallogr. 2005, 61, C461–C462. [Google Scholar] [CrossRef]
  53. Mallapragada, S.K.; Narasimhan, B. Infrared spectroscopy in analysis of polymer crystallinity. In Encyclopedia of Analytical Chemistry; Meyers, R.A., Ed.; John Wiley & Sons, Ltd.: Hoboken, NJ, USA, 2006. [Google Scholar]
  54. Zerbi, G.; Gallino, G.; Del Fanti, N.; Baini, L. Structural depth profiling in polyethylene films by multiple internal reflection infra-red spectroscopy. Polymer 1989, 30, 2324–2327. [Google Scholar] [CrossRef]
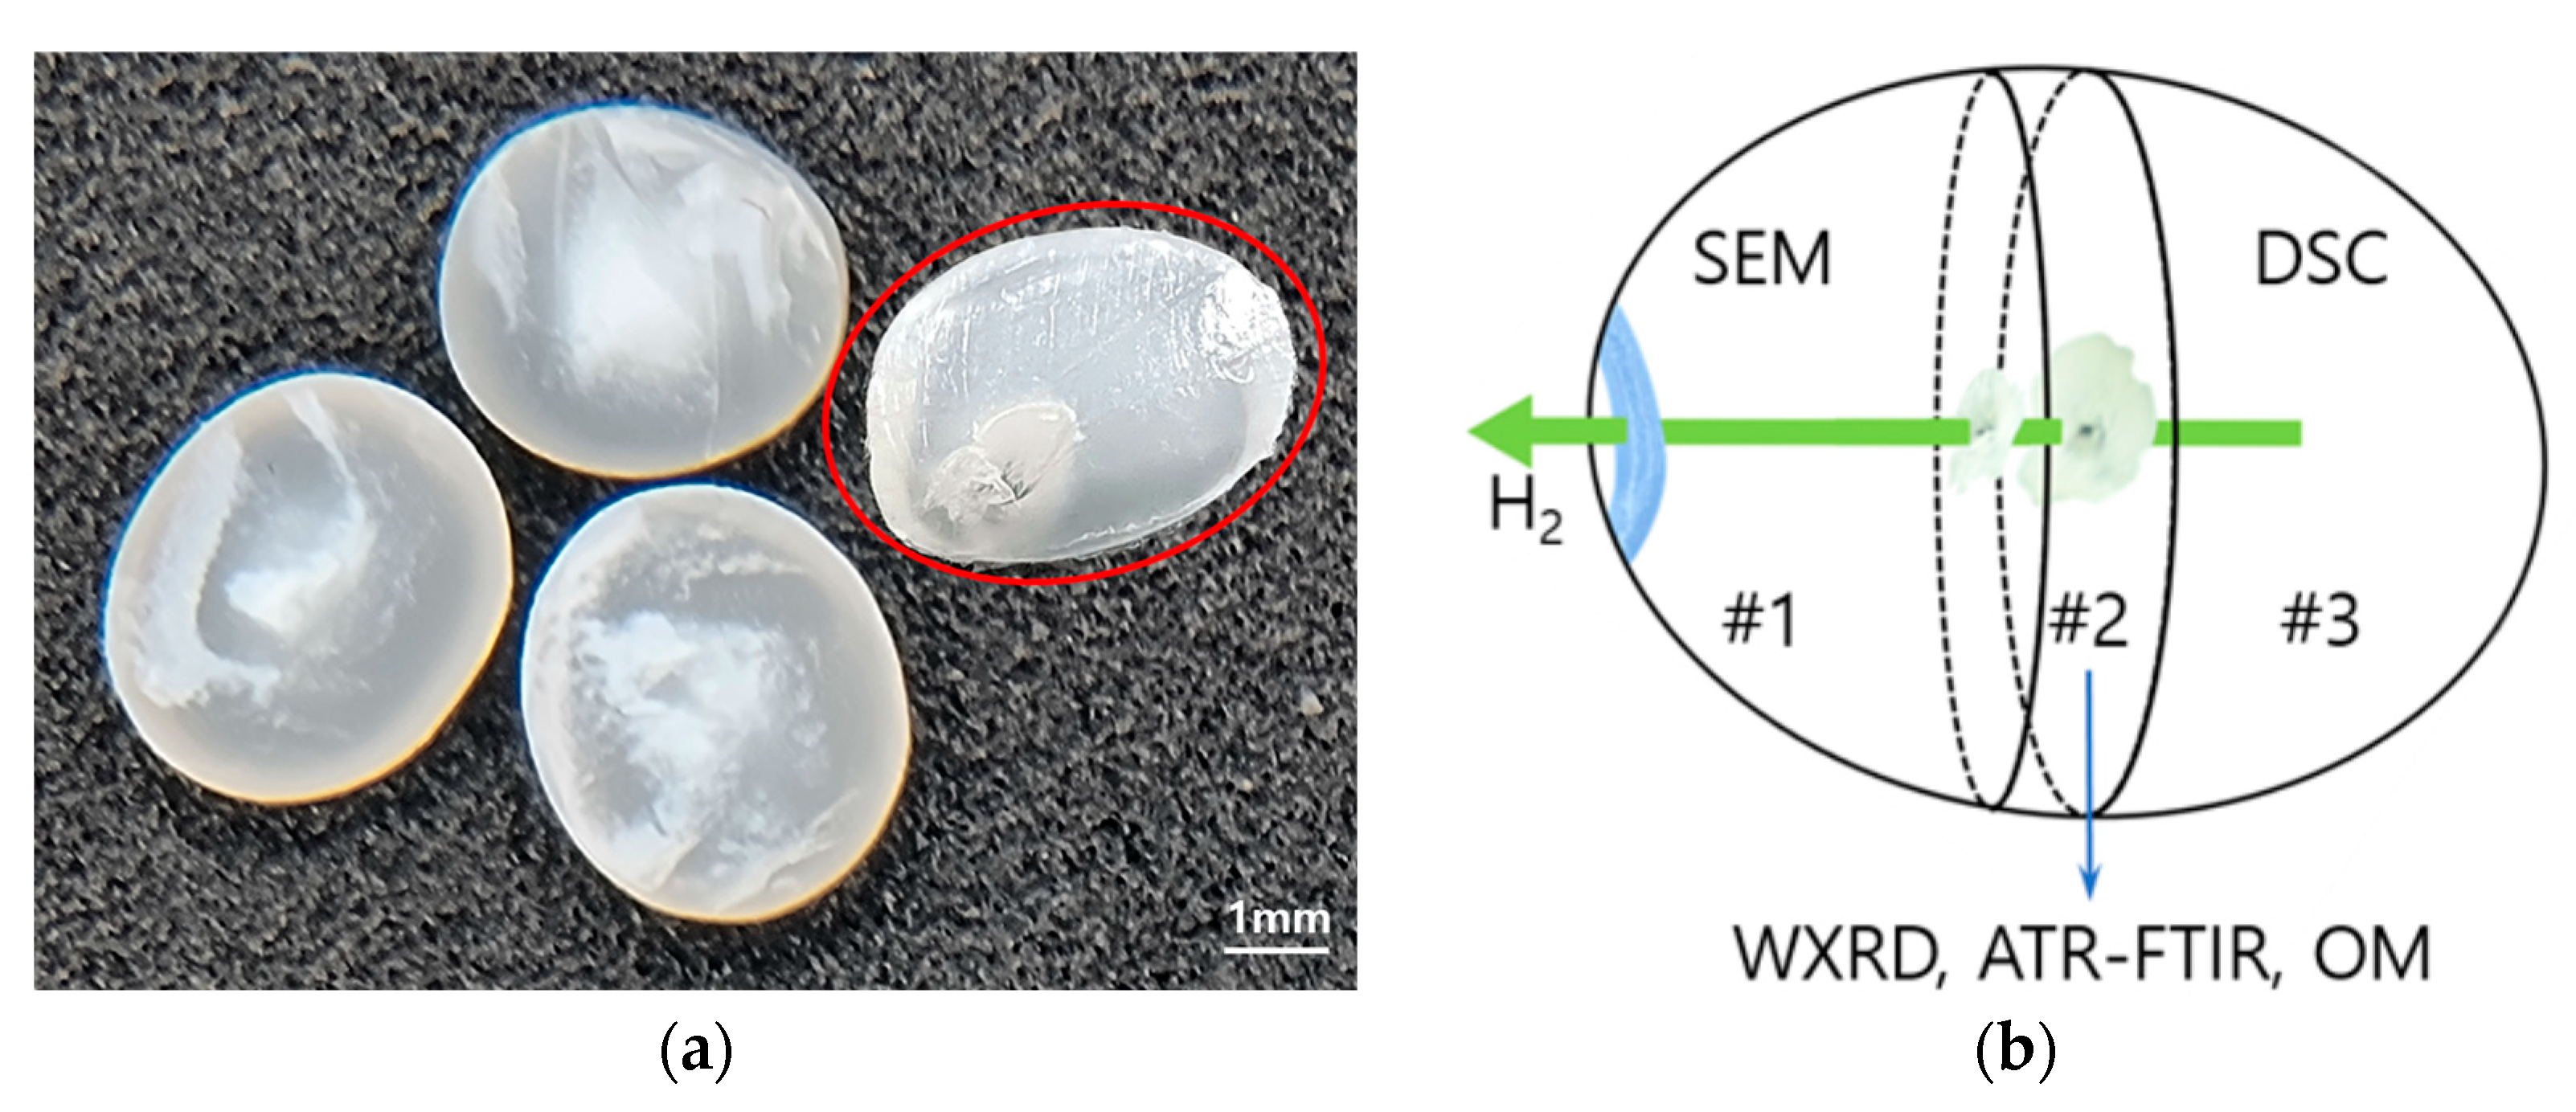
Figure 1. (a) White trajectory formed inside H2-HDPE after hydrogen pressure treatment at 90 MPa; (b) schematic illustration showing the division of the sample within the red circle in (a) into three pieces. These were labeled as #1, #2, and #3 for conducting the experiments.
Polymers 15 02880 g001
Figure 2. (a) SEM image of tone-burst structures observed on the surface of H2-HDPE after hydrogen treatment; (b) Image of an enlarged observation of one representative tone-burst structure.
Polymers 15 02880 g002
Figure 3. Images captured using a digital camera and OM to document changes following hydrogen pressure treatment: (a) Image of central sample (Piece #2). The white cavity region is outlined by blue dashed lines and labeled as “W,” while the other regions are labeled as “T”; (b) Zoomed image zoomed of area enclosed by blue dashed lines in (a), emphasizing the presence of two distinct holes within the white cavity. These holes are indicated by blue dashed lines; (c) Magnified image of the black-colored hole area indicated by the blue dashed lines in (b), obtained using OM; (d) Further-magnified image of the region indicated by the red dashed lines in (c); (e) POM image of the same area as in (d).
Polymers 15 02880 g003
Figure 4. Results of WXRD for various regions of H2-HDPE, including the white cavity region of H2-HDPE-W and other areas of H2-HDPE-T, after undergoing hydrogen pressure treatment. WXRD results for neat HDPE prior to hydrogen treatment are also included for comparison. In the figure, (110)o and (200)o represent the (110) and (200) planes in the orthorhombic crystal structure, while (100)h indicates the (100) plane in the hexagonal crystal structure.
Polymers 15 02880 g004
Figure 5. DSC results before and after hydrogen pressure treatment. Inset represents an enlarged view of melting transition at 165 °C.
Polymers 15 02880 g005
Figure 6. ATR-FTIR results obtained from neat HDPE, H2-HDPE-W, and H2-HDPE-T. Arabic numerals next to each signal indicate the corresponding wavenumbers of the signals. Inset figure, indicated by the upward arrow: enlarged view of the 2019 cm−1 region.
Polymers 15 02880 g006
Table 1. XRD results for neat HDPE, H2-HDPE-W, and H2-HDPE-T.
XRD%XcLamella Thickness (Å)d-Spacing (Å)I(200)/I(110)
L110L200(110)(200)
Neat HDPE65187 1674.153.740.31
H2-HDPE-W572482084.133.720.53
H2-HDPE-T472632214.153.730.37
Table 2. DSC results of HDPE and H2-HDPE.
DSCHm (J/g)%XcMelting Temperature (°C)Thickness of Lamellae (Å)
Neat HDPE226.49 77132311
H2-HDPE217.0474131311
Table 3. Functional groups assigned to wavenumbers of FTIR.
Assigned
Wavenumber (cm−1)
Functional Group and
Vibration Mode
New/ExistingReference
718, 730Split -CH2- (rocking)Existing[41]
804-CH3 (bending)New[41]
875-CH=CH2 (C-H bending)New[42]
1045-CHOH- (C-O stretching)Existing[43]
1119-COH(CH3)- (C-O stretching)Existing[43]
1169Symmetric CCH bendingExisting[44]
1261Asymmetric CCH bendingExisting[44]
1302-CH3 (twisting and wagging)New[41]
1367-CH3 (wagging)Existing[41]
1377-CH3 (Symmetric C-H bending)New[42]
1462, 1472-CH2- (bending)Existing[45]
1605O-H (bending)Existing[46]
1645C=C (stretching)New[47]
1741C=O (ester)New[48]
2019C≡C (stretching)New[49]
2848-CH2- (Symmetric C-H stretching)Existing[41]
2915-CH2- (Asymmetric C-H stretching)Existing[41]
3187C=C-H (C-H stretching)New[47]
3351O-H (stretching)Existing[46]
3391C≡C-H (C-H stretching)New[49]
Table 4. Major chemical changes induced by high-pressure hydrogen treatment.
Chemical changeMolecularWavenumber (cm−1)
HydrogenationPolymers 15 02880 i001875, 1645, 3187
Polymers 15 02880 i0022019, 3391
Polymers 15 02880 i003804, 1302, 1367, 1377
CrosslinkingPolymers 15 02880 i0041169, 1261
OxidationPolymers 15 02880 i0051741
Disclaimer/Publisher’s Note: The statements, opinions and data contained in all publications are solely those of the individual author(s) and contributor(s) and not of MDPI and/or the editor(s). MDPI and/or the editor(s) disclaim responsibility for any injury to people or property resulting from any ideas, methods, instructions or products referred to in the content.