


Effect of Monomer Type on the Synthesis and Properties of Poly(Ethylene Furanoate)

 ,
,  ,
,  ,
,  ,
, 
 ,
, 
 and
and 
Abstract
1. Introduction
2. Materials and Methods
2.1. Materials
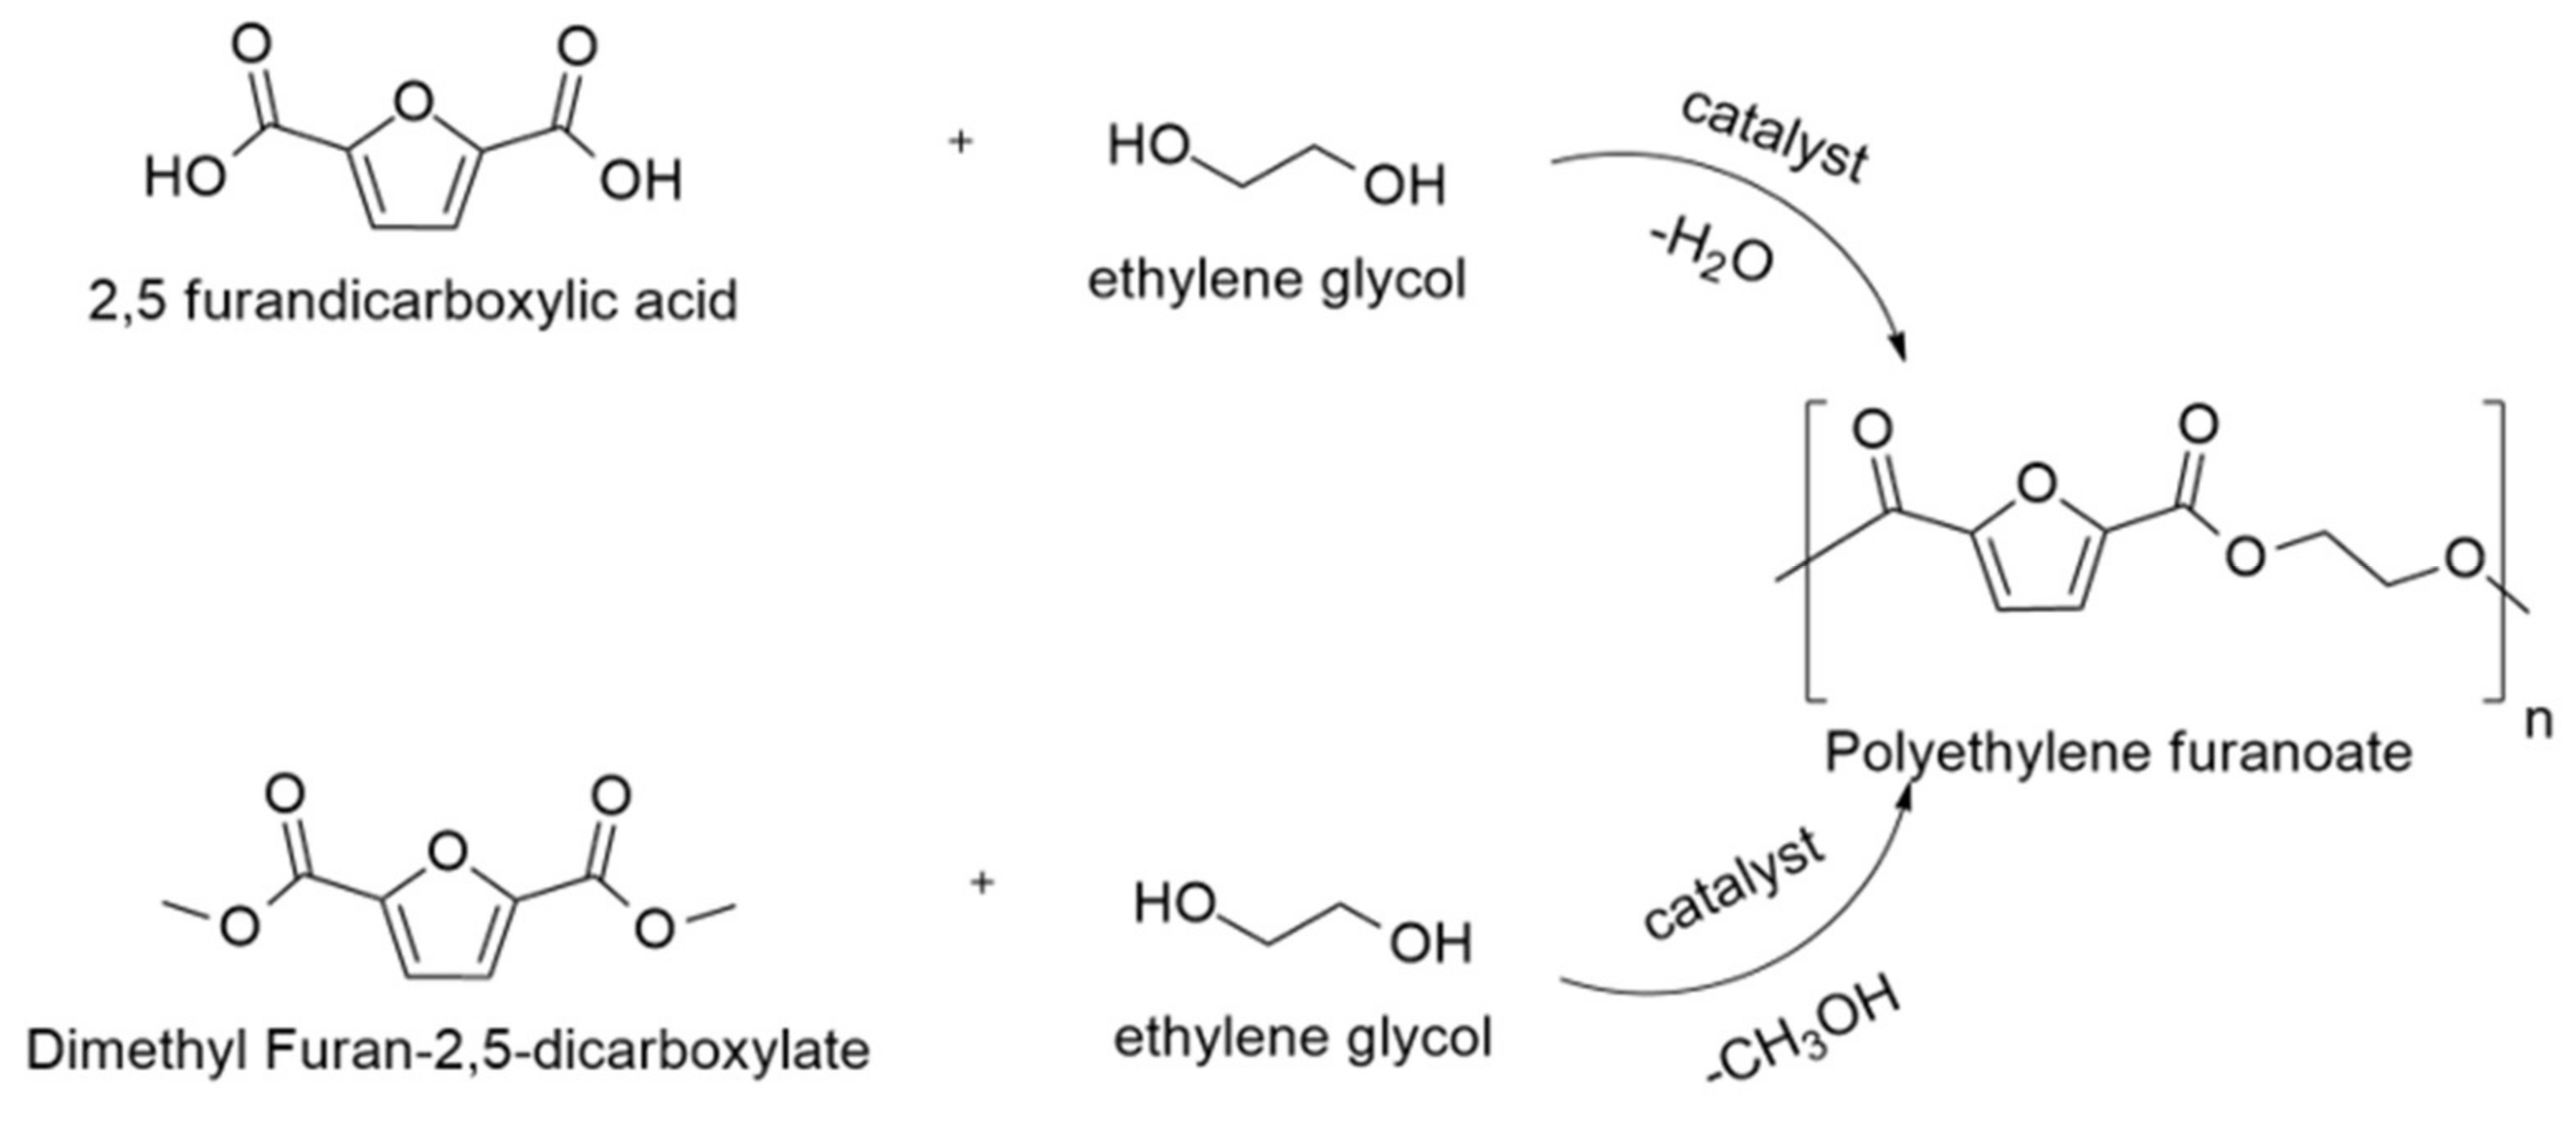
2.2. Synthesis of PEF Using Dimethyl 2,5-Furandicarboxylate (DMFD)
2.3. Synthesis of Polyester Using 2,5-Furandicarboxylic Acid (FDCA)
2.4. Characterization
2.4.1. Nuclear Magnetic Resonance (NMR)
2.4.2. Attenuated Total Reflection (ATR)
2.4.3. Intrinsic Viscosity Measurement
2.4.4. Color Measurements
2.4.5. Differential Scanning Calorimetry
2.4.6. X-ray Diffraction
2.4.7. Broadband Dielectric Spectroscopy
2.4.8. Polarized Light Microscopy
2.4.9. Contact Angle
2.4.10. Oxygen Permeability
2.4.11. Nanoindentation Tests
3. Results and Discussion
3.1. Synthesis of PEF Starting from Different Monomers
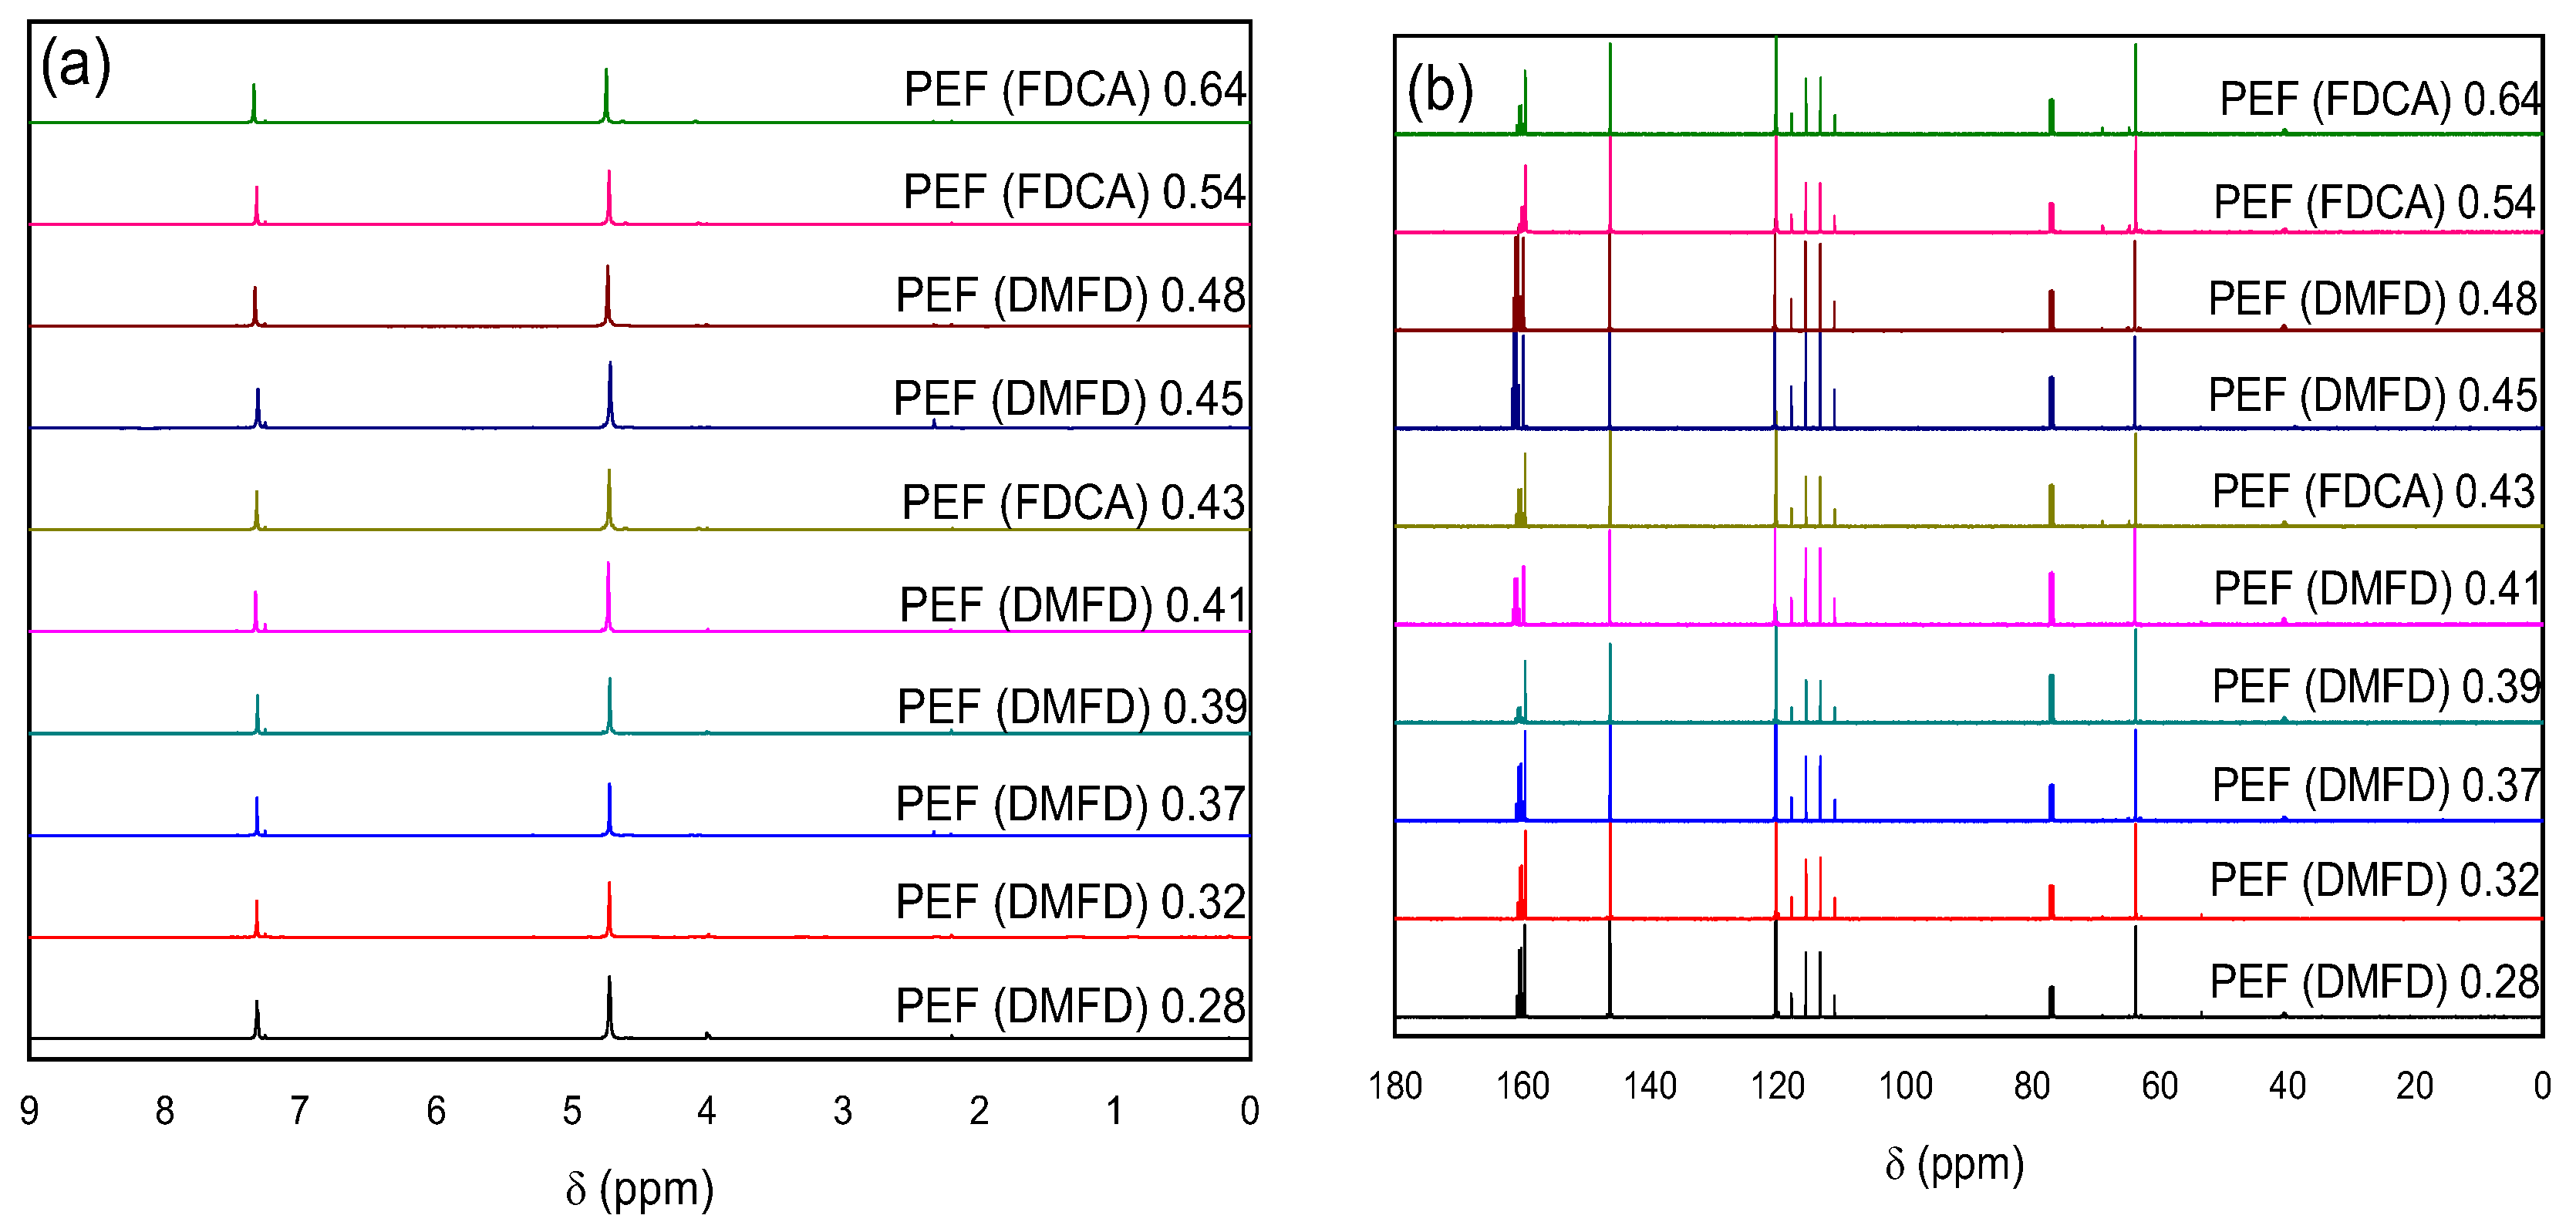
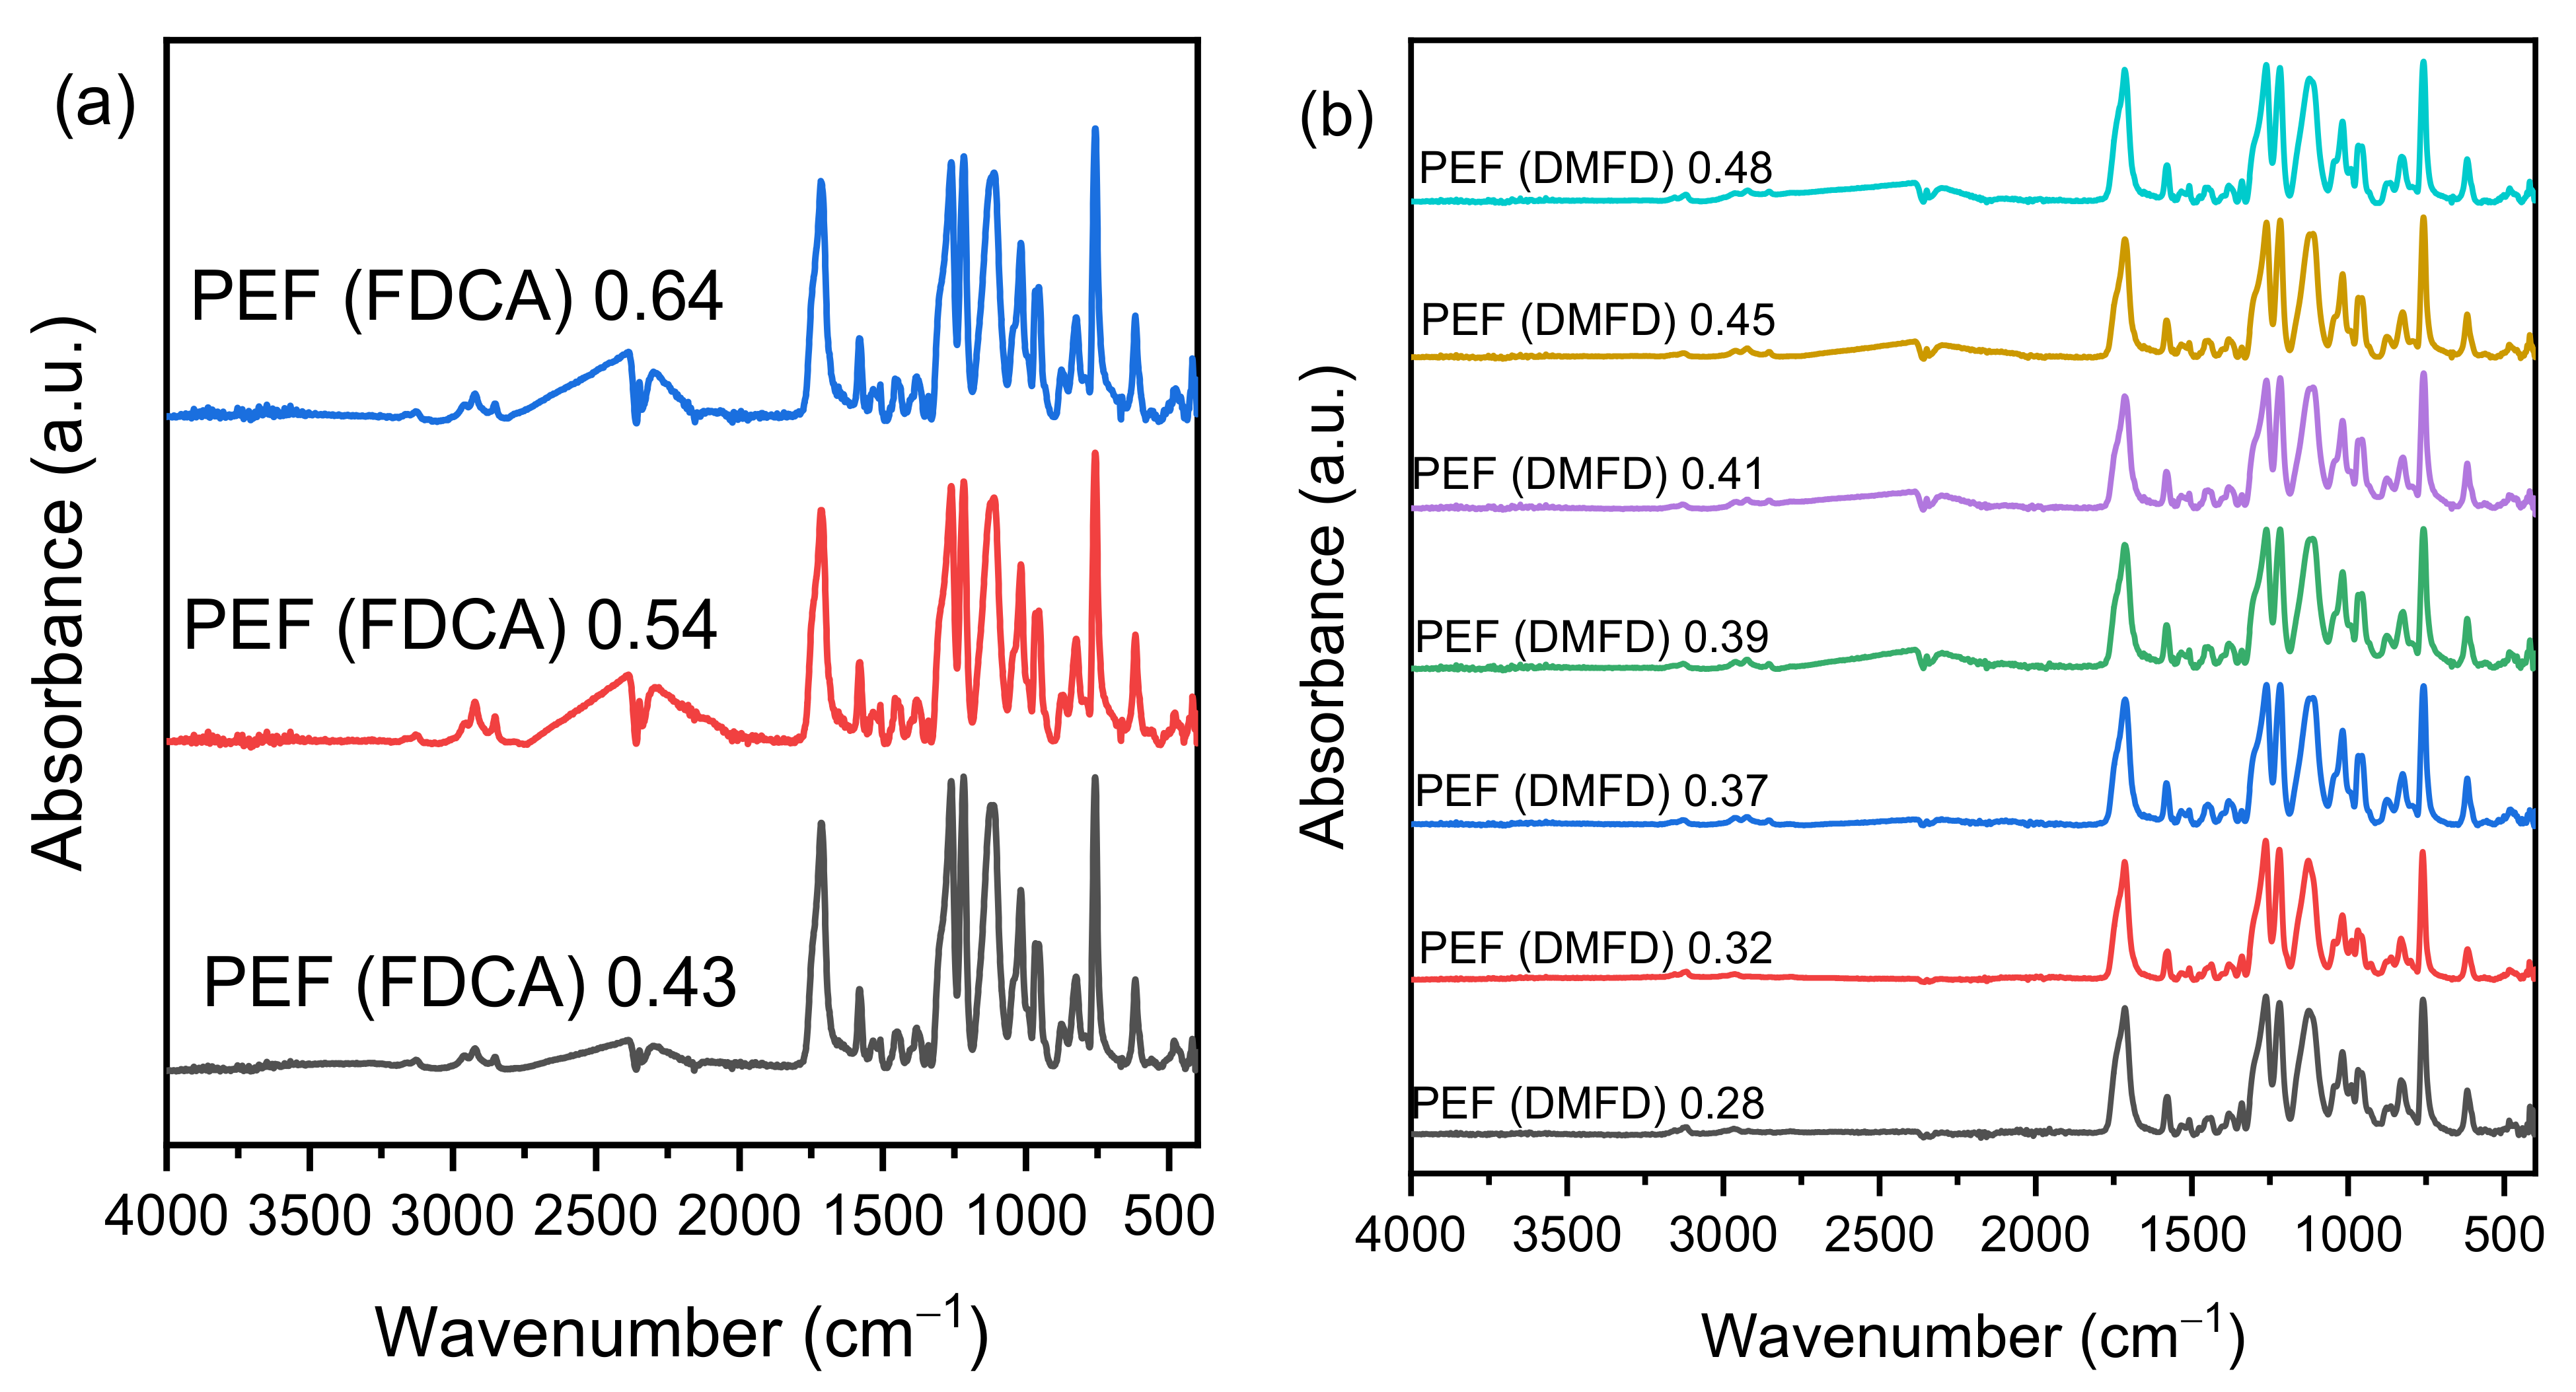
3.2. NMR and ATR Spectroscopy
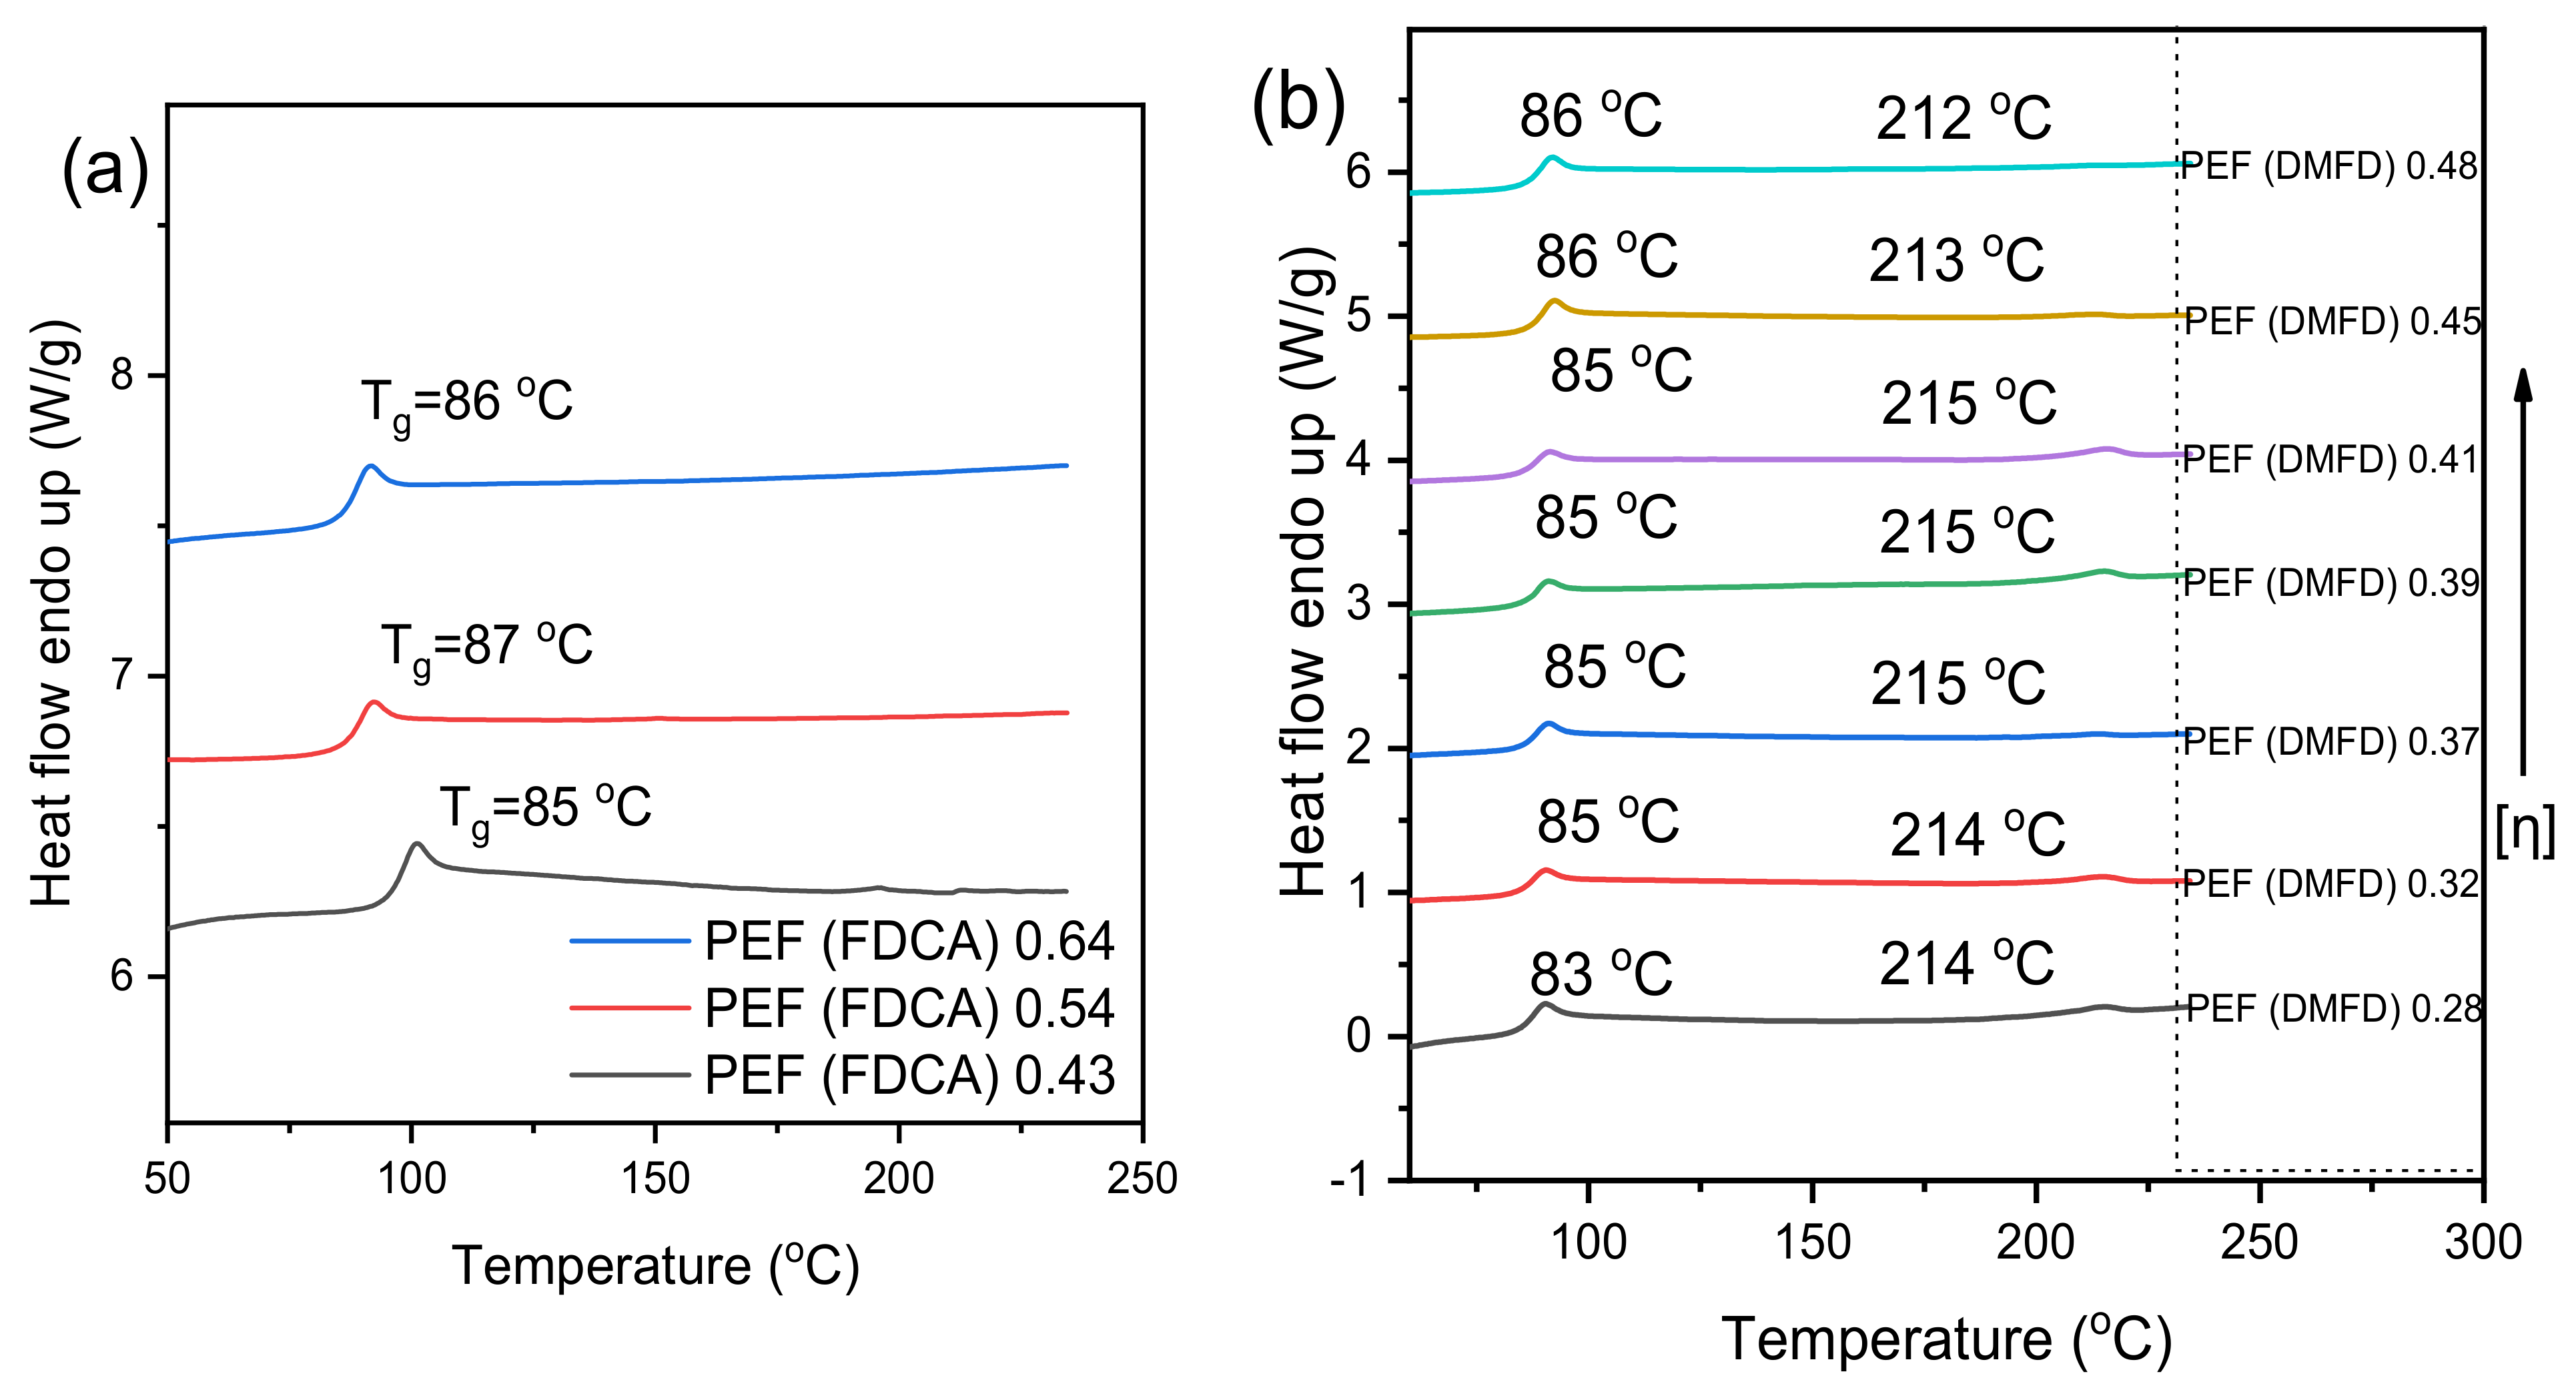
3.3. Thermal Properties and Crystallinity
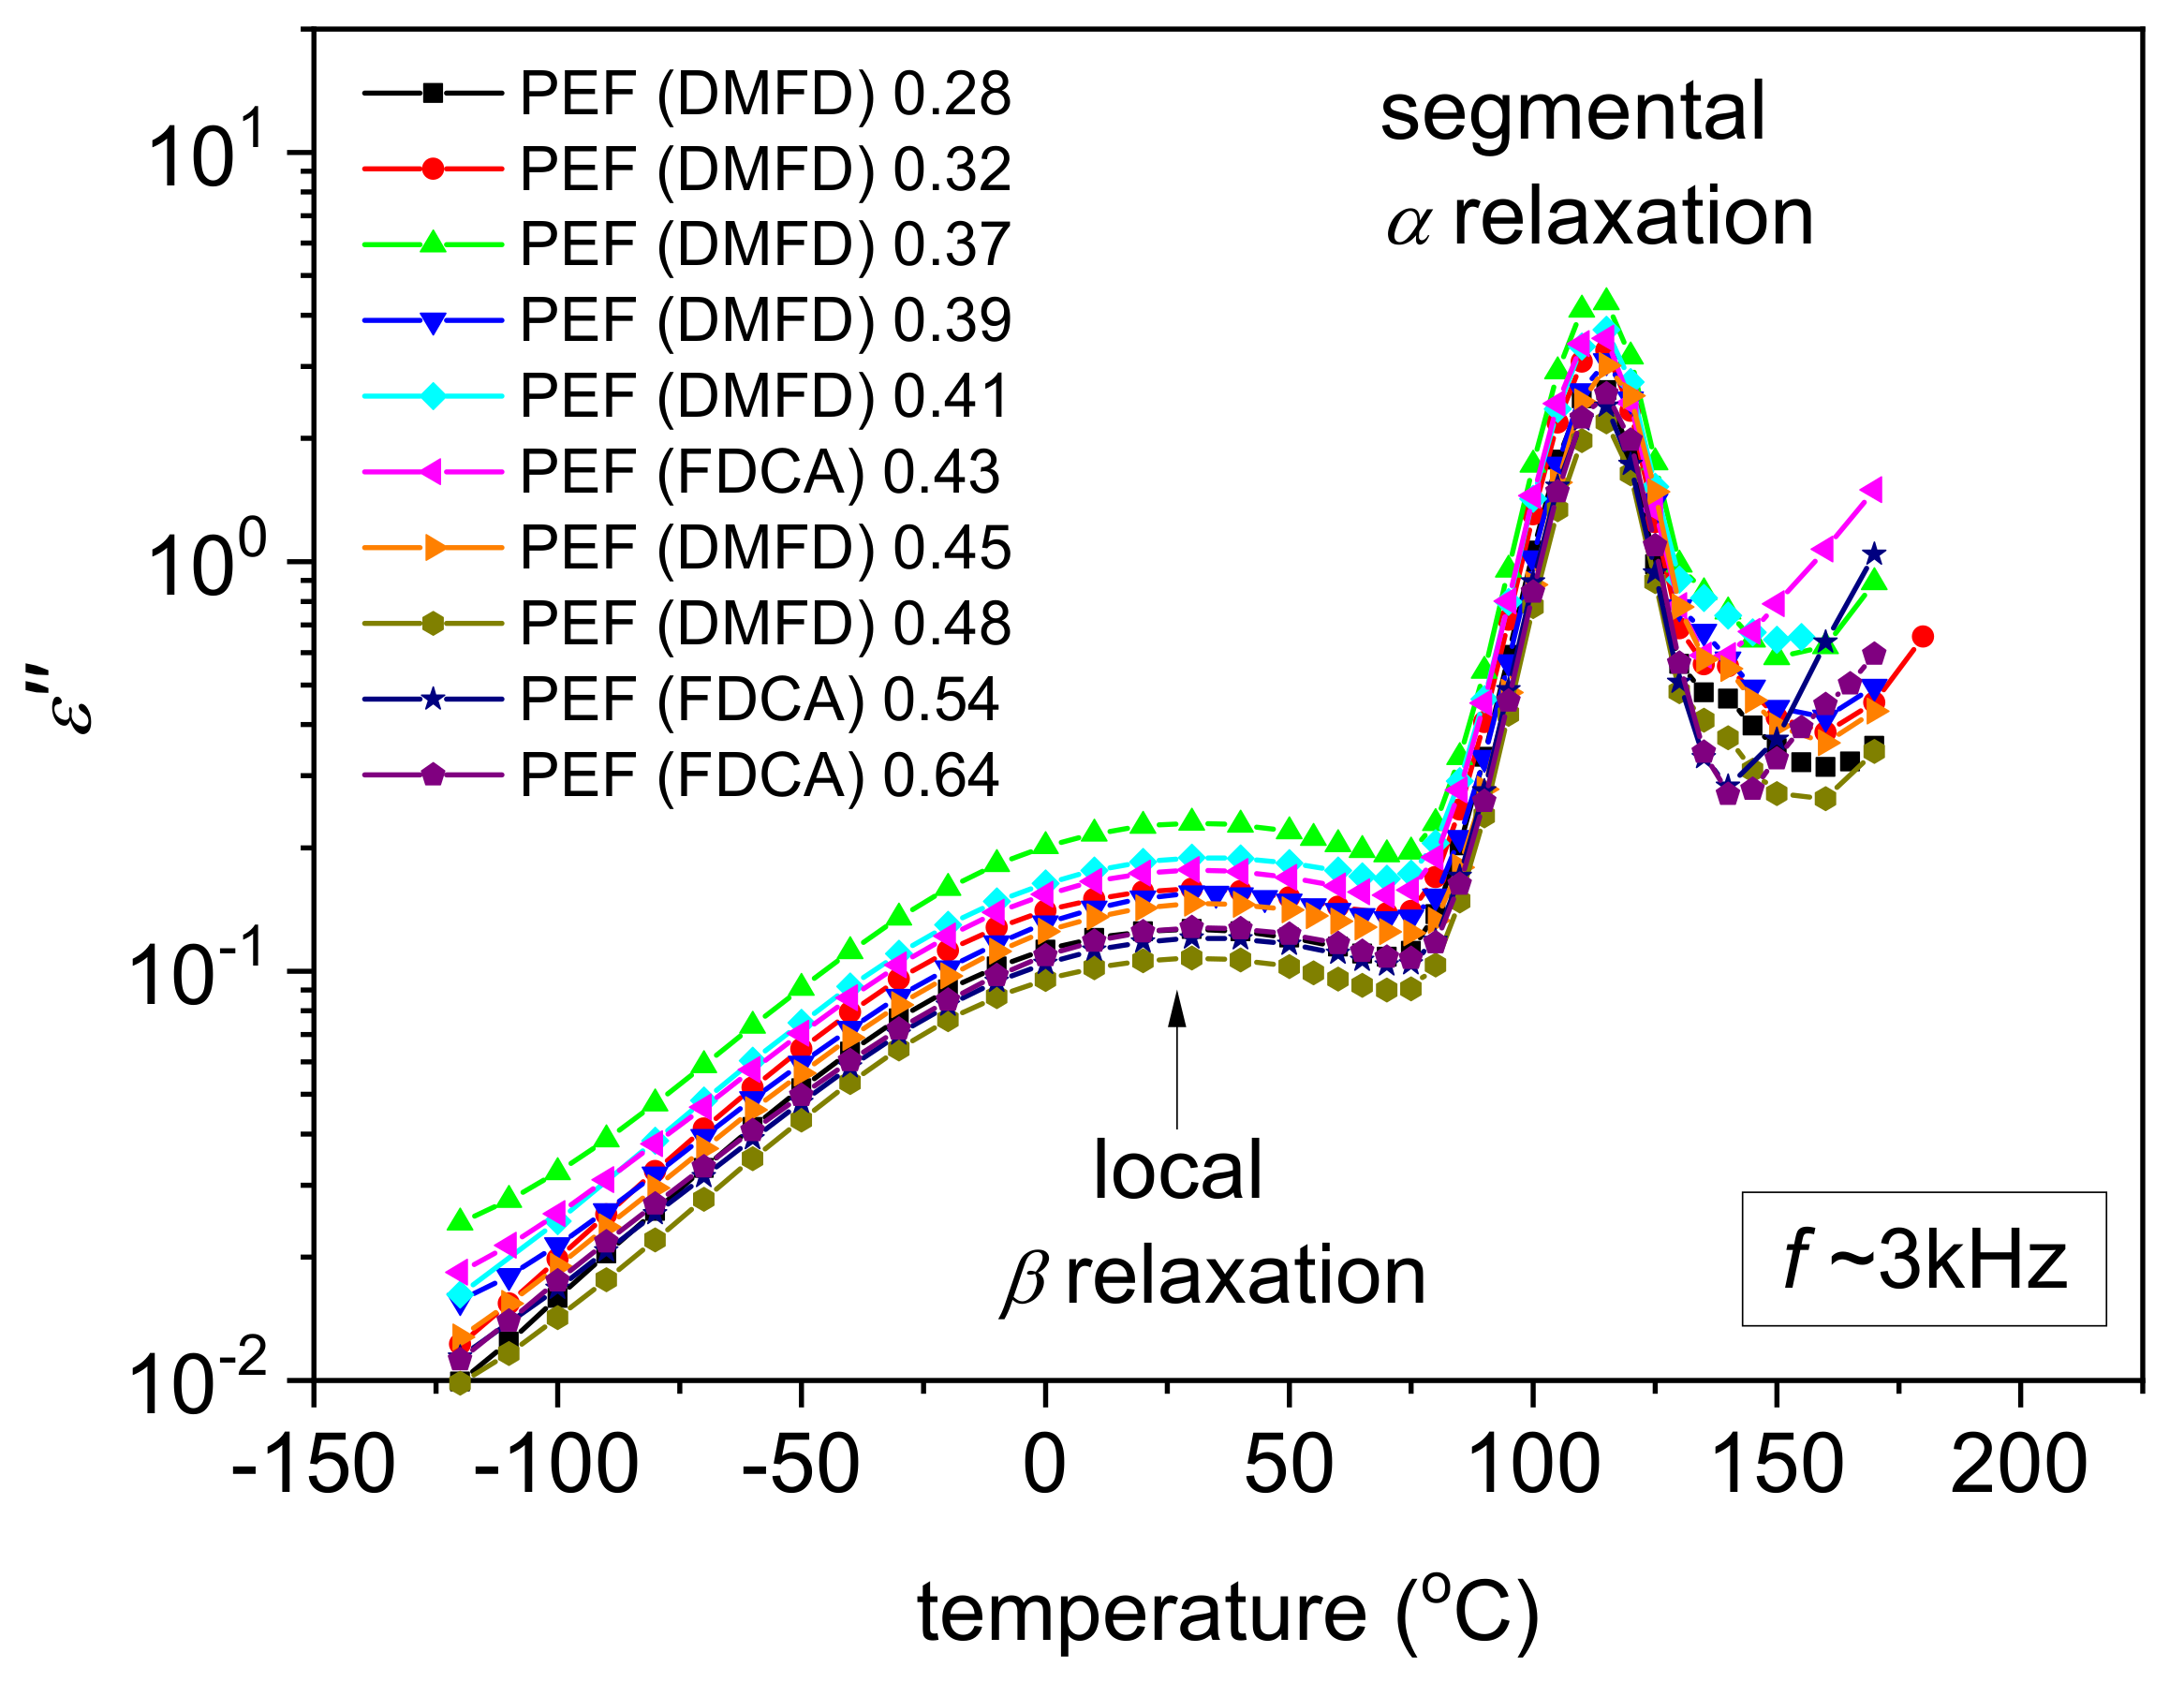
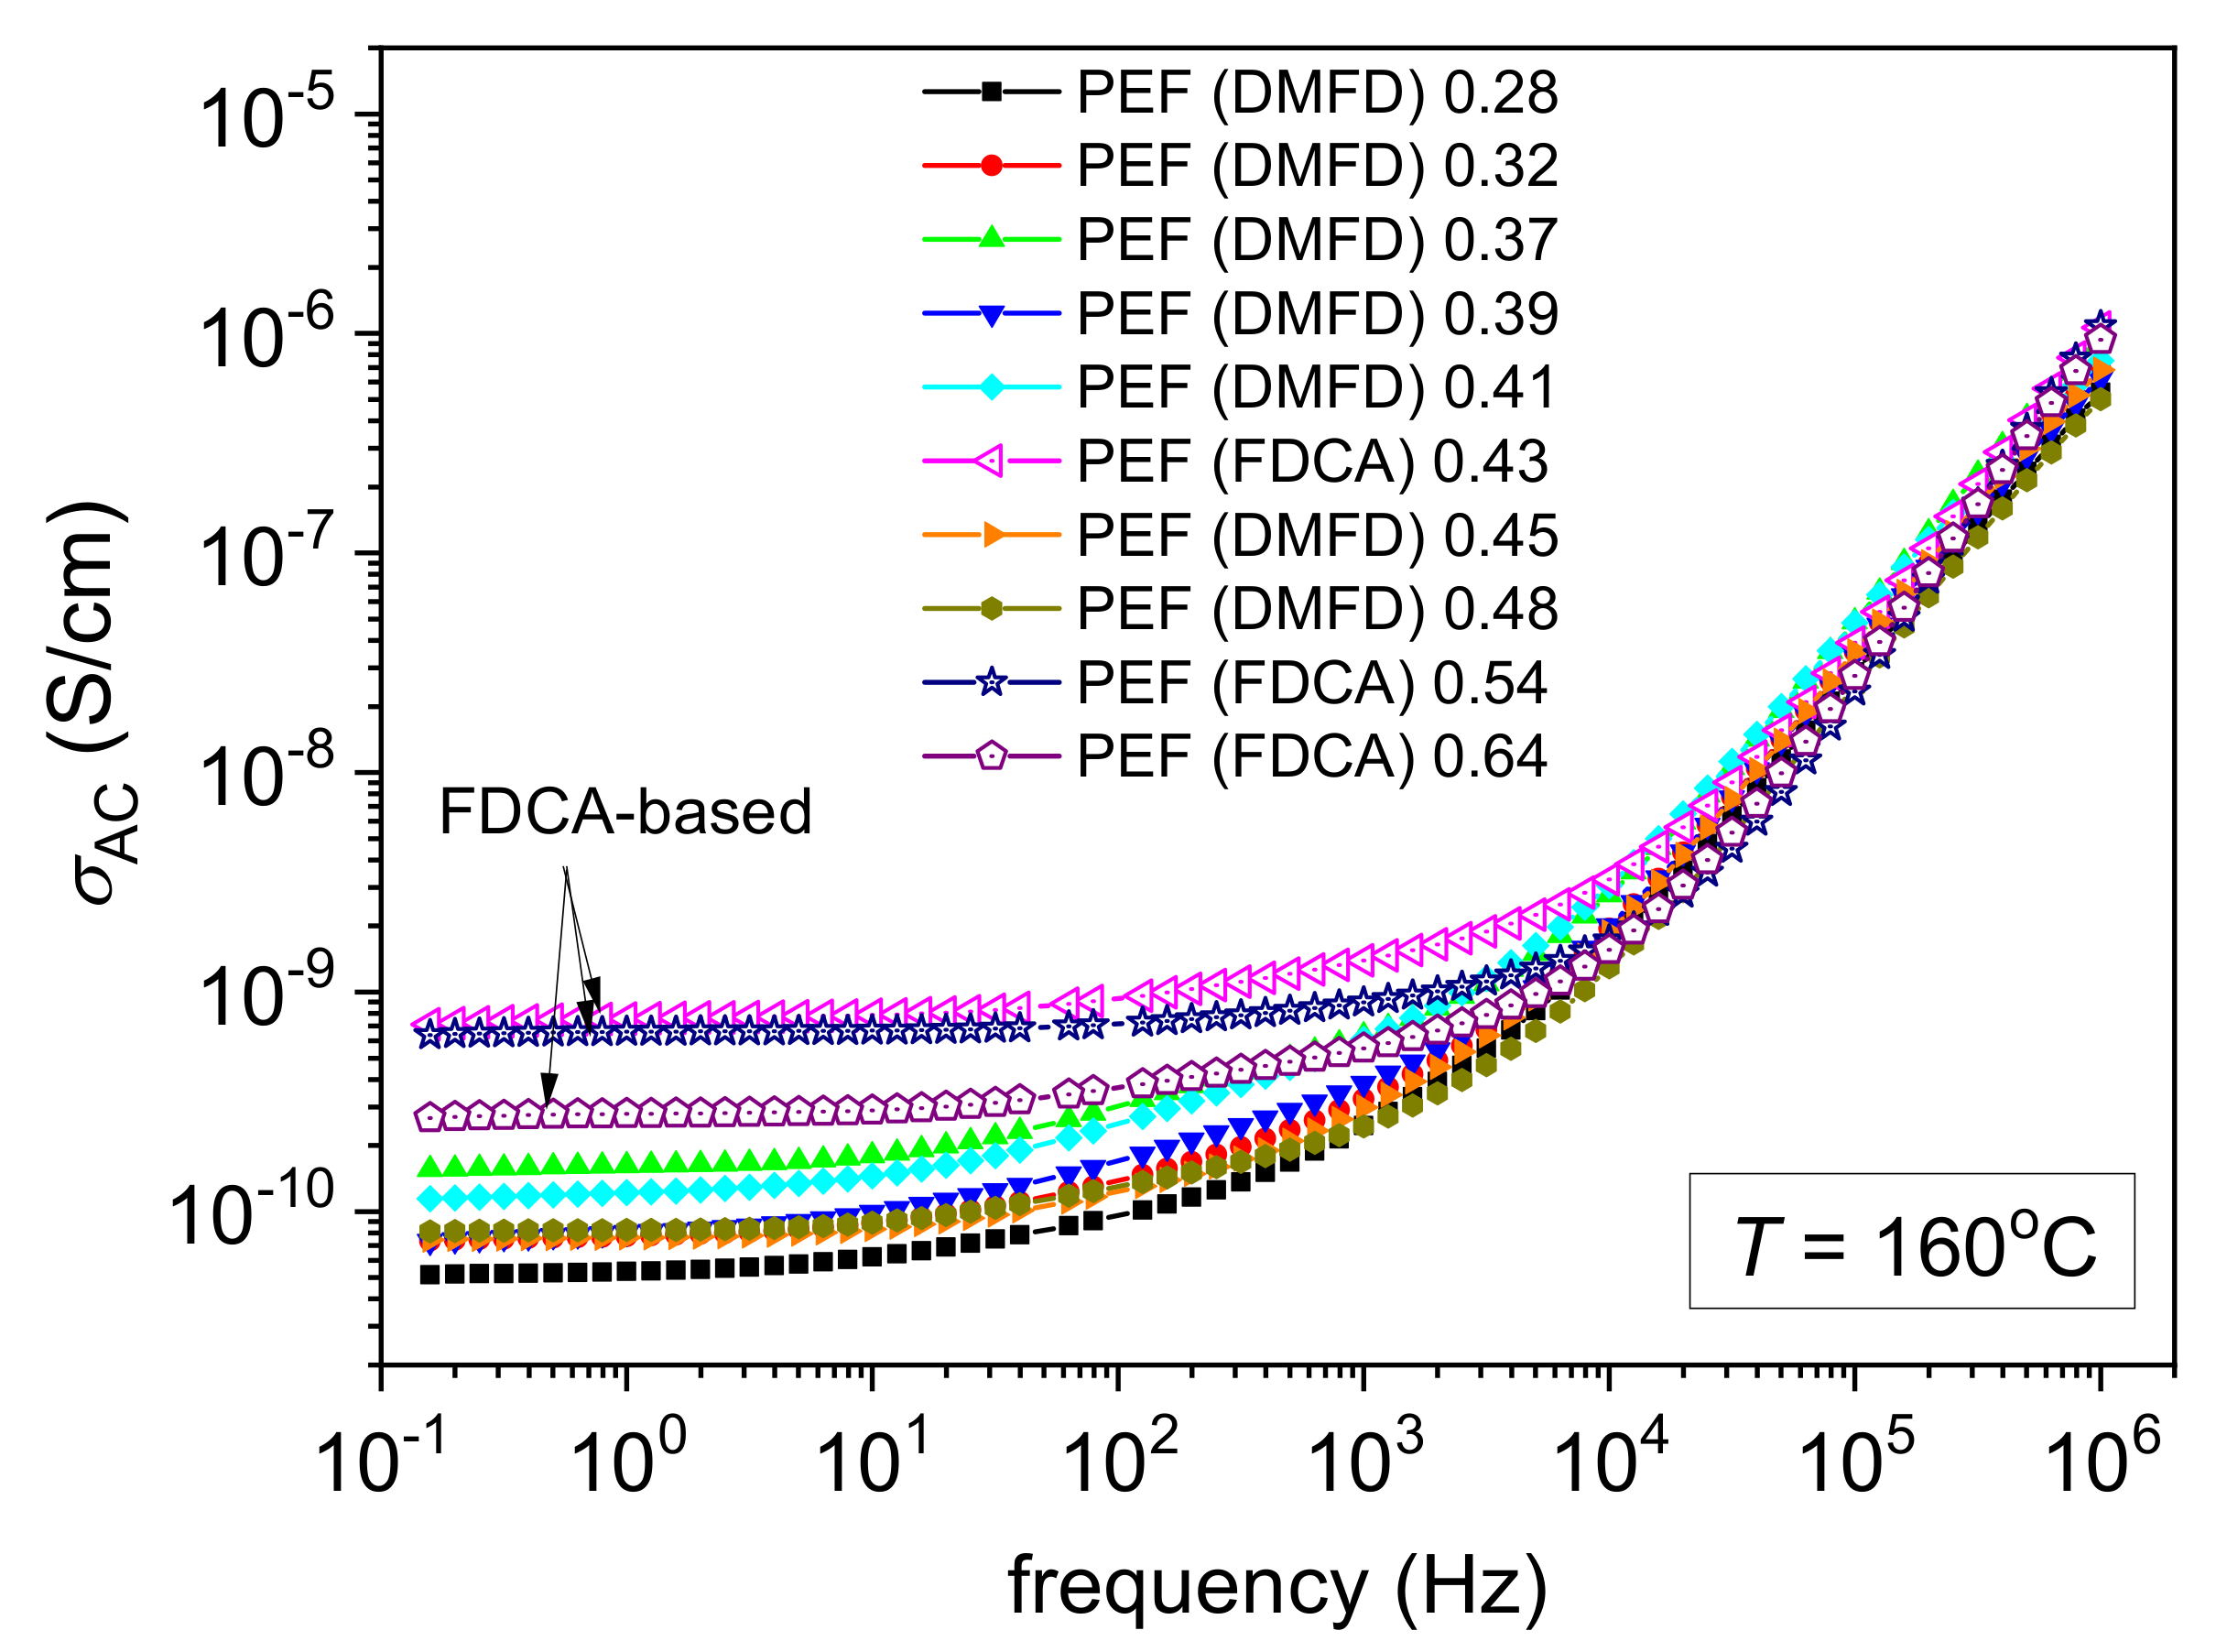
3.4. Molecular Mobility and Ionic Conductivity (BDS)
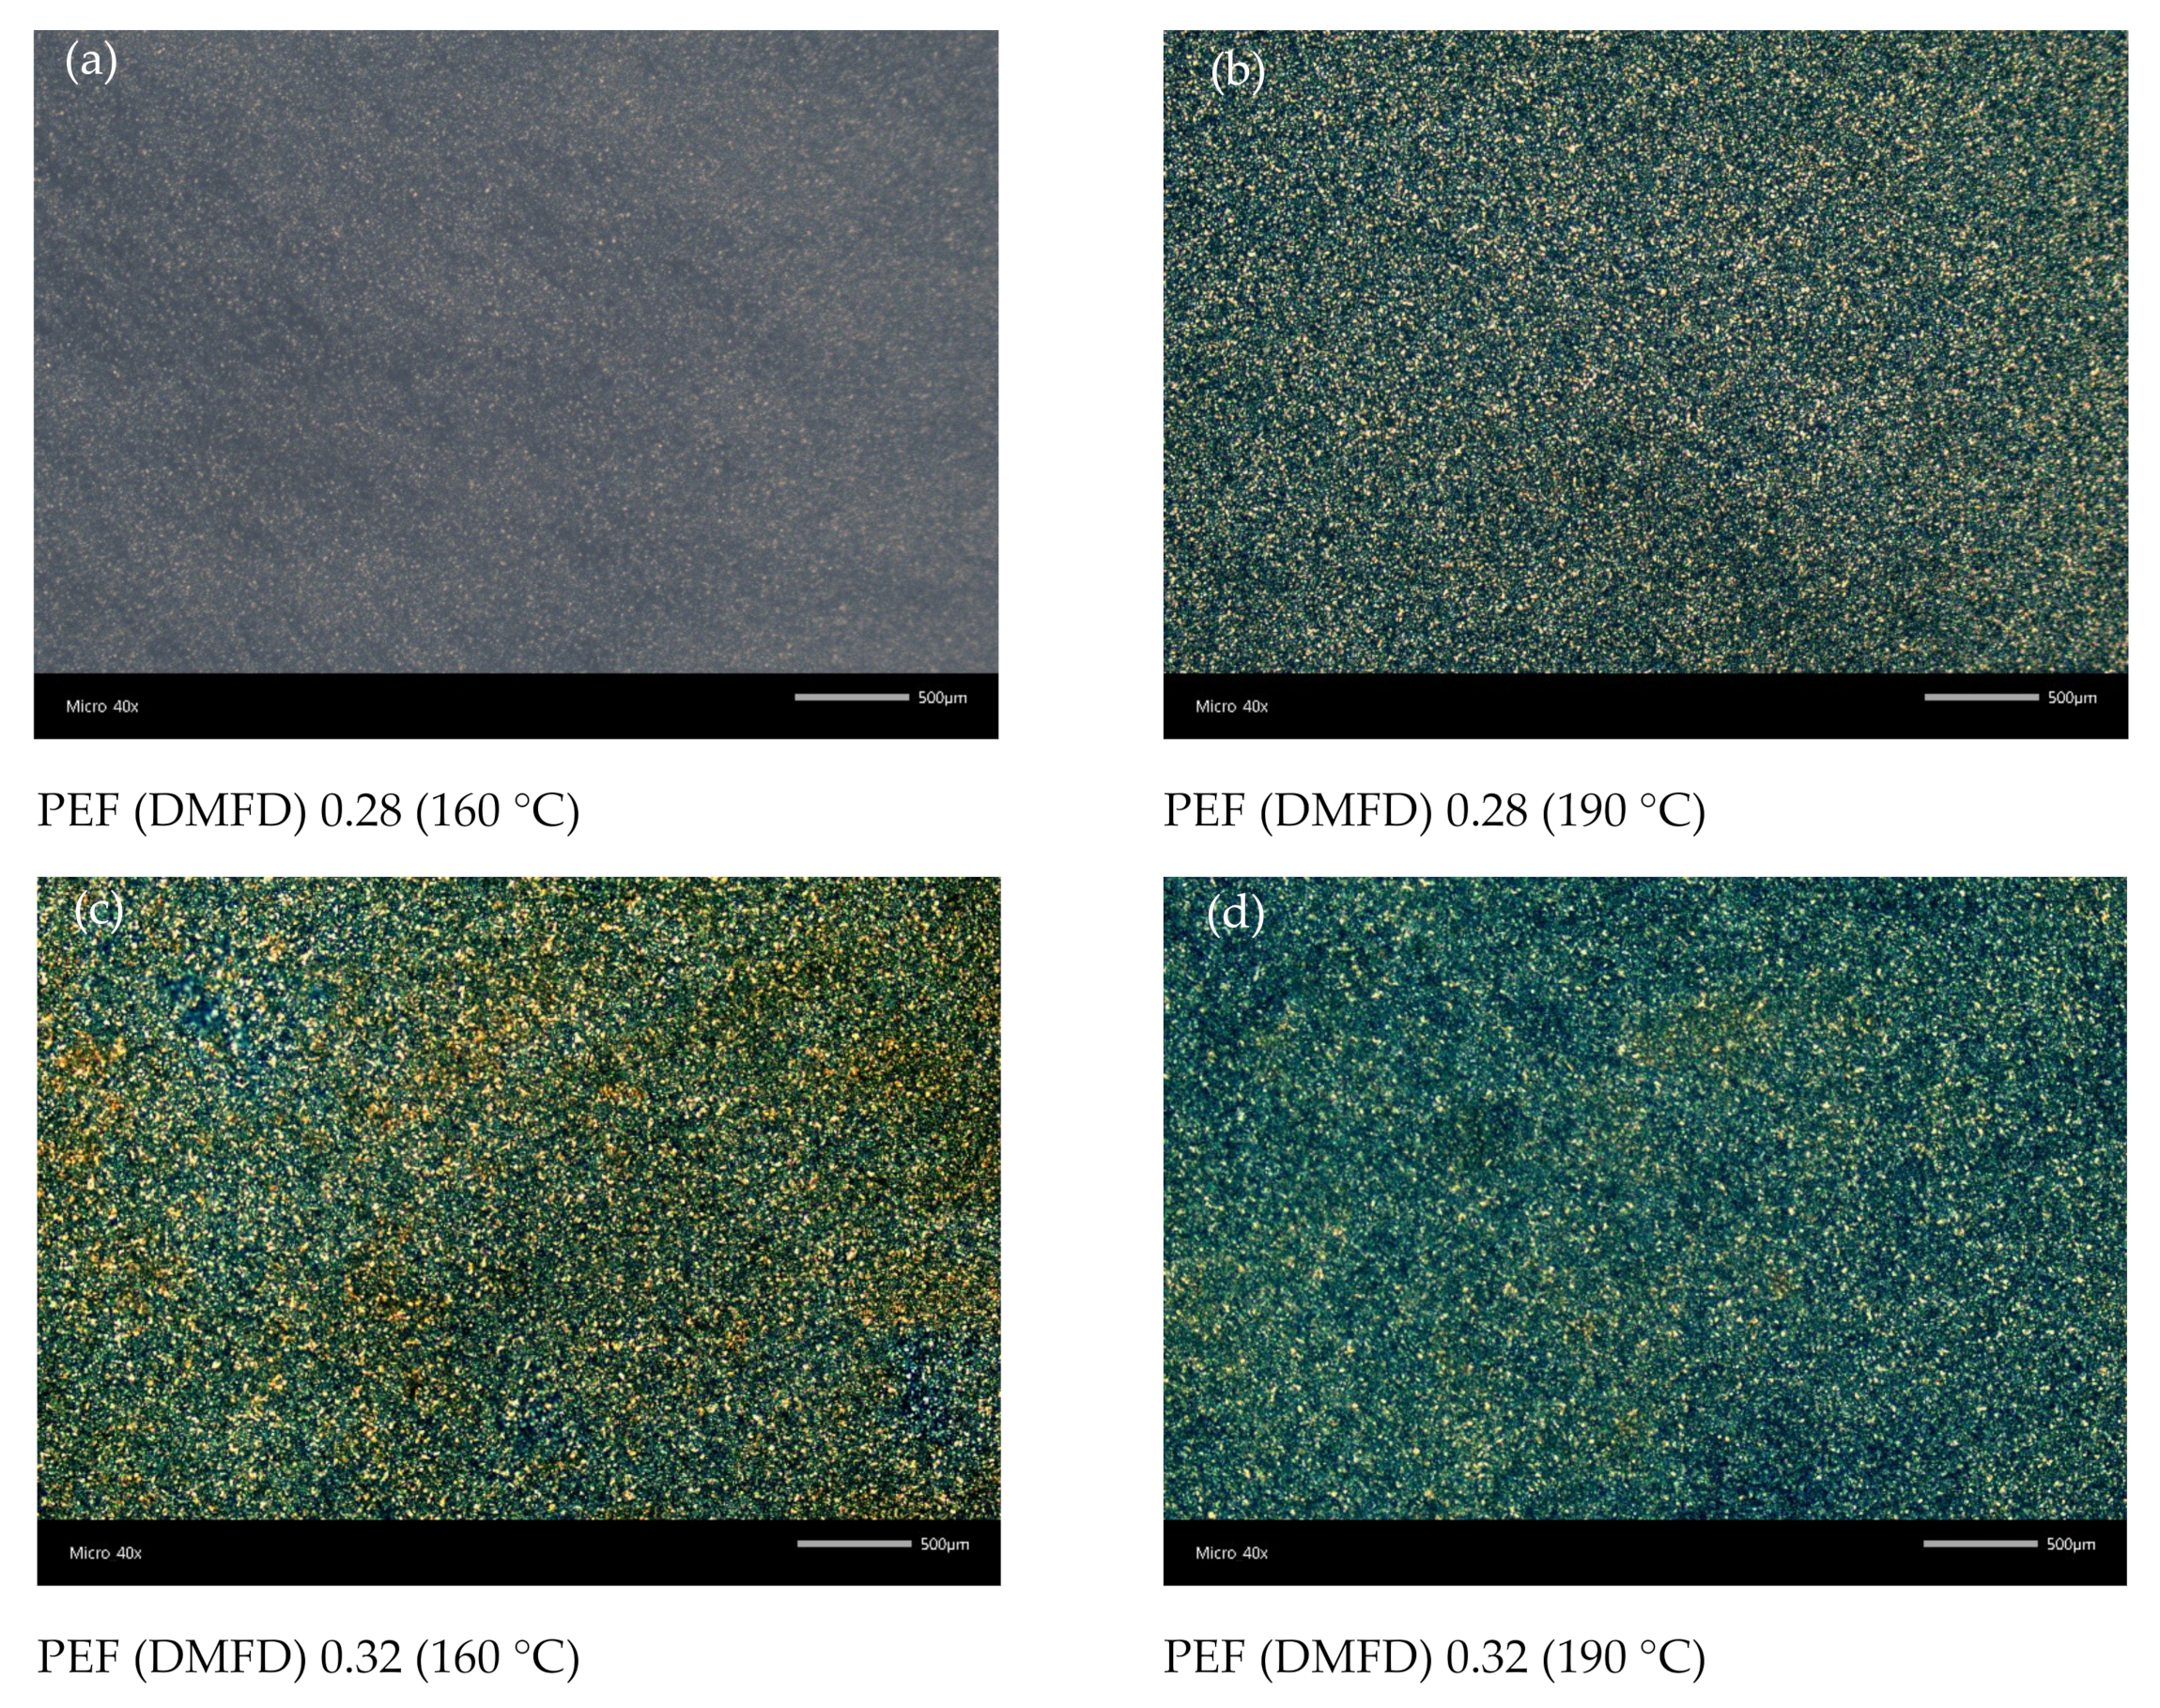
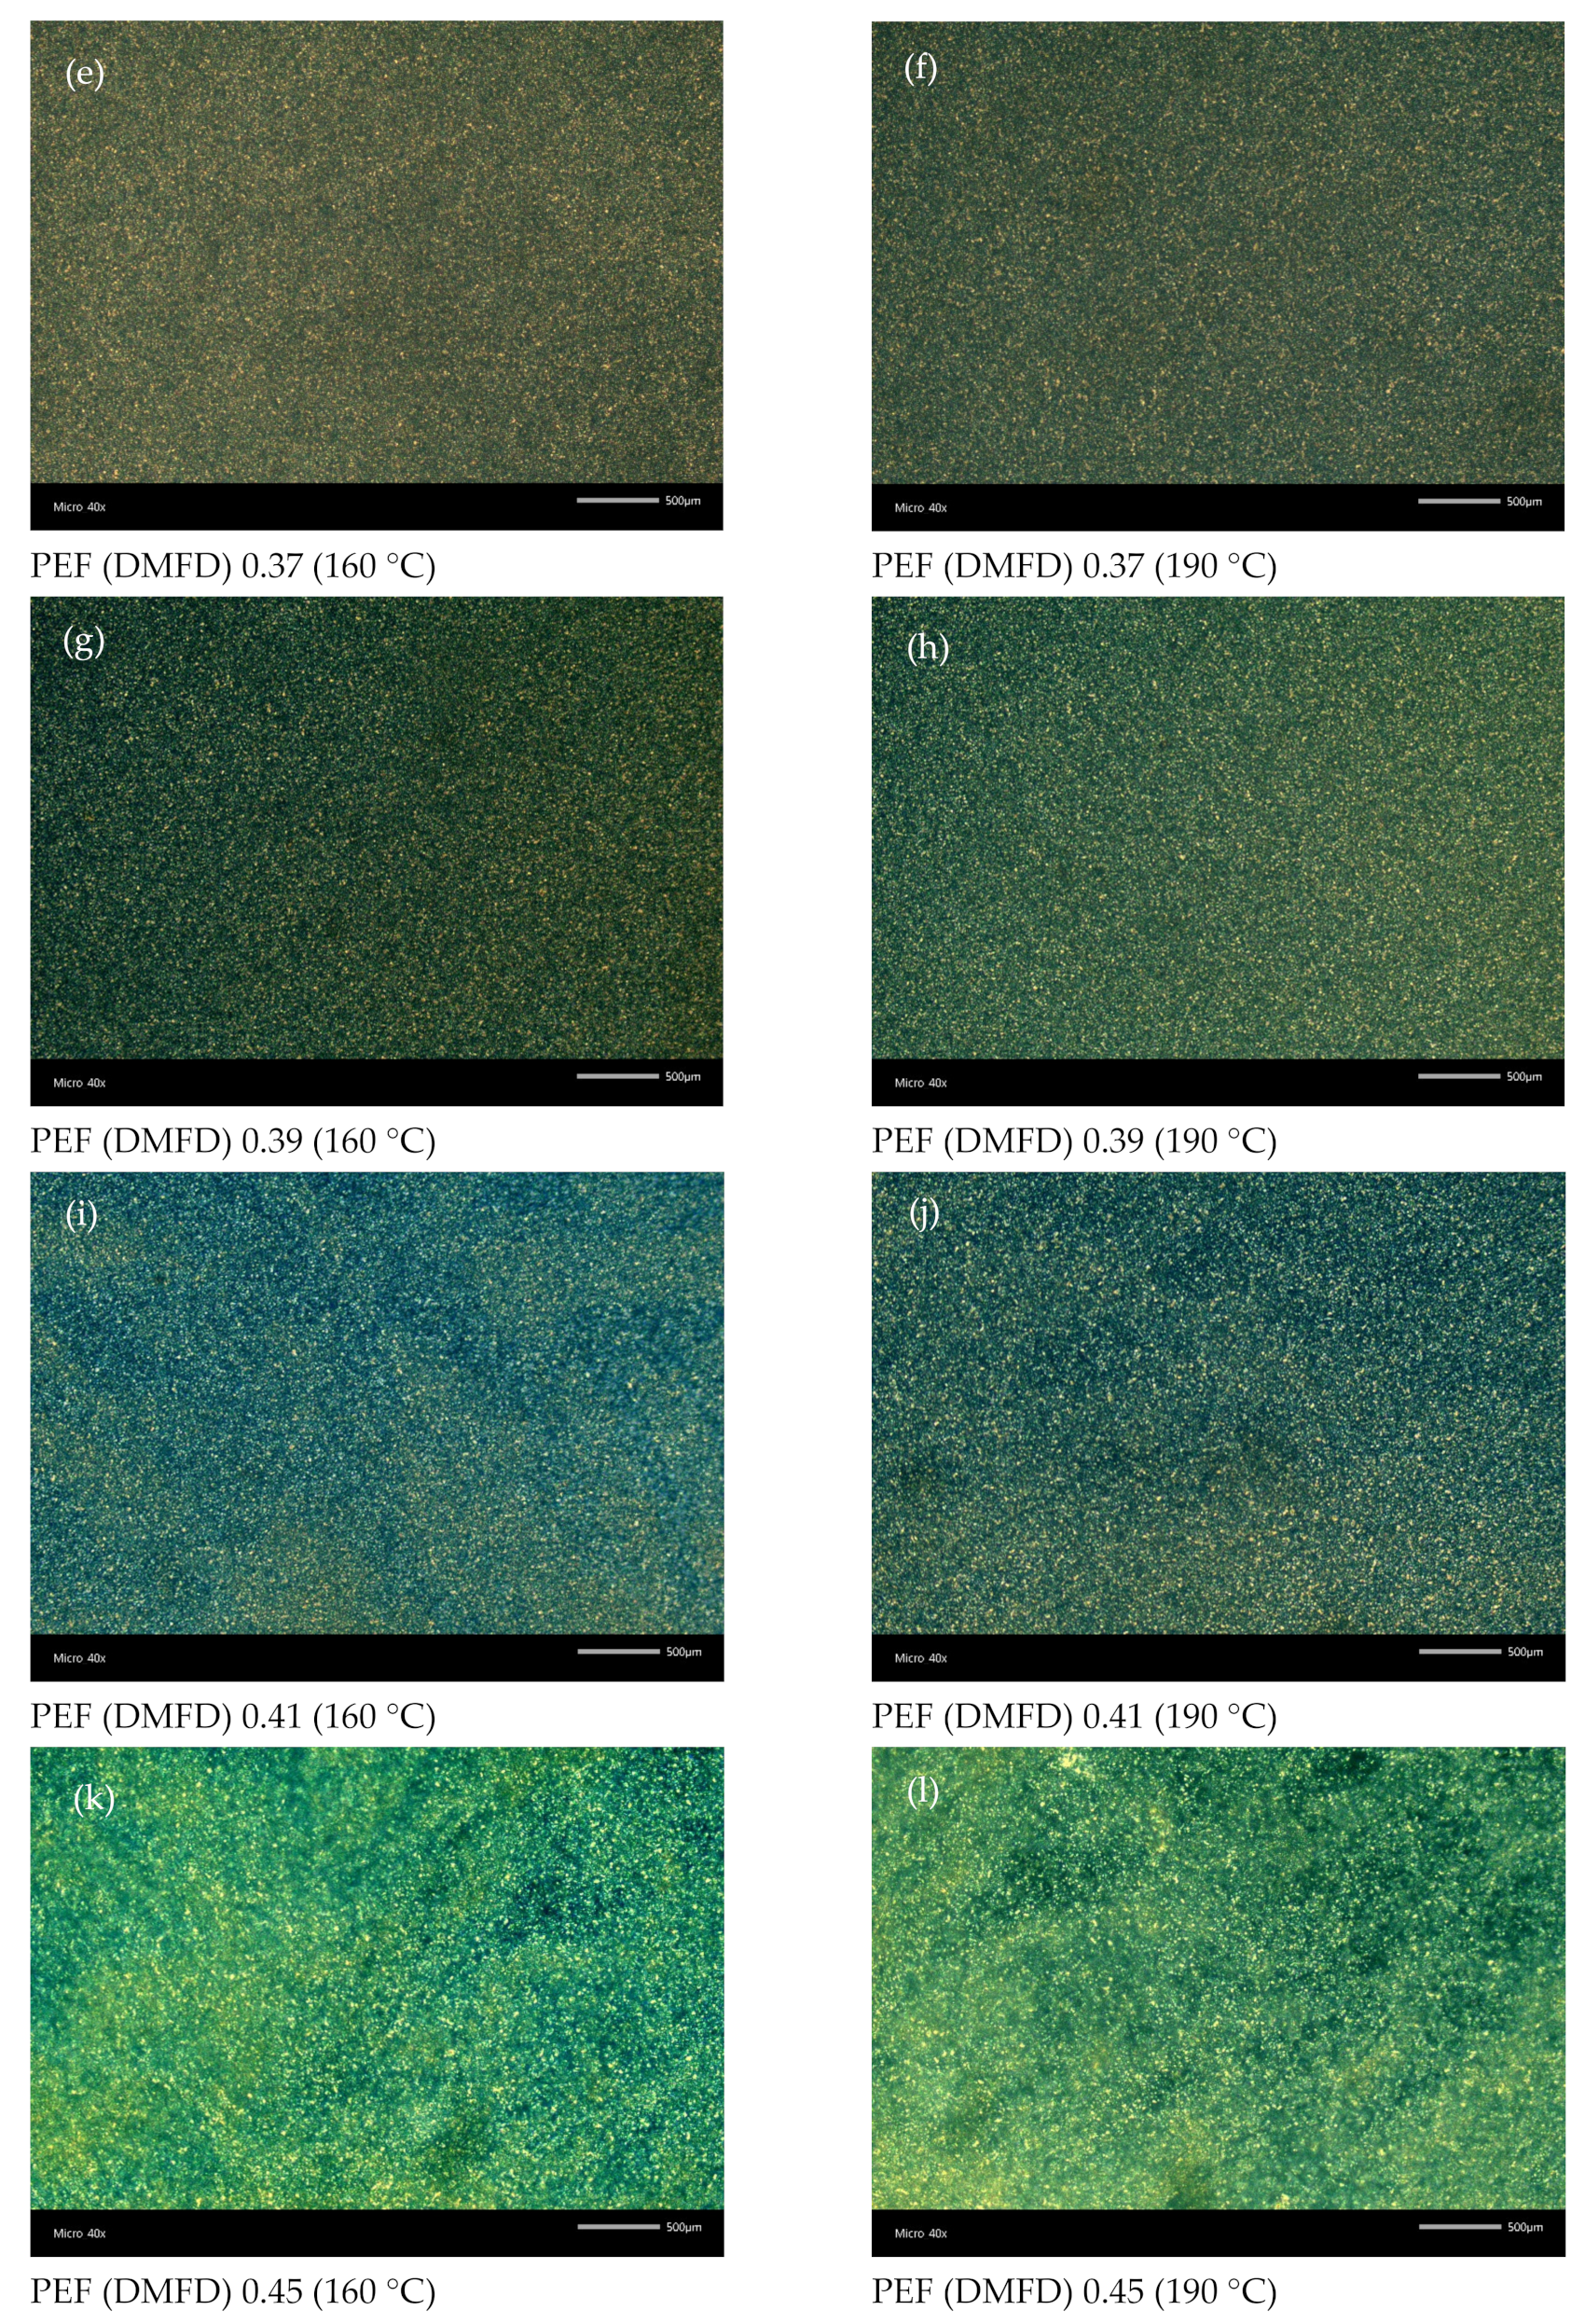
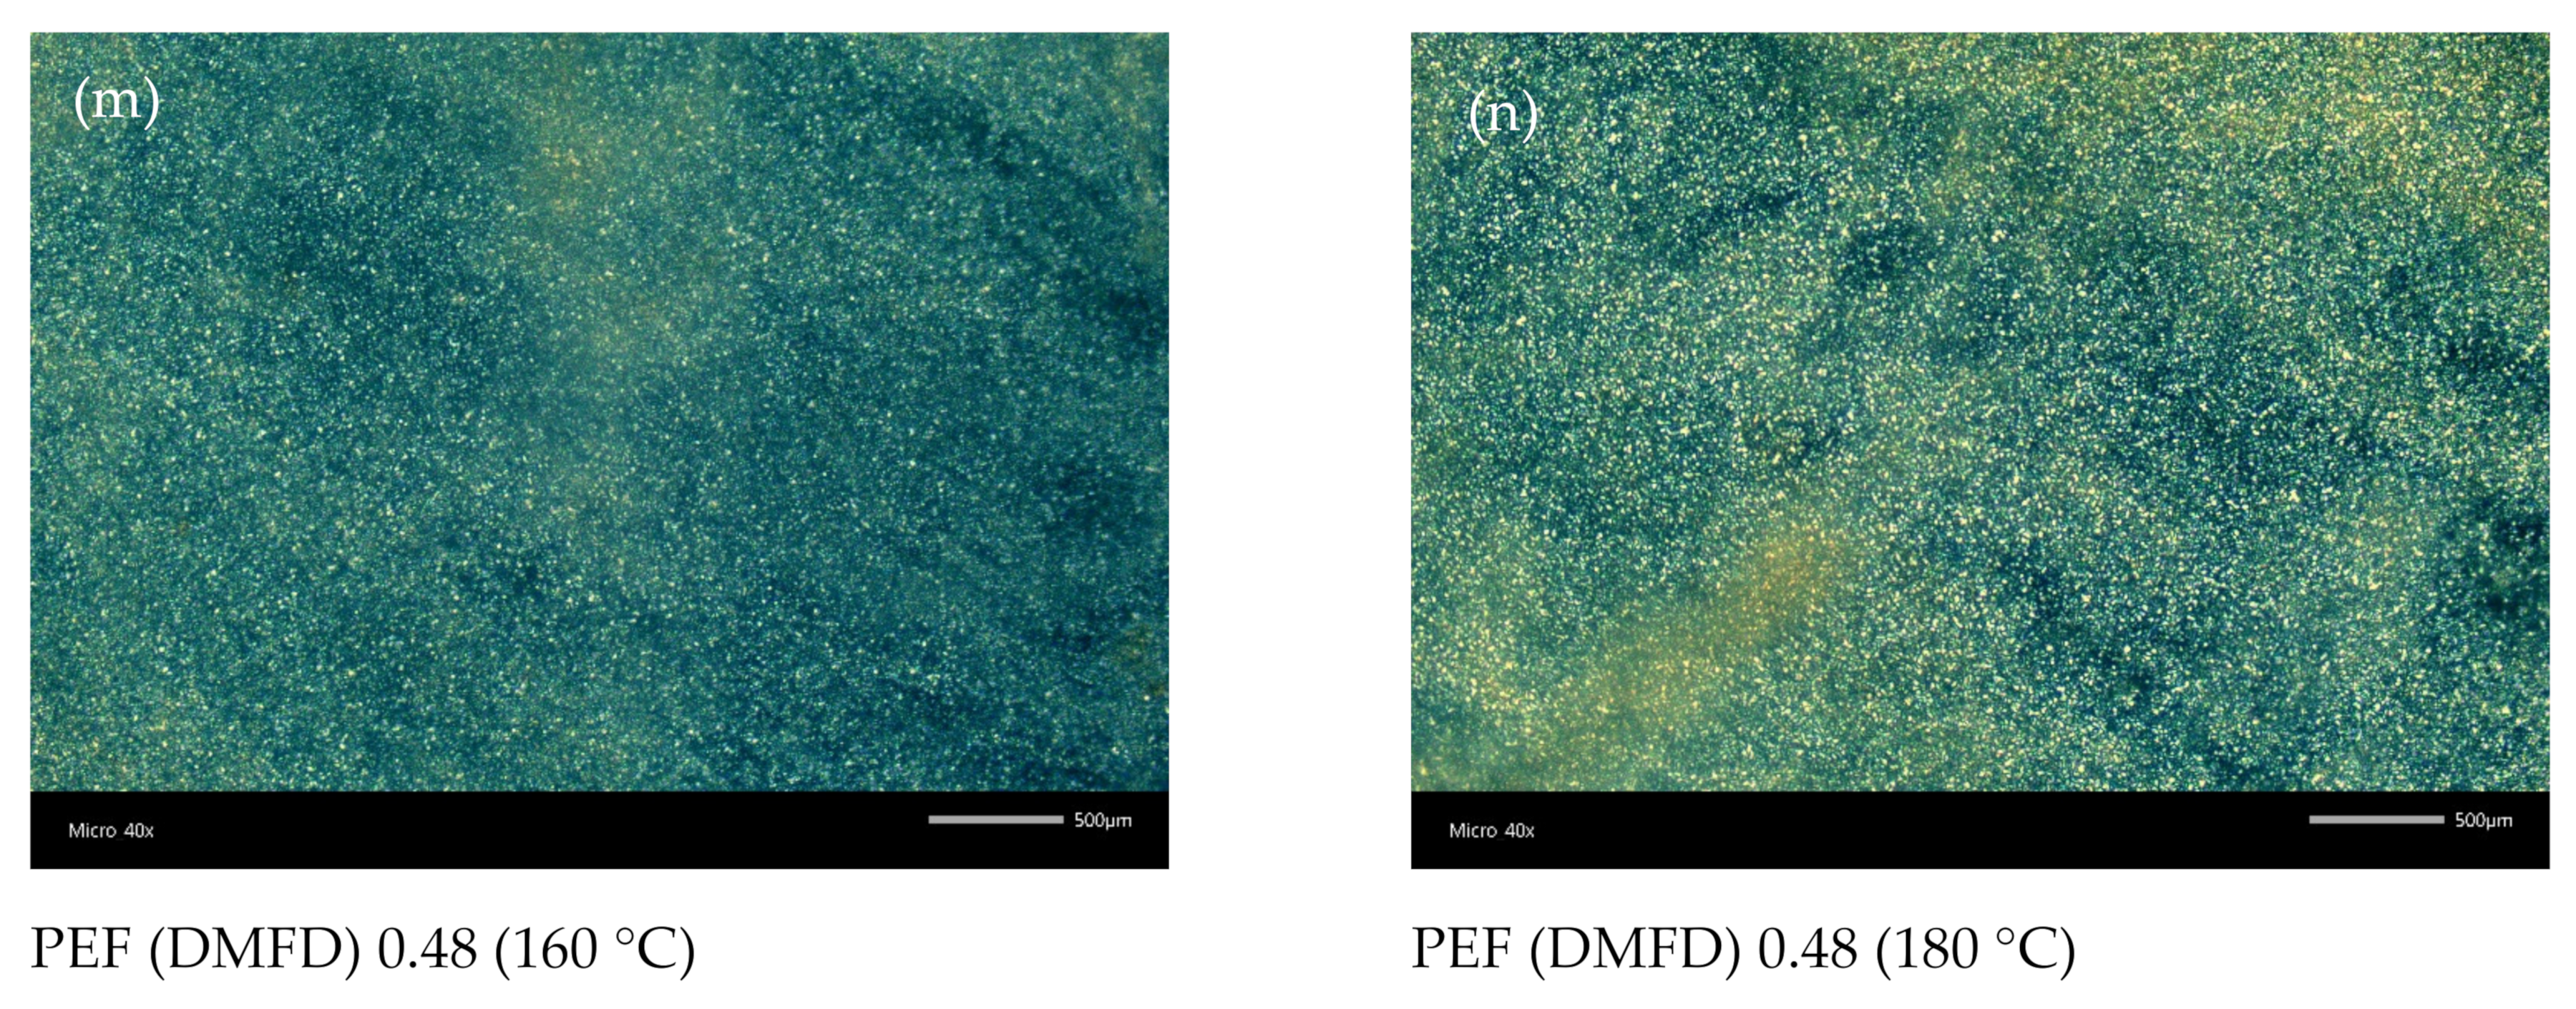
3.5. Polarized Light Microscopy
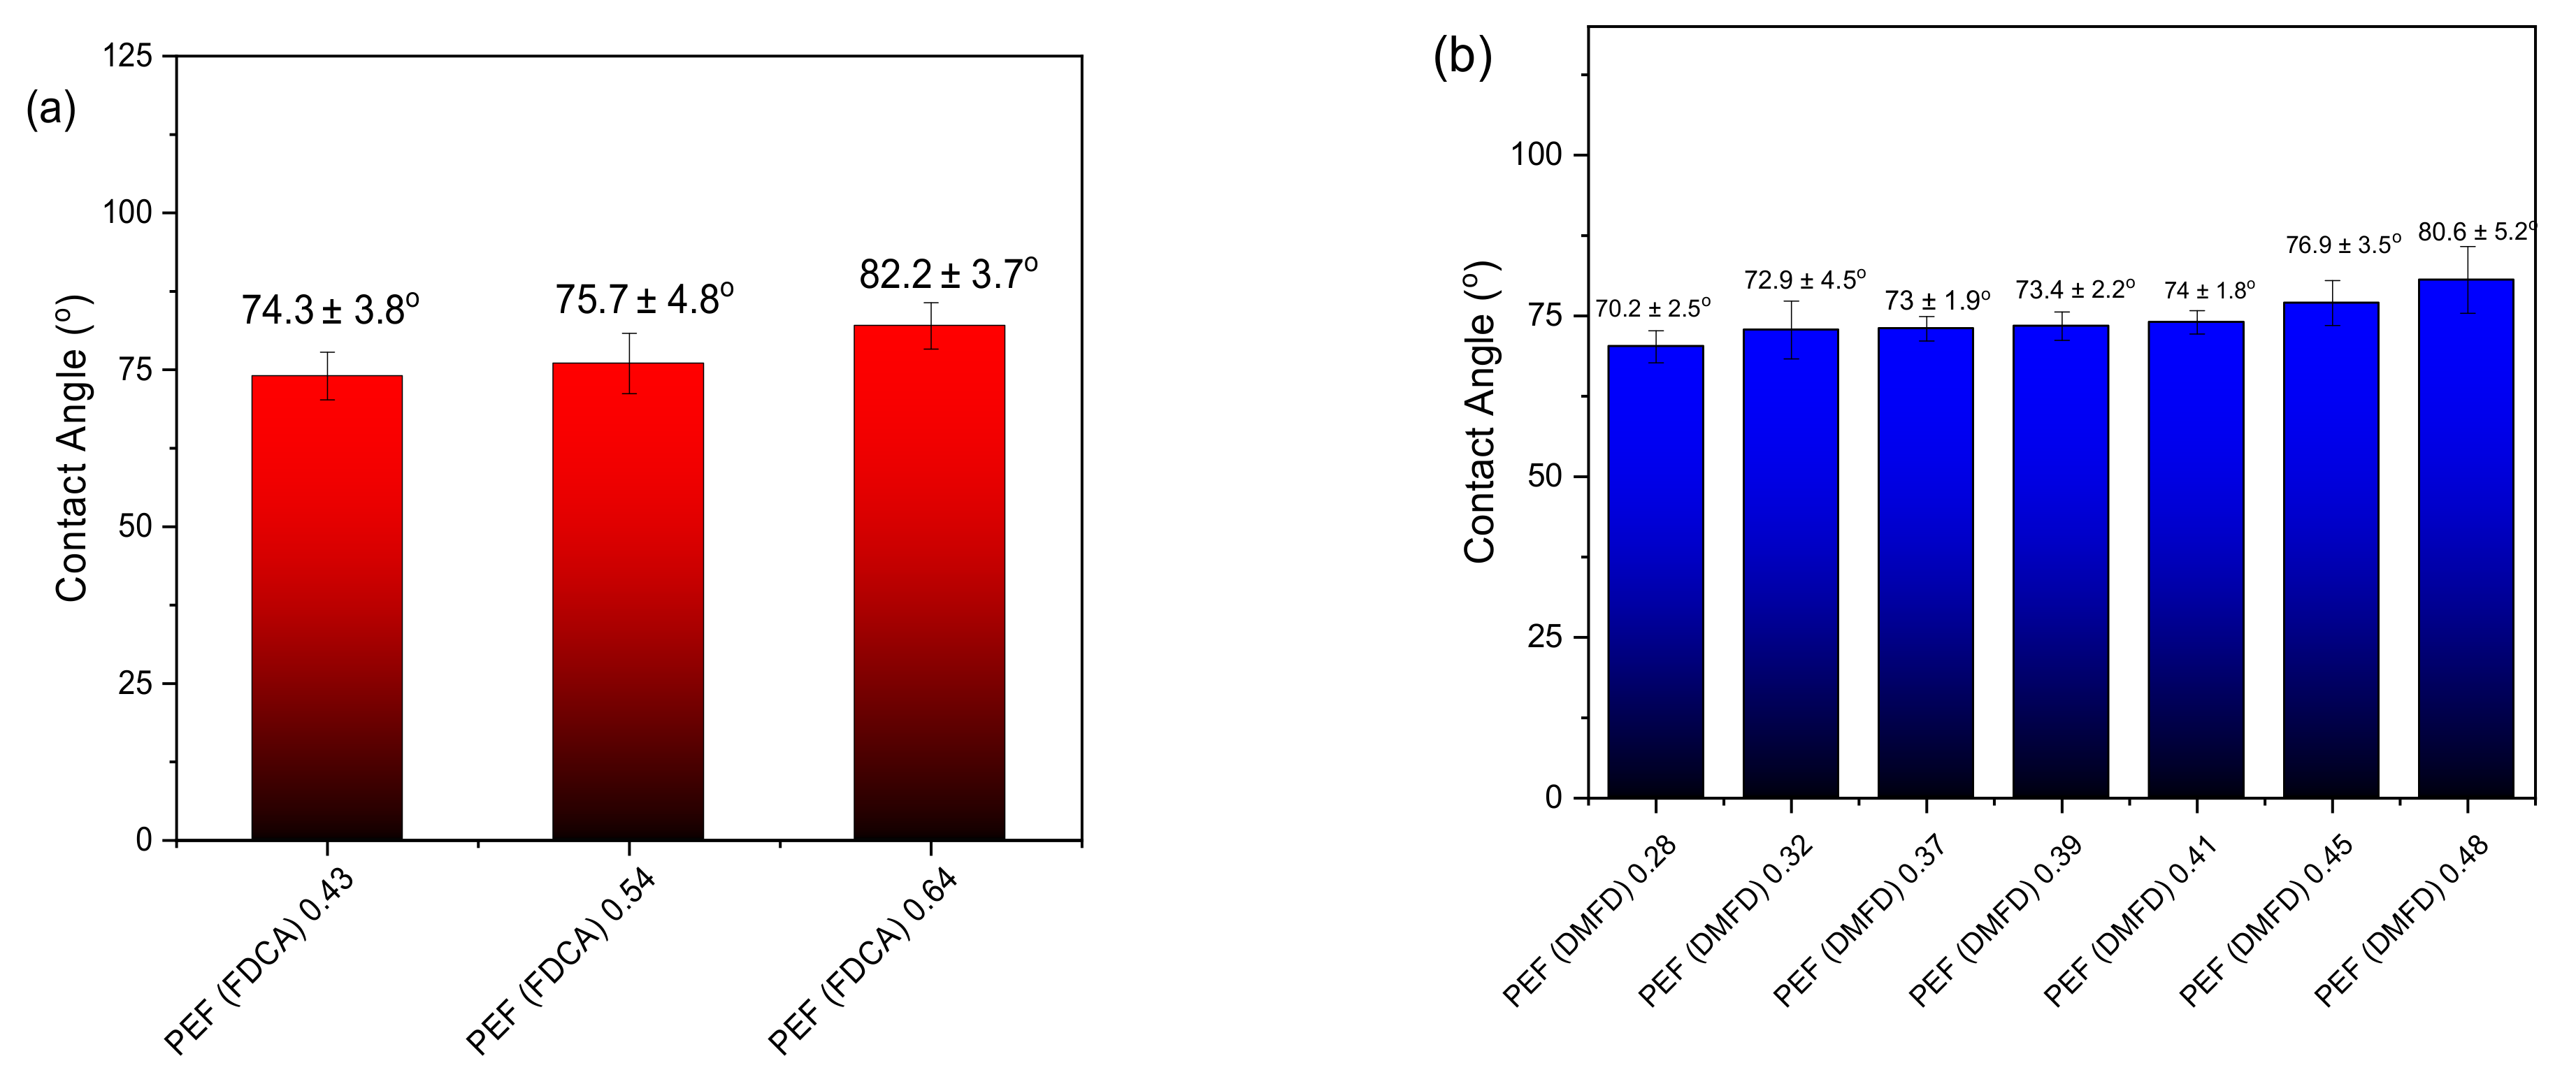
3.6. Contact Angle and Oxygen Transmission Rate (OTR)
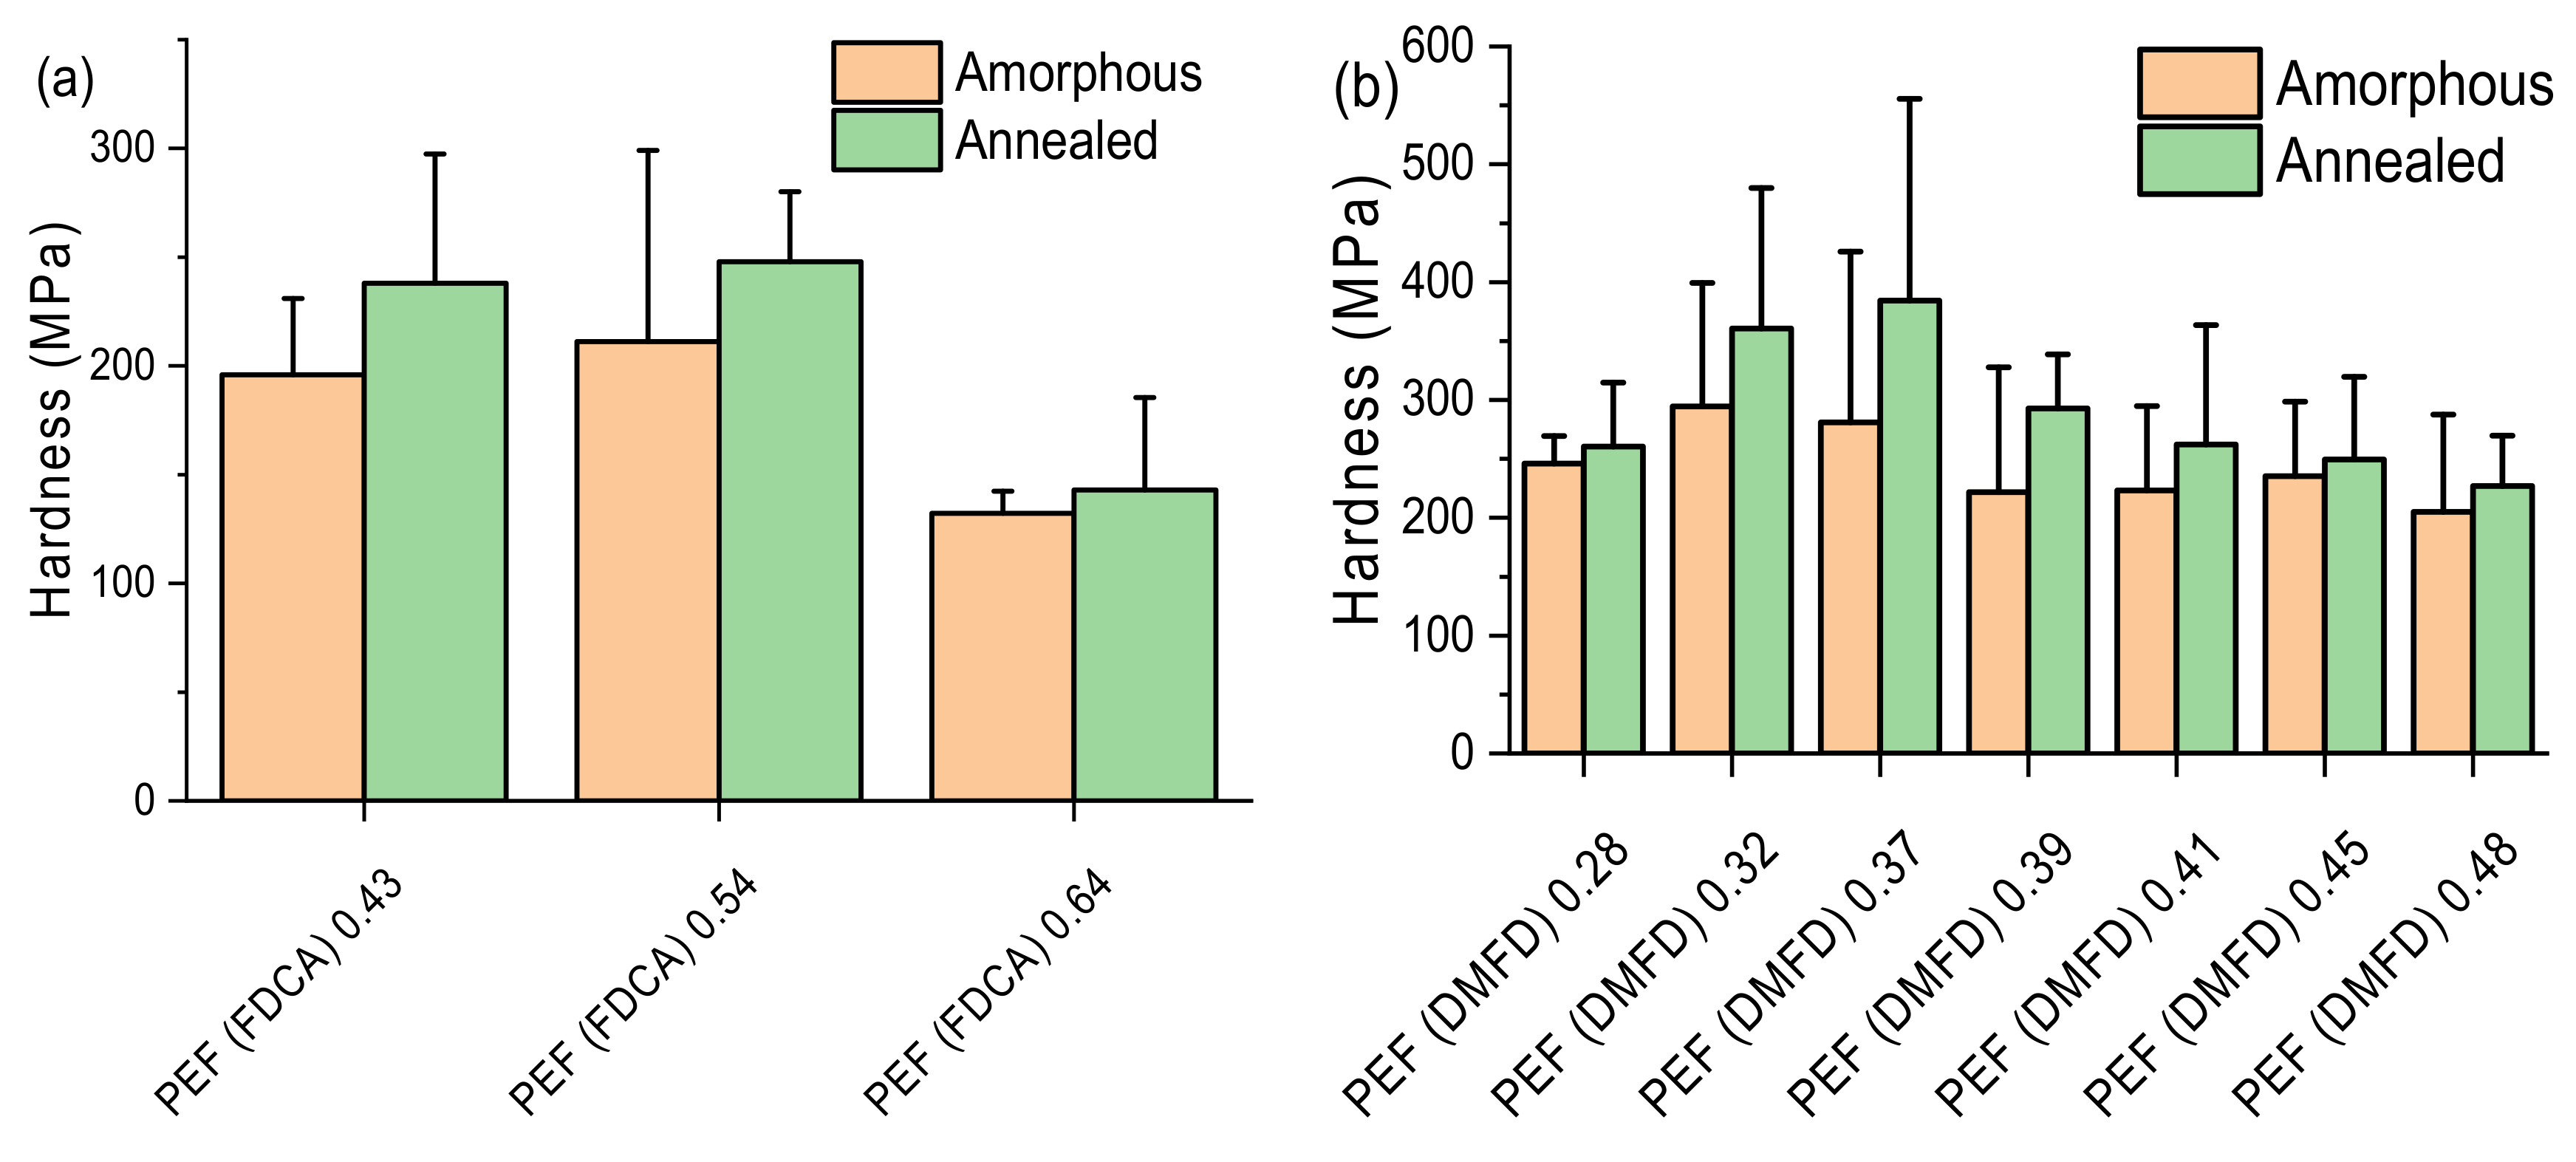
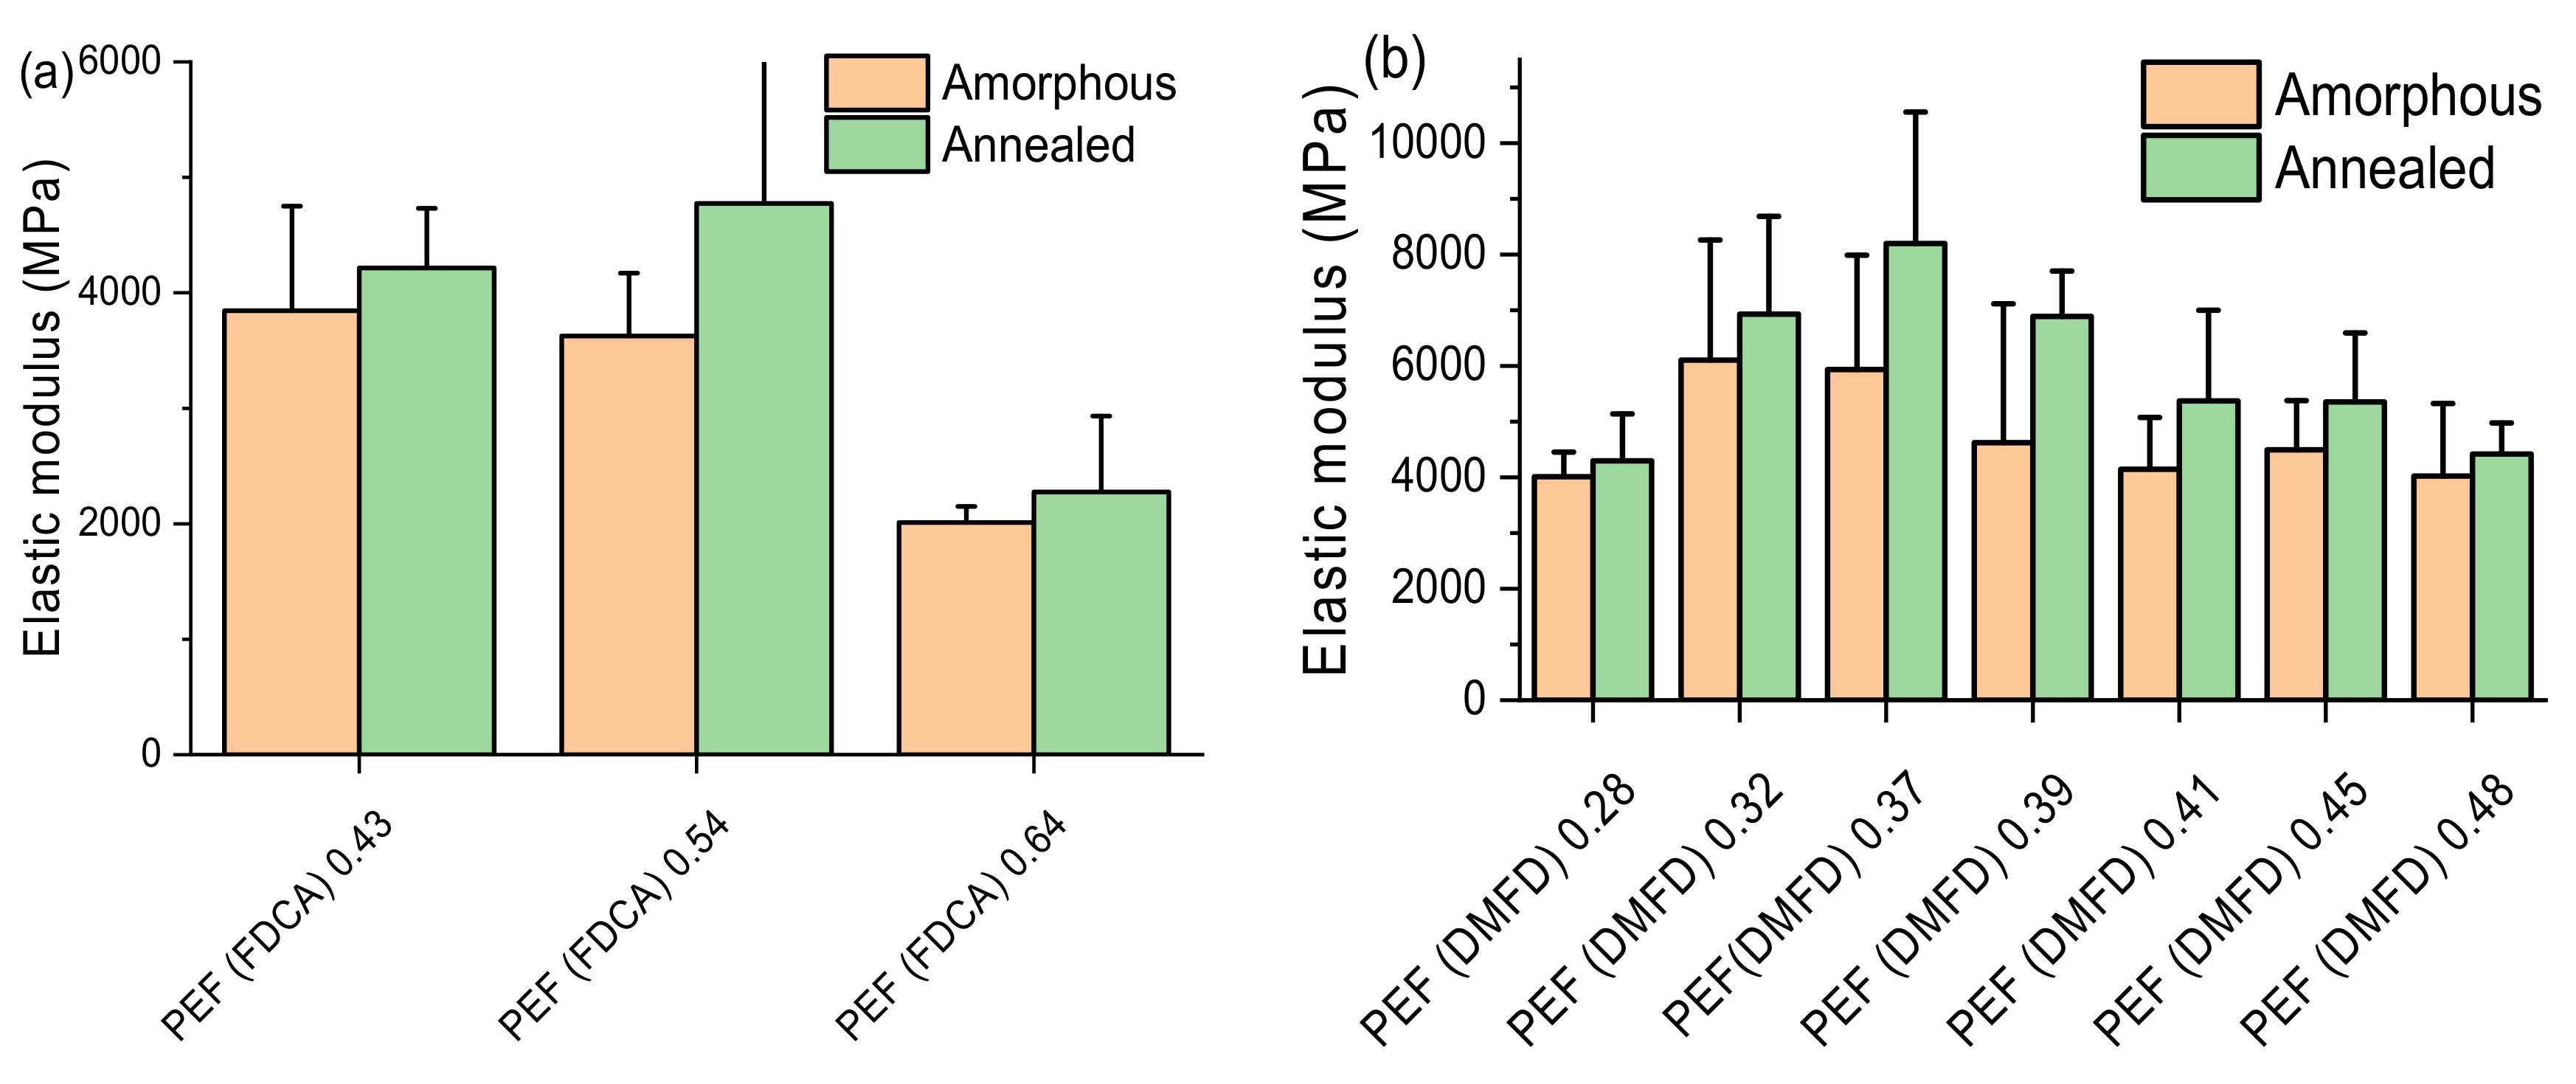
3.7. Nanoindentation Test
4. Conclusions
Author Contributions
Funding
Institutional Review Board Statement
Informed Consent Statement
Data Availability Statement
Acknowledgments
Conflicts of Interest
References
- ILSI Europe. Packaging Material Task Force. In Packaging Materials. 1, Polyethylene Terephthalate (PET) for Food Packaging Applications; ILSI Europe: Brussels, Belgium, 2000; ISBN 1578810922. [Google Scholar]
- Xu, X.; Zhou, G.; Lei, K.; LeBlanc, G.A.; An, L. Phthalate Esters and Their Potential Risk in PET Bottled Water Stored under Common Conditions. Int. J. Environ. Res. Public Health 2019, 17, 141. [Google Scholar] [CrossRef] [PubMed]
- Bikiaris, D.N.; Triantafyllidis, K.S. HDPE/Cu-Nanofiber Nanocomposites with Enhanced Antibacterial and Oxygen Barrier Properties Appropriate for Food Packaging Applications. Mater. Lett. 2013, 93, 1–4. [Google Scholar] [CrossRef]
- Gowthaman, N.S.K.; Lim, H.N.; Sreeraj, T.R.; Amalraj, A.; Gopi, S. Advantages of Biopolymers over Synthetic Polymers. In Biopolymers and Their Industrial Applications; Elsevier: Amsterdam, The Netherlands, 2021; pp. 351–372. [Google Scholar]
- Matos Fonseca, J.; Koop, B.L.; Trevisol, T.C.; Capello, C.; Monteiro, A.R.; Valencia, G.A. An Overview of Biopolymers in Food Packaging Systems. In Nanotechnology-Enhanced Food Packaging; Wiley: Hoboken, NJ, USA, 2022; pp. 19–53. [Google Scholar]
- Tsanaktsis, V.; Papageorgiou, G.Z.; Bikiaris, D.N. A Facile Method to Synthesize High-Molecular-Weight Biobased Polyesters from 2,5-Furandicarboxylic Acid and Long-Chain Diols. J. Polym. Sci. A Polym. Chem. 2015, 53, 2617–2632. [Google Scholar] [CrossRef]
- Burgess, S.K.; Leisen, J.E.; Kraftschik, B.E.; Mubarak, C.R.; Kriegel, R.M.; Koros, W.J. Chain Mobility, Thermal, and Mechanical Properties of Poly(Ethylene Furanoate) Compared to Poly(Ethylene Terephthalate). Macromolecules 2014, 47, 1383–1391. [Google Scholar] [CrossRef]
- Höhnemann, T.; Steinmann, M.; Schindler, S.; Hoss, M.; König, S.; Ota, A.; Dauner, M.; Buchmeiser, M.R. Poly(Ethylene Furanoate) along Its Life-Cycle from a Polycondensation Approach to High-Performance Yarn and Its Recyclate. Materials 2021, 14, 1044. [Google Scholar] [CrossRef]
- Qu, X.; Zhou, G.; Wang, R.; Yuan, B.; Jiang, M.; Tang, J. Synergistic Catalysis of Imidazole Acetate Ionic Liquids for the Methanolysis of Spiral Poly(Ethylene 2,5-Furandicarboxylate) under a Mild Condition. Green Chem. 2021, 23, 1871–1882. [Google Scholar] [CrossRef]
- Werpy, T.A.; Holladay, J.E.; White, J.F. Top Value Added Chemicals From Biomass: I. Results of Screening for Potential Candidates from Sugars and Synthesis Gas; US Department of Energy: Richland, WA, USA, 2004.
- Zhao, D.; Delbecq, F.; Len, C. One-Pot FDCA Diester Synthesis from Mucic Acid and Their Solvent-Free Regioselective Polytransesterification for Production of Glycerol-Based Furanic Polyesters. Molecules 2019, 24, 1030. [Google Scholar] [CrossRef]
- Fei, X.; Wang, J.; Zhu, J.; Wang, X.; Liu, X. Biobased Poly(Ethylene 2,5-Furancoate): No Longer an Alternative, but an Irreplaceable Polyester in the Polymer Industry. ACS Sustain. Chem. Eng. 2020, 8, 8471–8485. [Google Scholar] [CrossRef]
- Eerhart, A.J.J.E.; Faaij, A.P.C.; Patel, M.K. Replacing Fossil Based PET with Biobased PEF; Process Analysis, Energy and GHG Balance. Energy Environ. Sci. 2012, 5, 6407. [Google Scholar] [CrossRef]
- Qu, X.; Zhou, G.; Wang, R.; Zhang, H.; Wang, Z.; Jiang, M.; Tang, J. Insights into High Molecular Weight Poly(Ethylene 2,5-Furandicarboxylate) with Satisfactory Appearance: Roles of in-Situ Catalysis of Metal Zinc. J. Ind. Eng. Chem. 2021, 99, 422–430. [Google Scholar] [CrossRef]
- Marshall, A.; Jiang, B.; Gauvin, R.M.; Thomas, C.M. 2,5-Furandicarboxylic Acid: An Intriguing Precursor for Monomer and Polymer Synthesis. Molecules 2022, 27, 4071. [Google Scholar] [CrossRef]
- Papadopoulos, L.; Zamboulis, A.; Kasmi, N.; Wahbi, M.; Nannou, C.; Lambropoulou, D.A.; Kostoglou, M.; Papageorgiou, G.Z.; Bikiaris, D.N. Investigation of the Catalytic Activity and Reaction Kinetic Modeling of Two Antimony Catalysts in the Synthesis of Poly(Ethylene Furanoate). Green Chem. 2021, 23, 2507–2524. [Google Scholar] [CrossRef]
- Banella, M.B.; Bonucci, J.; Vannini, M.; Marchese, P.; Lorenzetti, C.; Celli, A. Insights into the Synthesis of Poly(Ethylene 2,5-Furandicarboxylate) from 2,5-Furandicarboxylic Acid: Steps toward Environmental and Food Safety Excellence in Packaging Applications. Ind. Eng. Chem. Res. 2019, 58, 8955–8962. [Google Scholar] [CrossRef]
- Savvidis, G.; Karanikas, V.; Zarkogianni, M.; Eleftheriadis, I.; Nikolaidis, N.; Tsatsaroni, E. Screen-Printing of Cotton with Natural Pigments: Evaluation of Color and Fastness Properties of the Prints. J. Nat. Fibers 2017, 14, 326–334. [Google Scholar] [CrossRef]
- Lu, X.F.; Hay, J.N. Isothermal Crystallization Kinetics and Melting Behaviour of Poly(Ethylene Terephthalate). Polymer 2001, 42, 9423–9431. [Google Scholar] [CrossRef]
- Kremer, F.; Schönhals, A. Broadband Dielectric Spectroscopy; Springer: Berlin/Heidelberg, Germany, 2003; ISBN 978-3-642-62809-2. [Google Scholar]
- Klonos, P.A.; Papadopoulos, L.; Tzetzis, D.; Kyritsis, A.; Papageorgiou, G.Z.; Bikiaris, D.N. Thermal, Nanoindentation and Dielectric Study of Nanocomposites Based on Poly(Propylene Furanoate) and Various Inclusions. Mater. Today Commun. 2019, 20, 100585. [Google Scholar] [CrossRef]
- Wu, J.; Xie, H.; Wu, L.; Li, B.-G.; Dubois, P. DBU-Catalyzed Biobased Poly(Ethylene 2,5-Furandicarboxylate) Polyester with Rapid Melt Crystallization: Synthesis, Crystallization Kinetics and Melting Behavior. RSC Adv. 2016, 6, 101578–101586. [Google Scholar] [CrossRef]
- Thiyagarajan, S.; Vogelzang, W.; Knoop, R.J.I.; Frissen, A.E.; van Haveren, J.; van Es, D.S. Biobased Furandicarboxylic Acids (FDCAs): Effects of Isomeric Substitution on Polyester Synthesis and Properties. Green Chem. 2014, 16, 1957–1966. [Google Scholar] [CrossRef]
- Joshi, A.S.; Alipourasiabi, N.; Kim, Y.-W.; Coleman, M.R.; Lawrence, J.G. Correction: Role of Enhanced Solubility in Esterification of 2,5-Furandicarboxylic Acid with Ethylene Glycol at Reduced Temperatures: Energy Efficient Synthesis of Poly(Ethylene 2,5-Furandicarboxylate). React. Chem. Eng. 2019, 4, 954. [Google Scholar] [CrossRef]
- Van Es, D.S.; van der Klis, F.; Knoop, R.J.I.; Molenveld, K.; Sijtsma, L.; van Haveren, J. Other Polyesters from Biomass Derived Monomers. In Bio-Based Plastics; John Wiley & Sons Ltd.: Chichester, UK, 2013; pp. 241–274. [Google Scholar]
- Terzopoulou, Z.; Karakatsianopoulou, E.; Kasmi, N.; Tsanaktsis, V.; Nikolaidis, N.; Kostoglou, M.; Papageorgiou, G.Z.; Lambropoulou, D.A.; Bikiaris, D.N. Effect of Catalyst Type on Molecular Weight Increase and Coloration of Poly(Ethylene Furanoate) Biobased Polyester during Melt Polycondensation. Polym. Chem. 2017, 8, 6895–6908. [Google Scholar] [CrossRef]
- Wang, J.; Liu, X.; Jia, Z.; Sun, L.; Zhu, J. Highly Crystalline Polyesters Synthesized from Furandicarboxylic Acid (FDCA): Potential Bio-Based Engineering Plastic. Eur. Polym. J. 2018, 109, 379–390. [Google Scholar] [CrossRef]
- Di Serio, M.; Tesser, R.; Ferrara, A.; Santacesaria, E. Heterogeneous Basic Catalysts for the Transesterification and the Polycondensation Reactions in PET Production from DMT. J. Mol. Catal. A Chem. 2004, 212, 251–257. [Google Scholar] [CrossRef]
- Qu, X.; Jiang, M.; Wang, B.; Deng, J.; Wang, R.; Zhang, Q.; Zhou, G.; Tang, J. A Brønsted Acidic Ionic Liquid as an Efficient and Selective Catalyst System for Bioderived High Molecular Weight Poly(Ethylene 2,5-furandicarboxylate). ChemSusChem 2019, 12, 4927–4935. [Google Scholar] [CrossRef] [PubMed]
- Jiang, Y.; Maniar, D.; Woortman, A.J.J.; Loos, K. Enzymatic Synthesis of 2,5-Furandicarboxylic Acid-Based Semi-Aromatic Polyamides: Enzymatic Polymerization Kinetics, Effect of Diamine Chain Length and Thermal Properties. RSC Adv. 2016, 6, 67941–67953. [Google Scholar] [CrossRef]
- Terzopoulou, Z.; Papadopoulos, L.; Zamboulis, A.; Papageorgiou, D.G.; Papageorgiou, G.Z.; Bikiaris, D.N. Tuning the Properties of Furandicarboxylic Acid-Based Polyesters with Copolymerization: A Review. Polymers 2020, 12, 1209. [Google Scholar] [CrossRef] [PubMed]
- Omelczuk, M.O.; McGinity, J.W. The Influence of Polymer Glass Transition Temperature and Molecular Weight on Drug Release from Tablets Containing Poly(DL-Lactic Acid). Pharm. Res. 1992, 9, 26–32. [Google Scholar] [CrossRef]
- Zubkiewicz, A.; Paszkiewicz, S.; Szymczyk, A. The Effect of Annealing on Tensile Properties of Injection Molded Biopolyesters Based on 2,5-furandicarboxylic acid. Polym. Eng. Sci. 2021, 61, 1536–1545. [Google Scholar] [CrossRef]
- Codou, A.; Moncel, M.; van Berkel, J.G.; Guigo, N.; Sbirrazzuoli, N. Glass Transition Dynamics and Cooperativity Length of Poly(Ethylene 2,5-Furandicarboxylate) Compared to Poly(Ethylene Terephthalate). Phys. Chem. Chem. Phys. 2016, 18, 16647–16658. [Google Scholar] [CrossRef]
- Cousin, T.; Galy, J.; Rousseau, A.; Dupuy, J. Synthesis and Properties of Polyamides from 2,5-Furandicarboxylic Acid. J. Appl. Polym. Sci. 2018, 135, 45901. [Google Scholar] [CrossRef]
- Knoop, R.J.I.; Vogelzang, W.; van Haveren, J.; van Es, D.S. High Molecular Weight Poly(Ethylene-2,5-Furanoate); Critical Aspects in Synthesis and Mechanical Property Determination. J. Polym. Sci. A Polym. Chem. 2013, 51, 4191–4199. [Google Scholar] [CrossRef]
- Gomes, F.W.; Lima, R.C.; Piombini, C.R.; Sinfitele, J.F.; de Souza, F.G.; Coutinho, P.L.A.; Pinto, J.C. Comparative Analyses of Poly(Ethylene 2,5-Furandicarboxylate)—PEF— and Poly(Ethylene Terephthalate)—PET—Resins and Production Processes. Macromol. Symp. 2018, 381, 1800129. [Google Scholar] [CrossRef]
- Stoclet, G.; Gobius du Sart, G.; Yeniad, B.; de Vos, S.; Lefebvre, J.M. Isothermal Crystallization and Structural Characterization of Poly(Ethylene-2,5-Furanoate). Polymer 2015, 72, 165–176. [Google Scholar] [CrossRef]
- Tsanaktsis, V.; Papageorgiou, D.G.; Exarhopoulos, S.; Bikiaris, D.N.; Papageorgiou, G.Z. Crystallization and Polymorphism of Poly(Ethylene Furanoate). Cryst. Growth Des. 2015, 15, 5505–5512. [Google Scholar] [CrossRef]
- Papageorgiou, G.Z.; Nikolaidis, G.N.; Ioannidis, R.O.; Rinis, K.; Papageorgiou, D.G.; Klonos, P.A.; Achilias, D.S.; Kapnisti, M.; Terzopoulou, Z.; Bikiaris, D.N. A Step Forward in Thermoplastic Polyesters: Understanding the Crystallization and Melting of Biobased Poly(Ethylene 2,5-Furandicarboxylate) (PEF). ACS Sustain. Chem. Eng. 2022, 10, 7050–7064. [Google Scholar] [CrossRef]
- Stoclet, G.; Arias, A.; Yeniad, B.; De Vos, S. Relationships between Crystalline Structure and the Thermal Behavior of Poly(Ethylene 2,5-furandicarboxylate): An in Situ Simultaneous SAXS-WAXS Study. Polym. Eng. Sci. 2019, 59, 1667–1677. [Google Scholar] [CrossRef]
- Mankar, S.V.; Garcia Gonzalez, M.N.; Warlin, N.; Valsange, N.G.; Rehnberg, N.; Lundmark, S.; Jannasch, P.; Zhang, B. Synthesis, Life Cycle Assessment, and Polymerization of a Vanillin-Based Spirocyclic Diol toward Polyesters with Increased Glass-Transition Temperature. ACS Sustain. Chem. Eng. 2019, 7, 19090–19103. [Google Scholar] [CrossRef]
- Righetti, M.C.; Marchese, P.; Vannini, M.; Celli, A.; Tricoli, F.; Lorenzetti, C. Temperature-Induced Polymorphism in Bio-Based Poly(Propylene 2,5-Furandicarboxylate). Thermochim. Acta 2019, 677, 186–193. [Google Scholar] [CrossRef]
- Minakov, A.A.; Mordvintsev, D.A.; Schick, C. Melting and Reorganization of Poly(Ethylene Terephthalate) on Fast Heating (1000 K/s). Polymer 2004, 45, 3755–3763. [Google Scholar] [CrossRef]
- Papageorgiou, G.Z.; Tsanaktsis, V.; Papageorgiou, D.G.; Chrissafis, K.; Exarhopoulos, S.; Bikiaris, D.N. Furan-Based Polyesters from Renewable Resources: Crystallization and Thermal Degradation Behavior of Poly(Hexamethylene 2,5-Furan-Dicarboxylate). Eur. Polym. J. 2015, 67, 383–396. [Google Scholar] [CrossRef]
- Genovese, L.; Soccio, M.; Lotti, N.; Munari, A.; Szymczyk, A.; Paszkiewicz, S.; Linares, A.; Nogales, A.; Ezquerra, T.A. Effect of Chemical Structure on the Subglass Relaxation Dynamics of Biobased Polyesters as Revealed by Dielectric Spectroscopy: 2,5-Furandicarboxylic Acid vs. Trans -1,4-Cyclohexanedicarboxylic Acid. Phys. Chem. Chem. Phys. 2018, 20, 15696–15706. [Google Scholar] [CrossRef]
- Alvarez, C.; Šics, I.; Nogales, A.; Denchev, Z.; Funari, S.S.; Ezquerra, T.A. Structure-Dynamics Relationship in Crystallizing Poly(Ethylene Terephthalate) as Revealed by Time-Resolved X-Ray and Dielectric Methods. Polymer 2004, 45, 3953–3959. [Google Scholar] [CrossRef]
- Kourtidou, D.; Klonos, P.A.; Papadopoulos, L.; Kyritsis, A.; Bikiaris, D.N.; Chrissafis, K. Molecular Mobility and Crystallization of Renewable Poly(Ethylene Furanoate) in Situ Filled with Carbon Nanotubes and Graphene Nanoparticles. Soft Matter 2021, 17, 5815–5828. [Google Scholar] [CrossRef] [PubMed]
- Klonos, P.A.; Papadopoulos, L.; Papageorgiou, G.Z.; Kyritsis, A.; Pissis, P.; Bikiaris, D.N. Interfacial Interactions, Crystallization, and Molecular Dynamics of Renewable Poly(Propylene Furanoate) In Situ Filled with Initial and Surface Functionalized Carbon Nanotubes and Graphene Oxide. J. Phys. Chem. C 2020, 124, 10220–10234. [Google Scholar] [CrossRef]
- Klonos, P.A.; Papadopoulos, L.; Terzopoulou, Z.; Papageorgiou, G.Z.; Kyritsis, A.; Bikiaris, D.N. Molecular Dynamics in Nanocomposites Based on Renewable Poly(Butylene 2,5-Furan-Dicarboxylate) In Situ Reinforced by Montmorillonite Nanoclays: Effects of Clay Modification, Crystallization, and Hydration. J. Phys. Chem. B 2020, 124, 7306–7317. [Google Scholar] [CrossRef]
- Ji, P.; Lu, D.; Zhang, S.; Zhang, W.; Wang, C.; Wang, H. Modification of Poly(Ethylene 2,5-Furandicarboxylate) with Poly(Ethylene Glycol) for Biodegradable Copolyesters with Good Mechanical Properties and Spinnability. Polymers 2019, 11, 2105. [Google Scholar] [CrossRef]
- Quattrosoldi, S.; Guidotti, G.; Soccio, M.; Siracusa, V.; Lotti, N. Bio-Based and One-Day Compostable Poly(Diethylene 2,5-Furanoate) for Sustainable Flexible Food Packaging: Effect of Ether-Oxygen Atom Insertion on the Final Properties. Chemosphere 2022, 291, 132996. [Google Scholar] [CrossRef]
- Wei, P.; Li, L.; Wang, L.; Yan, J.; Li, J.; Chen, C.; Zhang, Y. Synthesis and Properties of High Performance Biobased Liquid Crystal Polyester Based on Furandicarboxylic Acid and Sebacic Acid. Eur. Polym. J. 2023, 183, 111738. [Google Scholar] [CrossRef]
- Vannini, M.; Marchese, P.; Celli, A.; Lorenzetti, C. Fully Biobased Poly(Propylene 2,5-Furandicarboxylate) for Packaging Applications: Excellent Barrier Properties as a Function of Crystallinity. Green Chem. 2015, 17, 4162–4166. [Google Scholar] [CrossRef]
- Balani, K.; Verma, V.; Agarwal, A.; Narayan, R. Physical, Thermal, and Mechanical Properties of Polymers. In Biosurfaces; John Wiley & Sons, Inc.: Hoboken, NJ, USA, 2015; pp. 329–344. [Google Scholar]


| Sample No | Monomers | Ratio | Time/Temperature (h/°C) | Catalyst (ppm) | [ղ] (dL/g) | Mn (g/mol) | |
|---|---|---|---|---|---|---|---|
| 1st Stage | 2nd Stage | ||||||
| 1 | FDCA:EG | 1:2.1 | 1.5 h 170, 190–200 | 1.5 h 250–260 | Sb2O3 300 | 0.43 | 8900 |
| 2 | FDCA:EG | 1:2.1 | 1.5 h 170, 190–200 | 4 h 250–260 | Sb2O3 300 | 0.54 | 12,700 |
| 3 | FDCA:EG | 1:2.1 | 1.5 h 170,190–200 | 6 h 250–260 | Sb2O3 300 | 0.64 | 16,500 |
| 4 | DMFD:EG | 1:2.2 | 5 h 160–190 | 3 h 230–250 | Zinc acetate 400 | 0.28 | 4600 |
| 5 | DMFD:EG | 1:2.2 | 4 h 160–190 | 2.5 h 220–240 | TBT 400 | 0.37 | 7100 |
| 6 | DMFD:EG | 1:1.5 | 4 h 160–190 | 2.5 h 220–240 | TBT 400 | 0.39 | 7700 |
| 7 | DMFD:EG | 1:1.5 | 4 h 160–190 | 4 h 220–240 | TBT 400 | 0.45 | 9600 |
| 8 | DMFD:EG | 1:1.5 | 4 h 160–190 | 6 h 220–240 | TBT 400 | 0.48 | 10,600 |
| 9 | DMFD:EG | 1:1.2 | 4 h 160–190 | 2.5 h 220–240 | TBT 400 | 0.41 | 8300 |
| 10 | DMFD:EG | 1:1.2 | 3.5 h 160–190 | 3 h 240–250 | Zirconium(IV) isopropoxide 400 | 0.32 | 5600 |
| Sample | Catalyst (ppm) | L* | a* | b* | c* | h° | R | K/S |
|---|---|---|---|---|---|---|---|---|
| PEF (FDCA) 0.43 | Sb2O3 300 | 90.07 | −2.21 | 7.49 | 7.47 | 107.57 | 47.14 (400 nm) | 0.30 |
| PEF (FDCA) 0.64 | Sb2O3 300 | 80.27 | −2.51 | 19.73 | 18.26 | 97.55 | 19.43 (400 nm) | 1.67 |
| PEF (DMFD) 0.28 | Zinc acetate 400 | 88.48 | −2.04 | 12.42 | 11.67 | 98.32 | 39.56 (400 nm) | 0.46 |
| PEF (DMFD) 0.32 | Zirconium(IV) isopropoxide 400 | 85.30 | −0.69 | 18.28 | 18.33 | 92.39 | 30.09 (400 nm) | 0.81 |
| PEF (DMFD) 0.37 | TBT 400 | 83.46 | 1.2 | 22.56 | 24.45 | 90.24 | 26.29 (400 nm) | 1.03 |
| PEF (DMFD) 0.48 | TBT 400 | 80.27 | 3.36 | 36.39 | 36.51 | 83.90 | 10.03 (400 nm) | 4.03 |
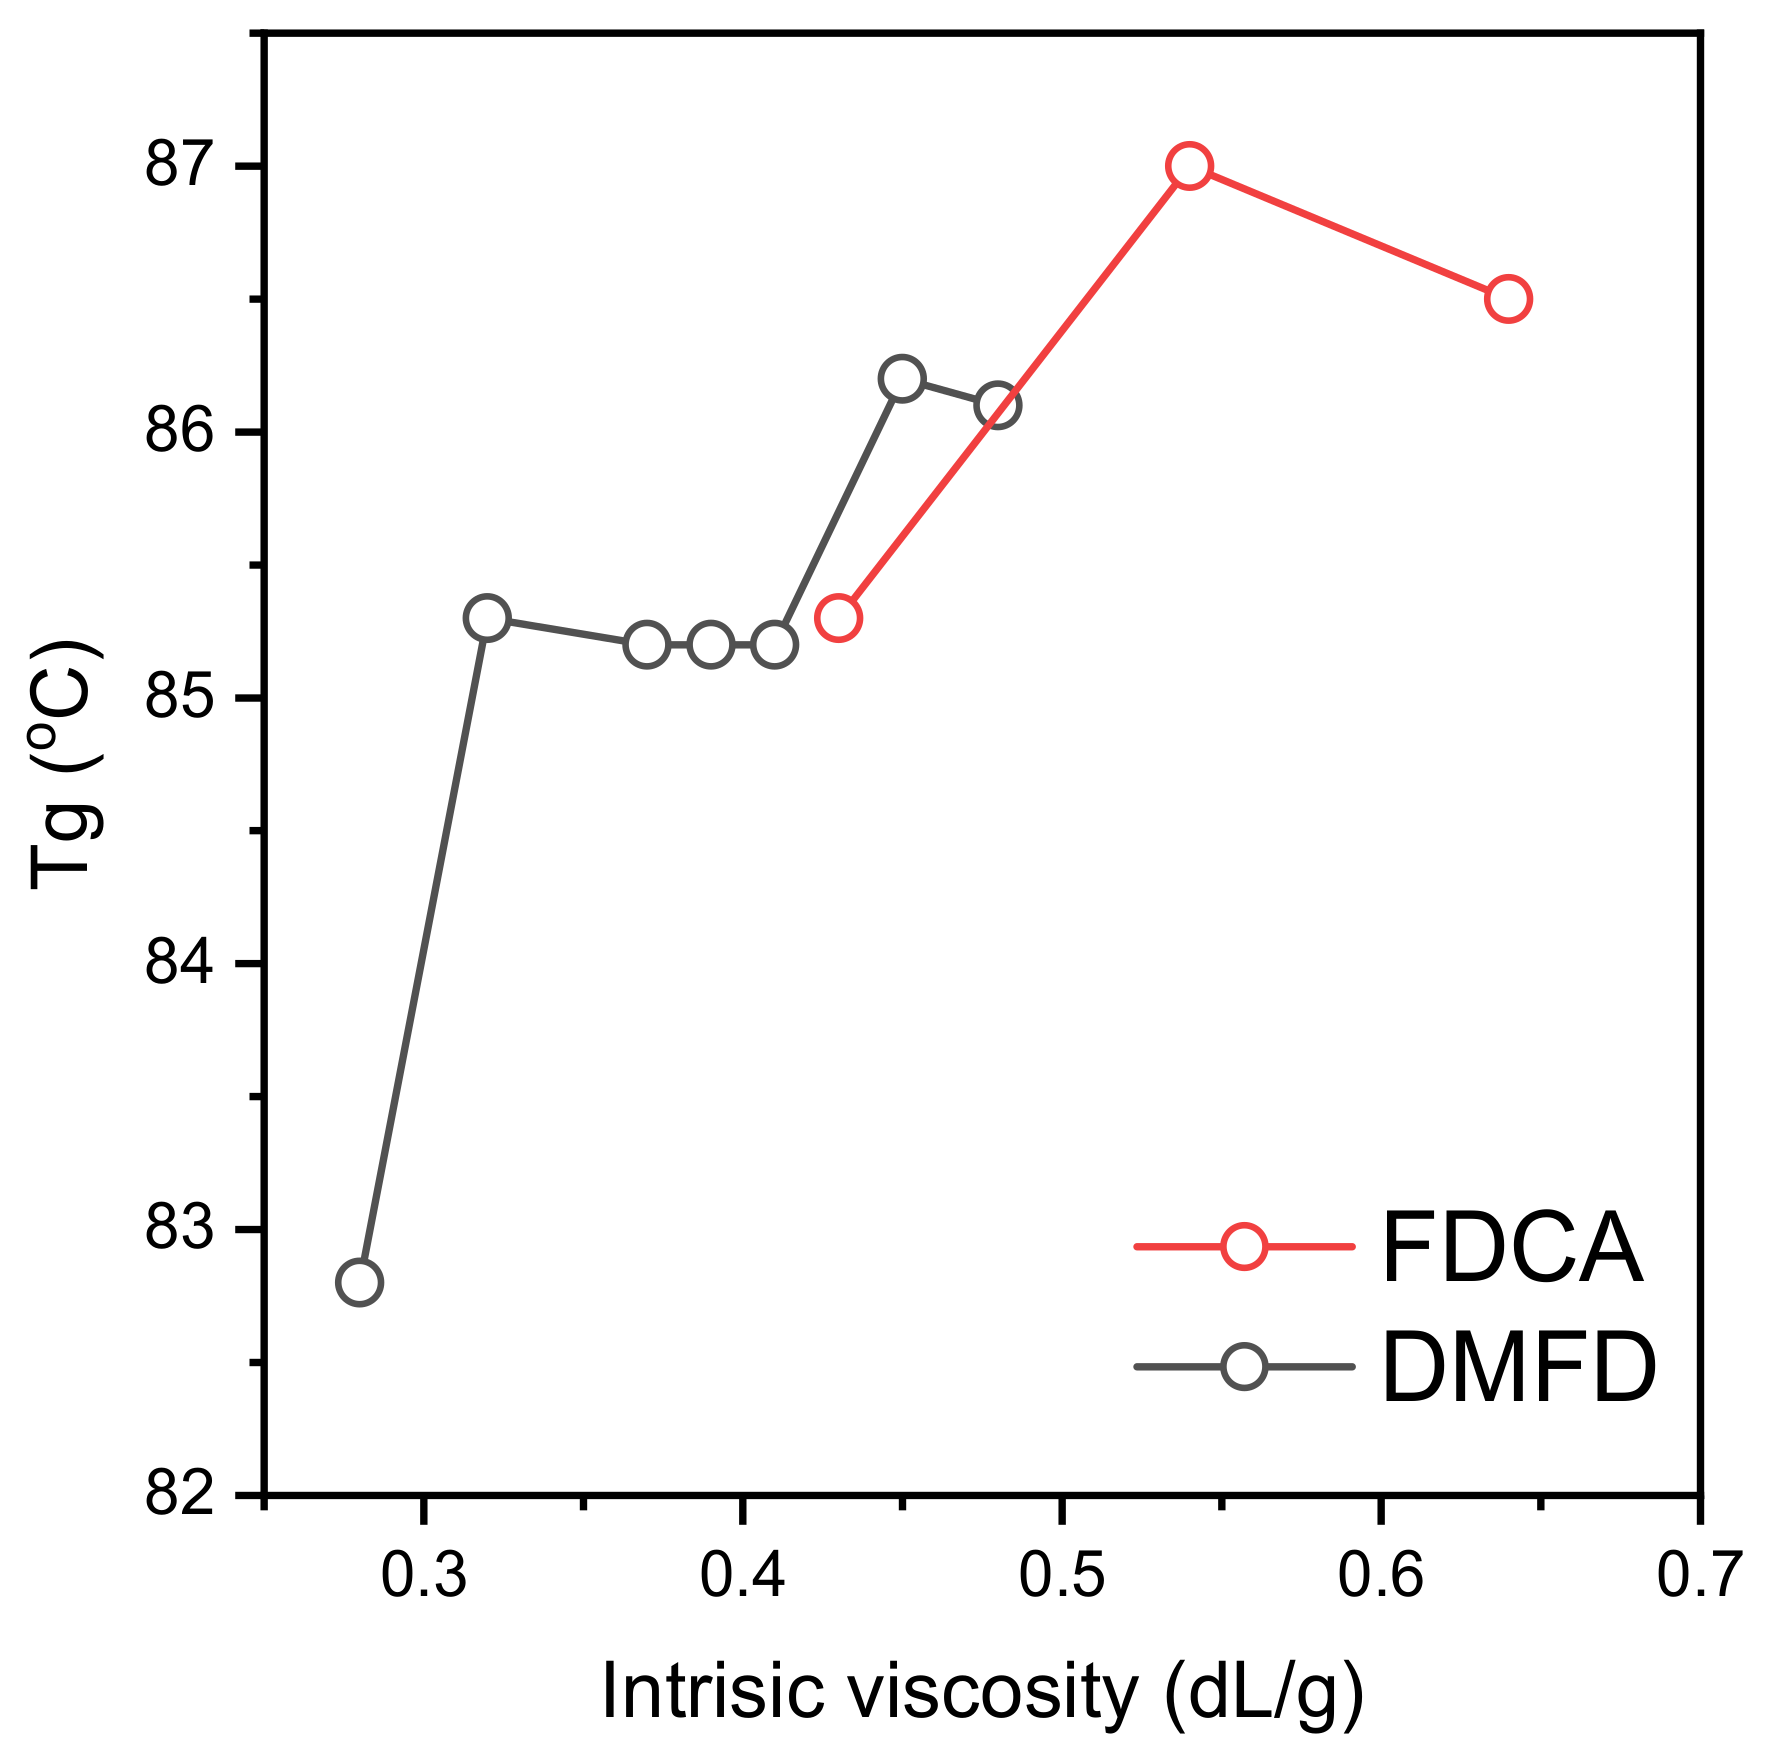
| Sample | Tg (°C) | Tcc (°C) | Tm (°C) |
|---|---|---|---|
| PEF (FDCA) 0.43 | 85 | - | - |
| PEF (FDCA) 0.54 | 87 | - | - |
| PEF (FDCA) 0.64 | 86 | - | - |
| PEF (DMFD) 0.28 | 83 | 182 | 214 |
| PEF (DMFD) 0.32 | 85 | 183 | 214 |
| PEF (DMFD) 0.37 | 85 | 183 | 215 |
| PEF (DMFD) 0.39 | 85 | 186 | 215 |
| PEF (DMFD) 0.41 | 85 | 185 | 215 |
| PEF (DMFD) 0.45 | 86 | 180 | 213 |
| PEF (DMFD) 0.48 | 86 | - | 212 |
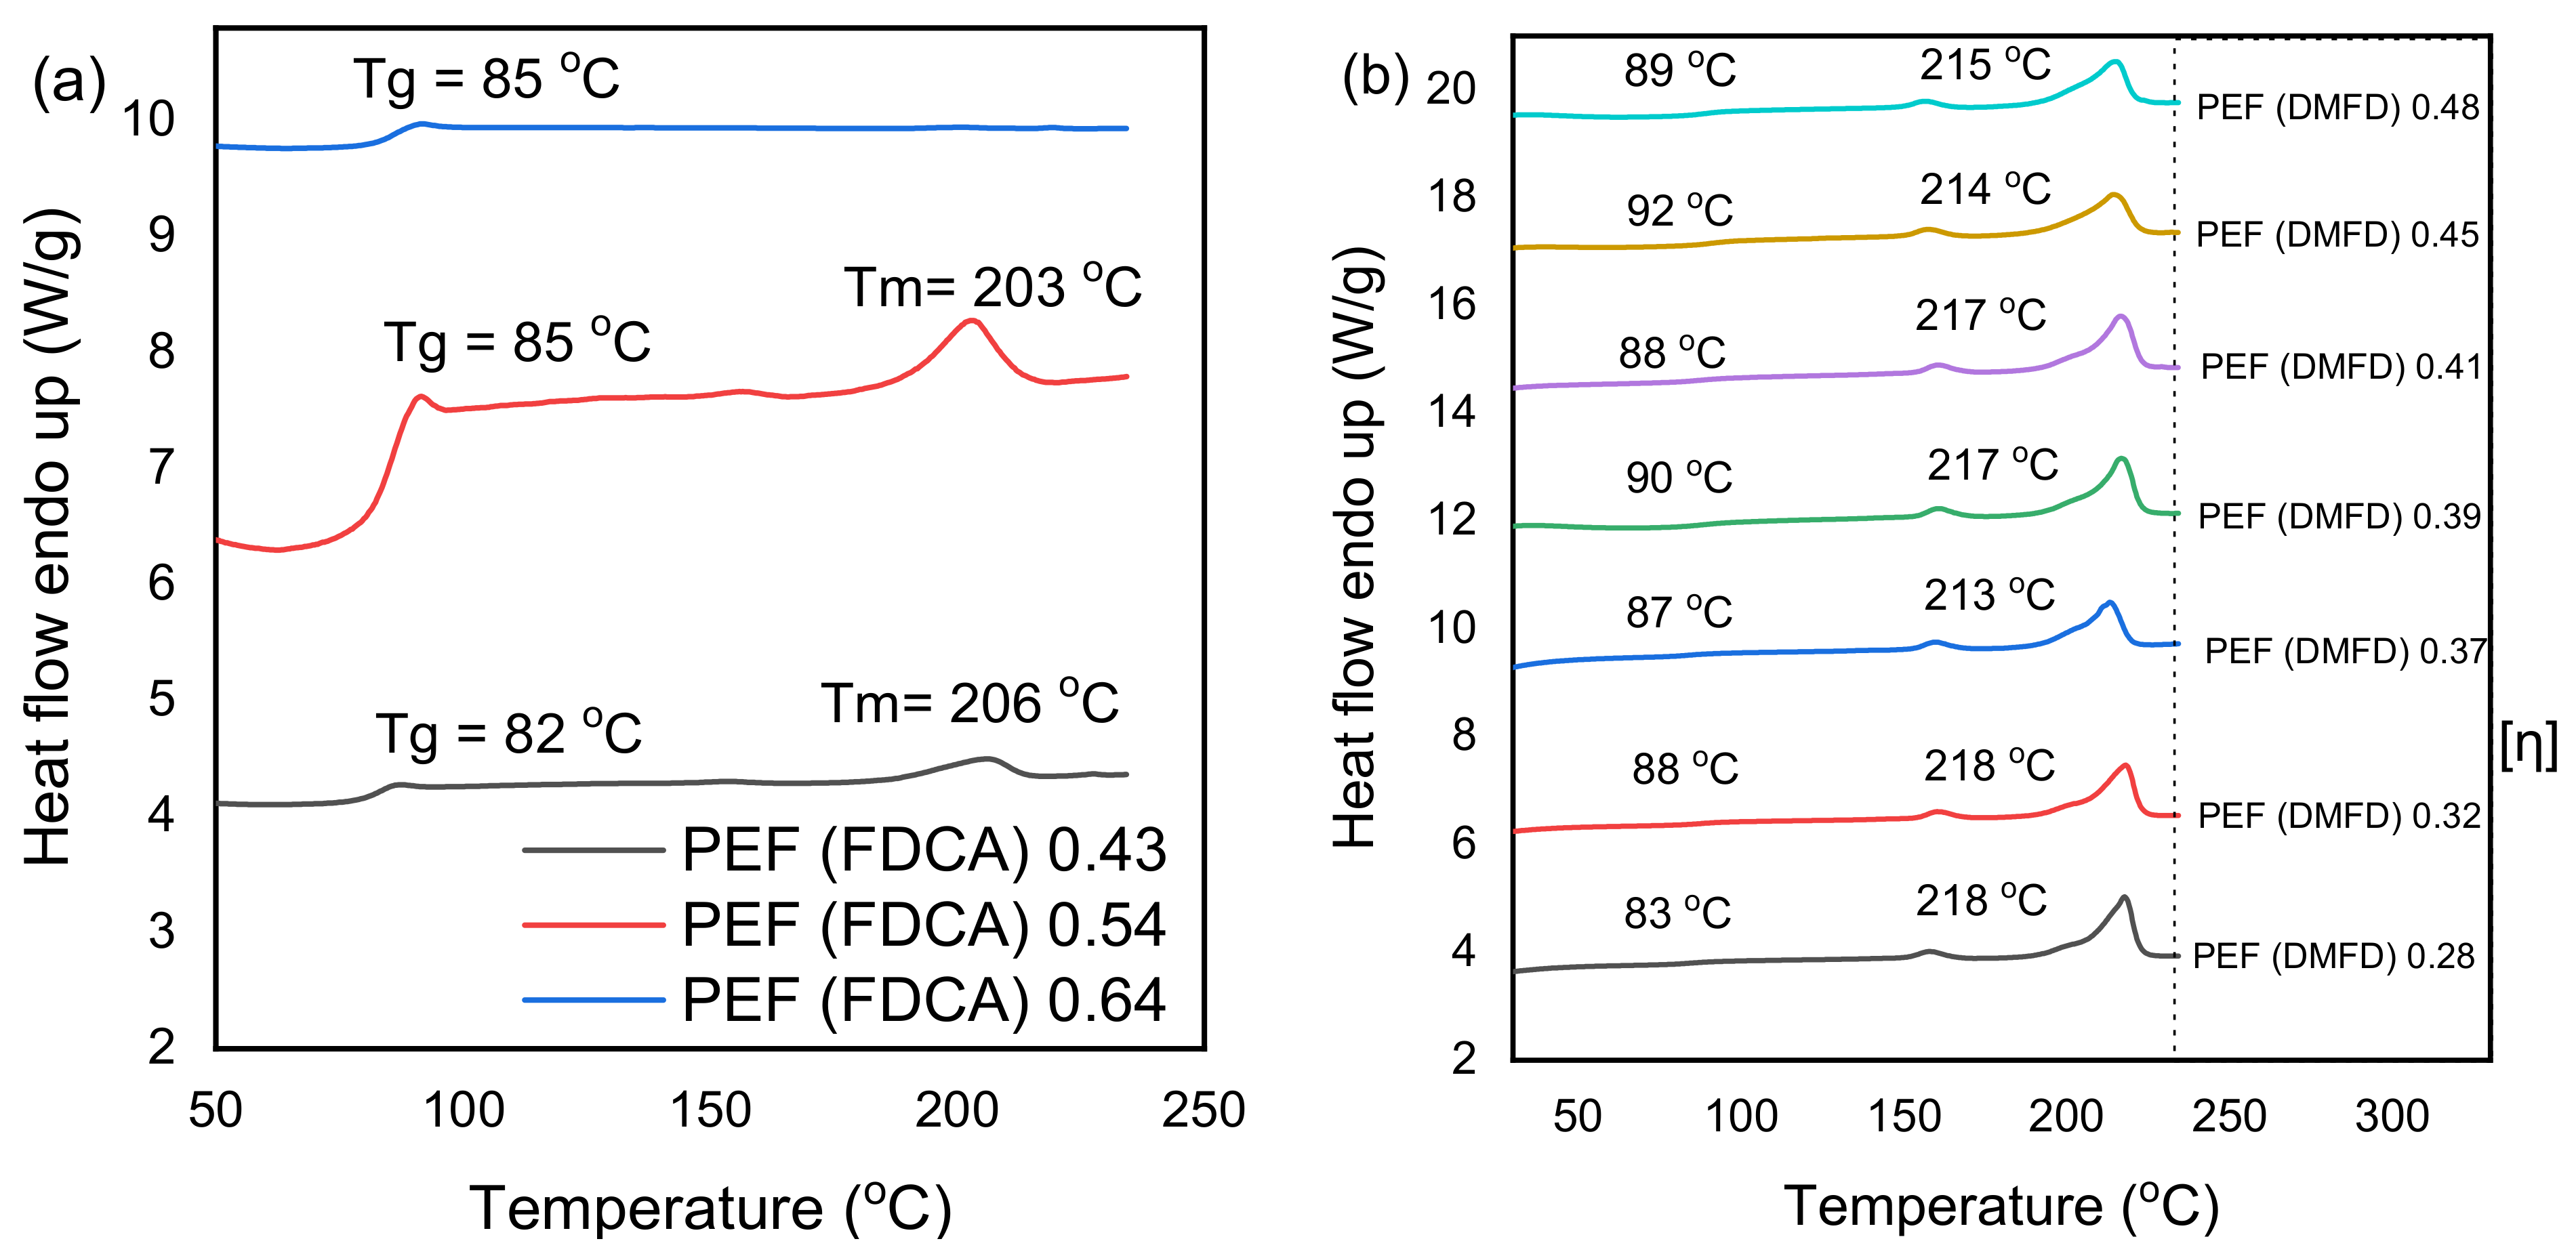
| Sample | Tg (°C) | Tm1 (°C) | Tm2 (°C) | ΔHm − ΔHcc (J/g) | Xca (%) | Xcb (%) |
|---|---|---|---|---|---|---|
| PEF (FDCA) 0.43 | 82 | 153 | 206 | 3 | 2 | 3.1 |
| PEF (FDCA) 0.54 | 85 | - | 203 | 3 | 2 | 3.2 |
| PEF (FDCA) 0.64 | 85 | - | - | - | - | - |
| PEF (DMFD) 0.28 | 83 | 158 | 218 | 52 | 38 | 35 |
| PEF (DMFD) 0.32 | 88 | 160 | 218 | 39 | 28 | 27 |
| PEF (DMFD) 0.37 | 87 | 160 | 213 | 33 | 24 | 22 |
| PEF (DMFD) 0.39 | 90 | 161 | 217 | 43 | 32 | 28 |
| PEF (DMFD) 0.41 | 88 | 160 | 217 | 42 | 30 | 27 |
| PEF (DMFD) 0.45 | 92 | 158 | 214 | 35 | 26 | 26 |
| PEF (DMFD) 0.48 | 89 | 156 | 215 | 33 | 24 | 23 |
| Sample | Thickness of Films (µm) | STDV TR | OTR (cm3/m2d) |
|---|---|---|---|
| PEF (FDCA) 0.43 | 0.4 | 4.9 | 21.8 |
| PEF (FDCA) 0.64 | 0.4 | 2.8 | 1.60 |
| PEF (DMFD) 0.28 | 0.4 | 2.4 | 25.40 |
| PEF (DMFD) 0.48 | 0.4 | 0.9 | 3.20 |
Disclaimer/Publisher’s Note: The statements, opinions and data contained in all publications are solely those of the individual author(s) and contributor(s) and not of MDPI and/or the editor(s). MDPI and/or the editor(s) disclaim responsibility for any injury to people or property resulting from any ideas, methods, instructions or products referred to in the content. |
© 2023 by the authors. Licensee MDPI, Basel, Switzerland. This article is an open access article distributed under the terms and conditions of the Creative Commons Attribution (CC BY) license (https://creativecommons.org/licenses/by/4.0/).
Share and Cite
Stanley, J.; Terzopoulou, Z.; Klonos, P.A.; Zamboulis, A.; Xanthopoulou, E.; Koltsakidis, S.; Tzetzis, D.; Zemljič, L.F.; Lambropoulou, D.A.; Kyritsis, A.; et al. Effect of Monomer Type on the Synthesis and Properties of Poly(Ethylene Furanoate). Polymers 2023, 15, 2707. https://doi.org/10.3390/polym15122707
Stanley J, Terzopoulou Z, Klonos PA, Zamboulis A, Xanthopoulou E, Koltsakidis S, Tzetzis D, Zemljič LF, Lambropoulou DA, Kyritsis A, et al. Effect of Monomer Type on the Synthesis and Properties of Poly(Ethylene Furanoate). Polymers. 2023; 15(12):2707. https://doi.org/10.3390/polym15122707
Chicago/Turabian StyleStanley, Johan, Zoi Terzopoulou, Panagiotis A. Klonos, Alexandra Zamboulis, Eleftheria Xanthopoulou, Savvas Koltsakidis, Dimitrios Tzetzis, Lidija Fras Zemljič, Dimitra A. Lambropoulou, Apostolos Kyritsis, and et al. 2023. "Effect of Monomer Type on the Synthesis and Properties of Poly(Ethylene Furanoate)" Polymers 15, no. 12: 2707. https://doi.org/10.3390/polym15122707
APA StyleStanley, J., Terzopoulou, Z., Klonos, P. A., Zamboulis, A., Xanthopoulou, E., Koltsakidis, S., Tzetzis, D., Zemljič, L. F., Lambropoulou, D. A., Kyritsis, A., Papageorgiou, G. Z., & Bikiaris, D. N. (2023). Effect of Monomer Type on the Synthesis and Properties of Poly(Ethylene Furanoate). Polymers, 15(12), 2707. https://doi.org/10.3390/polym15122707