4. Discussion
One of the key attributes for operation of compliant contacts in demanding applications is sufficient lubrication of the rubbing surfaces. However, the interaction between viscous liquids and viscoelastic solids represents a complex problem not only relative to the state of the art in the soft EHL. Furthermore, the complexity of this interaction is even more enhanced by significantly different material properties of the rubbing surfaces forming a contact pair.
Generally, in the EHL regime, the constitutive material behavior is described according to the Hertzian theory by the elastic modulus E and the Poisson’s ratio v of the individual solids. In relation to the tribology, the Hertzian theory corresponds to the elastic response of the material and is usually compared with static contacts (U
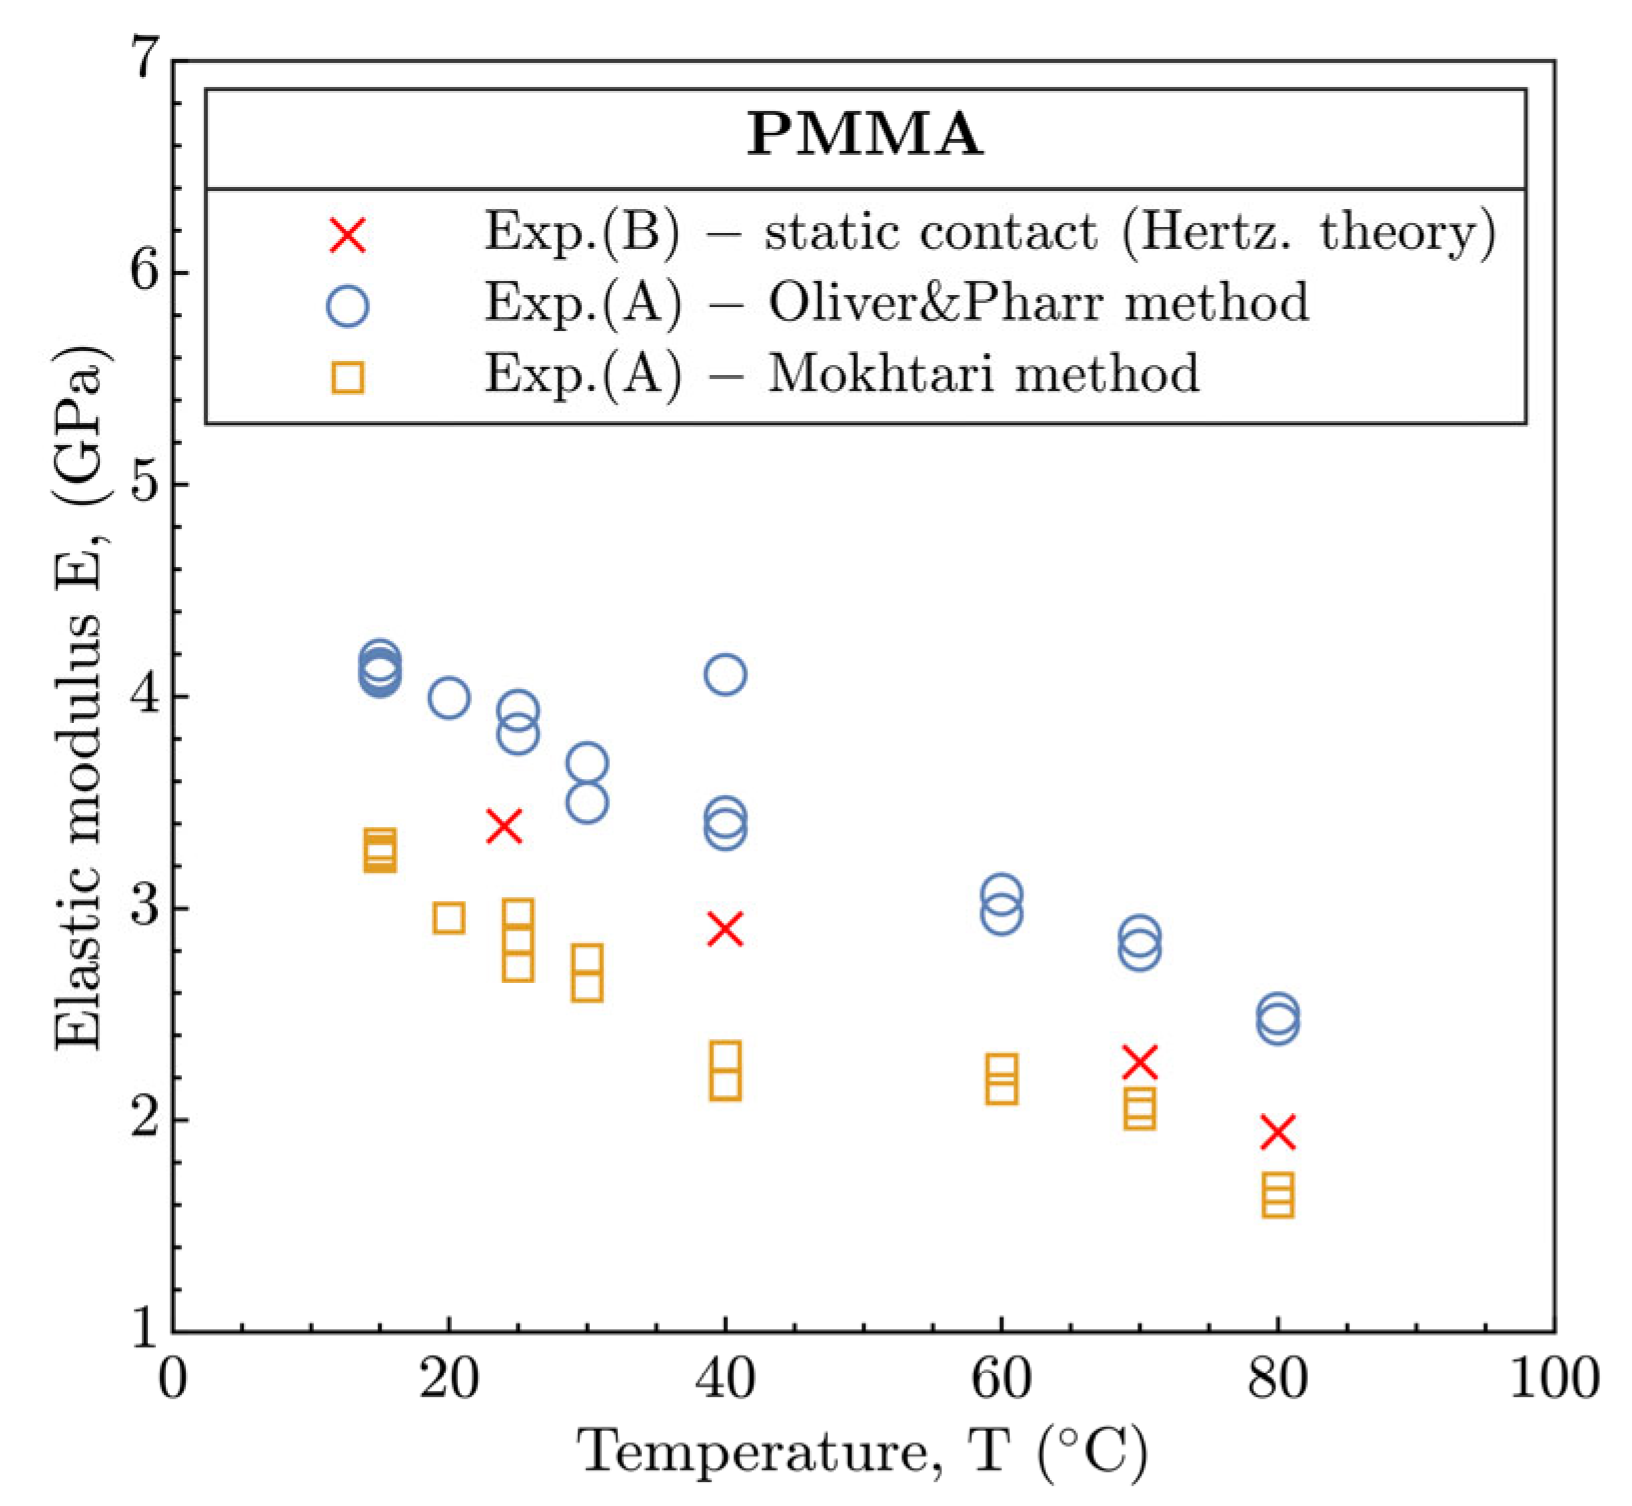
E = 0) to evaluate the contact shape (Equation (3)) and magnitude (Equation (2)) and distribution of the contact pressure. To determine the elastic modulus of PMMA, the nanoindentation experiments in part A were performed and the obtained data were evaluated according to the Oliver and Pharr (O&P) [
23] as well as the approach recently described by Mokhtari [
24], see
Figure 8. Since the data obtained from the nanoindentation may generally be overestimated, the elastic modulus of PMMA disc E
1 in part B was reversible calculated (see Equations (SA3) and (SA4)) from the radius of static contacts R
c (see
Table 5) at the individual inlet temperatures T, see
Table 6. However, the E
1 could be influenced by creep of PMMA after the contact is loaded, causing a gradual increase in the contact in size.
Moreover, the evaluation methodology by Mokhtari was included. This demonstrated the development of E in the similar manner as for O&P, but the E was quantitively underestimated considering the results from the tribological experiments in part B, see
Figure 8. In comparison, at 24 °C, the E based on the Mokhtari method in part A and part B is in accordance with [
10,
25], nonetheless, the results of the O&P method in part A differ significantly.
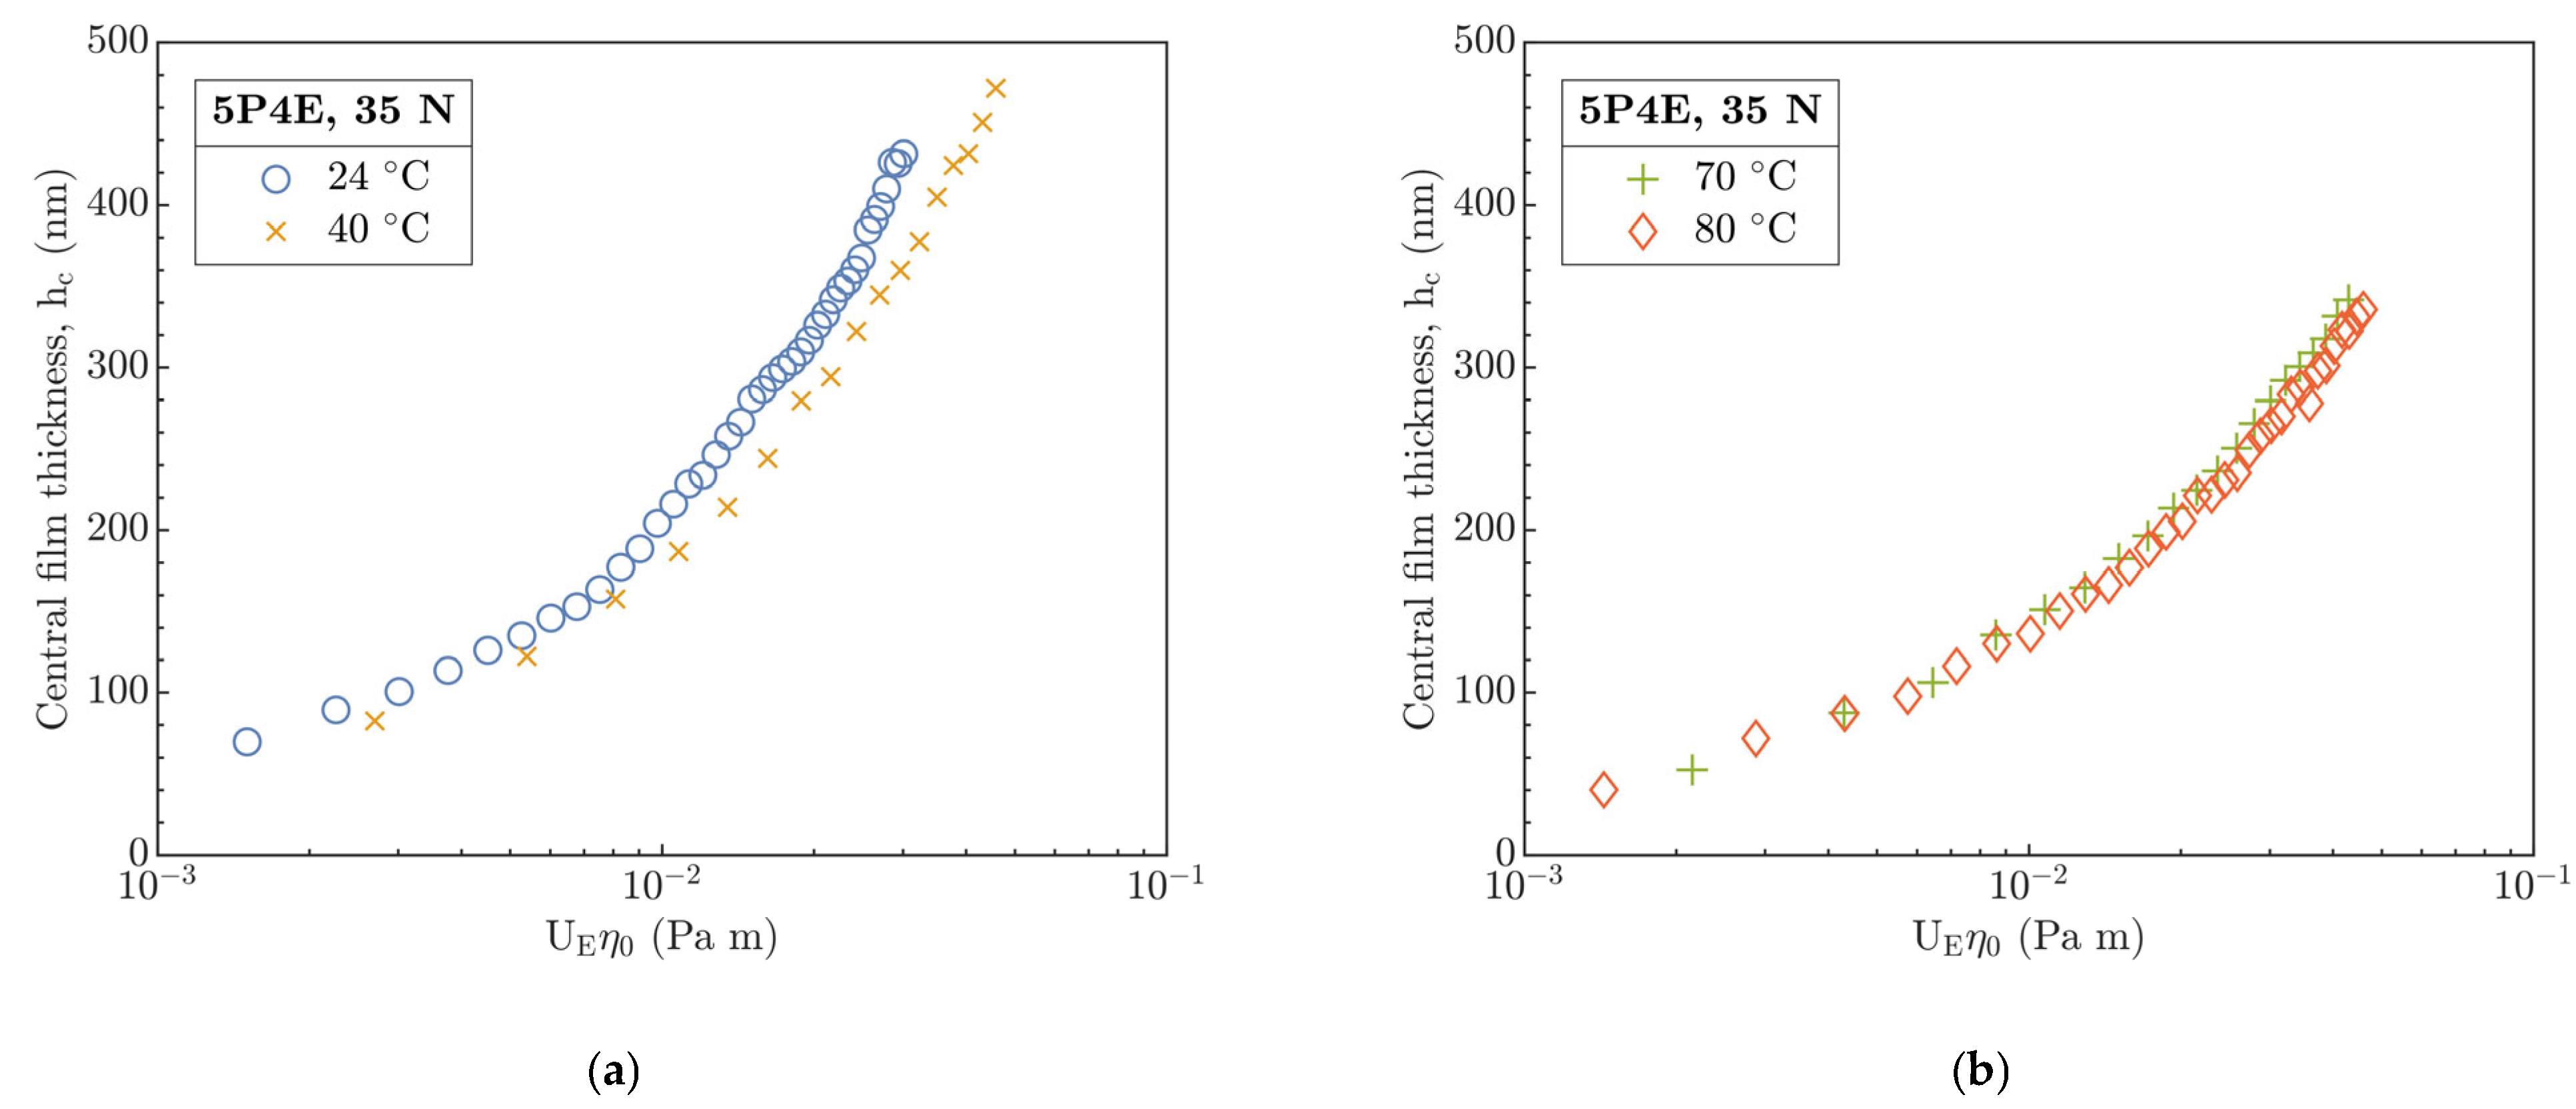
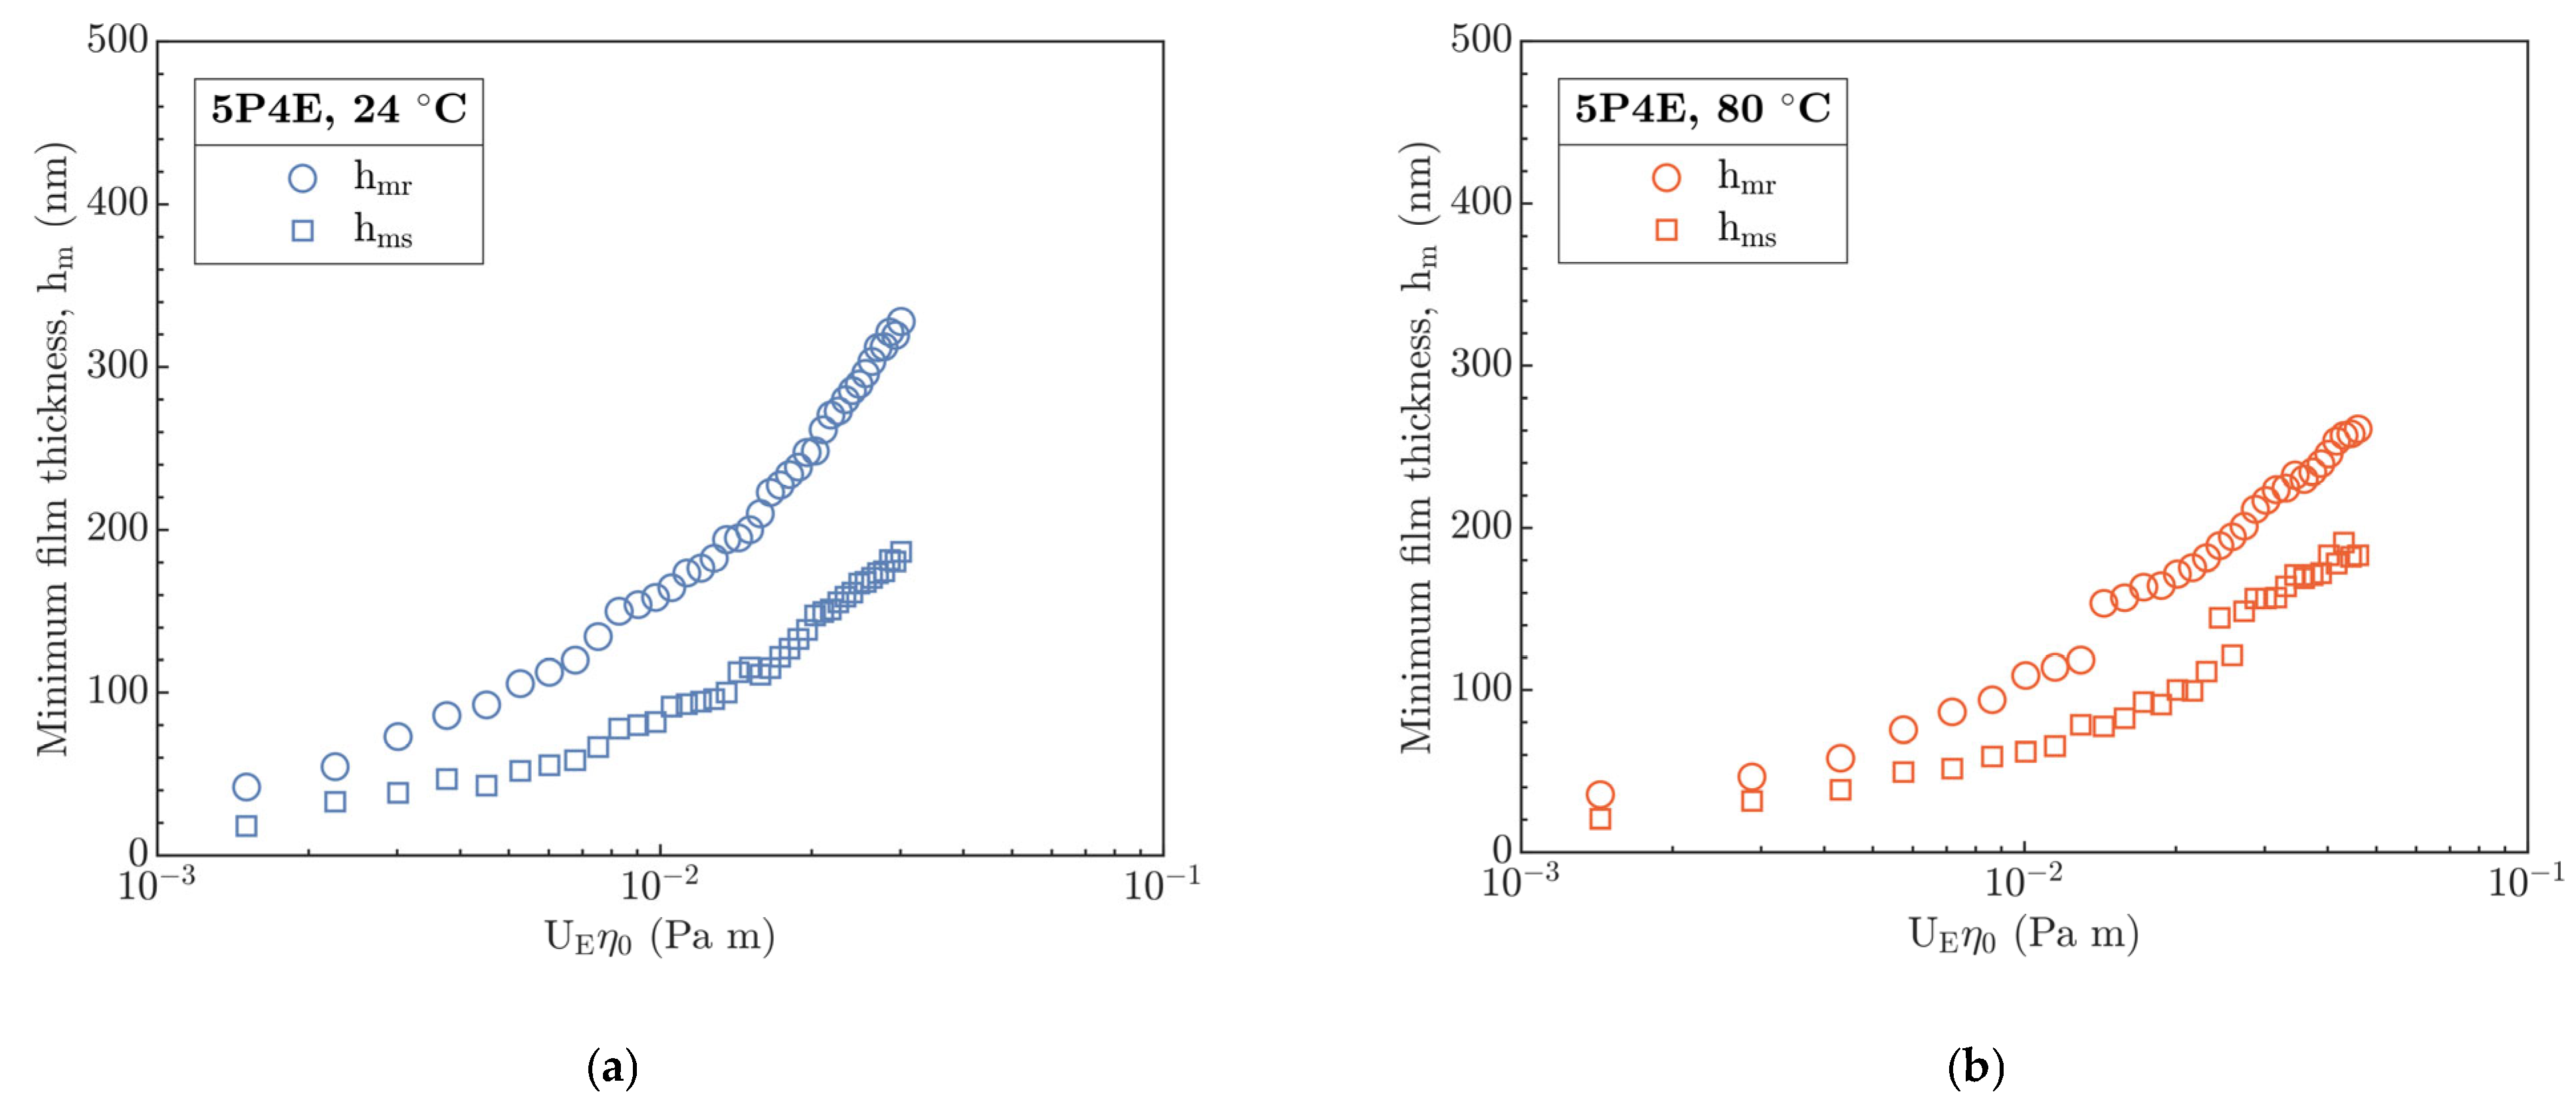
Based on the results in part B, the central (see
Figure 3) and minimum (see
Figure 4) film thickness in the contact of PMMA disc and steel ball were evaluated in dependence on the entrainment speed U
E and the inlet temperature T. A comparison of experimental data of central film thickness with the EHL prediction models by Hamrock and Dowson (H&D) for hard [
5] (P-E, see Equation (SA4)) and soft [
19] (I-E, see Equation (SA6)) EHL is demonstrated in
Figure 9 and
Figure 10 where the E
1 from
Table 6 was integrated. Both figures show a dependence of H
c on the product of U
Eη
0.
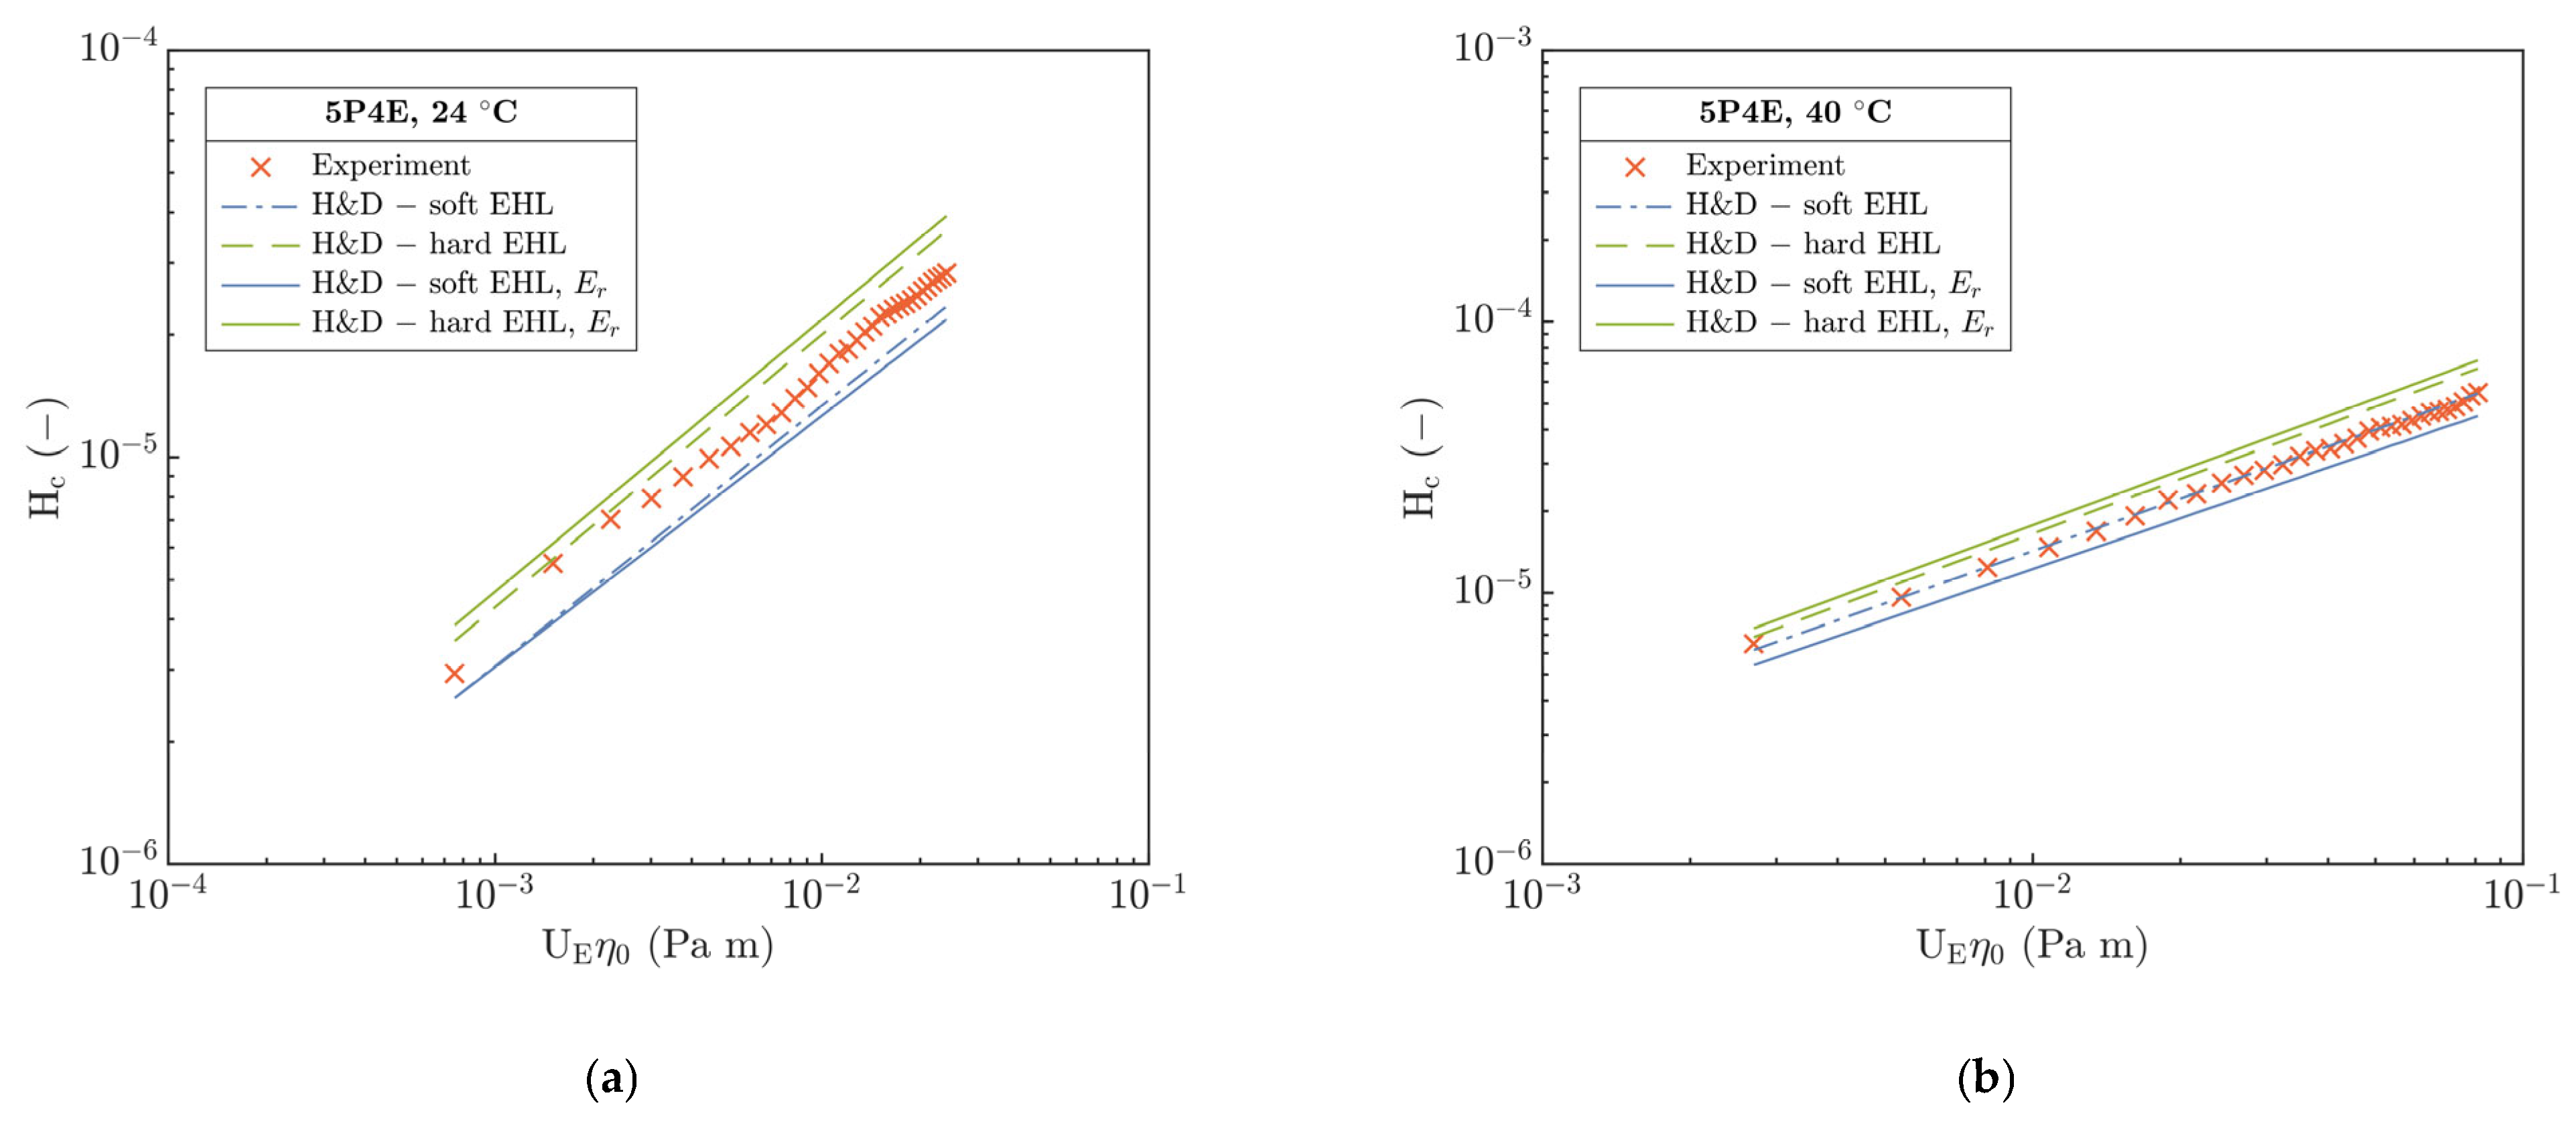
At 24 °C,
Figure 9a clearly shows a non-predisposition of experimental data to the soft as well as hard H&D, though H
c qualitatively corresponds better with the soft H&D with a difference of 19%. The measured H
c relative to the soft model is overestimated; however, for the hard one, it is underestimated. This may result from a significant viscosity effect of used 5P4E lubricant (see
Table 2) and only from a slight influence of temperature on the change in the mechanical properties of the polymer at 24 °C.
After the temperature increases to 40 °C, Hc correlates best with soft H&D by difference of ca. 2%. Moreover, the deviation of measured Hc from hard H&D slightly decreased as well as the deviation of predicted Hc between the soft and hard H&D. This could be a consequence of several interconnected effects—a decrease in η and the E with temperature and as a result of decrease in the contact pressure. One of other explanations for the difference between the experimental data and the soft H&D model especially at 24 °C may be a pressure–viscosity effect of the lubricant which correlates with the increase in the film thickness. However, for soft H&D, it is assumed that the effect of α is insufficient due to the expected low contact pressures in the I-E mode of EHL. Hence, (ER α) parameter is omitted from the soft EHL models, see Equation (SA6).
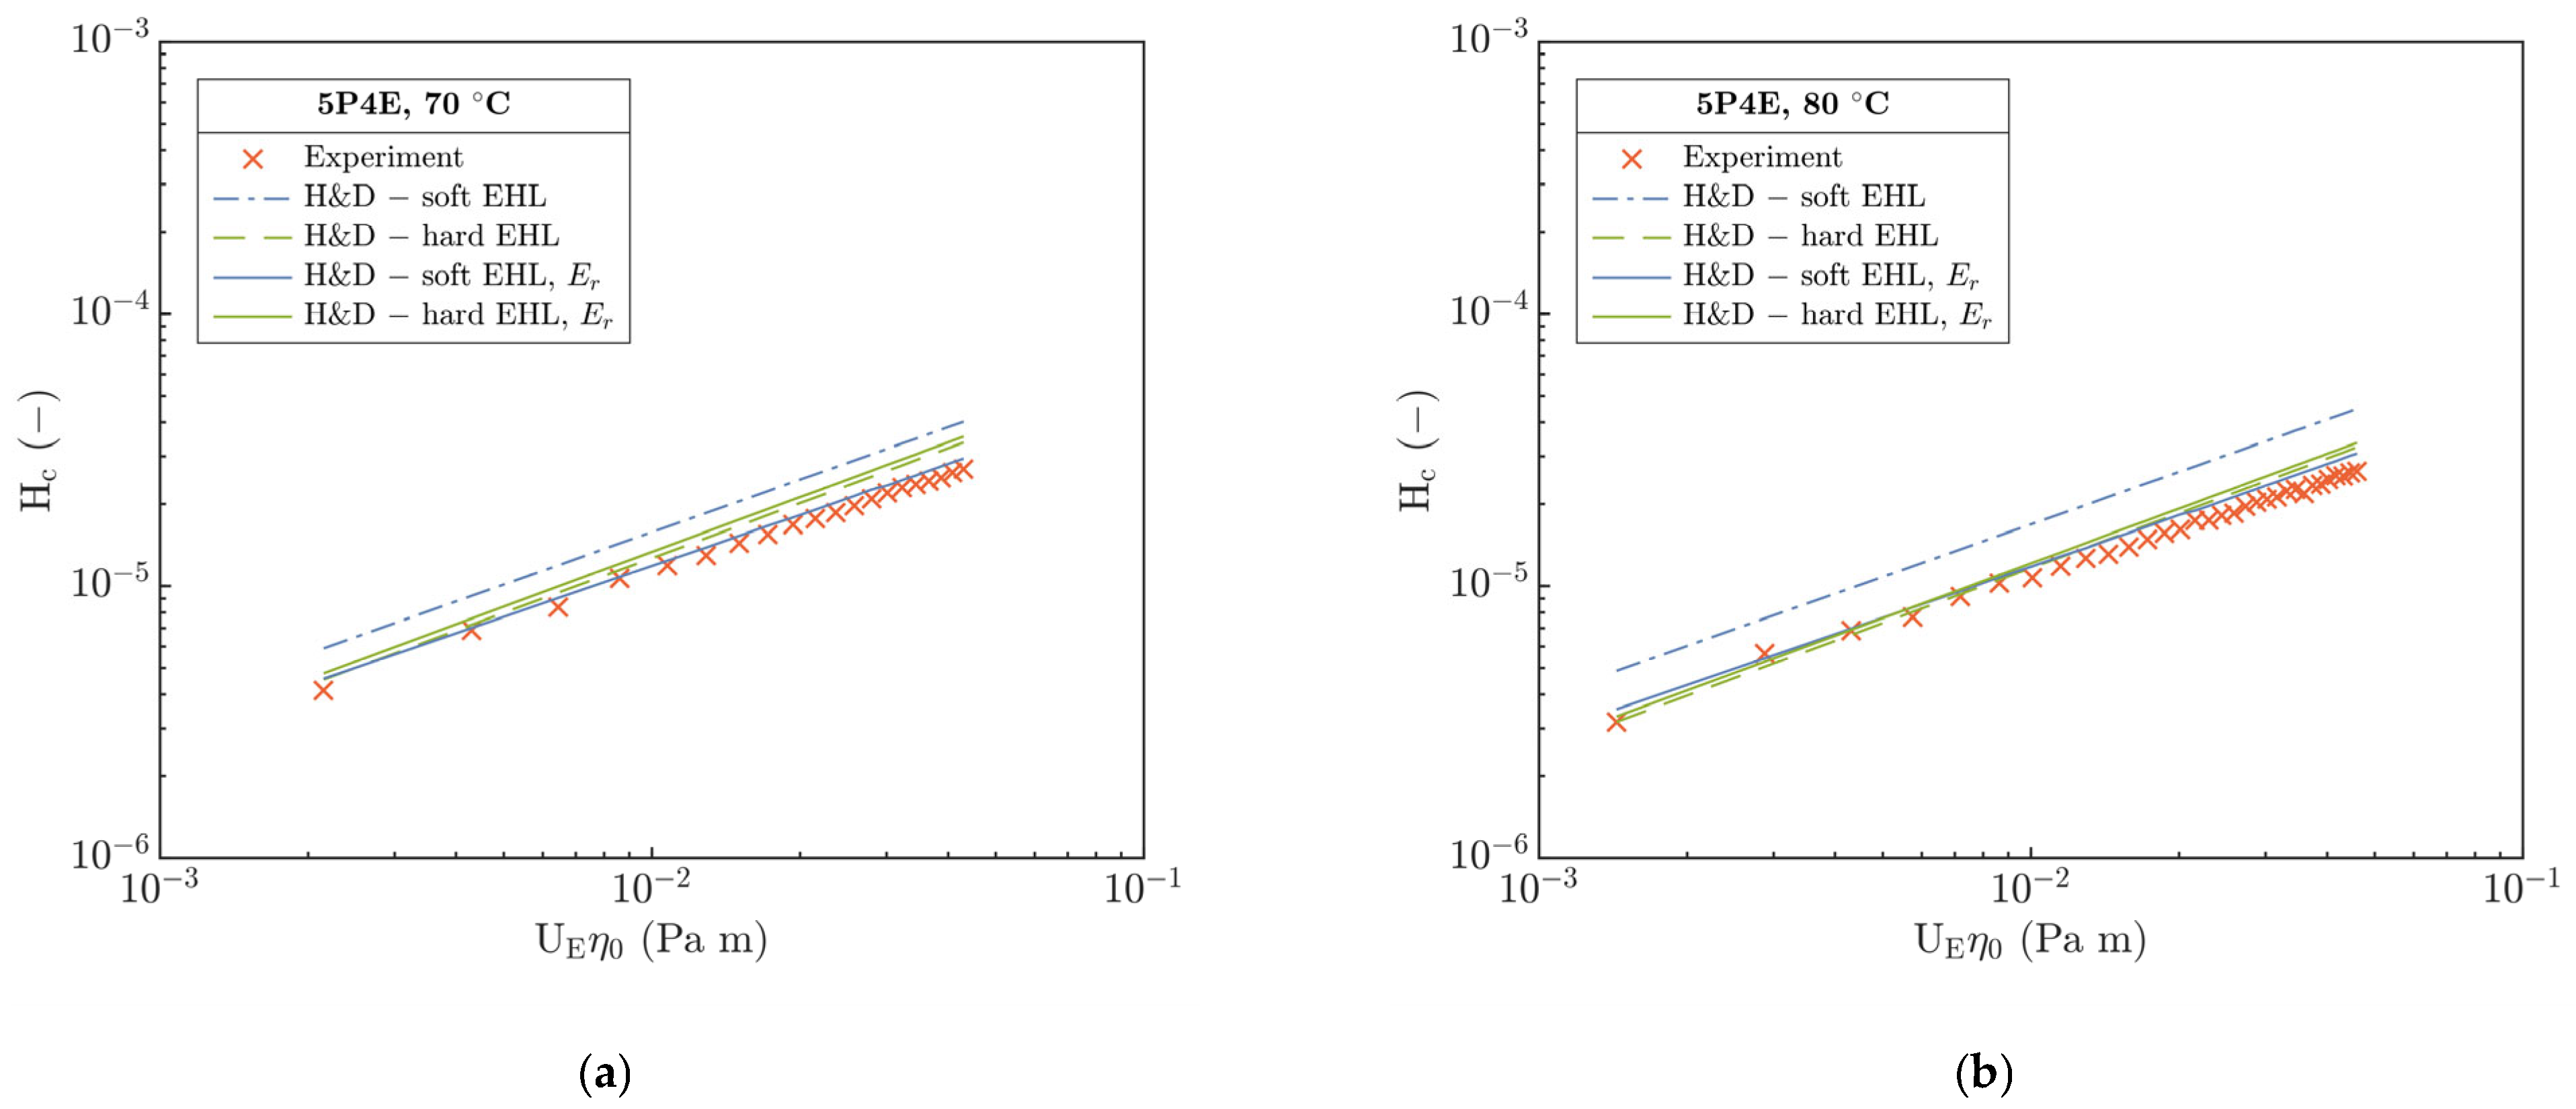
Interestingly, at temperatures of 70 and 80 °C in
Figure 10a,b, a good qualitative and quantitative agreement of experimental H
c with hard H&D model was observed. However, relative to soft H&D, the measured H
c is several times lower than the predicted H
c, which is in contradiction to the expected behavior with respect to the enhanced compliance of the contact as the temperature increased. Moreover, the η decreased about two orders of magnitude relative to its value at 24 °C.
With the increase in temperature from 70 to 80 °C, the difference in Hc between the hard and soft H&D was even more emphasized. A difference between the experimental Hc and the hard H&D is only 16% on the average compared to soft H&D, where it exceeds 60%. This points out a discrepancy that, after the temperature increases, the contact of a steel ball and PMMA disc should become more compliant as a consequence of a decrease in E, which corresponds well with the operation in the I-E mode of EHL. However, a decrease in E and thus an increase in contact compliance should be reflected by an increase in Hc. The origin of this discrepancy seems to be not clear yet.
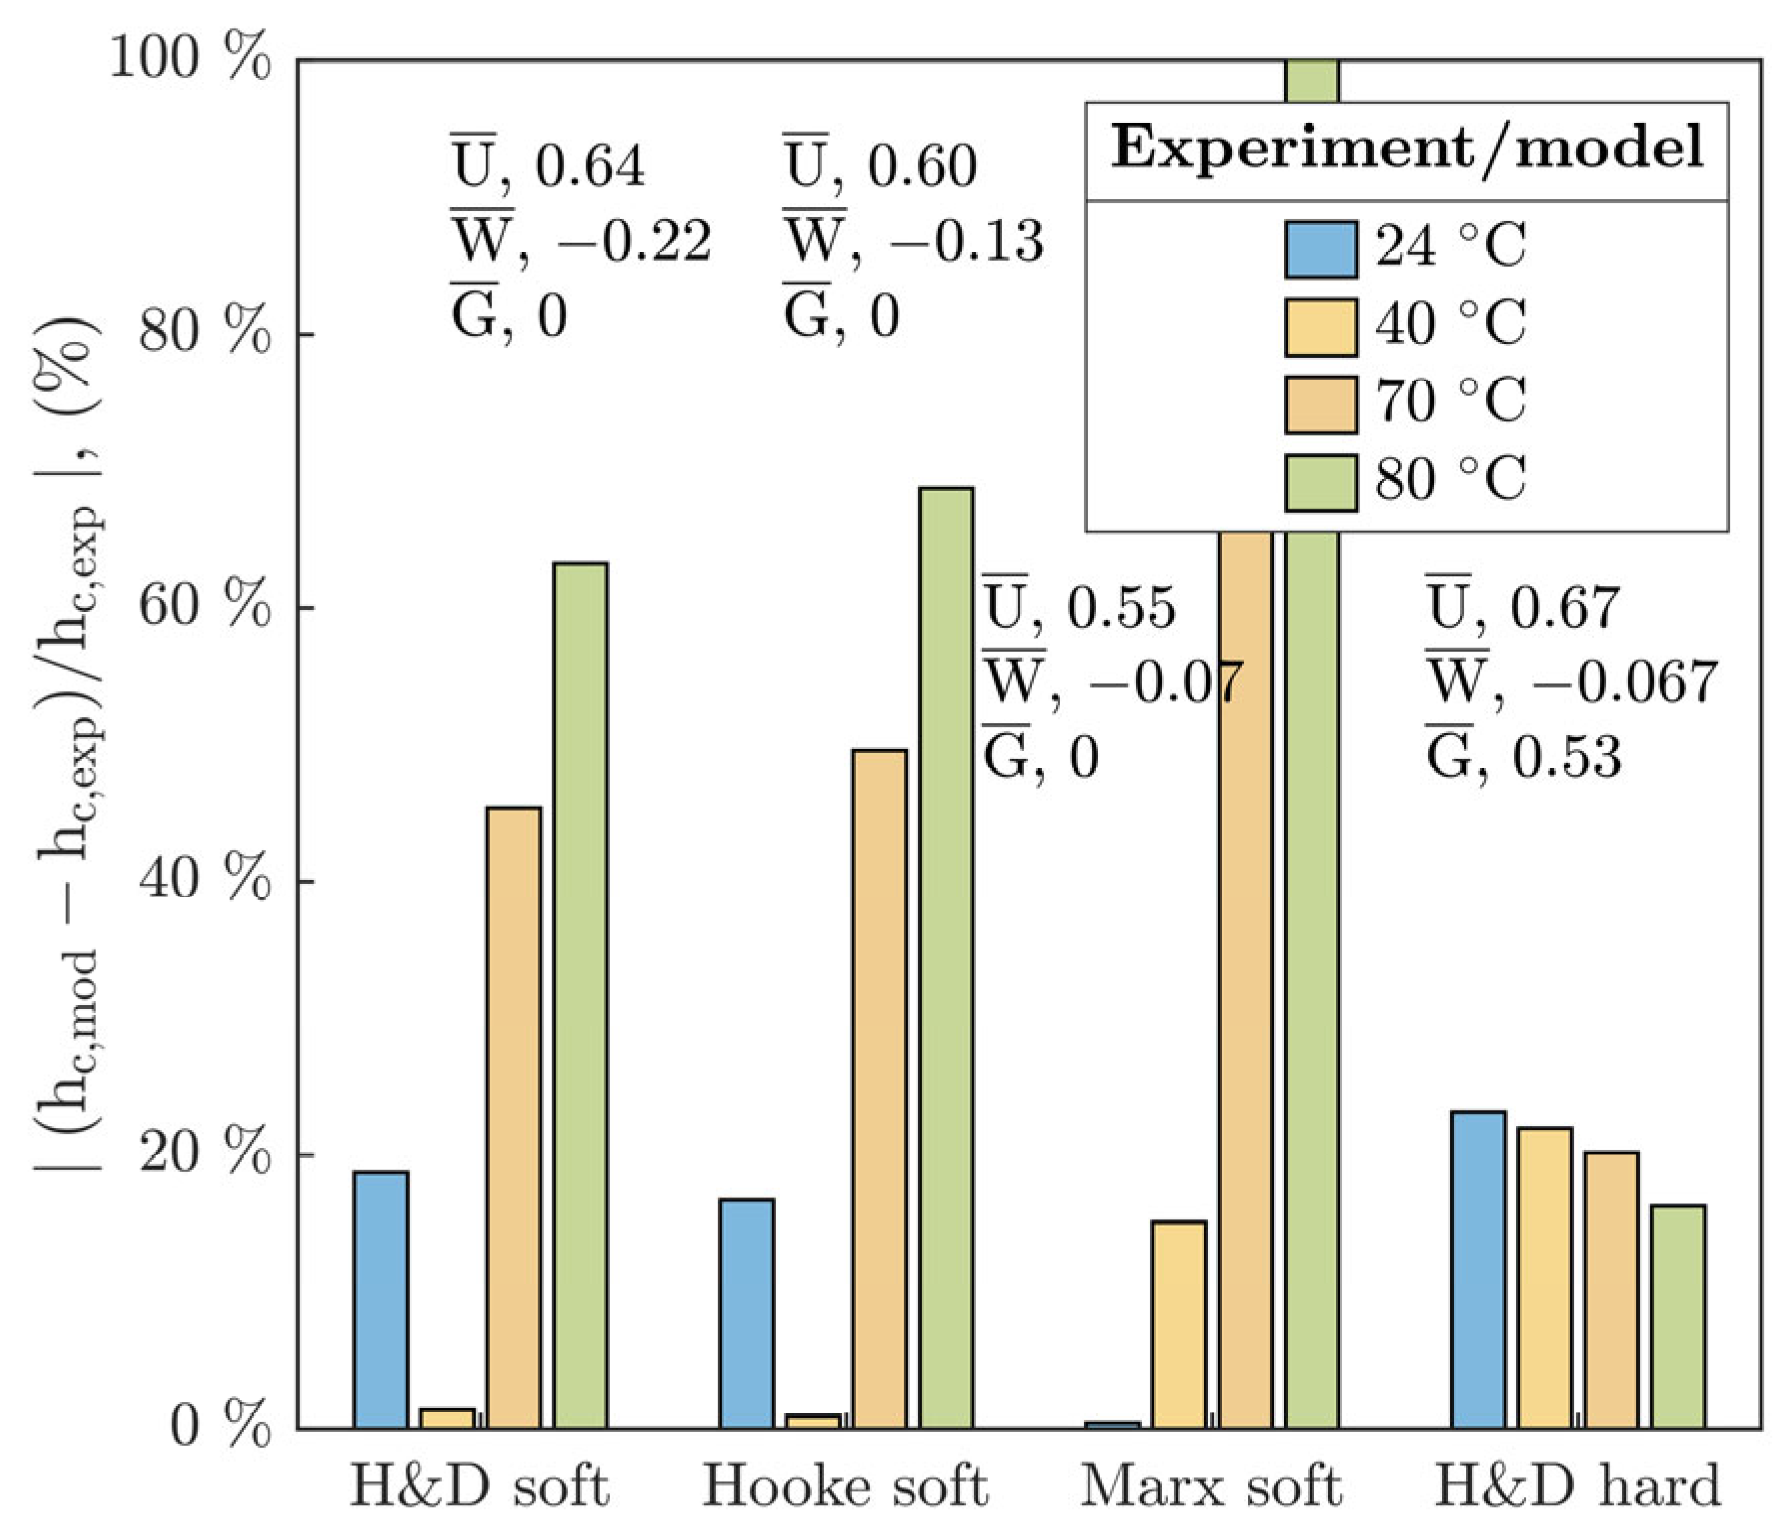
Besides the H&D models [
5,
19], the experimental data of h
c and h
m were compared with the Hooke et al. [
18] and Marx et al. [
20] soft EHL models. A discrete interpretation of the deviations of experiments relative to the prediction models is summarized in
Figure 11. Here, the main deviation is manifested at 70 and 80 °C; however, it is considerably higher than for the hard H&D, especially for the soft Marx’s and Hooke’s models where it exceeds 50%. Opposite to this, at the temperature of 24 °C, the Marx’s model corresponds well with only a slight deviation up to 3% of the average.
Surprisingly, at 40 °C, the H&D and Hooke’s soft models best match with the experimental Hc. Generally, the best agreement is demonstrated by the hard H&D with deviation of ca. 15% in the entire temperature interval. In addition, a discrete evaluation of the deviations of the minimum film thickness at the exit of the contact hmr,exp relative to hmr,mod (for H&D see Equations (SA5) and (SA7)) demonstrated a higher deviation than for hc,exp except for the hard H&D.
Comparing the results with EHL models, it is clear that, at high temperatures, the measured thicknesses are different from those predicted. There are several possibilities of how to explain this discrepancy. One of them may be the difference between the material properties and the assumptions of the models including the material parameters such as the E and the v, both defined for Hookean material. However, PMMA is a viscoelastic material whose properties are strongly dependent on time—loading rate, magnitude of strain under loading, and temperature. Nevertheless, these properties are not considered in the EHL models where their influence could be expected especially for the compliant contacts.
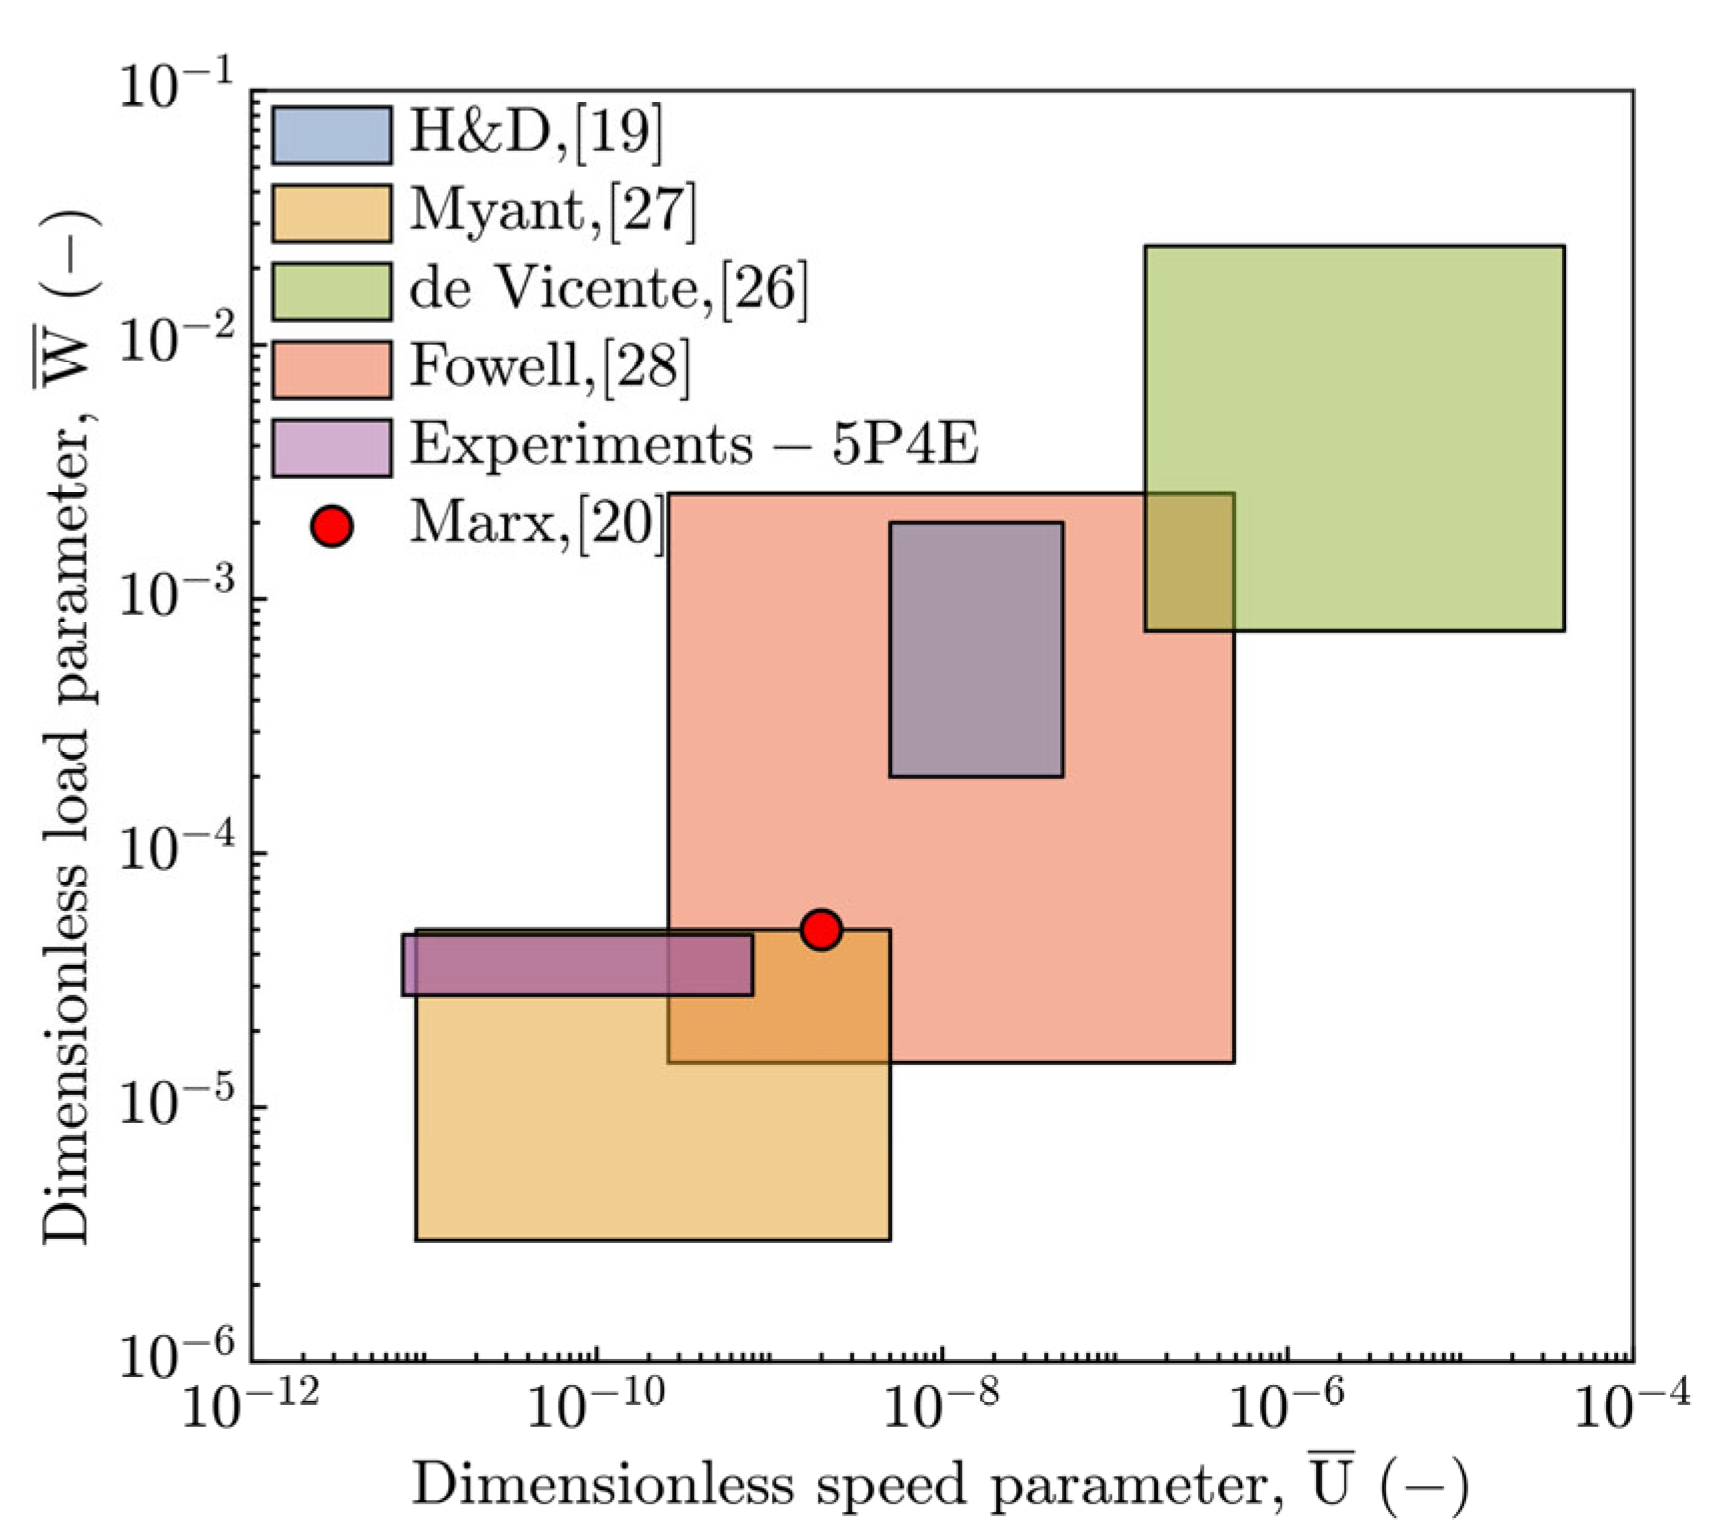
Observed deviations of h
c and h
m from the soft EHL models put into the contrast the operating conditions for which the individual prediction formulae were numerically derived or experimentally regressed and for which they are potentially valid. With respect to this, the operating region of experiments was compared with other works [
19,
20,
26] in the field of soft EHL according to the speed
and load
parameters, see
Figure 12. This figure shows a possible source of disagreement of fluid-film thickness between the current study and the H&D model [
19], especially for temperature T ≥ 40 °C, where the increase in T corresponds with the increase in
parameter. It is evident that the operation region does not match with soft H&D model.
The present study (purple rectangle) almost fully corresponds to the study by Myant et al. [
27] according to the speed
as well as load
parameter. On the other hand, the current study is consistent with the results published by Fowell et al. [
28] with respect to the
. However, relative to the
, it partially differs. The experimental conditions by de Vicente et al. [
26] are shifted to higher values of
as well as
and thus they considerably differ, see
Figure 12.
Nevertheless, the research of the other authors corresponds to a considerably different material configuration of contact pair, except for the study by Marx et al. [
20], where the used elastomers and polymers, such as PDMS, exhibit a significant compliance. This reveals a difference from the current study as for mechanical properties of PMMA, see
Table 1. Moreover, in these studies, the contact was often operated only up to 40 °C, where the E is not radically affected by temperature.
Except for
and
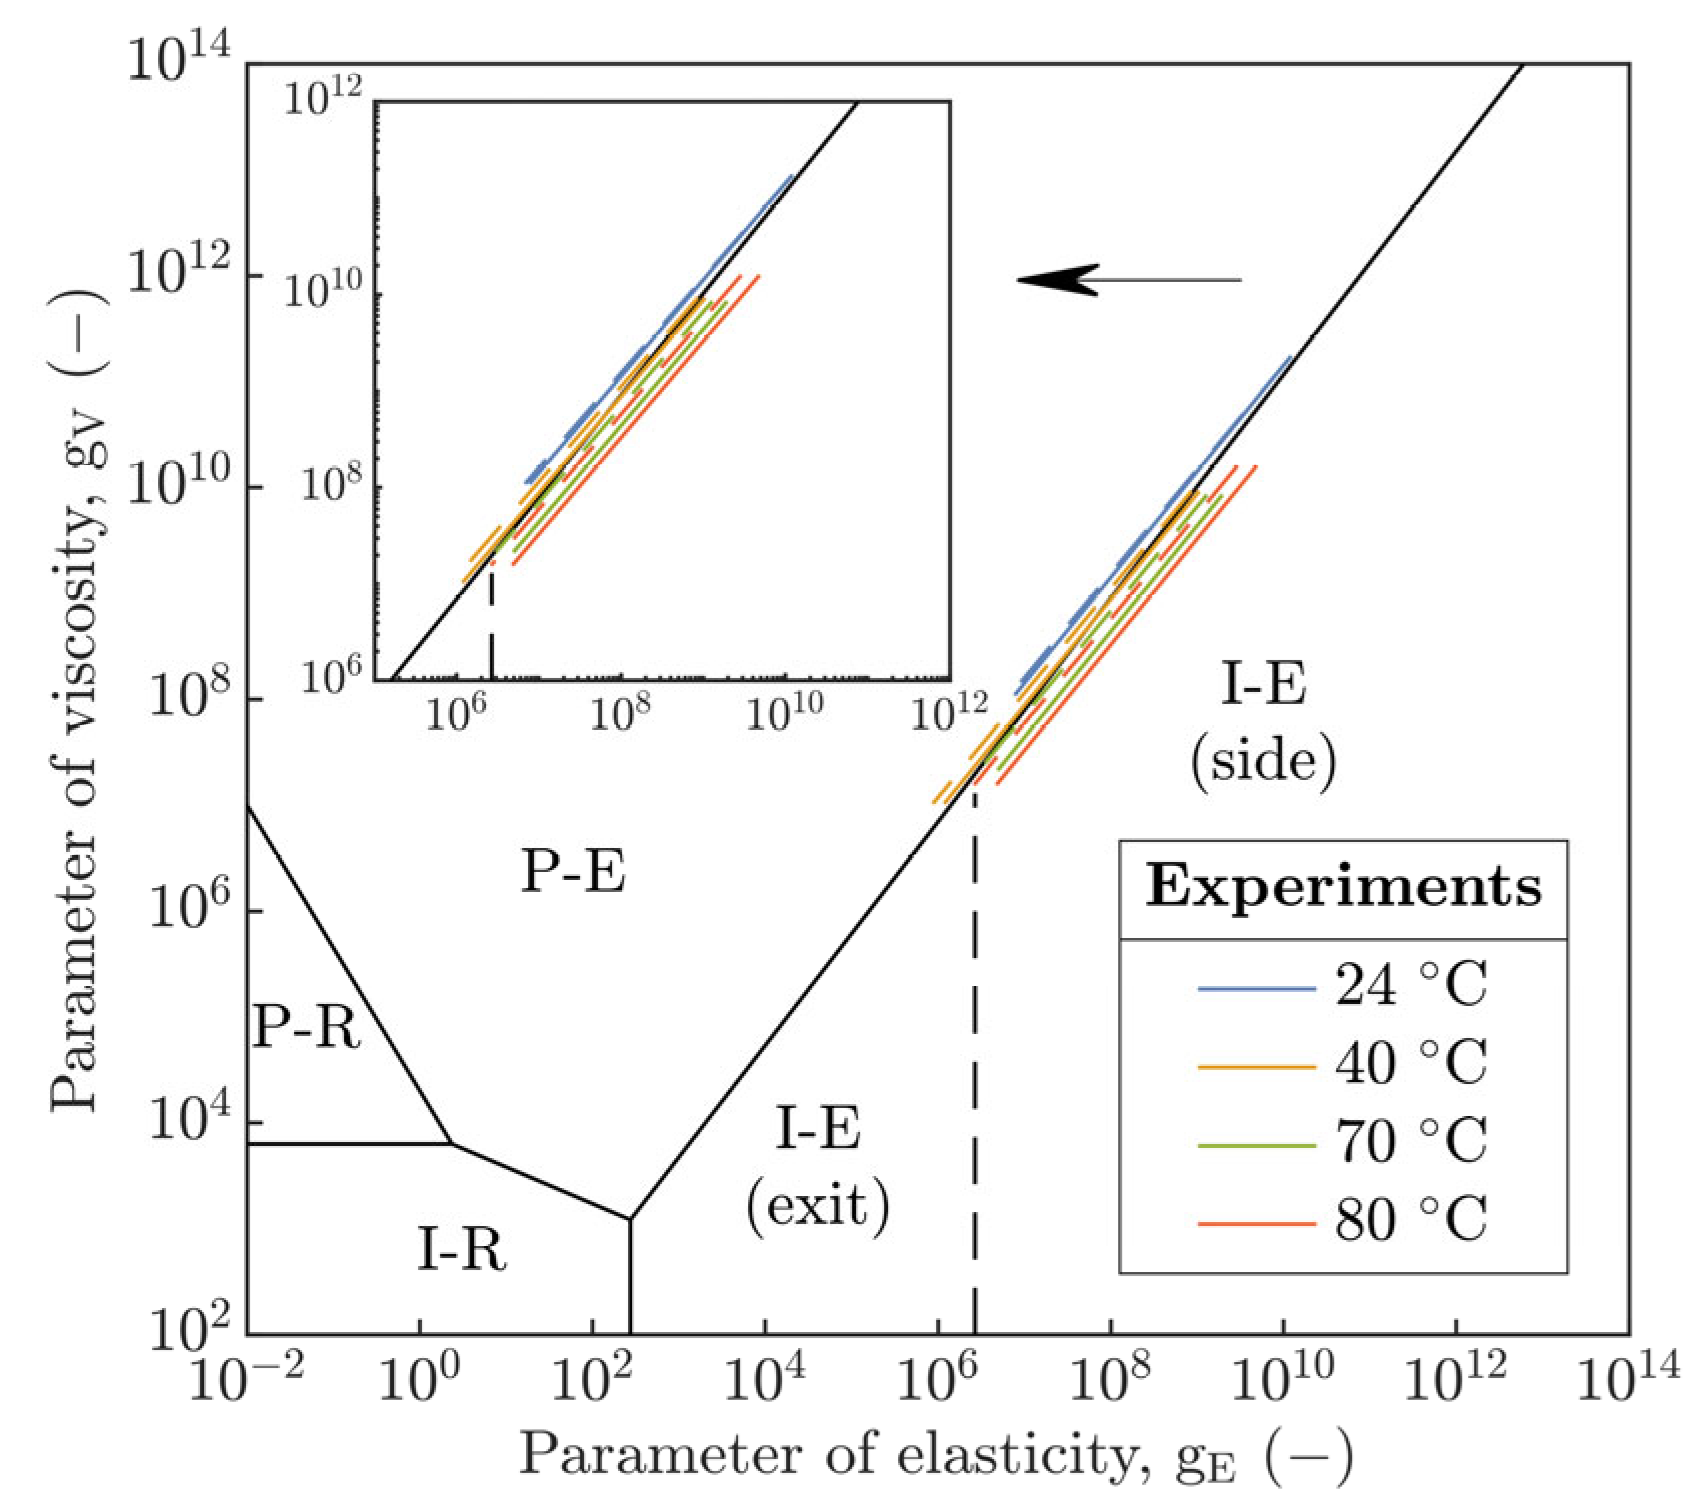
parameters, the operating conditions of the current study were compared relative to the Johnson’s parameters [
21] of viscosity g
V (Equation (SA1)) and elasticity g
E (Equation (SA2)) in the hydrodynamic map of EHL, see
Figure 13. According to the hydrodynamic map, the contact was operated in the TR region [
29,
30] between the P-E and I-E modes with predisposition to the former or latter mode in the dependence on T that affects the η of the lubricant (see
Table 2) as well as the E of polymer (see
Table 6).
Based on
Figure 13, it is evident that, at 24 °C, the circular contact was operated in the P-E mode characteristic for rigid contacts and usually relevant to the steel–steel, steel–glass or steel–sapphire contact pairs that exhibit a high contact pressure in the field of EHL. This could explain a good agreement of h
c as well as h
m compared to the hard H&D model [
5] rather than to the soft one [
19] at this temperature, see
Figure 9a. At 40 °C, the contact was closest to the boundary of both EHL modes where Equation (SA4) or Equation (SA6) should not be directly applicable; however, a very good agreement of H
c with two soft EHL models [
18,
19] was recorded, see
Figure 11. At 70 and 80 °C, the contact was shifted in the TR region closer to the I-E mode, which could be related to the increase in compliance of the PMMA polymer with increasing temperature.
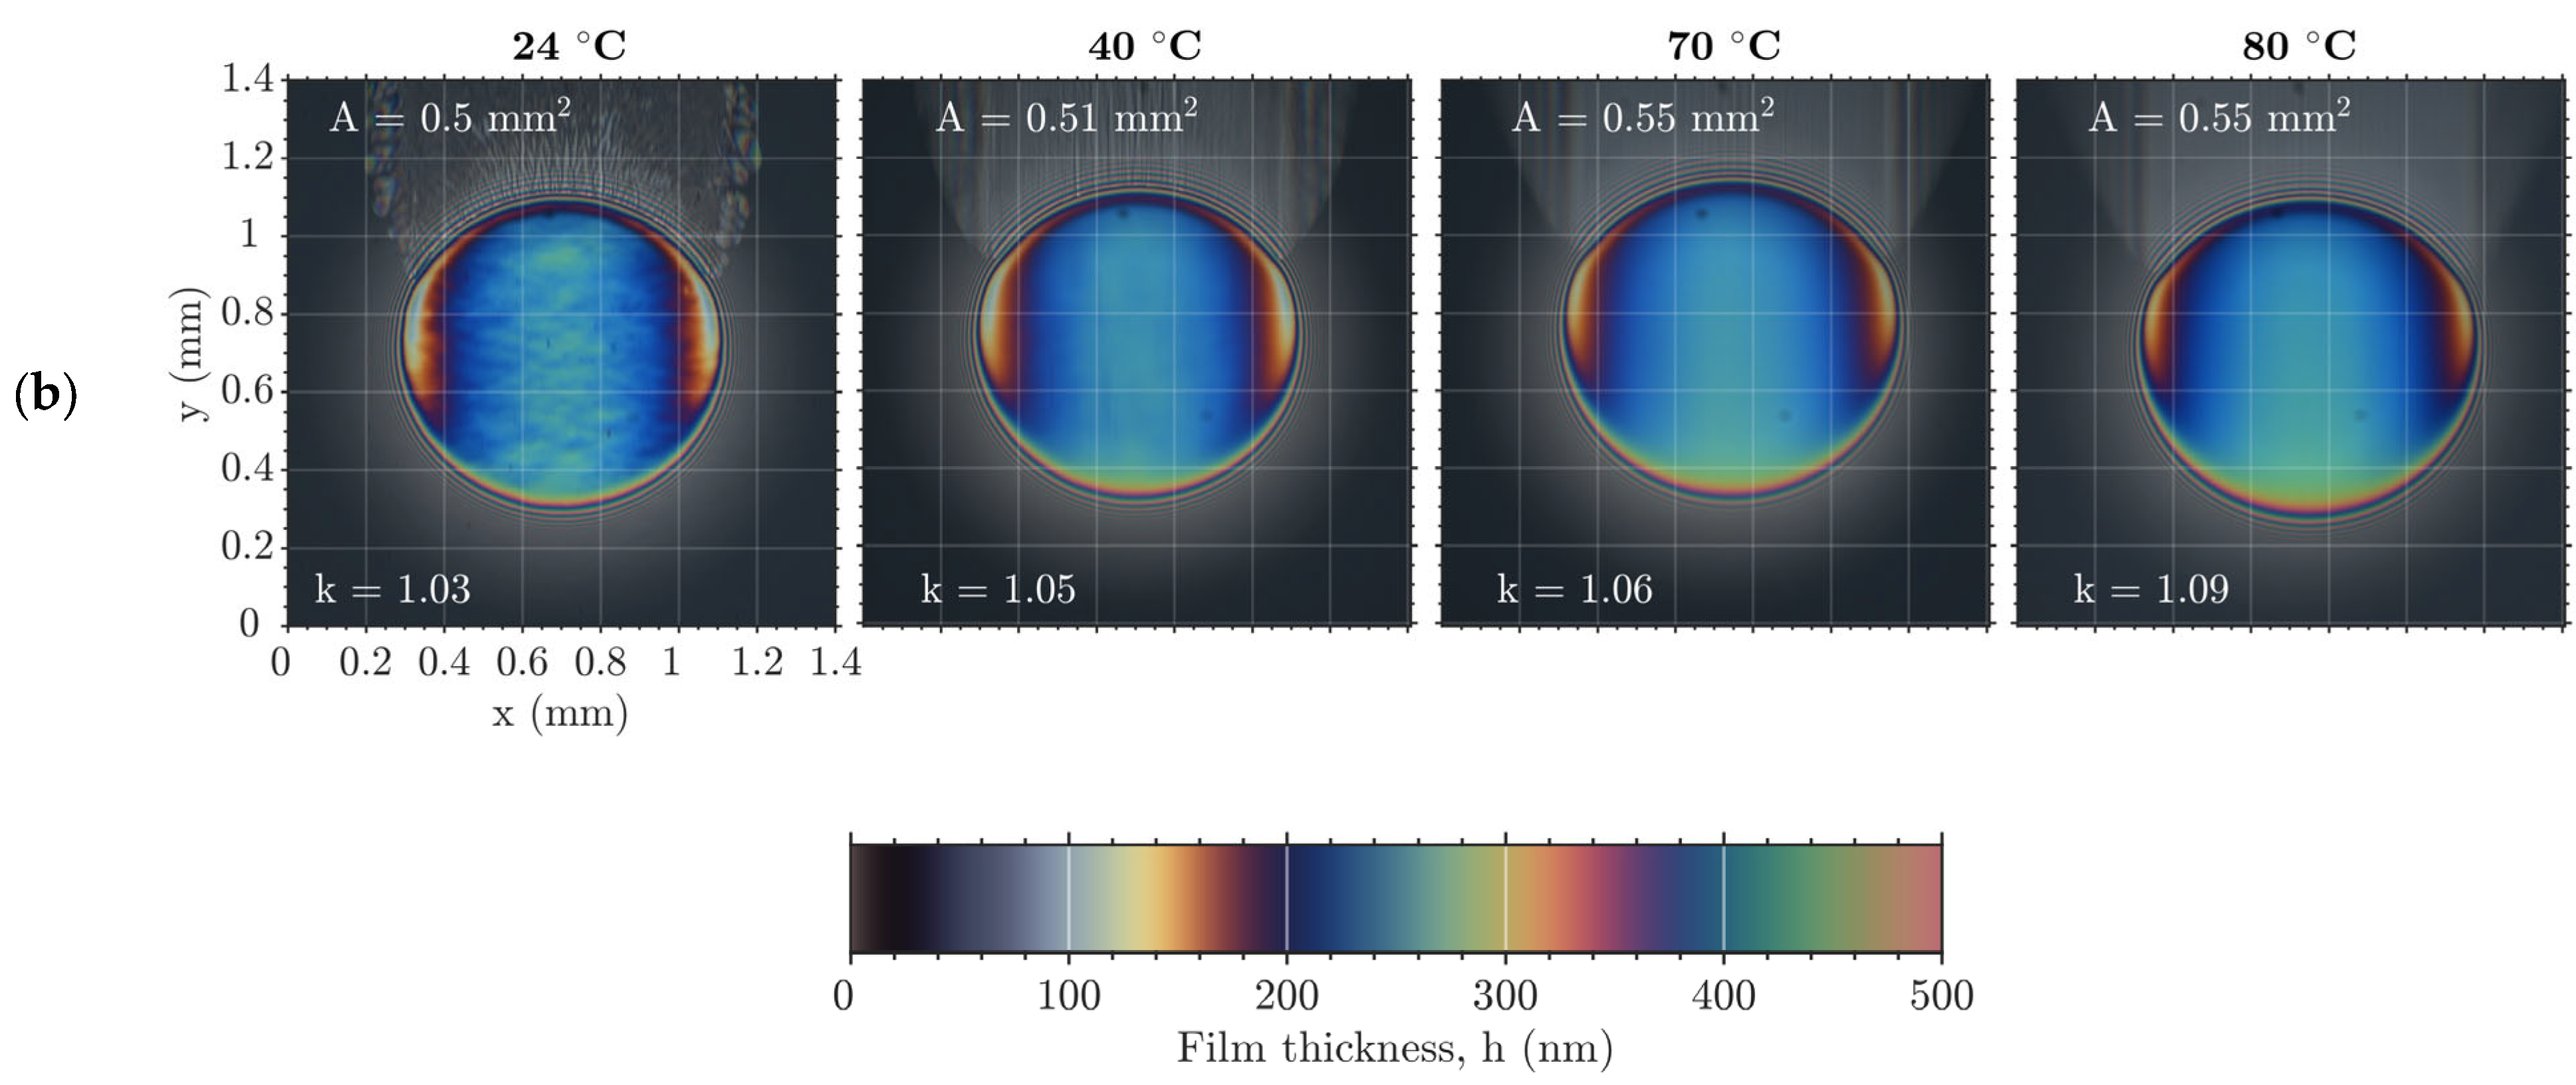
The transition of h
m assumed by Hooke et al. [
18] from the side lobes to the exit of the contact with increase in U
E was not attained, see
Figure 13. Thus, h
m was always located at the side lobes of the horseshoe, see
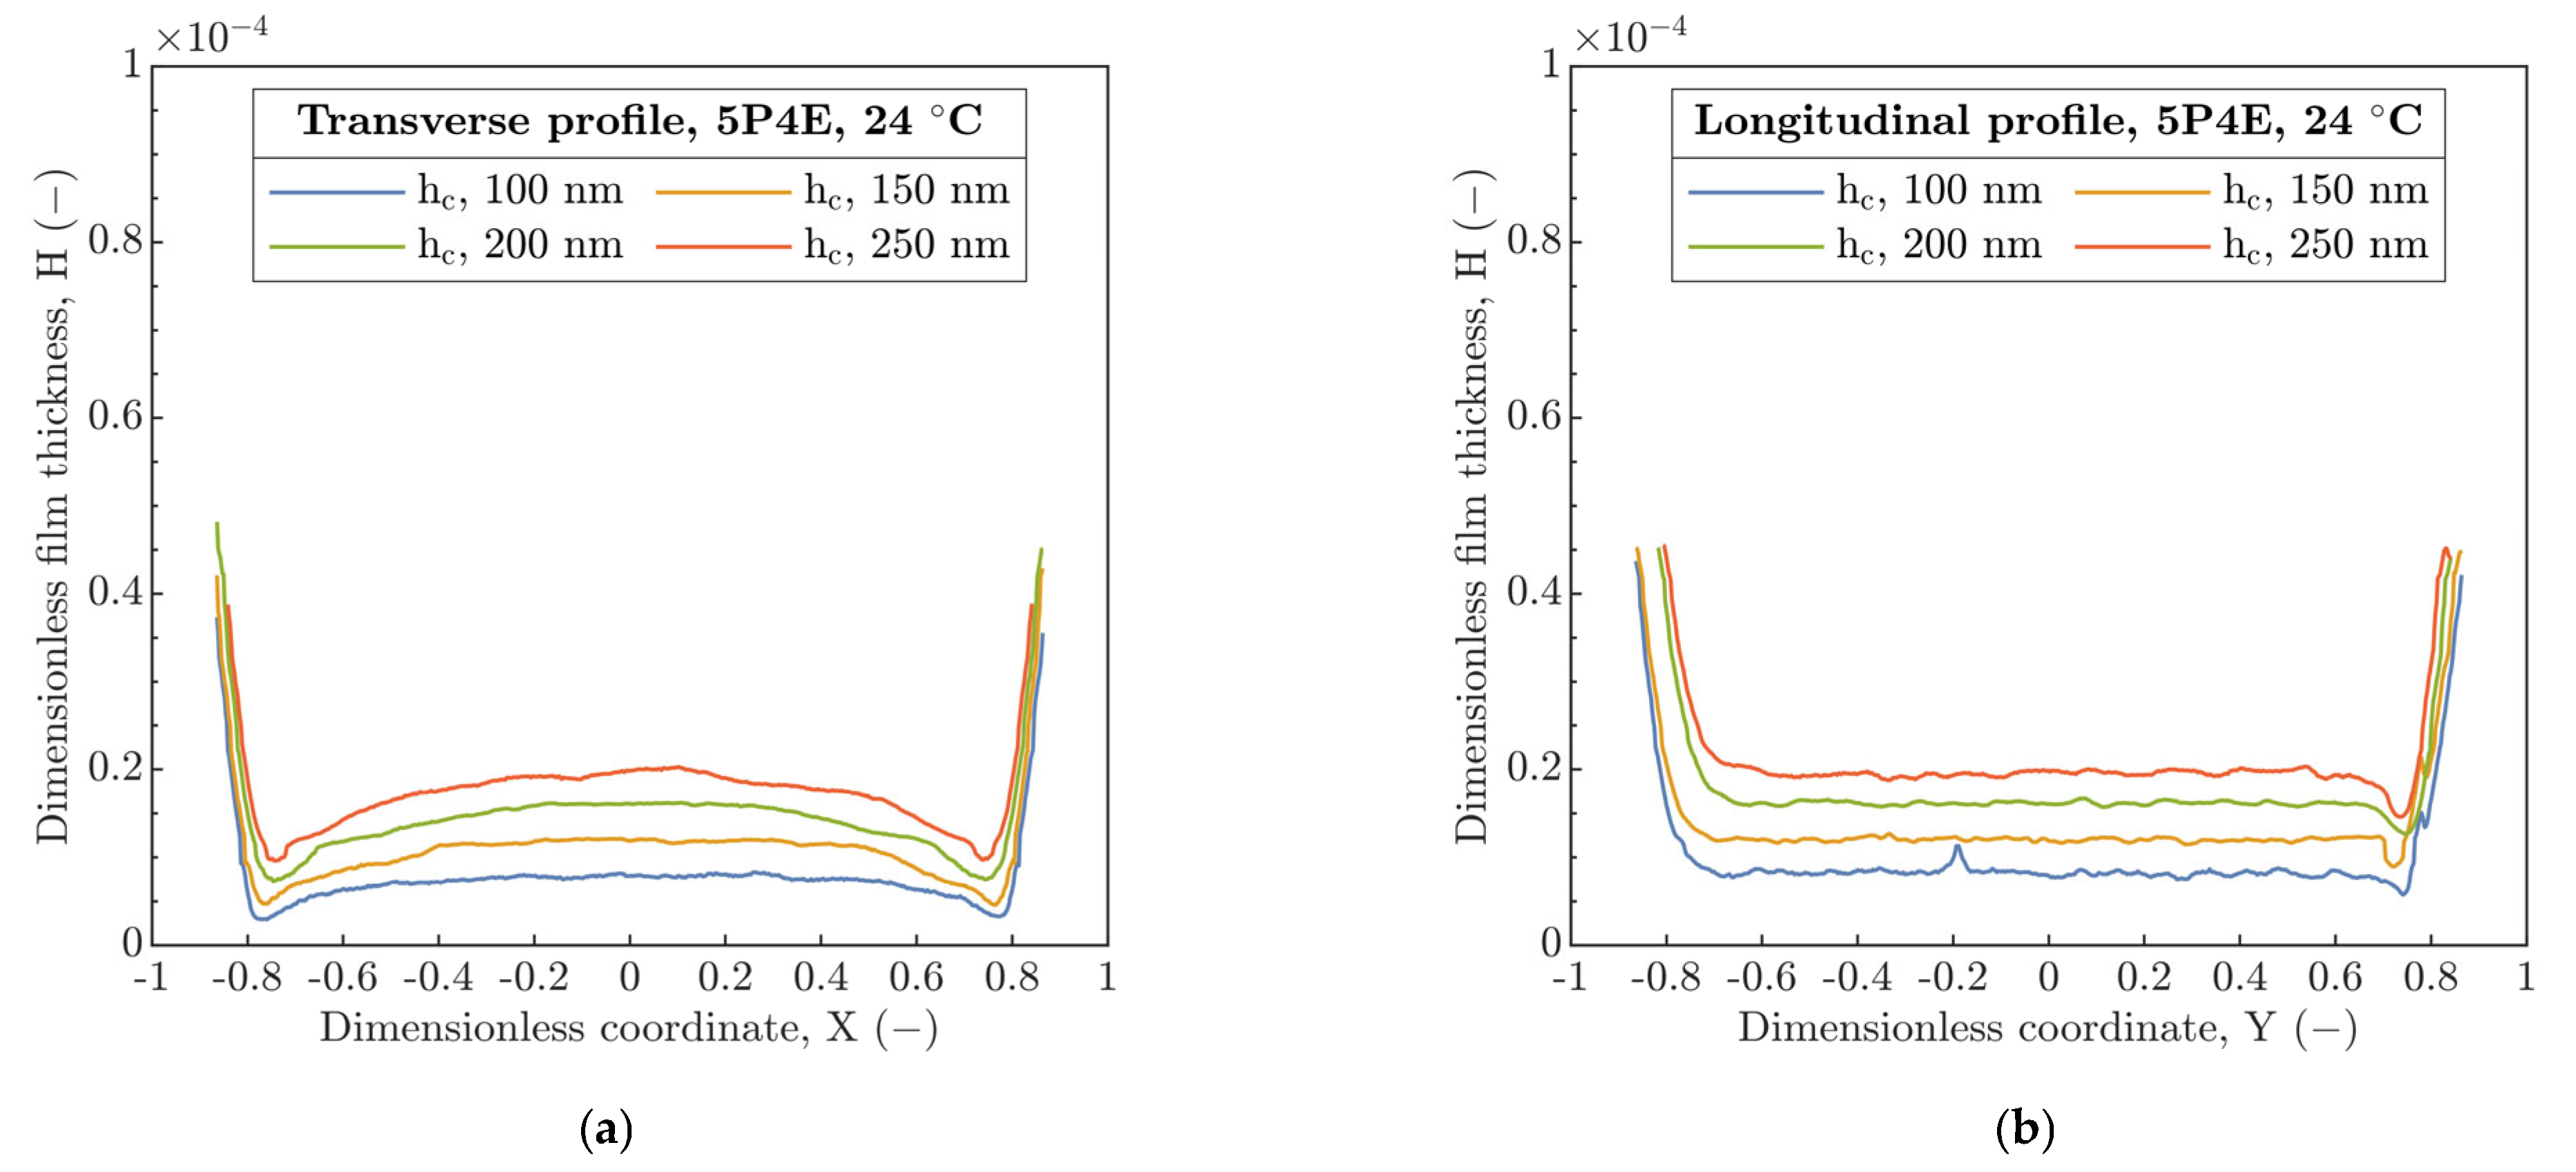
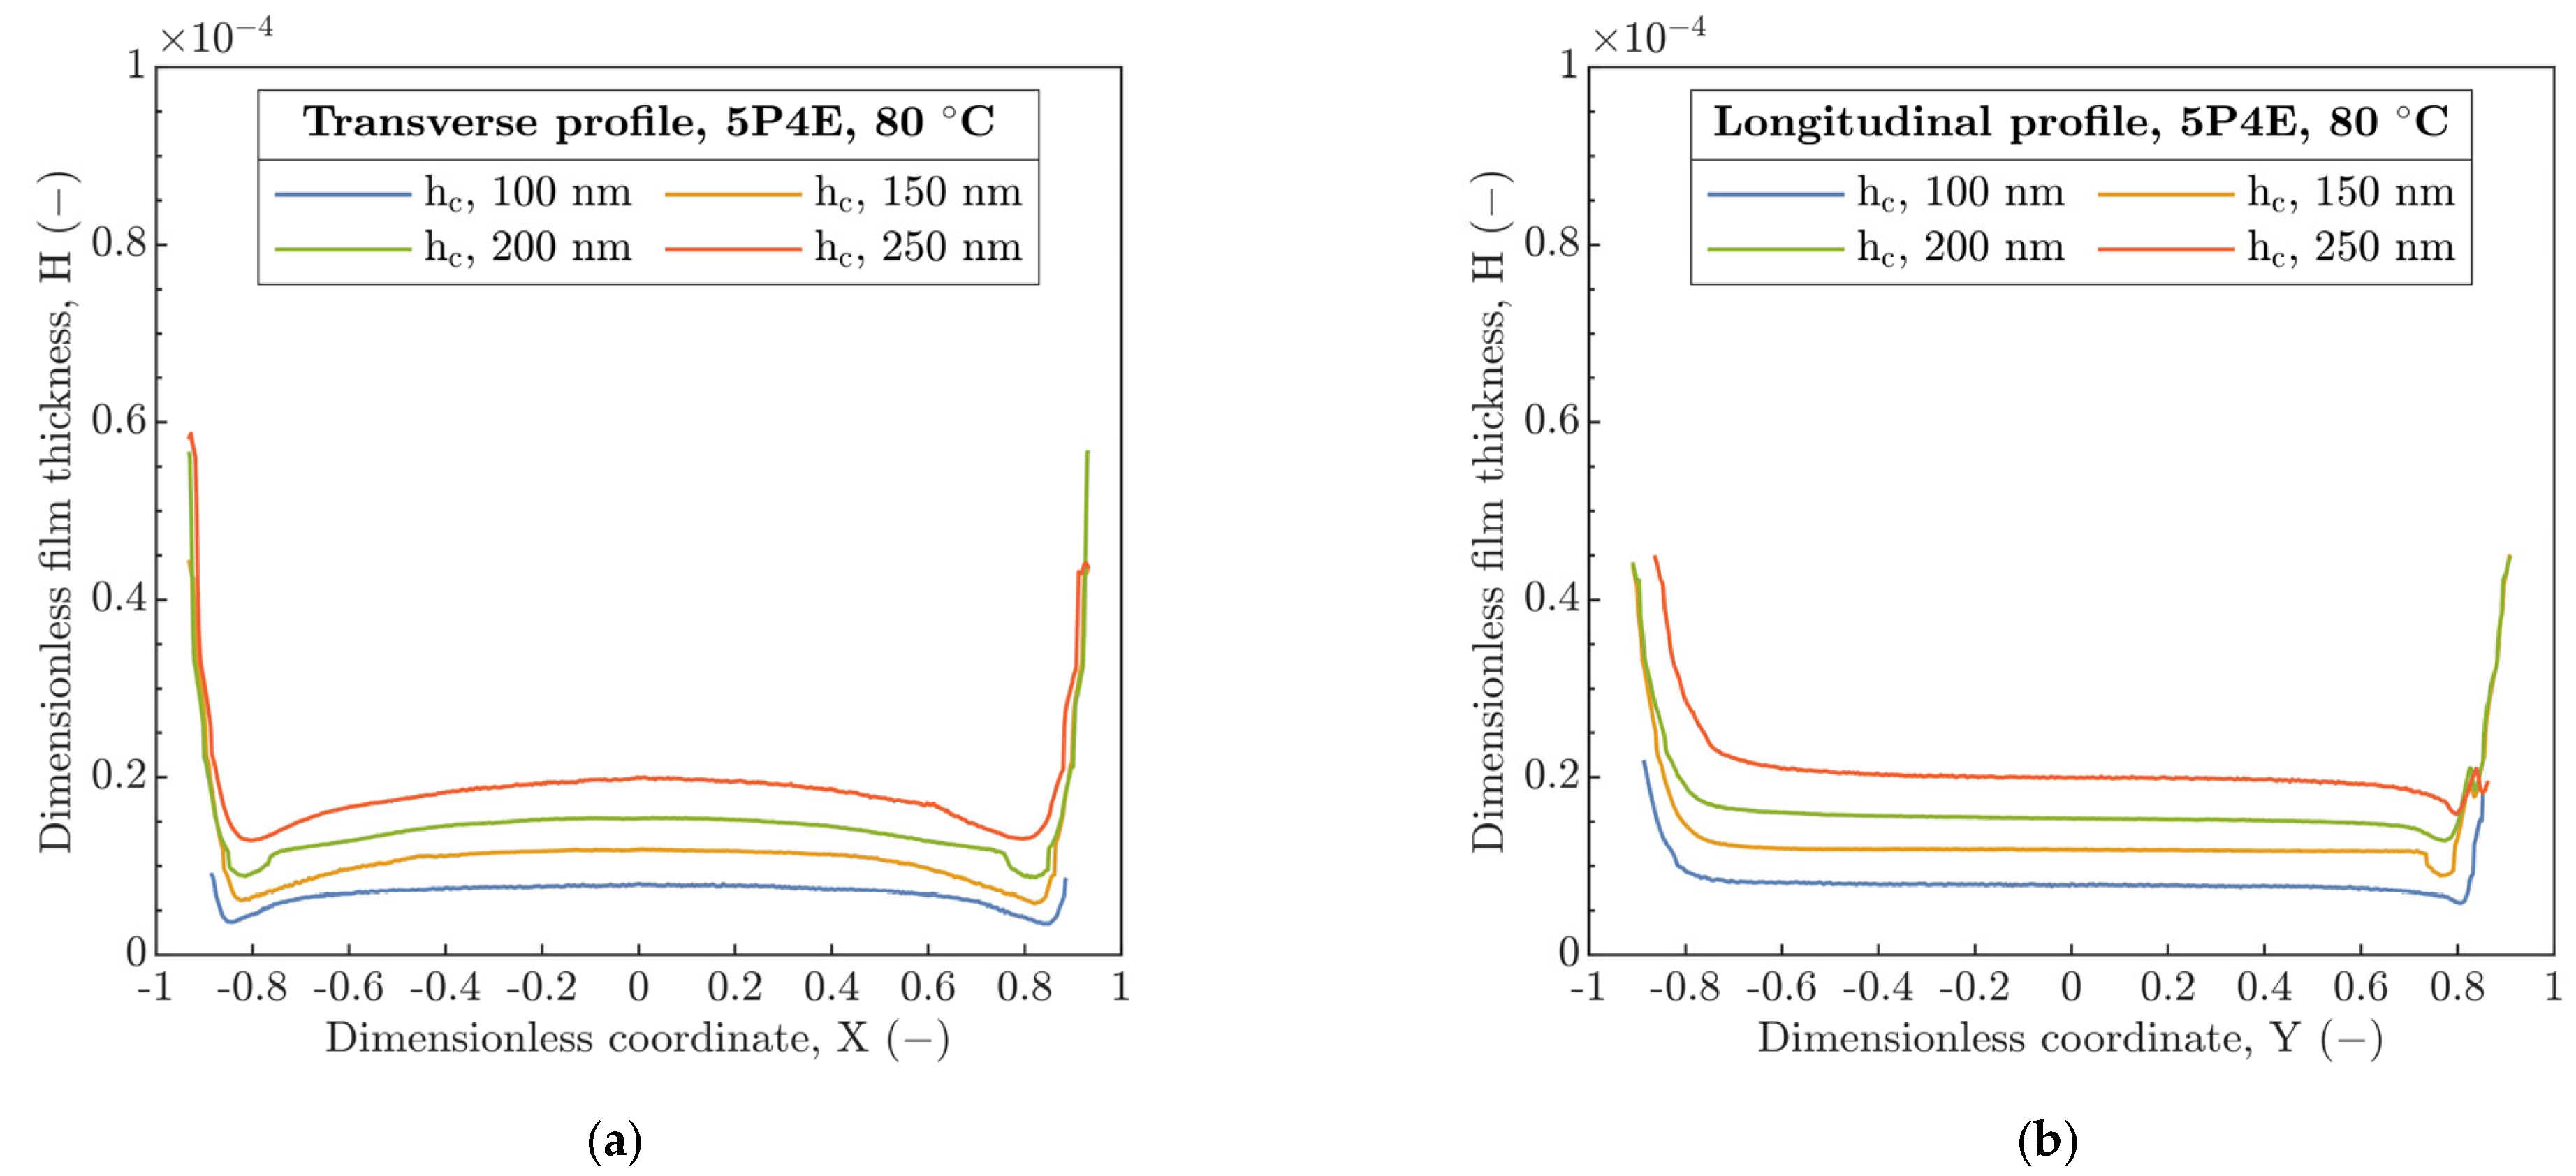
Figure 4. Compared to [
31], the film thickness profiles, see
Figure 5 and
Figure 6, did not show a transition of the secondary minimum from the exit to the inlet of the contact due to the increase in U
E considering the viscoelastic response of the material. Then, the increase in U
E causes a rather elastic than viscoelastic response of the material, which is in accordance with
Figure 2a,b. Thus, the stiffness of the compliant material increases.
However, a shrinkage in the longitudinal film thickness profiles was discovered with respect to the U
E increase, see
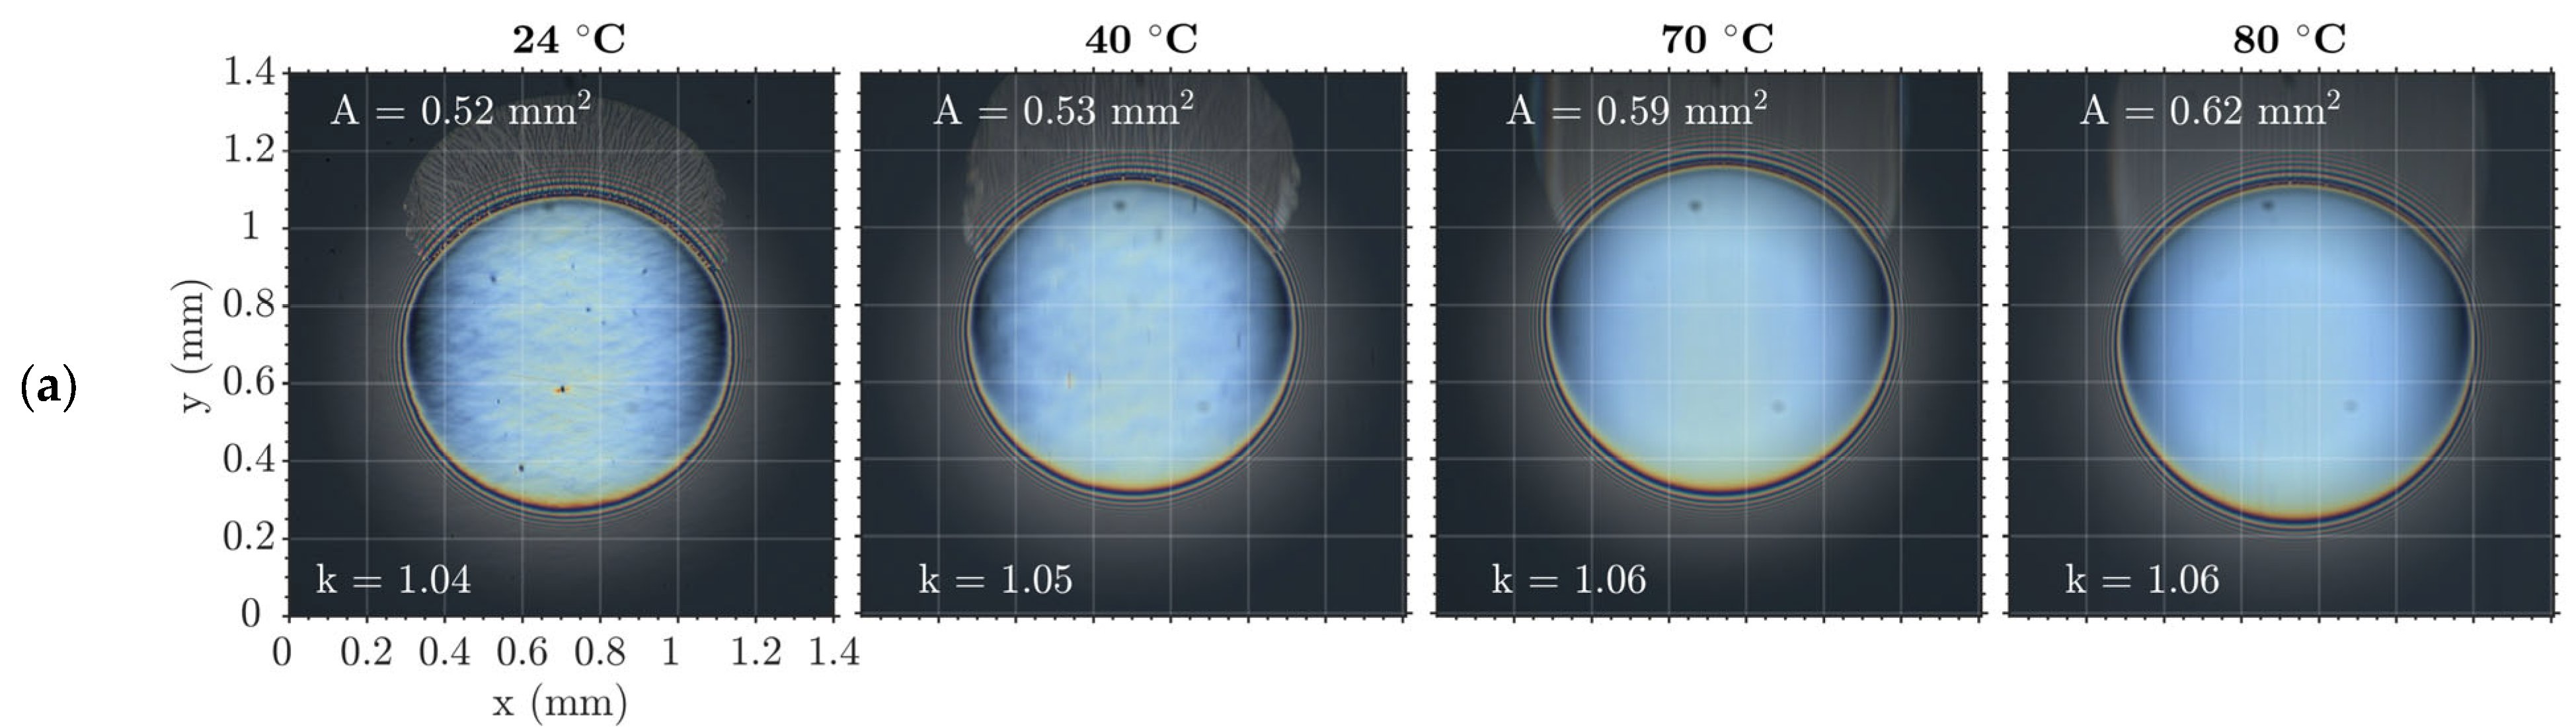
Figure 7a,b. Here, the increase in U
E corresponds to a higher film thickness, where the shrinkage effect is more pronounced. This corresponds to the variations in ellipticity and the contact area for running contacts, while, for static contacts, it was mainly unchanged, see
Table 5. Based on this, the question arises, how a distribution of the contact pressure in the compliant contact was affected. Nevertheless, the experimental approach dealing with the distribution of the contact pressure is somewhat challenging in the connection with the analysis of fluid-film thickness.
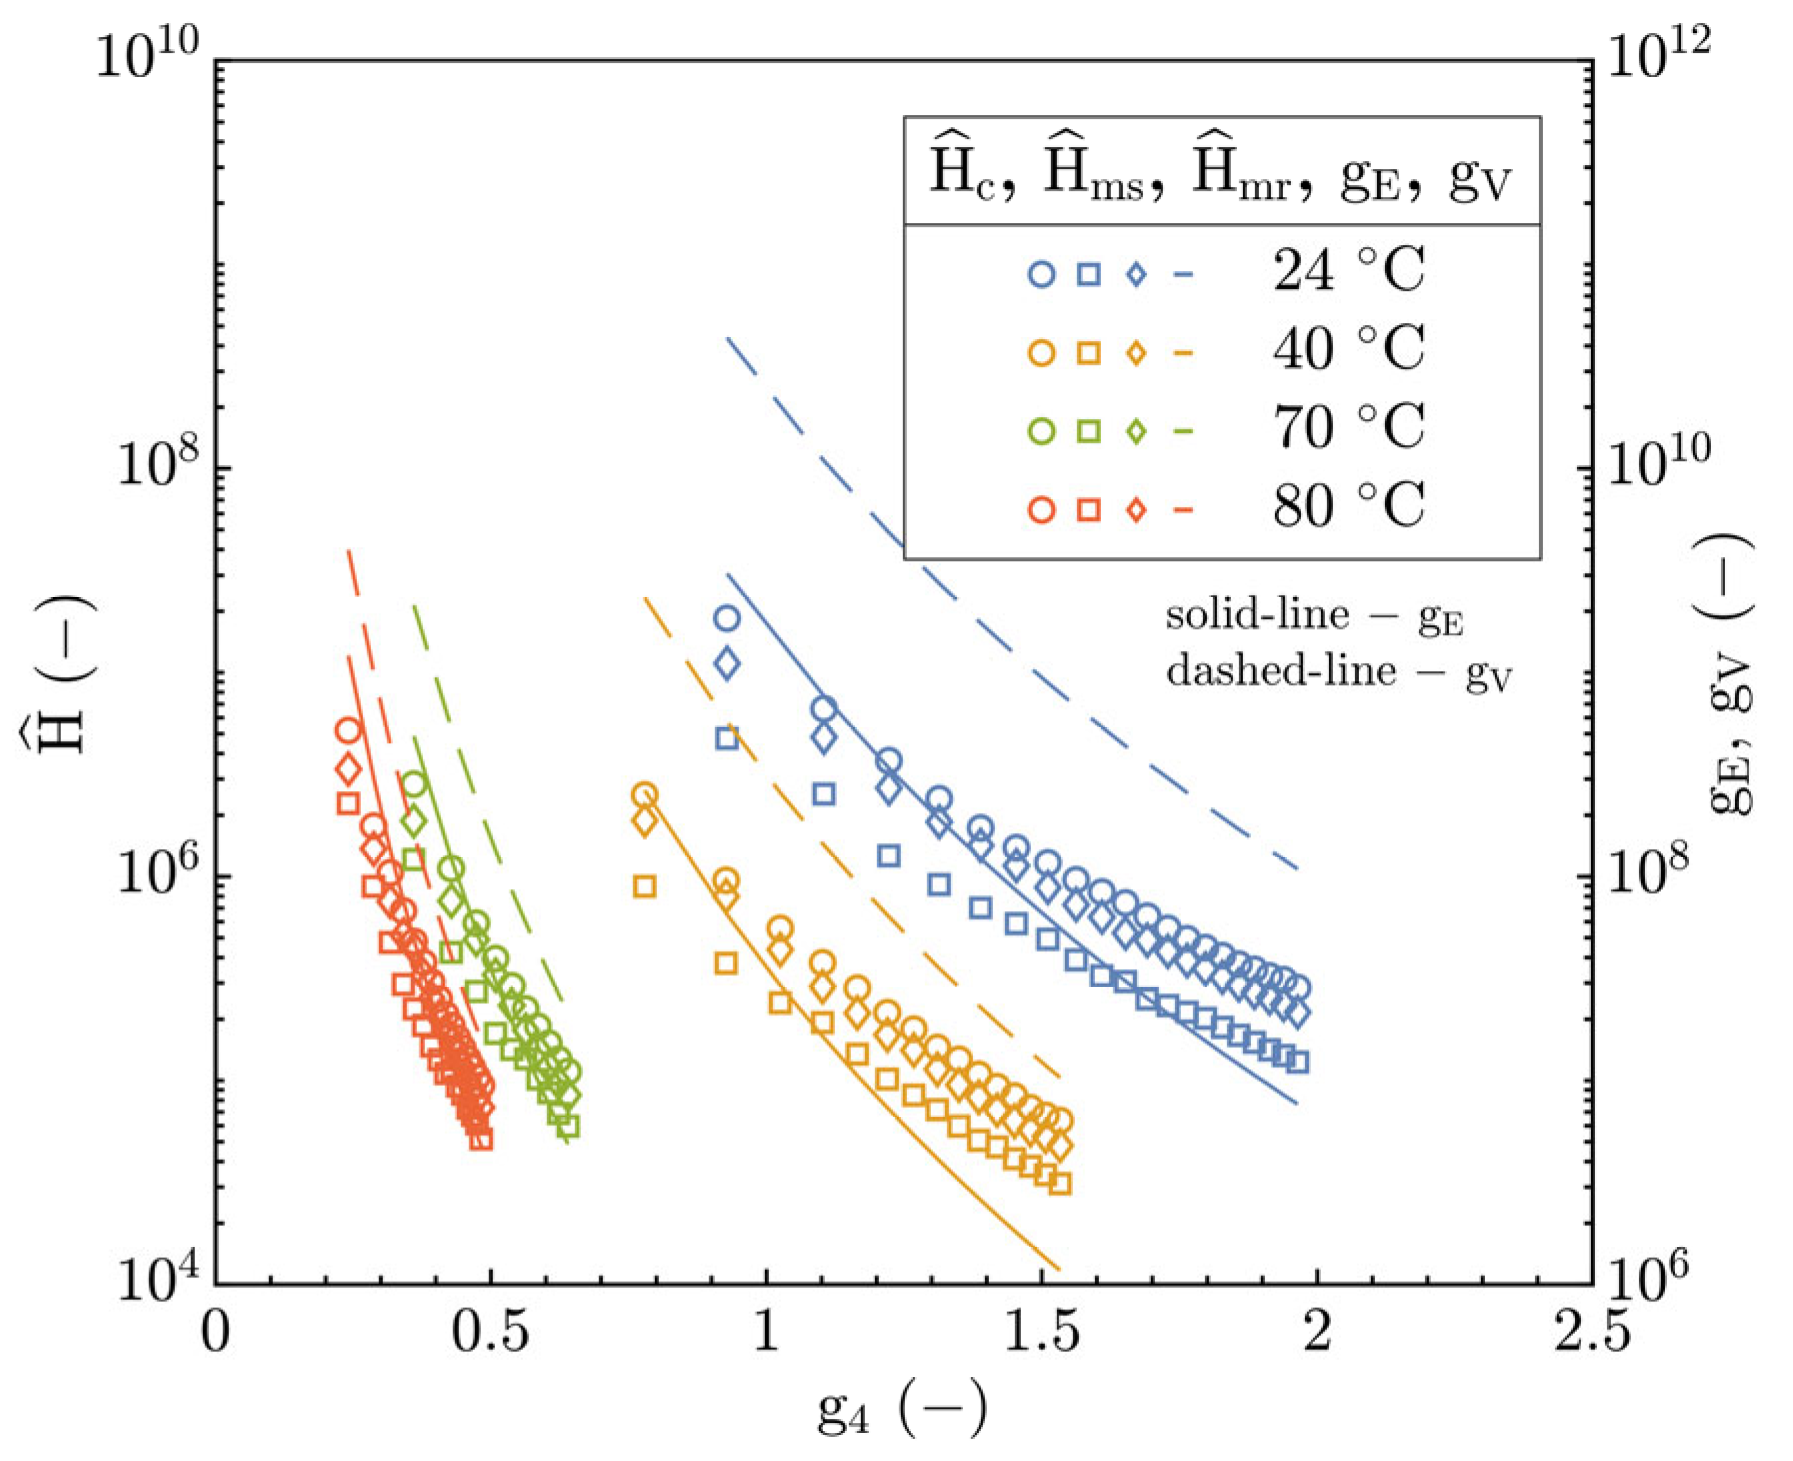
The operating conditions of the experiments were compared not only for individual EHL modes but also for the expected TR region between the P-E and I-E modes in accordance with the research by Johnson [
21], Jaffar [
29] and Myers et al. [
30]. Stated dimensionless parameters g
E (Equation (SA1)) and g
V (Equation (SA2)) were supplemented by the Archard’s parameter “of the system” g
4 [
22] which bounds the TR region to the interval where
, see Equation (SA3). In this connection, the film thickness prediction formulae were expressed using by g
E, g
V parameters and the film thickness parameter (
). The central as well as minimum film thickness results expressed by
,
and
parameters in
Figure 14 are well consistent with the assumed interval for the TR region based on the g
4 parameter in the interval from 0.2 to 1.95.
This could confirm the assumption of the operation of the contact in the TR region according to the hydrodynamic map of EHL, see
Figure 13, and simultaneously, could justify the observed deviations of prediction models for the P-E and I-E modes of EHL applied to the TR region, see
Figure 11. Relative to the g
E (right y-axis) in
Figure 14, the film thickness development demonstrated a good quantitative agreement especially at T > 40 °C; however, at T ≤ 40 °C, it was significantly different. Contrary to the g
E parameter, the dependence of
on the g
V is represented by a significant disagreement for all inlet temperatures. This may again point to the dominant effect of constitutive material behavior.
For polymers, the constitutive material behavior corresponds to the viscoelastic state where the material response in dependence on time (or frequency) and the temperature of loading is manifested. Relative to tribology, these phenomena are expected especially for UE ≠ 0, when the polymer (PMMA) is dynamically loaded. However, except for P-E EHL models, the I-E models similarly presume only the elastic response of the material, which is in contradiction with viscoelastic response of polymers.
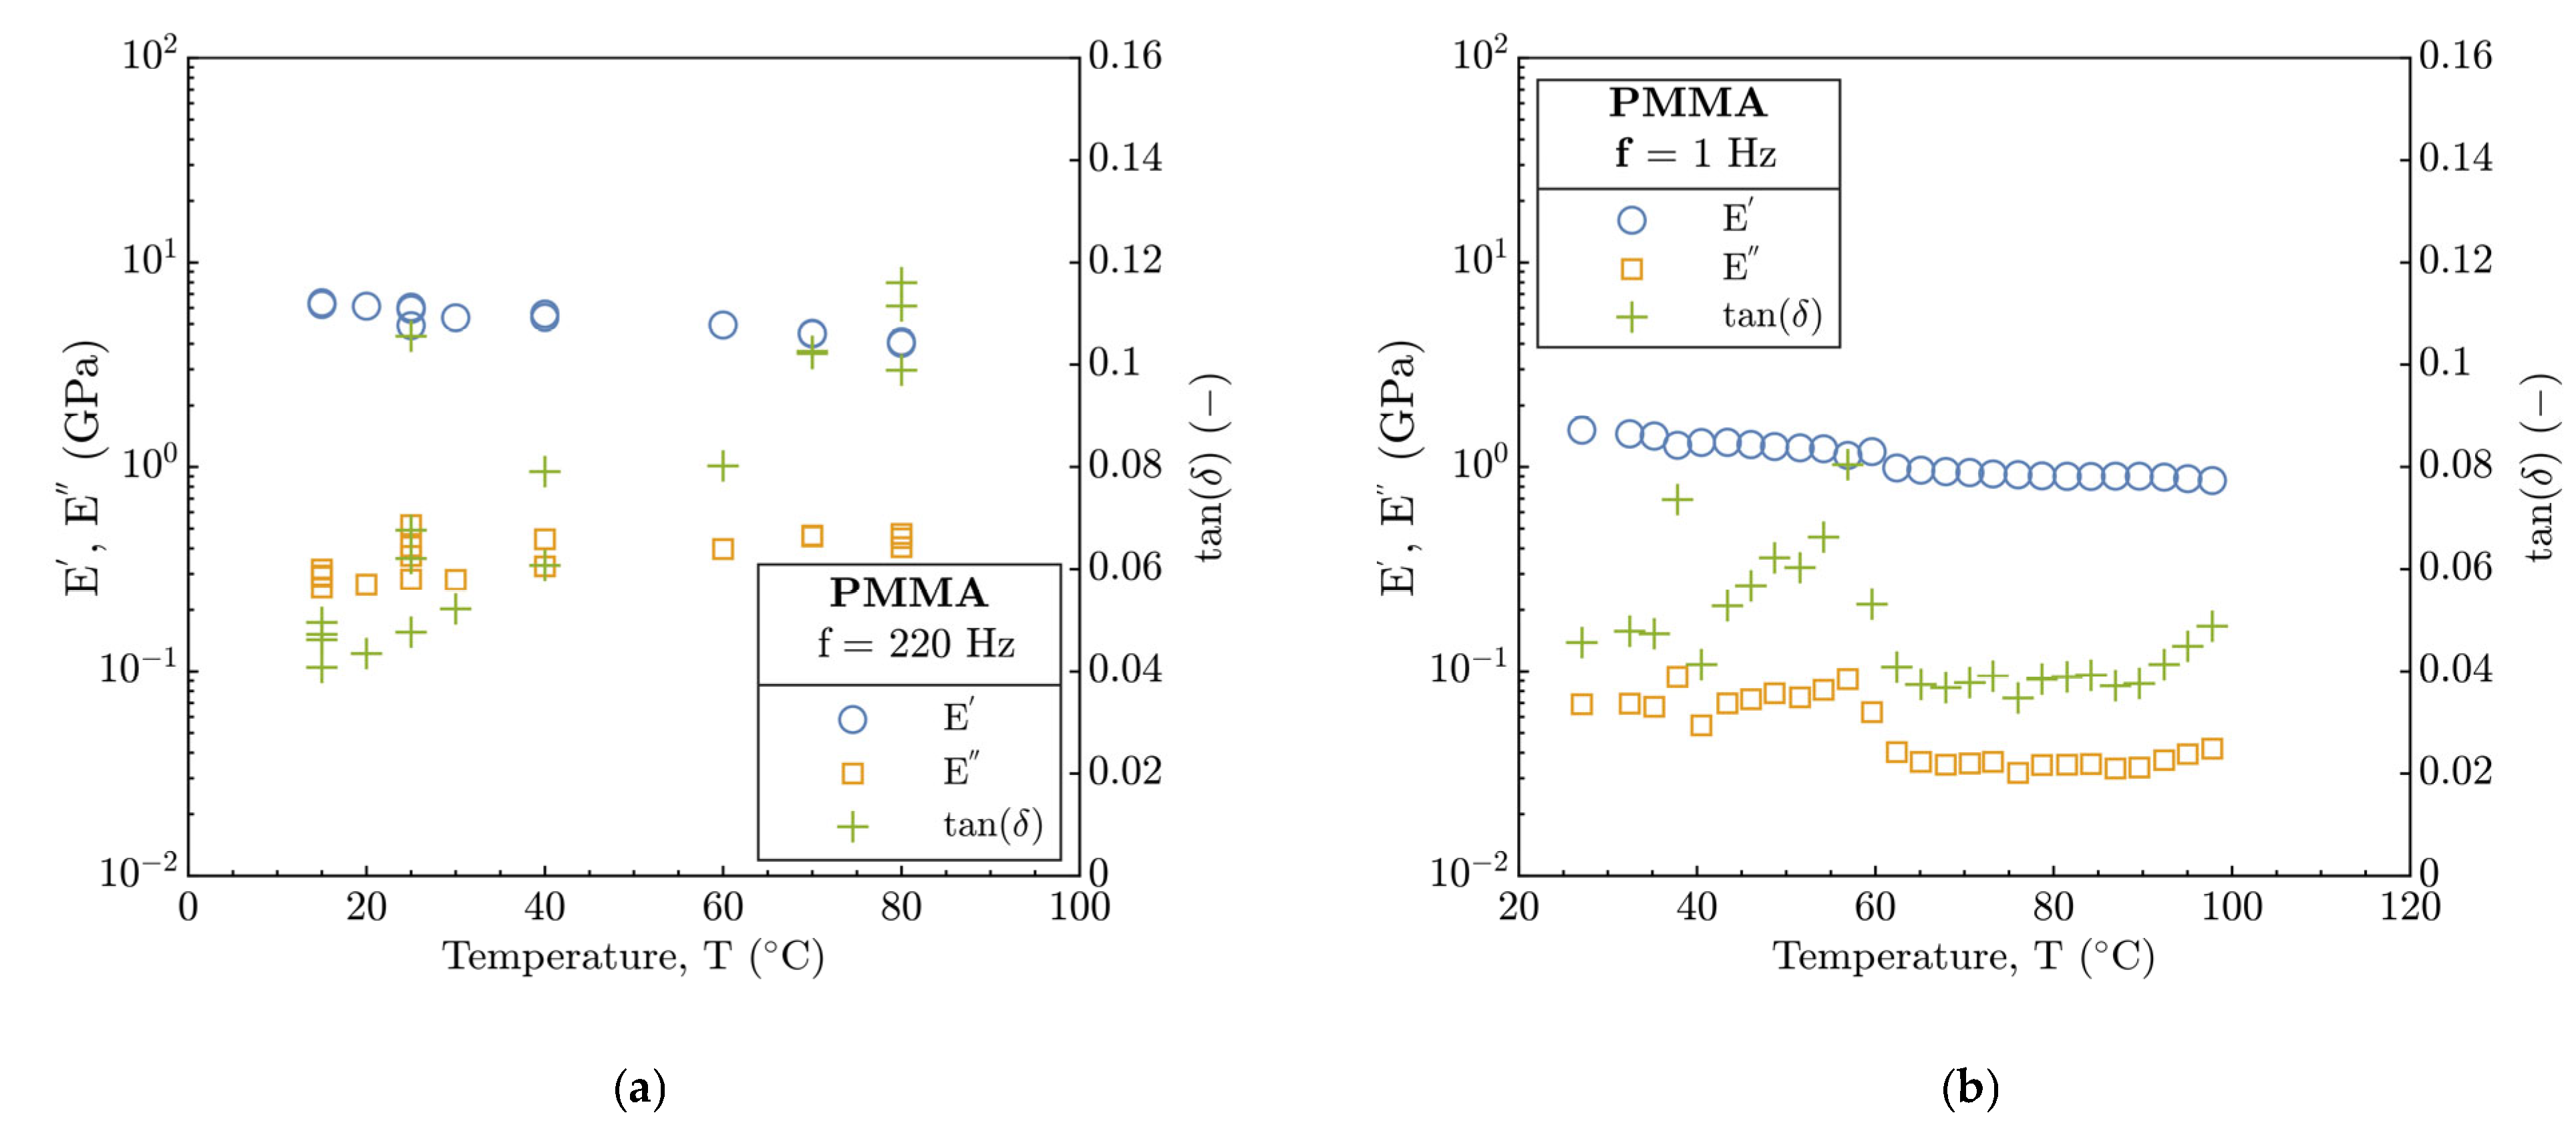
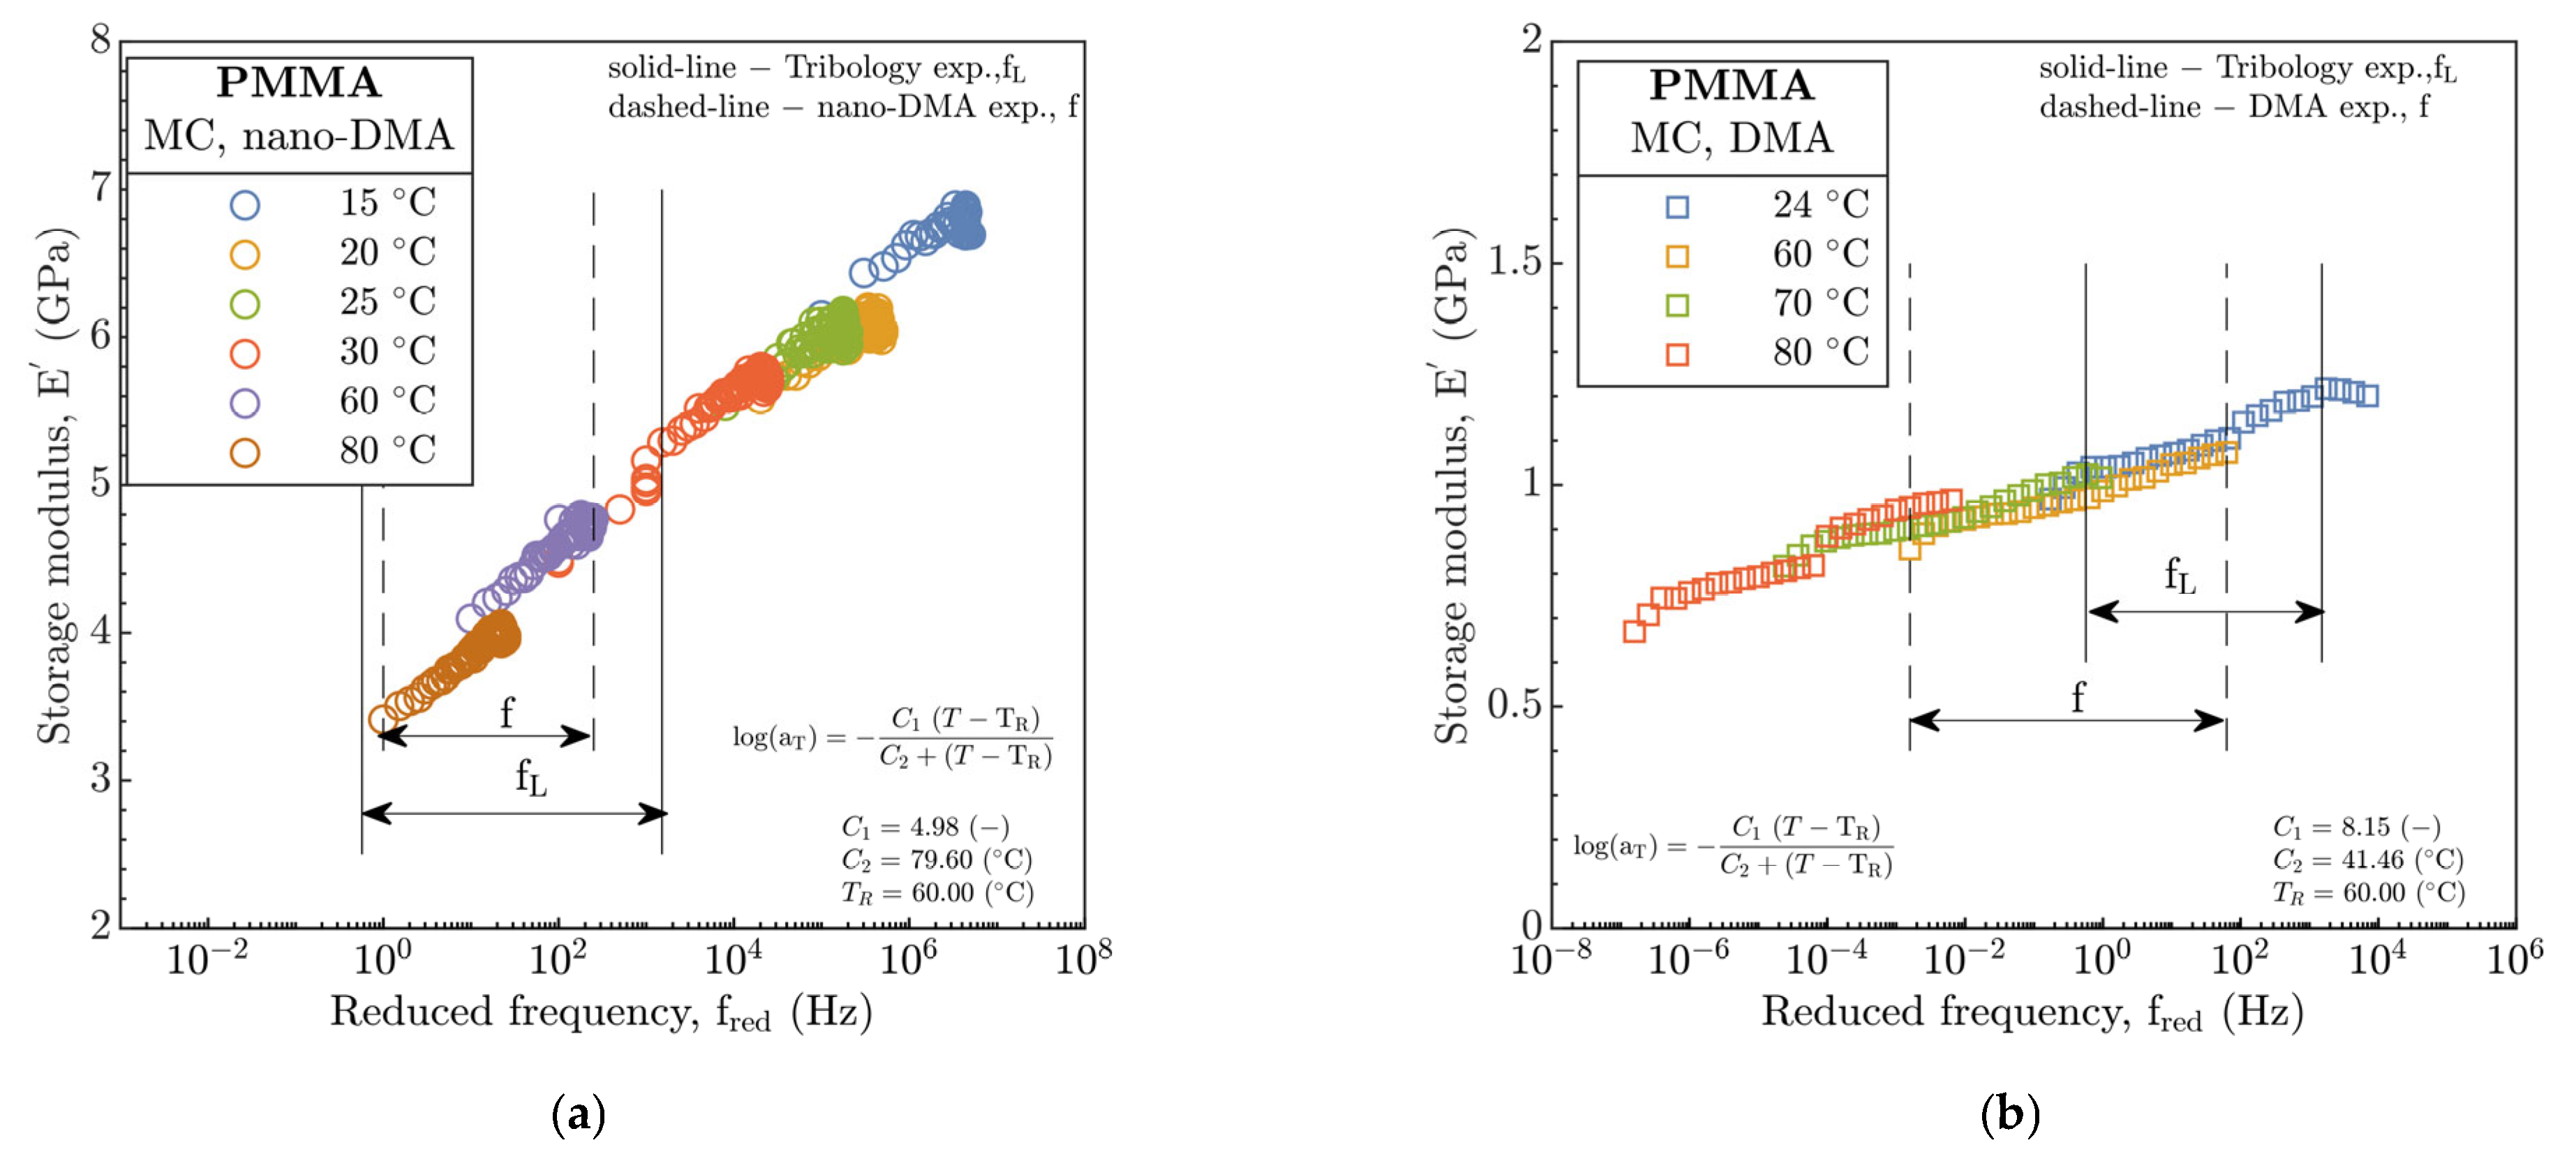
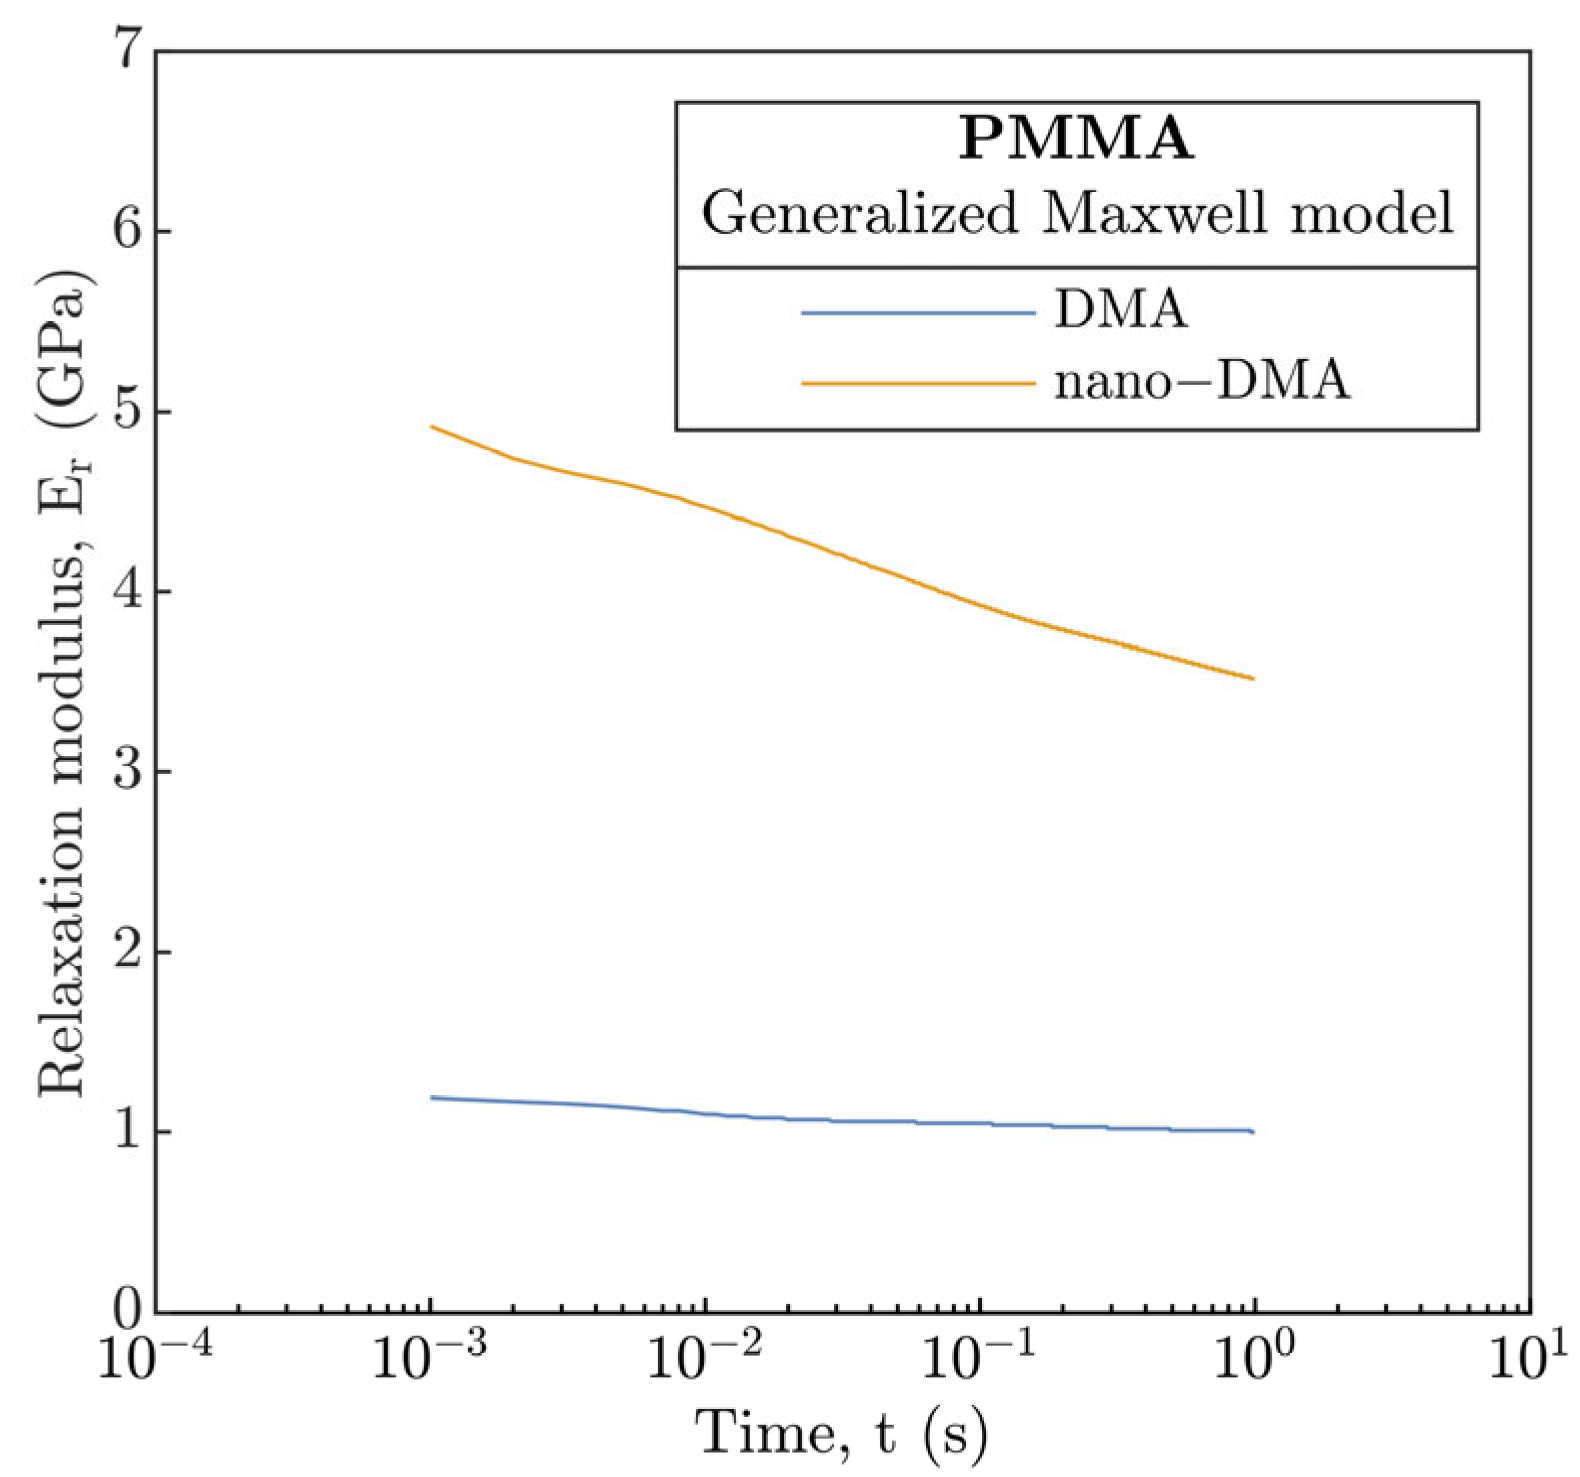
From part A, elastic E′ as well as viscous E″ parts of the E*and tan (δ) were obtained from frequency and temperature sweep experiments based on nano-DMA and DMA methods. However, for the implementation to the EHL models, the question arises whether the E in these models can somehow be replaced by the E* obtained by both methods. The problem results from the fact that the E* corresponds to the frequency domain relative to the experimental methods employed. Thus, the conversion from the storage to the relaxation modulus (Er(t)), which characterizes viscoelastic properties in the time domain, is necessary.
Hence, the generalized Maxwell model was used. The parameters of the seven-branch model are given in
Tables SB1 and SB2, see
Supplementary Information (SI)—B. The number of branches corresponds with significant peaks of E″ during the DMA temperature sweep experiments, see
Figure 2b. In order to obtain model parameters (stiffnesses and relaxation times of the individual elements), the Prony series were fitted using the least squares method for the master-curves obtained from DMA and nano-DMA in
Figure 2. Consequently, the E
r from nano-DMA was integrated into the EHL prediction models as a time-dependent function, substituting the conventional E. A time dependence (time needed to reach a given point on the disc corresponding to the distance equal to the R
c) of the E
r is demonstrated in
Figure 15.
The influence of E
r is evident from
Figure 9 and
Figure 10 where the H&D models for P-E and I-E mode of EHL were modified (H&D
m, dashed-line). At 24 and 40 °C, the difference H
c from the modified soft and hard H&D
m models remains mainly unchanged relative to H&D, and H
c correlates best with the soft and hard H&D for the former and latter temperature, respectively. However, for 70 and 80 °C, the experimental H
c demonstrated a very good agreement with modified soft H&D
m model with only a slight deviation not exceeding 10% relative to soft H&D where a deviation over 60% was previously recorded. Interestingly, although the viscoelastic response characterized by E
r was included, the H
c also corresponds well with hard H&D and H&D
m models, especially at a temperature of 80 °C.
It is evident that the inlet temperature leads to a significant decrease in H
c; however, the formation of film thickness in the TR region predominantly corresponds to the P-E mode rather than to the I-E mode. This is surprising relative to the constitutive material behavior of polymers, as well as the position of experiments close to the I-E mode, see
Figure 13. However, this brings us back to the determination of the EHL mode, which may differ due to the integration of the E
r instead of the E.
The integration of the E
r in the hydrodynamic map, see
Figure 13, shifts the operation conditions of the contact slightly toward the P-E mode of EHL in the TR region where the magnitude of shift with increasing temperature is enhanced. A similar shift would be seen in
Figure 14 according to the Archard’s g
4 parameter as well, but in a different manner. Here, the development of
,
and
as well as g
E asymptotically approaches the boundary between the TR region and I-E mode of EHL and would converge to the value of 0.1 for g
4, which is derived in [
21] as the boundary point of TR region. However, the above points out to a significant discrepancy between the expected operation mode of EHL and I-E EHL models. Simultaneously, the described behavior may be a consequence of the viscoelastic response of the polymer, which causes a decrease in fluid-film thickness, not considered by the I-E EHL models.
In addition, several reasons can be found to explain the described deviations. Another possibility may be strain hardening at high contact pressures, which may not be evident in the DMA analysis. Conversely, the DMA analysis may have shown softening due to cyclic loading of one spot on the specimen. Hence, there are several reasons why the stiffness could be even lower. One of them could be a decrease by about 10% in the E measured by nano-DMA at the rolling path after the tribological experiment was performed in part B. Nevertheless, the softening effect should only be particularly noticeable at the temperature close to the Tg interval.


 ,
, 


