Article

Preparation and Characterization of 3D-Printed Biobased Composites Containing Micro- or Nanocrystalline Cellulose

by
Raphael Palucci Rosa
1,*,
Giuseppe Rosace
2,
Rossella Arrigo
3 and
Giulio Malucelli
3
1
Department of Engineering and Applied Sciences, University of Bergamo, Viale Marconi 5, Dalmine, 24044 Bergamo, Italy
2
Department of Engineering and Applied Sciences, University of Bergamo, Local INSTM Unit, Viale Marconi 5, Dalmine, 24044 Bergamo, Italy
3
Department of Applied Science and Technology, Politecnico di Torino, Local INSTM Unit, Viale T. Michel 5, Provincia di Alessandria, 15121 Alessandria, Italy
*
Author to whom correspondence should be addressed.
Polymers 2022, 14(9), 1886; https://doi.org/10.3390/polym14091886
Submission received: 20 April 2022 / Revised: 28 April 2022 / Accepted: 1 May 2022 / Published: 5 May 2022
(This article belongs to the Topic Polymer Nanocomposites and Bionanocomposites)

Abstract

:
Stereolithography (SLA), one of the seven different 3D printing technologies, uses photosensitive resins to create high-resolution parts. Although SLA offers many advantages for medical applications, the lack of biocompatible and biobased resins limits its utilization. Thus, the development of new materials is essential. This work aims at designing, developing, and fully characterizing a bio-resin system (made of poly(ethylene glycol) diacrylate (PEGDA) and acrylated epoxidized soybean oil (AESO)), filled with micro- or nanocellulose crystals (MCC and CNC), suitable for 3D printing. The unfilled resin system containing 80 wt.% AESO was identified as the best resin mixture, having a biobased content of 68.8%, while ensuring viscosity values suitable for the 3D printing process (>1.5 Pa s). The printed samples showed a 93% swelling decrease in water, as well as increased tensile strength (4.4 ± 0.2 MPa) and elongation at break (25% ± 2.3%). Furthermore, the incorporation of MCC and CNC remarkably increased the tensile strength and Young’s modulus of the cured network, thus indicating a strong reinforcing effect exerted by the fillers. Lastly, the presence of the fillers did not affect the UV-light penetration, and the printed parts showed a high quality, thus proving their potential for precise applications.

Graphical Abstract

1. Introduction

Additive manufacture technology (AM), commonly known as 3D printing, allows the creation of complex structures using different types of materials, such as polymers, photopolymer resins, ceramics, and metals [1]. Its freedom of design, low cost, and speed are some of the advantages that make 3D printing attractive for many industrial sectors [2,3], especially in the biomedical field, where it can be used to produce patients’ customized implants [4].
AM can be divided into seven technologies: material extrusion, material jetting, powder bed fusion, direct energy deposition, binder jetting, sheet addition, and vat polymerization, each with its own advantages and limitations [5,6]. Stereolithography, part of the vat polymerization technology, uses a combination of photosensitive liquids made of acrylates or epoxy-acrylates with a photo-initiator and a light emitter (wavelength between 360 and 405 nm) to produce highly accurate components, down to 5 microns of resolution [7,8]. The objects produced by this technique usually exhibit good thermal, mechanical, and chemical properties [9]. However, most of the materials commonly used to produce the resins are derived from crude oil, which, in addition to being nonrenewable and having low biocompatibility, is a major cause of environmental pollution [10].
In recent years, a limited number of academic studies started to address the lack of biocompatible and biobased materials for SLA applications. These new resins are based on renewable materials, such as vegetable oils (soybean, corn, sunflower, linseed, etc.) [11,12,13] or clinically approved polymers such as poly(ethylene glycol) (PEG), poly(caprolactone) (PCL), poly(lactic acid) (PLA), and poly(glycolic acid) (PGA) [14,15,16,17]. Among these different polymers, PEG is one of the best candidates for 3D printing, since it can be easily functionalized and modified [18,19]. Kuo et al. [20] used poly(ethylene glycol)diacrylate (PEGDA) with a suitable photo-initiator (namely, Irgacure-819) to create a variety of complex 3D microfluidic devices [20]. Seo et al. [21] employed a similar resin composition to investigate its suitability for complex structures (such as tilted ratchets and ladders) [21]. Unfortunately, the objects produced using pure PEGDA and its derivatives via radical polymerization demonstrated poor mechanical properties [22].
An alternative to improve PEG properties while maintaining its biocompatibility could be its combination with other types of resins; in this context, plant-based resins have attractive characteristics due to their renewability, biodegradability, and low pollutant emissions [23]. Originating from renewable sources, they are environmentally friendly molecules, are relatively cheap to manufacture and employ, and can be modified to react with ultraviolet radiation [24,25]. Epoxy-acrylated soybean oil (AESO), produced from soybean, has been shown to be a promising material [25]. It was recently used to develop 4D scaffolds [26], complex structures [25], and high-performance parts [27], where it demonstrated good biocompatibility, as well as thermal and mechanical properties. Lebedevaite et al. [28] combined AESO with biobased materials to develop a resin with similar properties to petroleum-based counterparts. Their resins showed high renewable carbon content (between 75% and 82%), high crosslinking rate, and tunable mechanical properties.
Another method to improve the properties of SLA resins is through the addition of fibers, fillers, or nanoparticles [29,30]. These particles can be added directly to the resin or have their chemical structure modified to improve their dispersion and interfacial adhesion, i.e., by attaching a functional group onto the particle surface (“grafting”) [31]. Moreover, the functionalization of particles can help in preventing the phase separation between two polymeric components (an A/B mixture) [32]. Among the many types of fillers, cellulose is an excellent reinforcement material. It is the most abundant natural polymer on Earth, and its reinforcing derivatives are environmentally friendly, are relatively cheap to produce, and show impressive mechanical properties [33,34]. Cellulose and its derivatives are also being tested for biomedical applications [35]. Dutta et al. developed a hydrogel containing cellulose nanocrystal (CNC), alginate, and gelatin to be tested for bone regeneration. Their results showed that the scaffolds with CNC had an improvement in cell proliferation when compared to the control group [36]. However, the biomolecular interaction of cellulose micro- and nanoparticles on cells and tissues, as well as their hazard potential, still needs to be further investigated [37]. Nevertheless, for 3D printing, cellulose has already been used to reinforce different types of materials [38,39]. Murphy et al. used microcrystalline cellulose (MCC) to improve the mechanical properties of PLA bio-composites, exploiting its high Young’s modulus (25 ± 4 GPa) [40]. Palaganas et al. successfully combined cellulose nanocrystals with PEGDA. Their results showed increased glass transition temperature and tensile strength and decreased swelling when 0.3 wt.% CNCs were incorporated into the diacrylate [15].
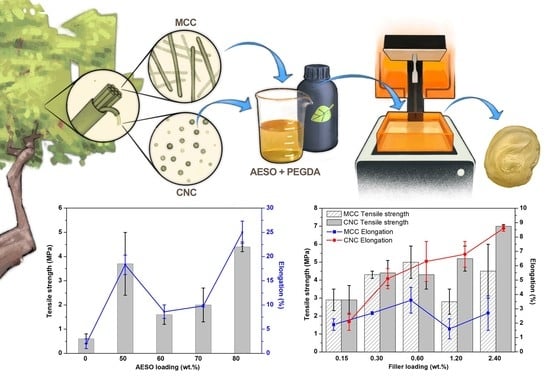
The main goal of the present work was to develop a high-quality and environmentally friendly biobased system, suitable for 3D printing. To this aim, PEGDA was combined with different concentrations of AESO, and their optimum ratio was determined. Then, micro- or nanocrystalline cellulose was incorporated into the optimized PEGDA/AESO formulation, and Fourier-transform infrared spectroscopy (FTIR) was exploited for monitoring the progress of the UV curing of the designed system during the SLA process. Furthermore, the rheological, thermal, mechanical, and 3D printing properties of the biobased composites were investigated. To the best of our knowledge, this is the first time that PEGDA, AESO, MCCs, and CNCs have been combined and tested for 3D-printing applications. The obtained results show the possible exploitation of cellulose-reinforced biobased materials in the 3D printing industry.

2. Materials and Methods

2.1. Materials

Poly(ethylene glycol) diacrylate (number average molecular weight: 575), epoxy-acrylate soybean oil (containing 4000 ppm of monomethyl ether hydroquinone as inhibitor), diphenyl(2,4,6-trimethylbenzoyl)phosphine oxide (TPO), and cellulose microcrystalline powder (20 μm) were purchased from Merck KGaA (Darmstadt, Germany). Cellulose nanocrystals were purchased from Sappi limited (Maastricht, the Netherlands). Isopropanol (purity: 99%) was purchased from Carlo Erba (Cornaredo, Italy). All products were used as received.

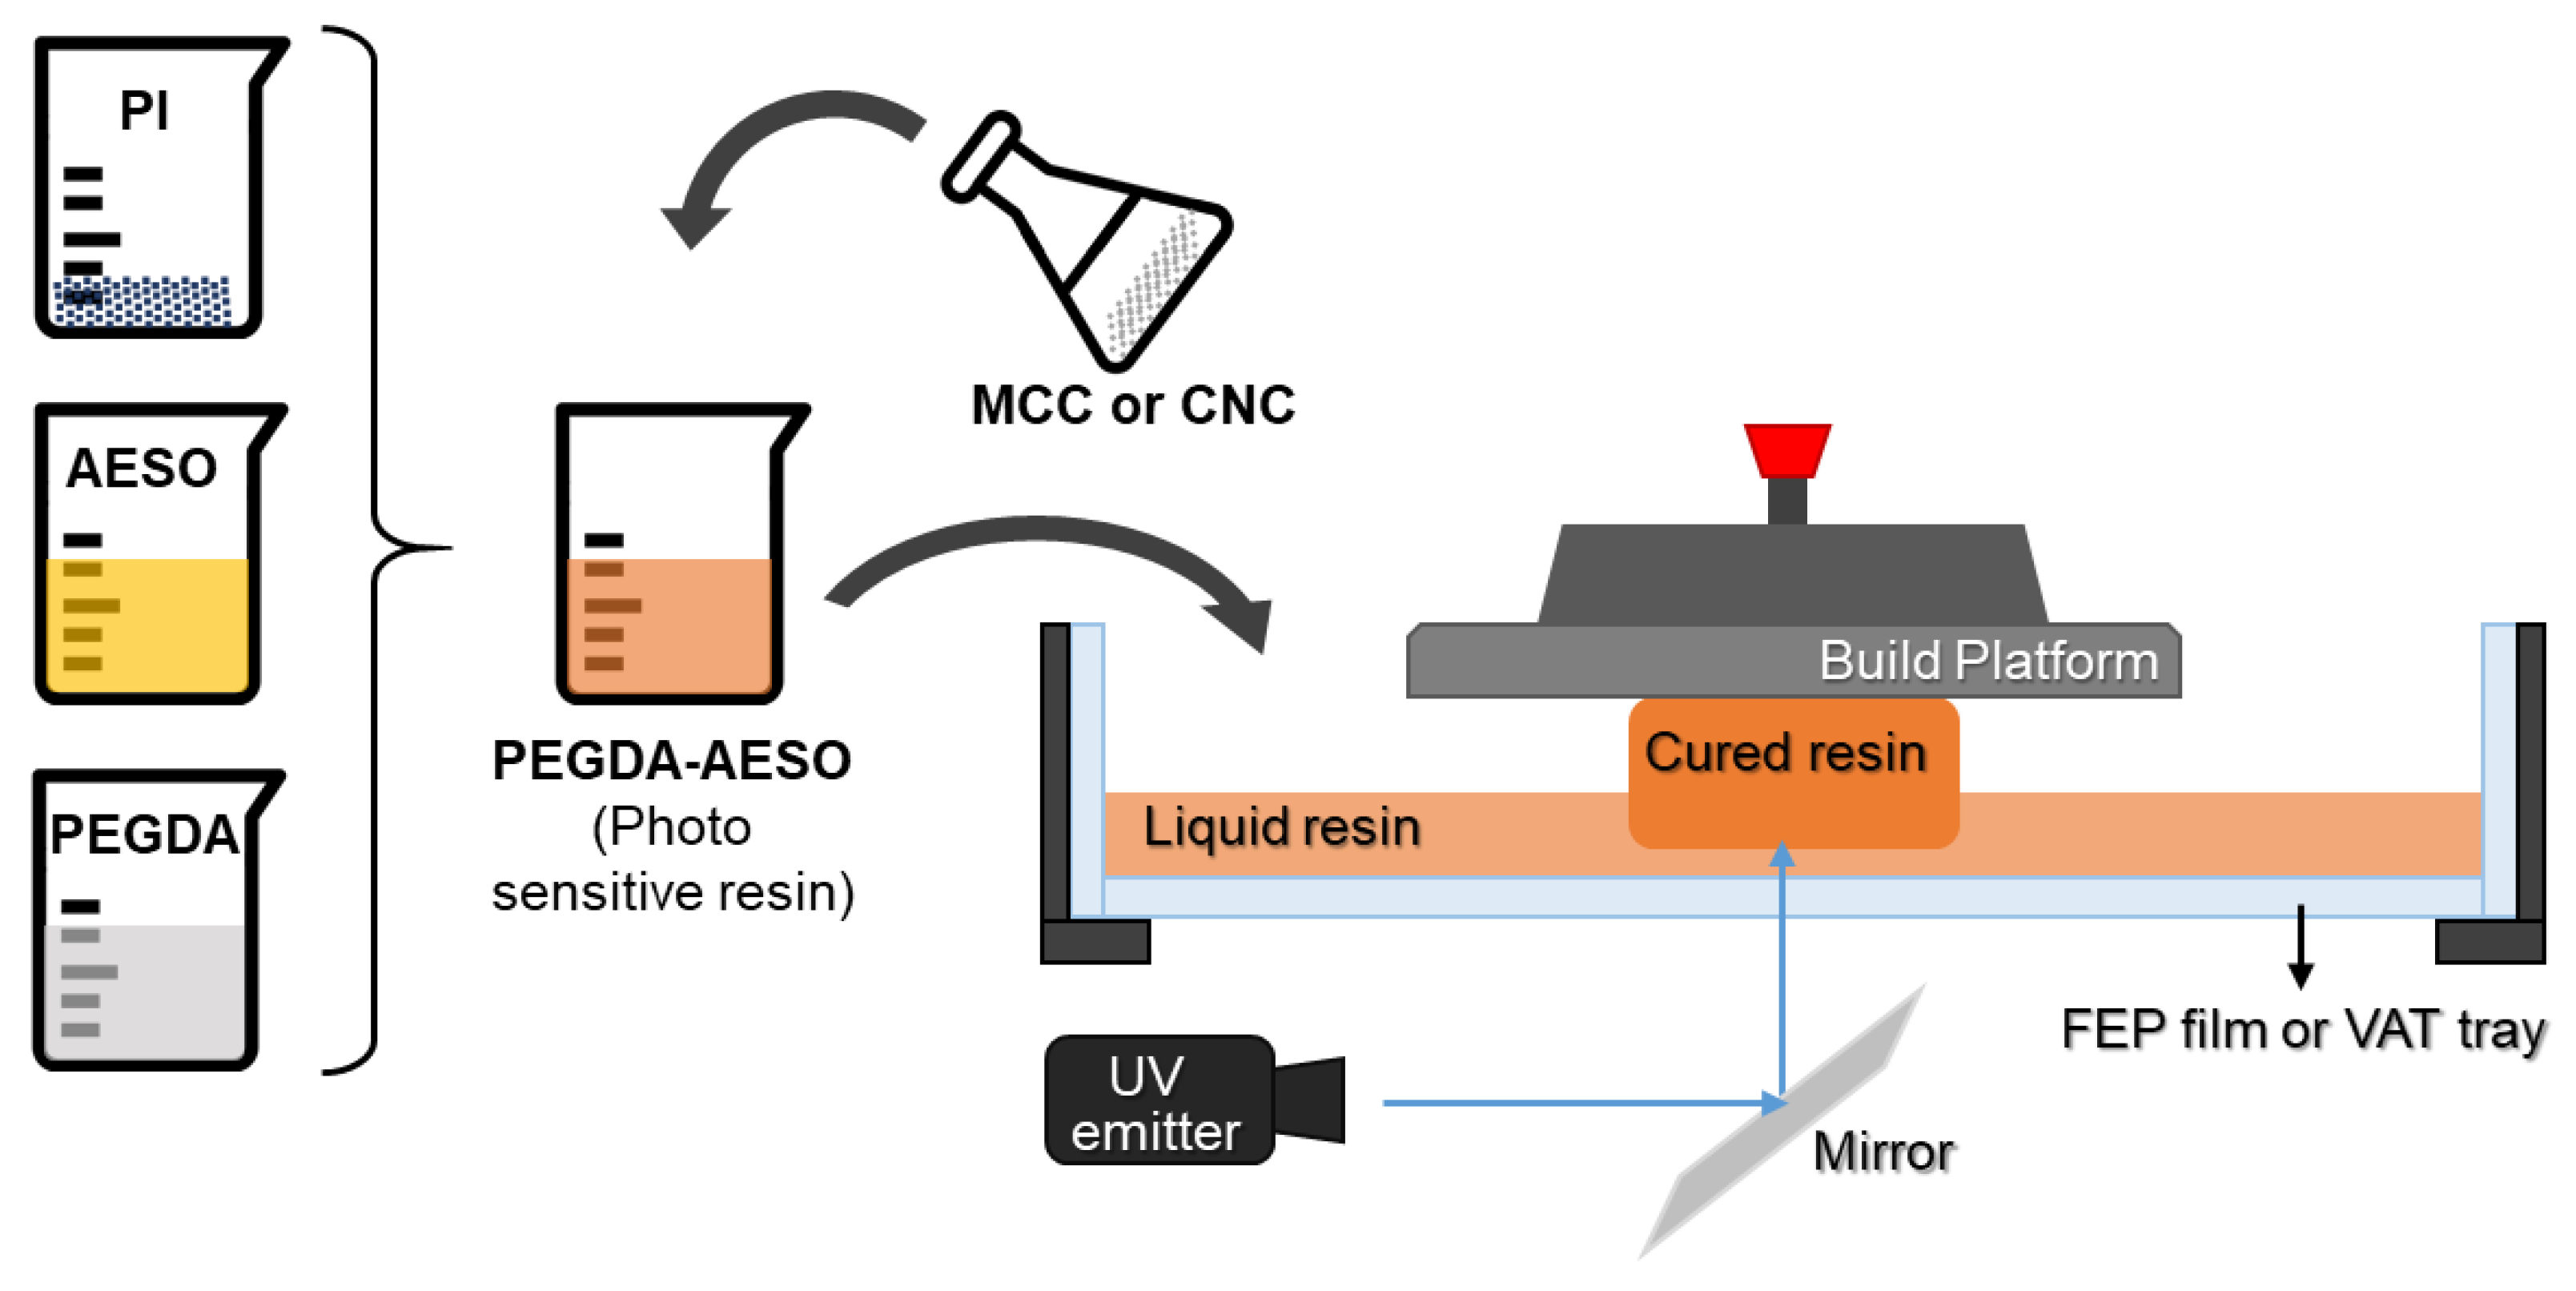
2.2. Preparation of the Photocurable Systems

Photocurable resins were prepared while avoiding any exposure to light, and the procedure is presented in Scheme 1. First, using a lightproof beaker, different weight ratios (varying from 50 to 90 wt.%) of AESO were mixed with poly(ethylene glycol). Then, 2 wt.% TPO was added to the mixtures, which were ultrasonicated for 10 min at room temperature to dissolve the photo-initiator, before vigorously stirring for 30 min. The resulting mixture had a yellowish appearance.
The bio content (BC) of each PEGDA/AESO sample is described in Table 1 and was calculated according to Equation (1).
B C = w i × B R C P E G D A + w i × B R C A E S O ,
where w is the mass fraction, i is the resin type, and bio-renewable carbon (BRC) is the ratio of bio-sourced carbon to the sum of bio- and fossil-based carbons. The BRC values of AESO and PEGDA are 86% and 0%, respectively [41].
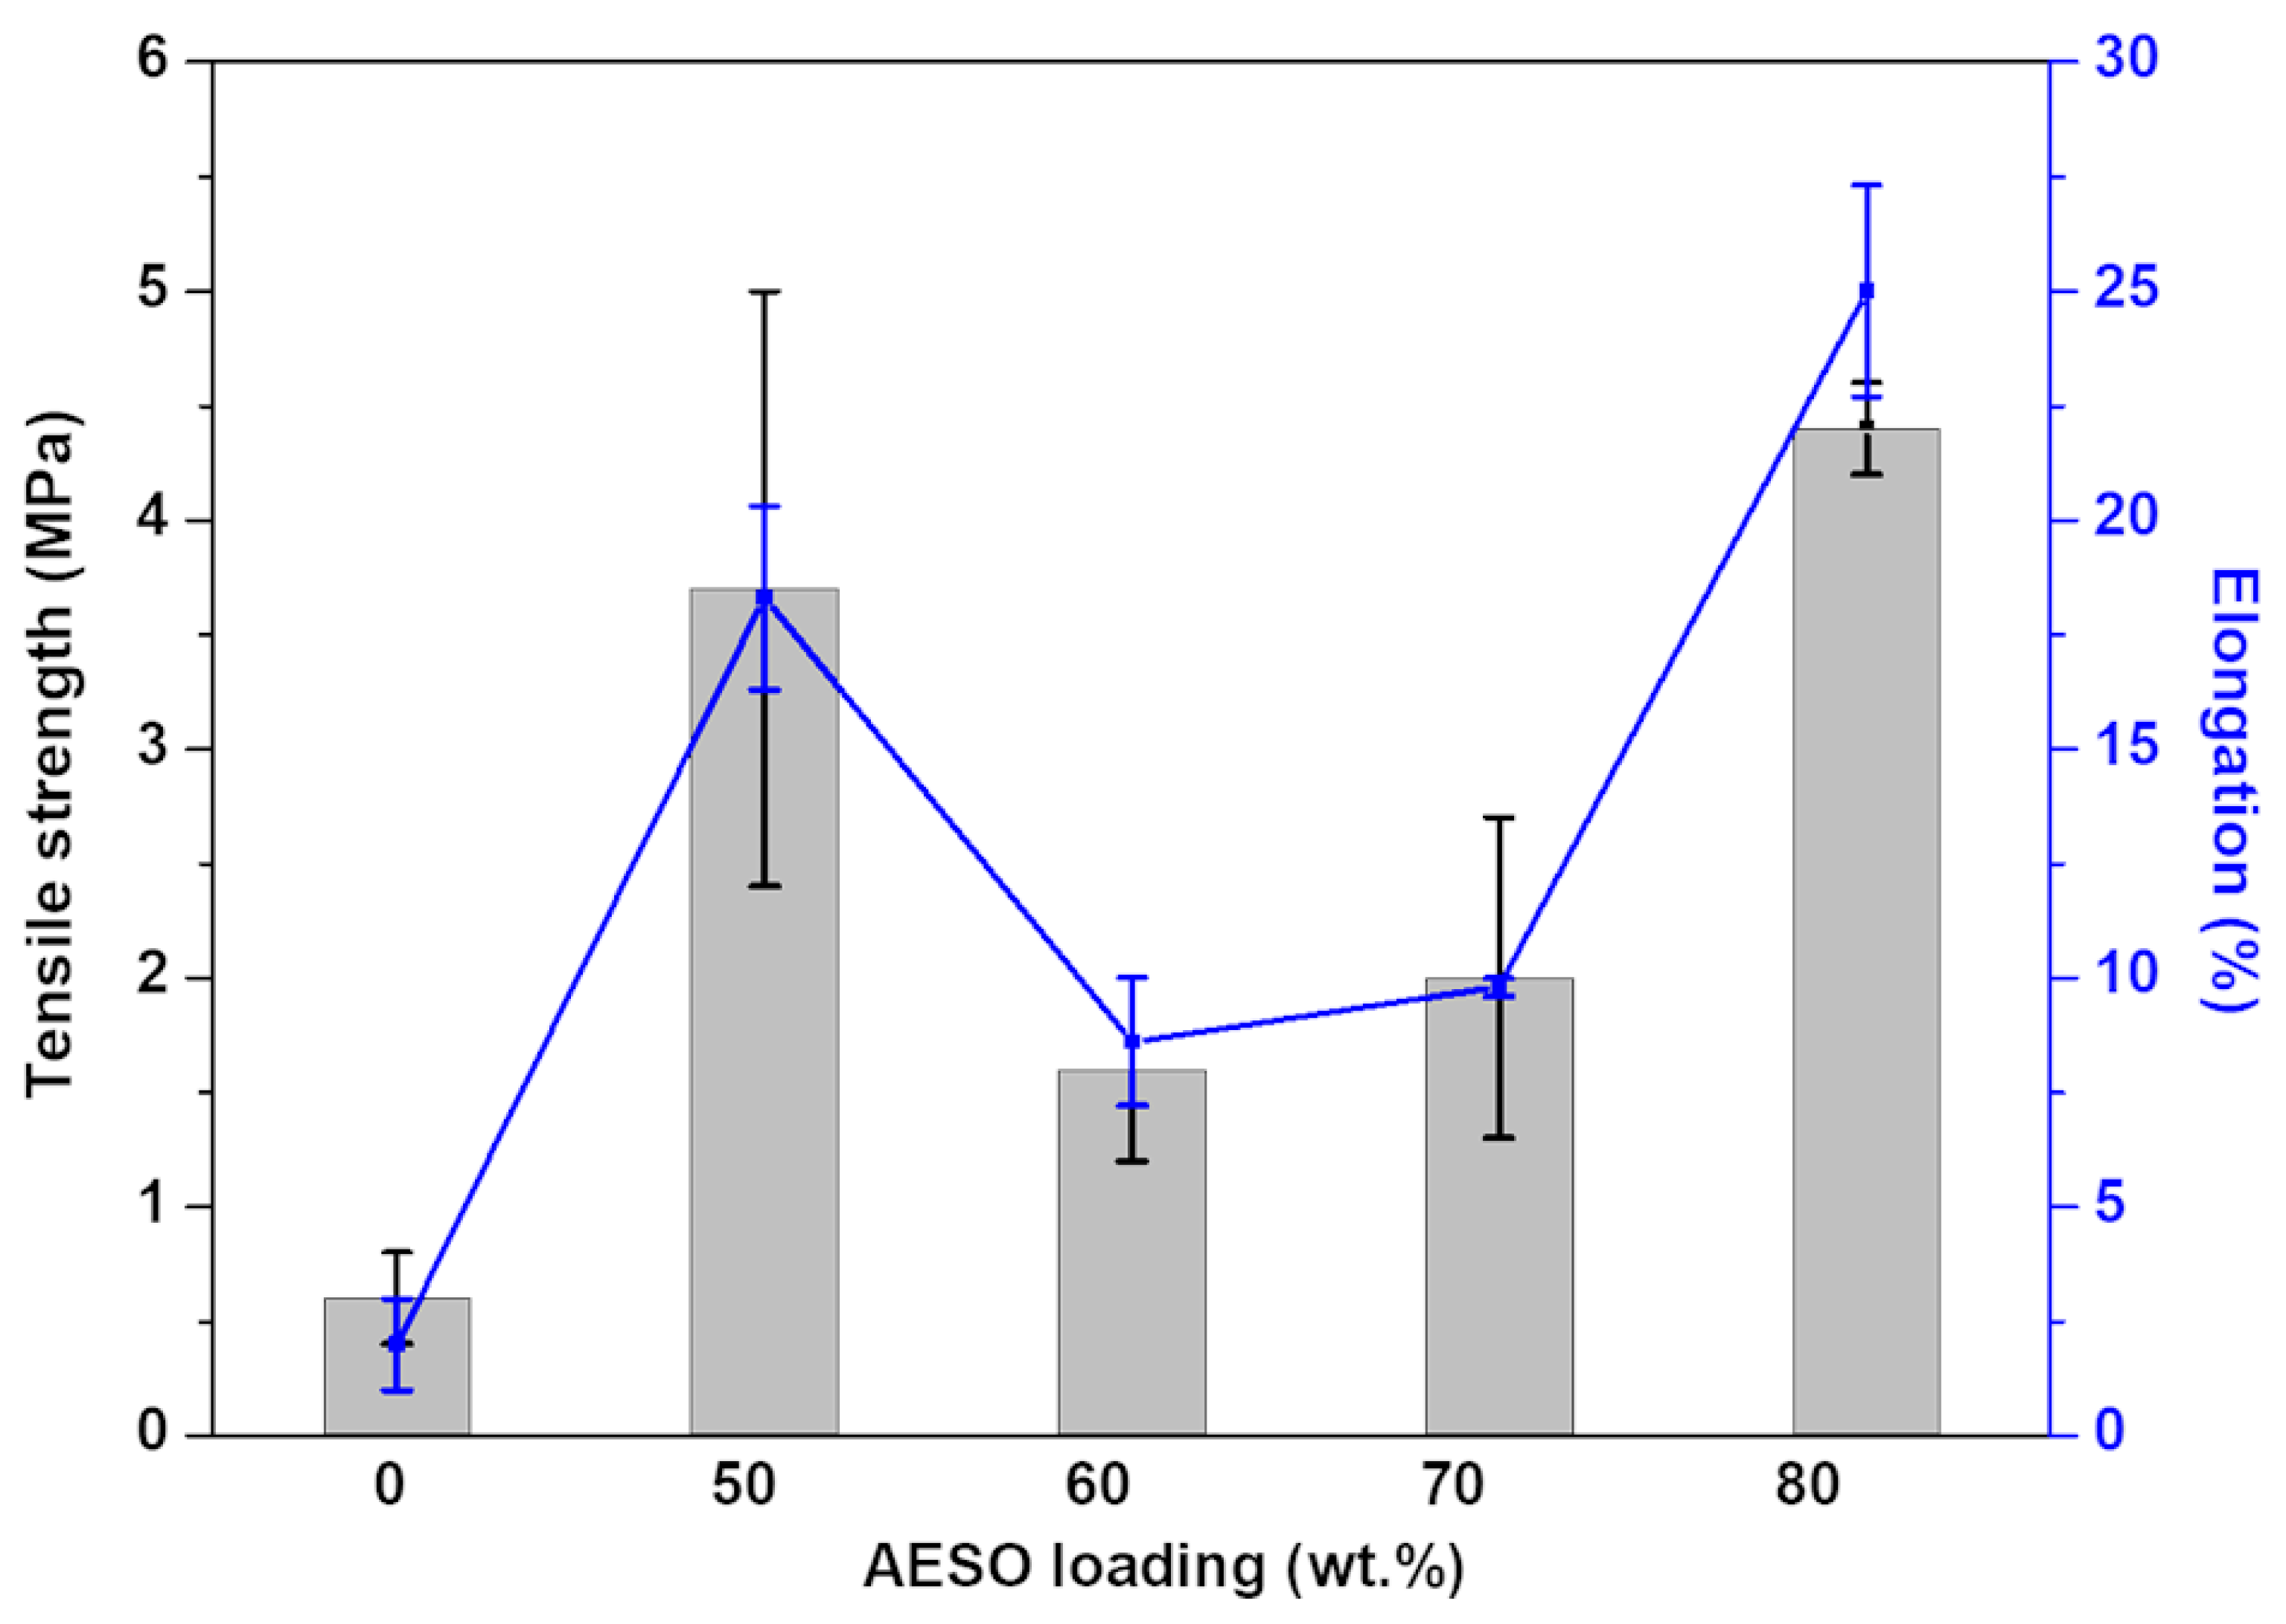
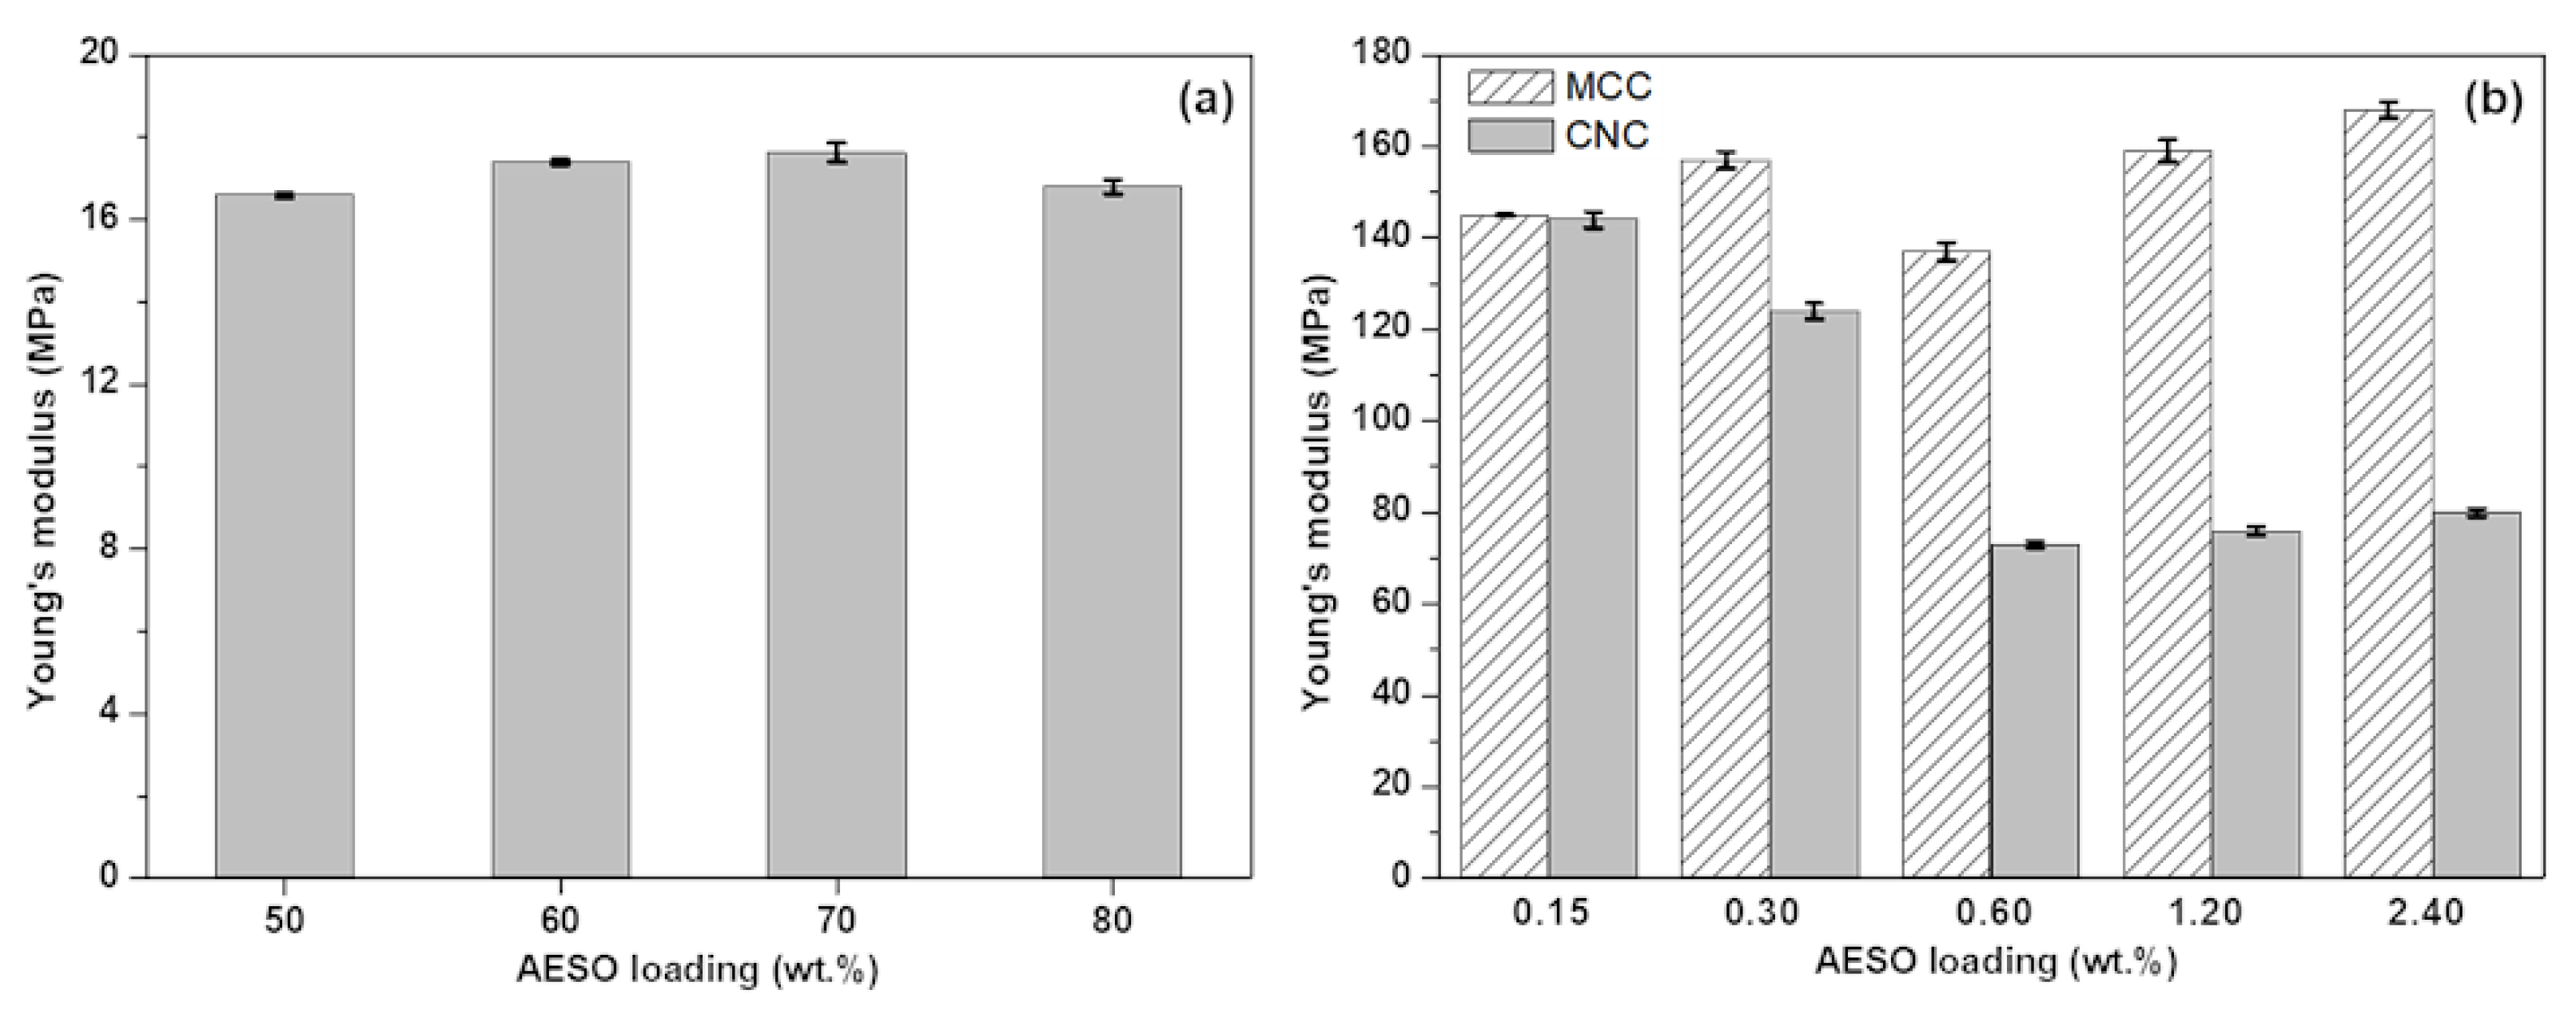
The mixture of PEGDA/AESO with a 20:80 ratio was selected for the present investigation since it had the best mechanical properties with the most significant bio-content percentage, equal to 68.8%. Then, different percentages of MCCs or CNCs (ranging from 0.15 to 2.4 wt.%) were incorporated into the selected mixture. The fillers were added in a small amount (maximum 0.2 g at a time) and ultrasonicated for 10 min at 30 °C to avoid the formation of aggregates.

2.3. 3D Printing Process

The samples were printed using a Peopoly moai 130 SLA 3D printer with an easy-to-level build plate. The machine was equipped with a solid-state laser with frequency conversion, emitting at 405 nm with a power of 150 mW. The power level was 58, and the initial exposure time was in the range between 40 and 60 s. The printed process was carried out maintaining the temperature constant at 25 °C. After the end of the printing, the excess of resin was drained and washed off with isopropanol; then, the samples were gently dipped into distilled water for 5 min. Finally, the samples were dried using a paper towel and transferred to a UV chamber equipped with a 405 nm UV lamp to post-cure for 40 min. The post-curing time was the same for all samples to ensure a complete photopolymerization, as assessed by FTIR spectroscopy. The 3D models were created using FreeCad software, and the printing layer height of the samples was set at 0.1 mm.

2.4. FTIR Spectroscopy

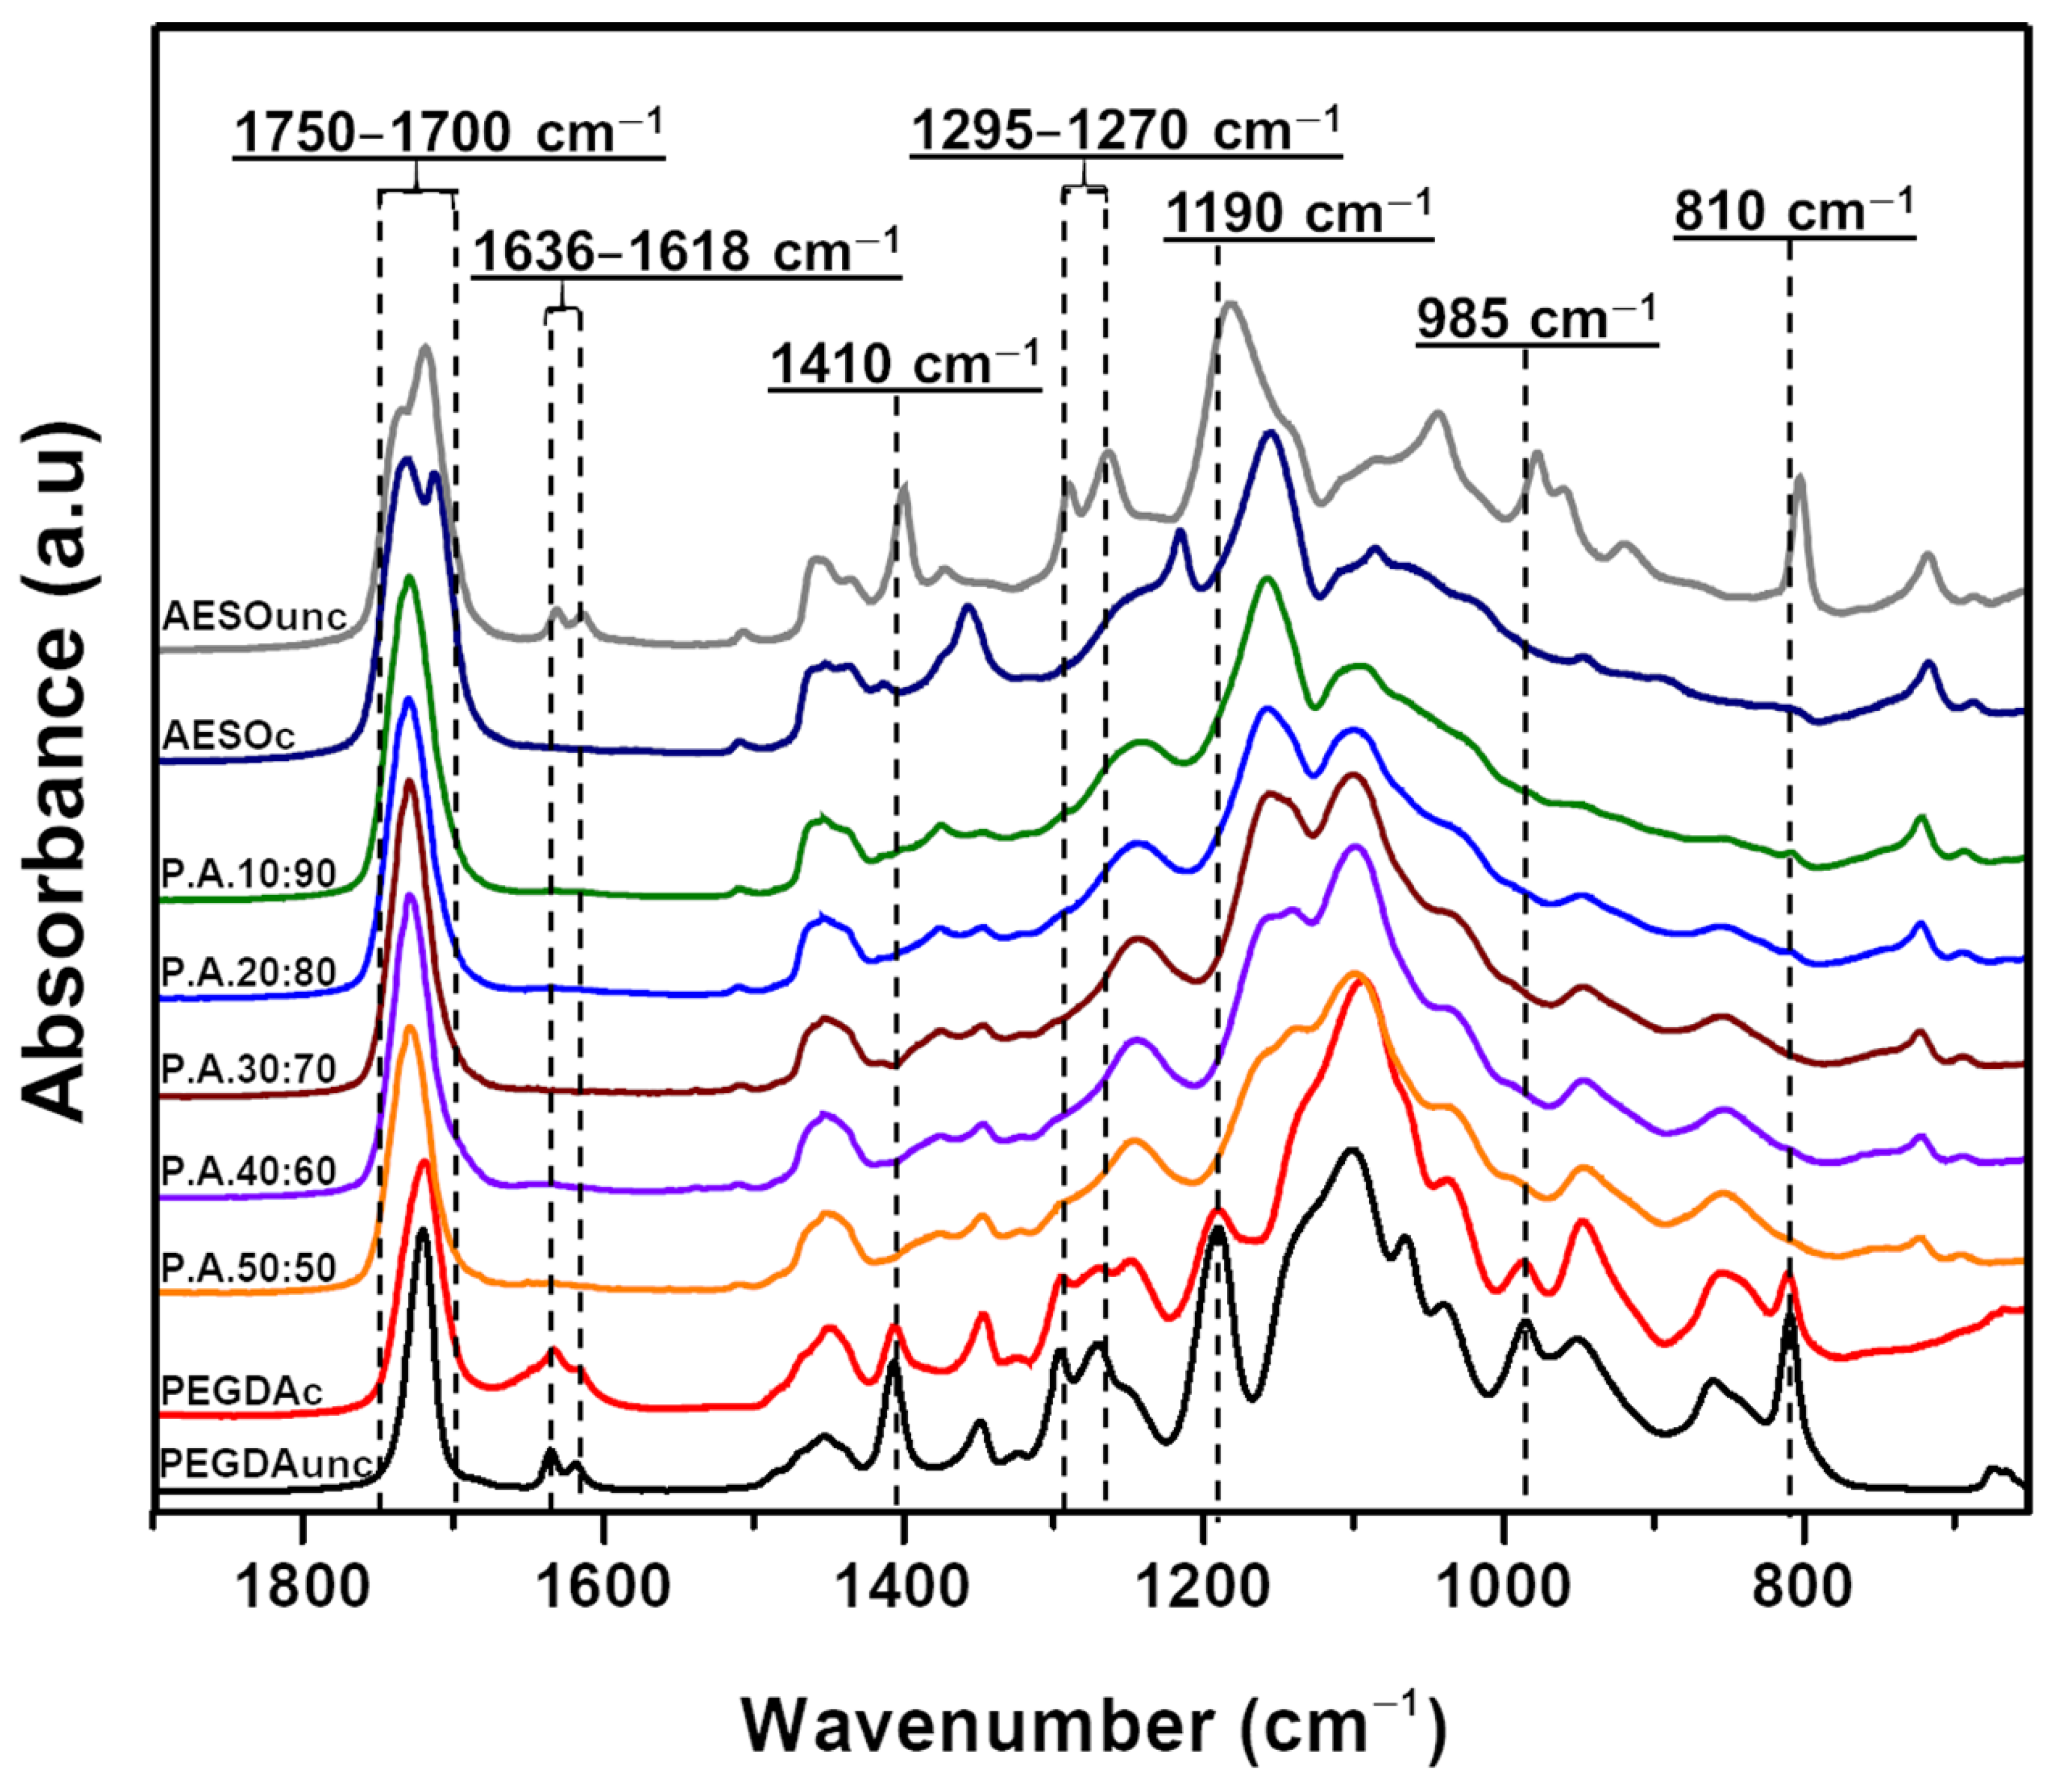
Fourier-transform infrared spectroscopy (FTIR) was used to confirm the formation of PEGDA:AESO copolymers at different ratios and to monitor the conversion of the acrylic double bonds. The infrared analysis was performed using a Thermo Avatar 370 spectrophotometer equipped with an attenuated total reflectance (ATR) device with a diamond crystal for solid analysis. Using Omnic 7.3 software, the spectra were collected in absorbance mode with a resolution of 4 cm−1 and 32 scans per measurement, within the range of 2000 to 650 cm−1, using 3D-printed dog-bone specimens. The conversion of double bonds was calculated from the decrease in the area of the double-bond absorption peak at 810 cm−1, as shown by Equation (2).
Conversion   % = 1 A t 810 A 0 810 × 100 % ,
where A0(810) and At(810) are the areas of the peak at 810 cm−1, before and after exposure to UV irradiation, respectively.

2.5. Rheological Analysis

Rheological measurements were performed using an ARES (TA Instrument, Waters LLC, New Castle, DE, USA) strain-controlled rheometer in parallel plate geometry (plate diameter: 50 mm; gap between the plates: 0.7 mm). The complex viscosity of the samples was measured through strain sweep measurements in a range of strain amplitude from 1% to 400%. In all tests, the frequency was fixed at 1 rad·s−1. All measurements were performed at room temperature.

2.6. Tensile Measurements

All tensile tests were performed following the ASTM D638 standard. Five samples were printed with a dog-bone shape with the dimensions of 63.5 mm × 9.53 mm × 3.2 mm (L × W × T) and with 3.2 mm width in the narrow section. The tests were performed at room temperature with an Instron 5966 dynamometer (Norwood, MA, USA), equipped with 5 kN load cell. Each test was performed at a crosshead speed of 10 mm/min. Tensile strength (MPa) and elongation at break (%) were determined using the average of the five tests. Then, various mechanical properties were calculated using the data from the tensile curves, such as Young’s modulus (MPa) and fracture energy (mJ).

2.7. Scanning Electron Microscopy

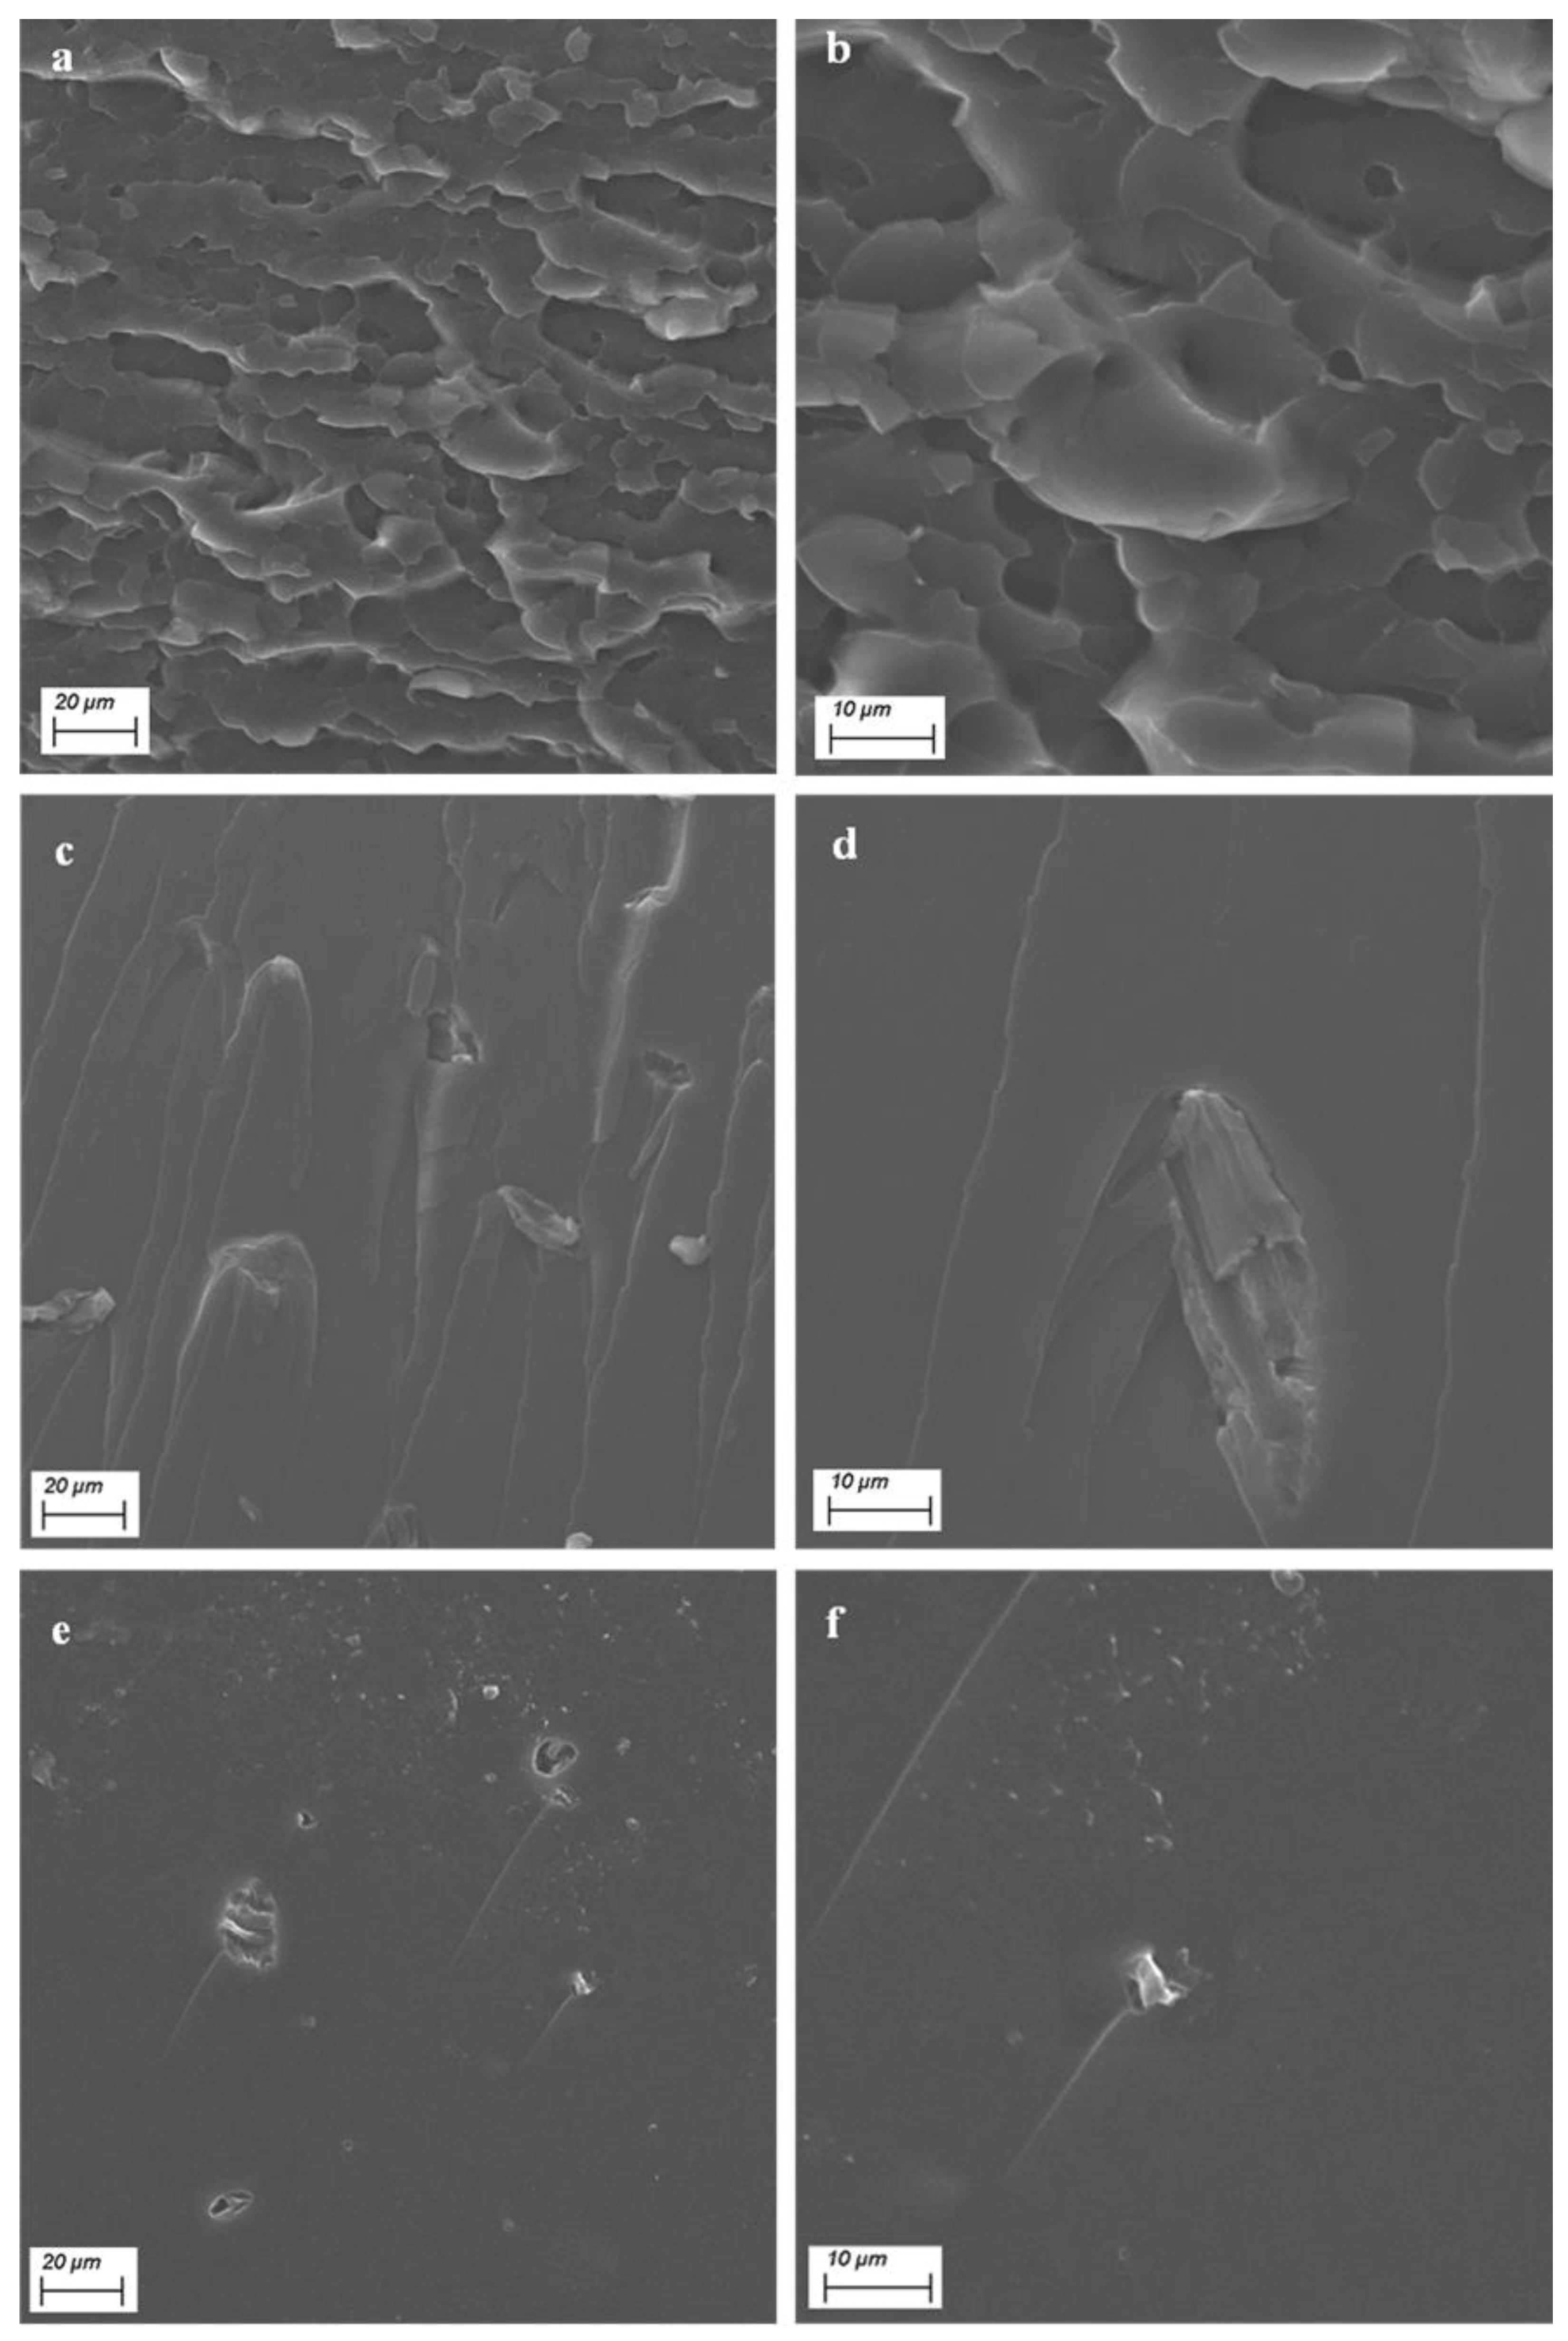
The morphology of the obtained 3D-printed systems was studied using an EVO 15 scanning electron microscope (SEM) from Zeiss (Oberkochen, Germany), coupled with an Ultim Max 40 energy dispersive X-ray (EDX) microanalyzer by Oxford Instruments (High Wycombe, UK); the samples were fractured in liquid nitrogen, fastened to a conductive adhesive tape, and finally gold-metallized. The samples were analyzed using a secondary electron detector, with energy set at 20.00 kV, at two magnifications (1000× and 2500×).

2.8. Thermogravimetric Analysis

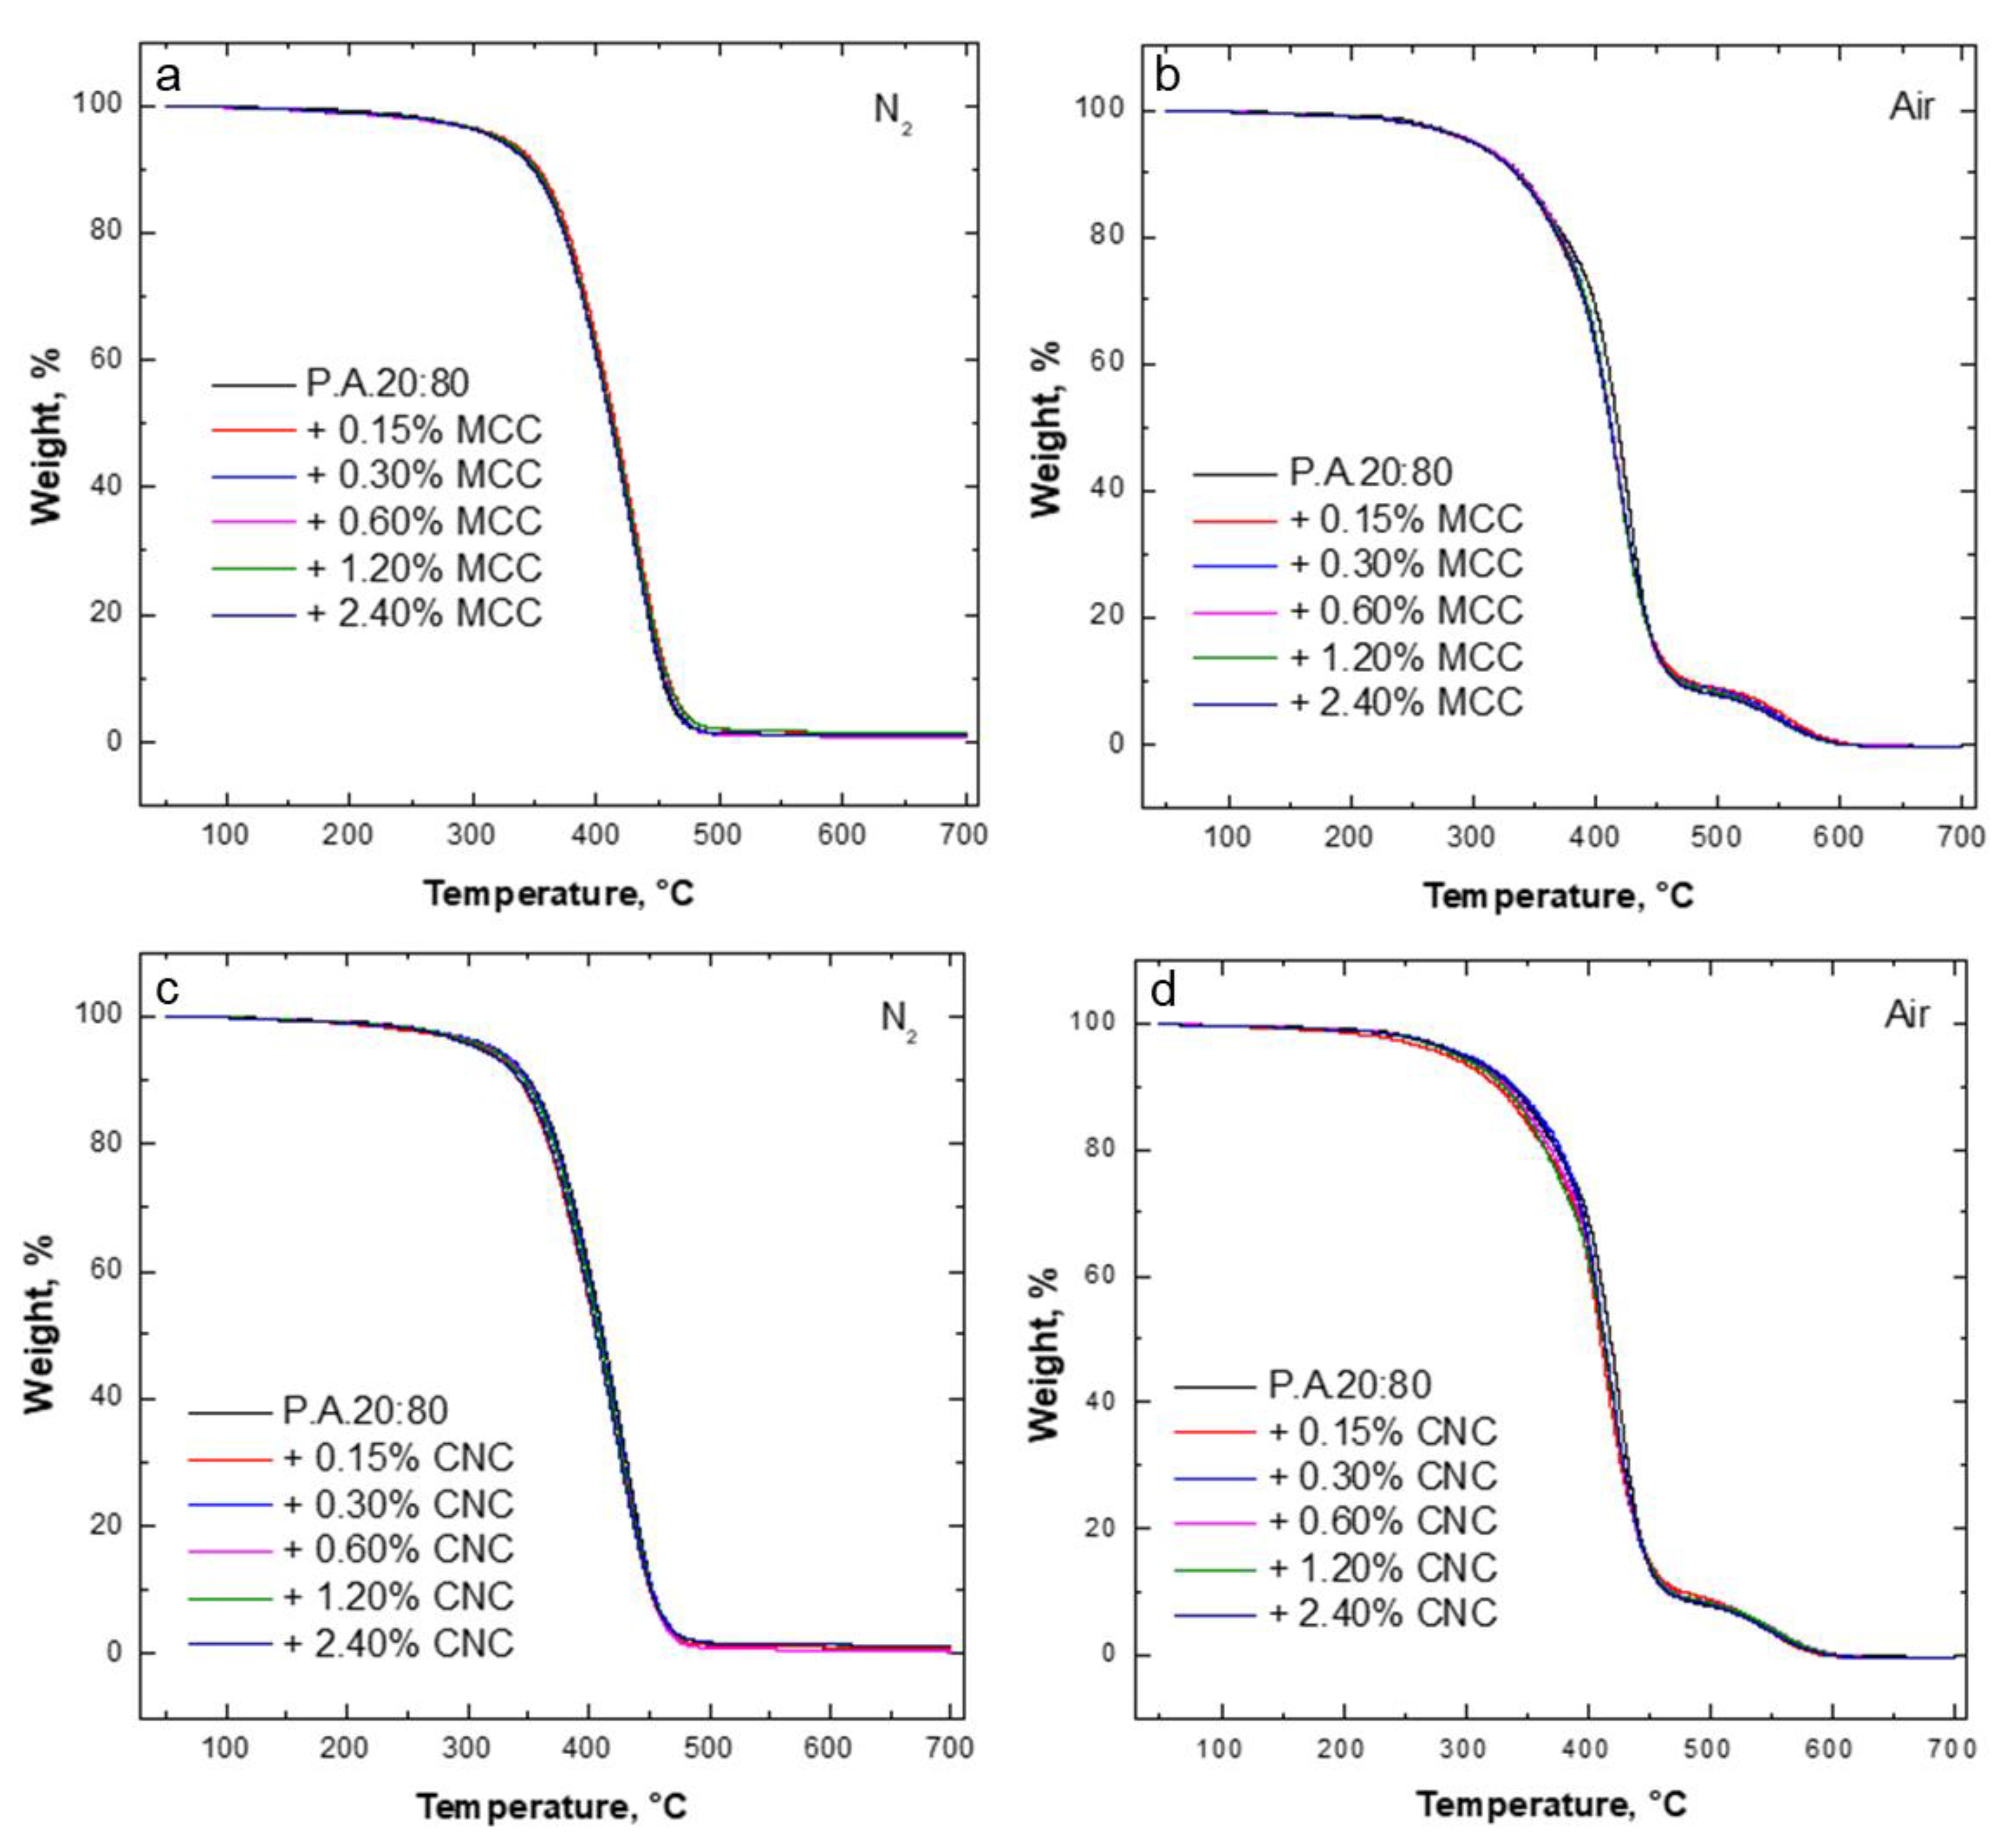
The thermal and thermo-oxidative stability of all prepared systems was assessed by thermogravimetric (TG) analyses carried out on a Discovery apparatus (TA Instruments), from 50 to 700 °C, using a heating rate of 10 °C·min−1, under both nitrogen and air flow (35 and 25 mL·min−1, respectively). The experimental error was ±0.5% for the weight and ±1 °C for the temperature.

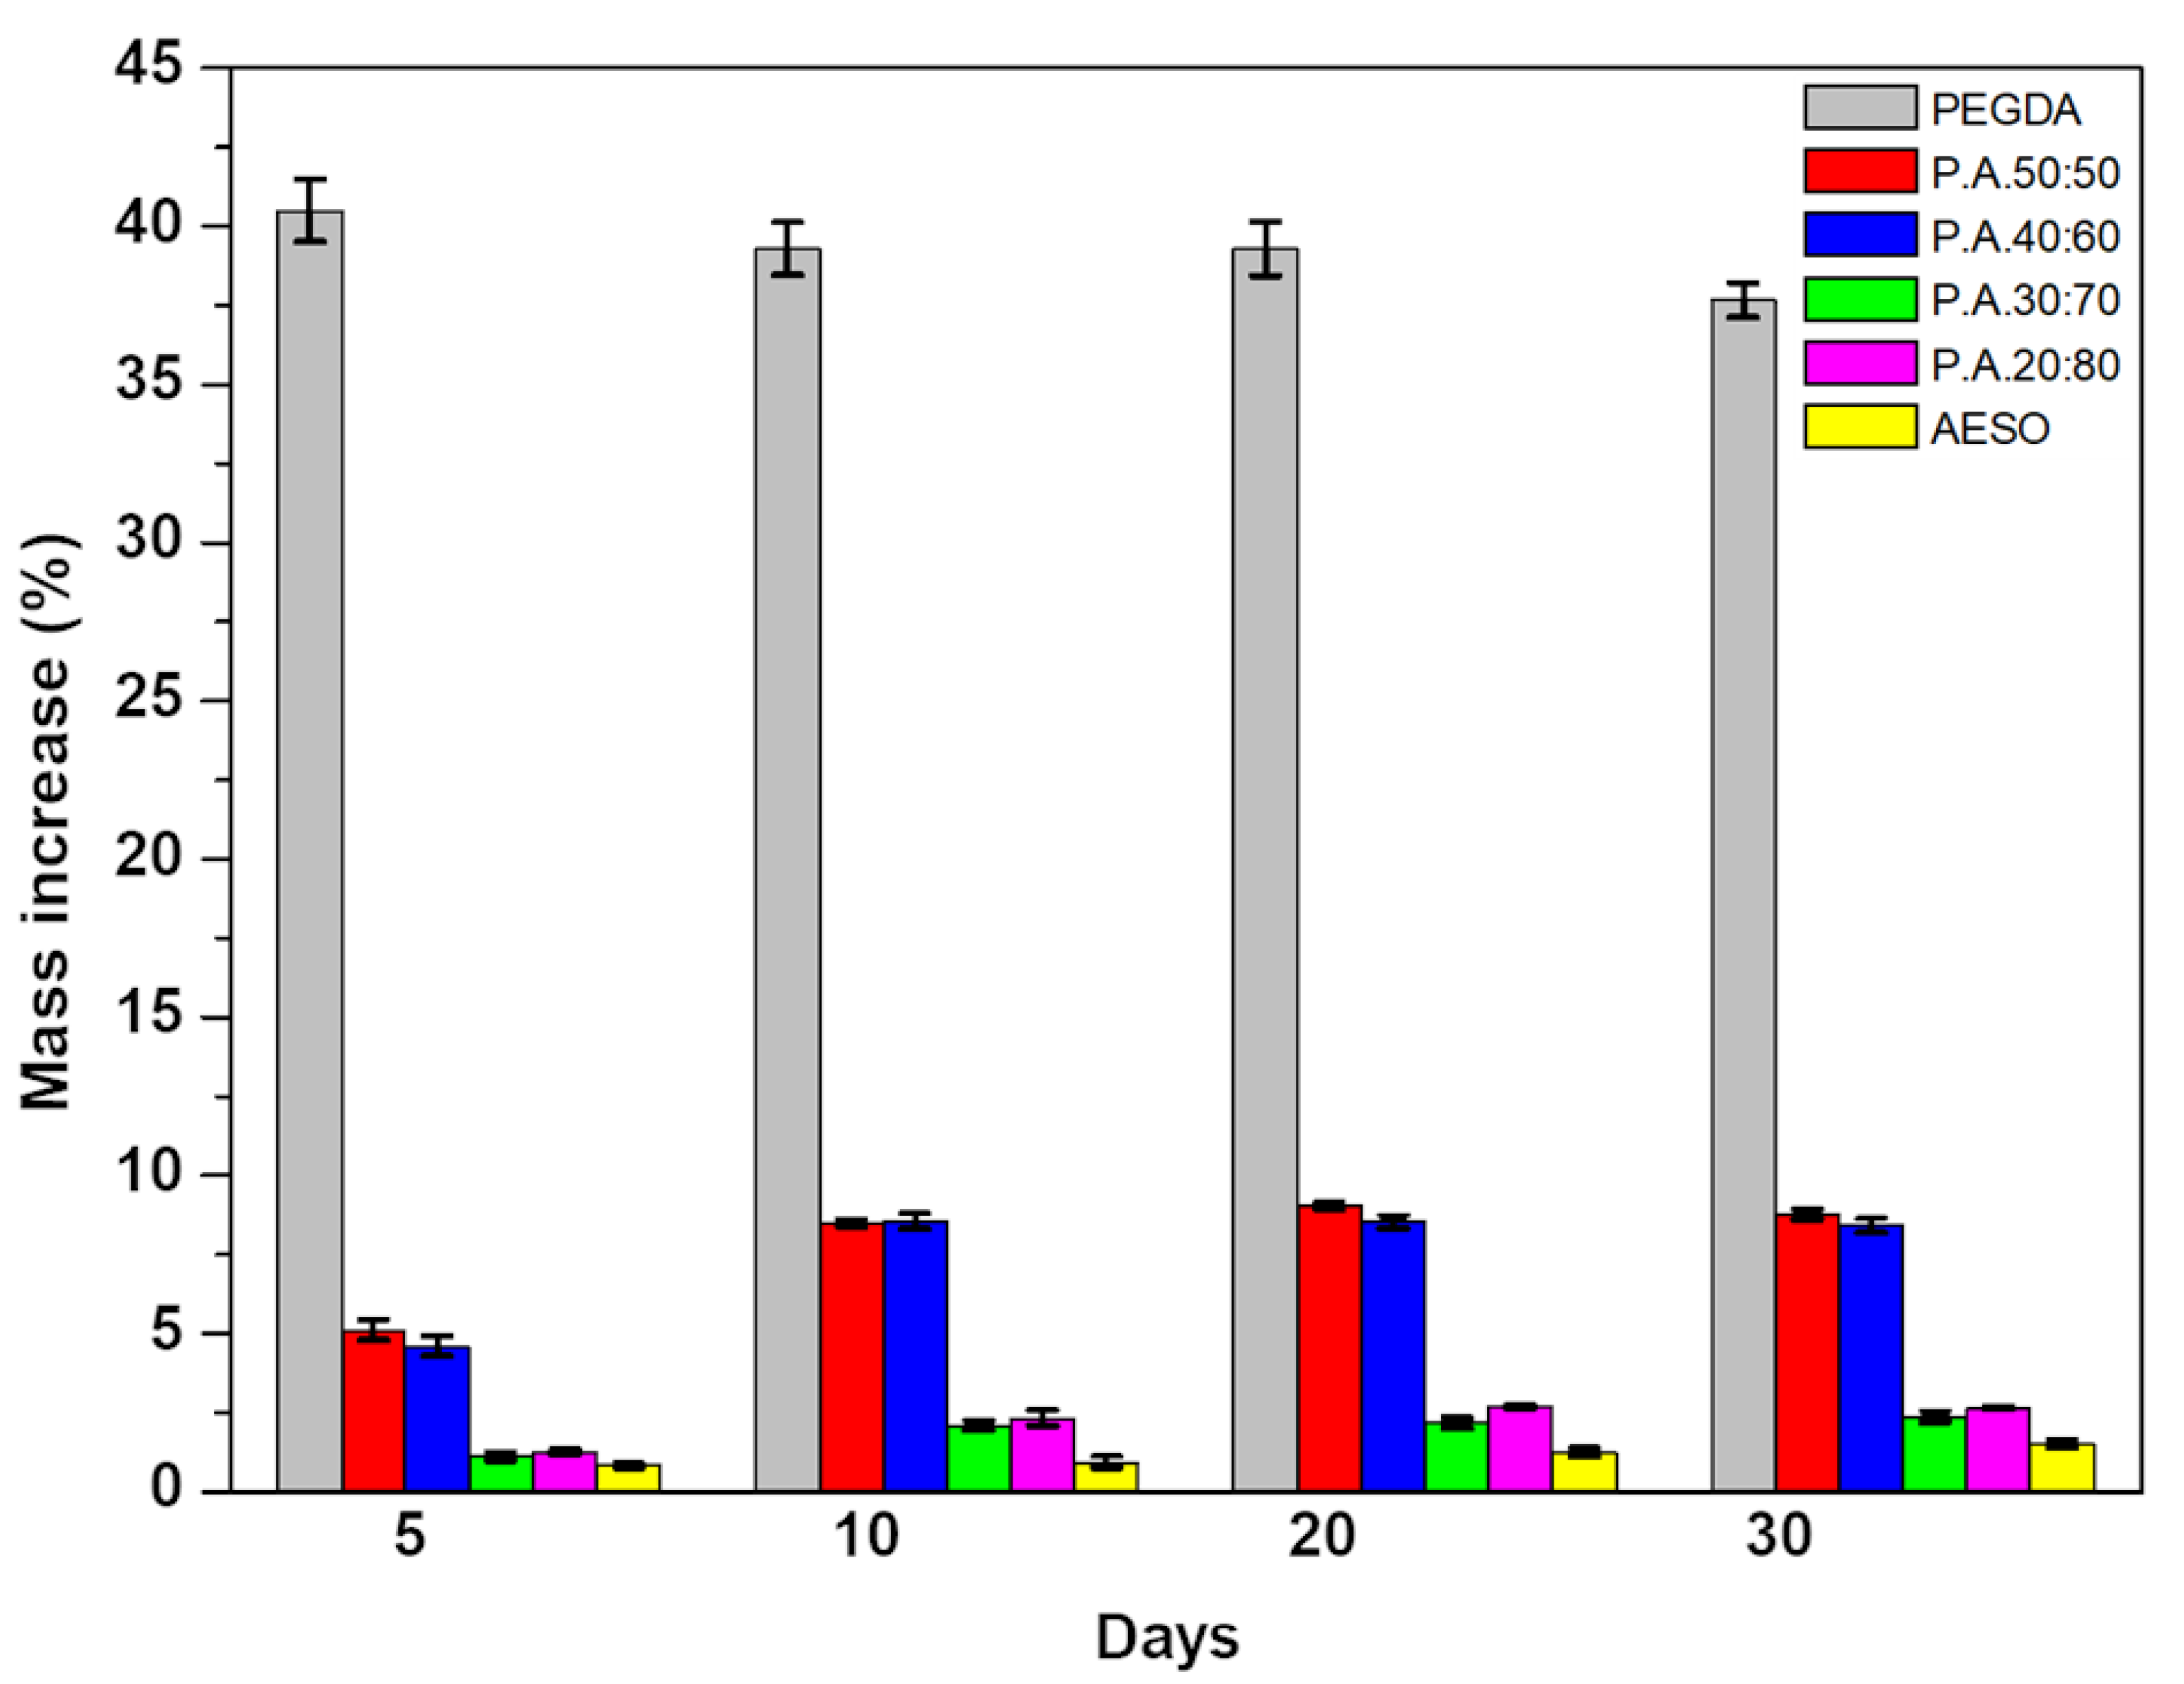
2.9. Swelling Behavior

Five rectangular samples with dimensions of 30 mm × 10 mm × 5 mm (L × W × H) were prepared with different PEGDA:AESO weight ratios and CNC or MCC loadings and then weighed (M1). The samples were then dipped into deionized water for a total period of 30 days. Every 5 days, the samples were taken from the water, dried using a dry cloth, and weighed again (M2). The swelling ratio, Sw, was calculated using Equation (3).
S w = M 2 M 1 M 1 × 100 % .

2.10. Contact Angle Measurement

Static contact angle values of AESO/PEGDA samples were measured using a homemade instrument equipped with a high-speed CCD camera. The used equipment allows the determination of contact angle, with a precision of ±1°, by taking images at frequencies as high as 200 Hz, starting within a few tens of milliseconds after the deposition of the drop. All measurements were performed at room temperature and relative humidity RH = 40% ± 5%. Five rectangular-shaped parts (size: 50 mm × 25 mm × 1 mm) were 3D-printed for each formulation. A small drop of high-purity distilled water was slowly placed on the surface of the samples, and various photos of the droplet were recorded after 5 s. The volume of the water drop was 4 ± 0.5 μL. The contact angle (CA) values were determined using image analysis software.

2.11. Working Curve

Since the kinetics during the curing process is highly complex, simplified equations are commonly used to describe the kinetics during photopolymerization [42]. In this study, an equation was adapted from the Beer–Lambert relationship, expressing the exponential decay of the light intensity as it passes through an absorbing medium i [43,44]. This semiempirical equation relates the thickness of the crosslinked layer (cure depth) to the irradiation dose through the following equation:
C d = D p ln E m a x E c ,
where Cd is the cure depth of a single layer, Dp is the penetration depth at which the intensity of the beam is reduced to 1/e2 (13.5%) of its value at the surface, Ec is the exposure per unit of area needed for the resin to reach its gel point, and Emax is the laser exposure on the resin surface. Dp and Ec were estimated by varying the resin exposure and measuring the cured layer depth. By plotting Cd vs. ln(Emax), a line known as the working curve was obtained. Dp was calculated from the slope of the line, and 
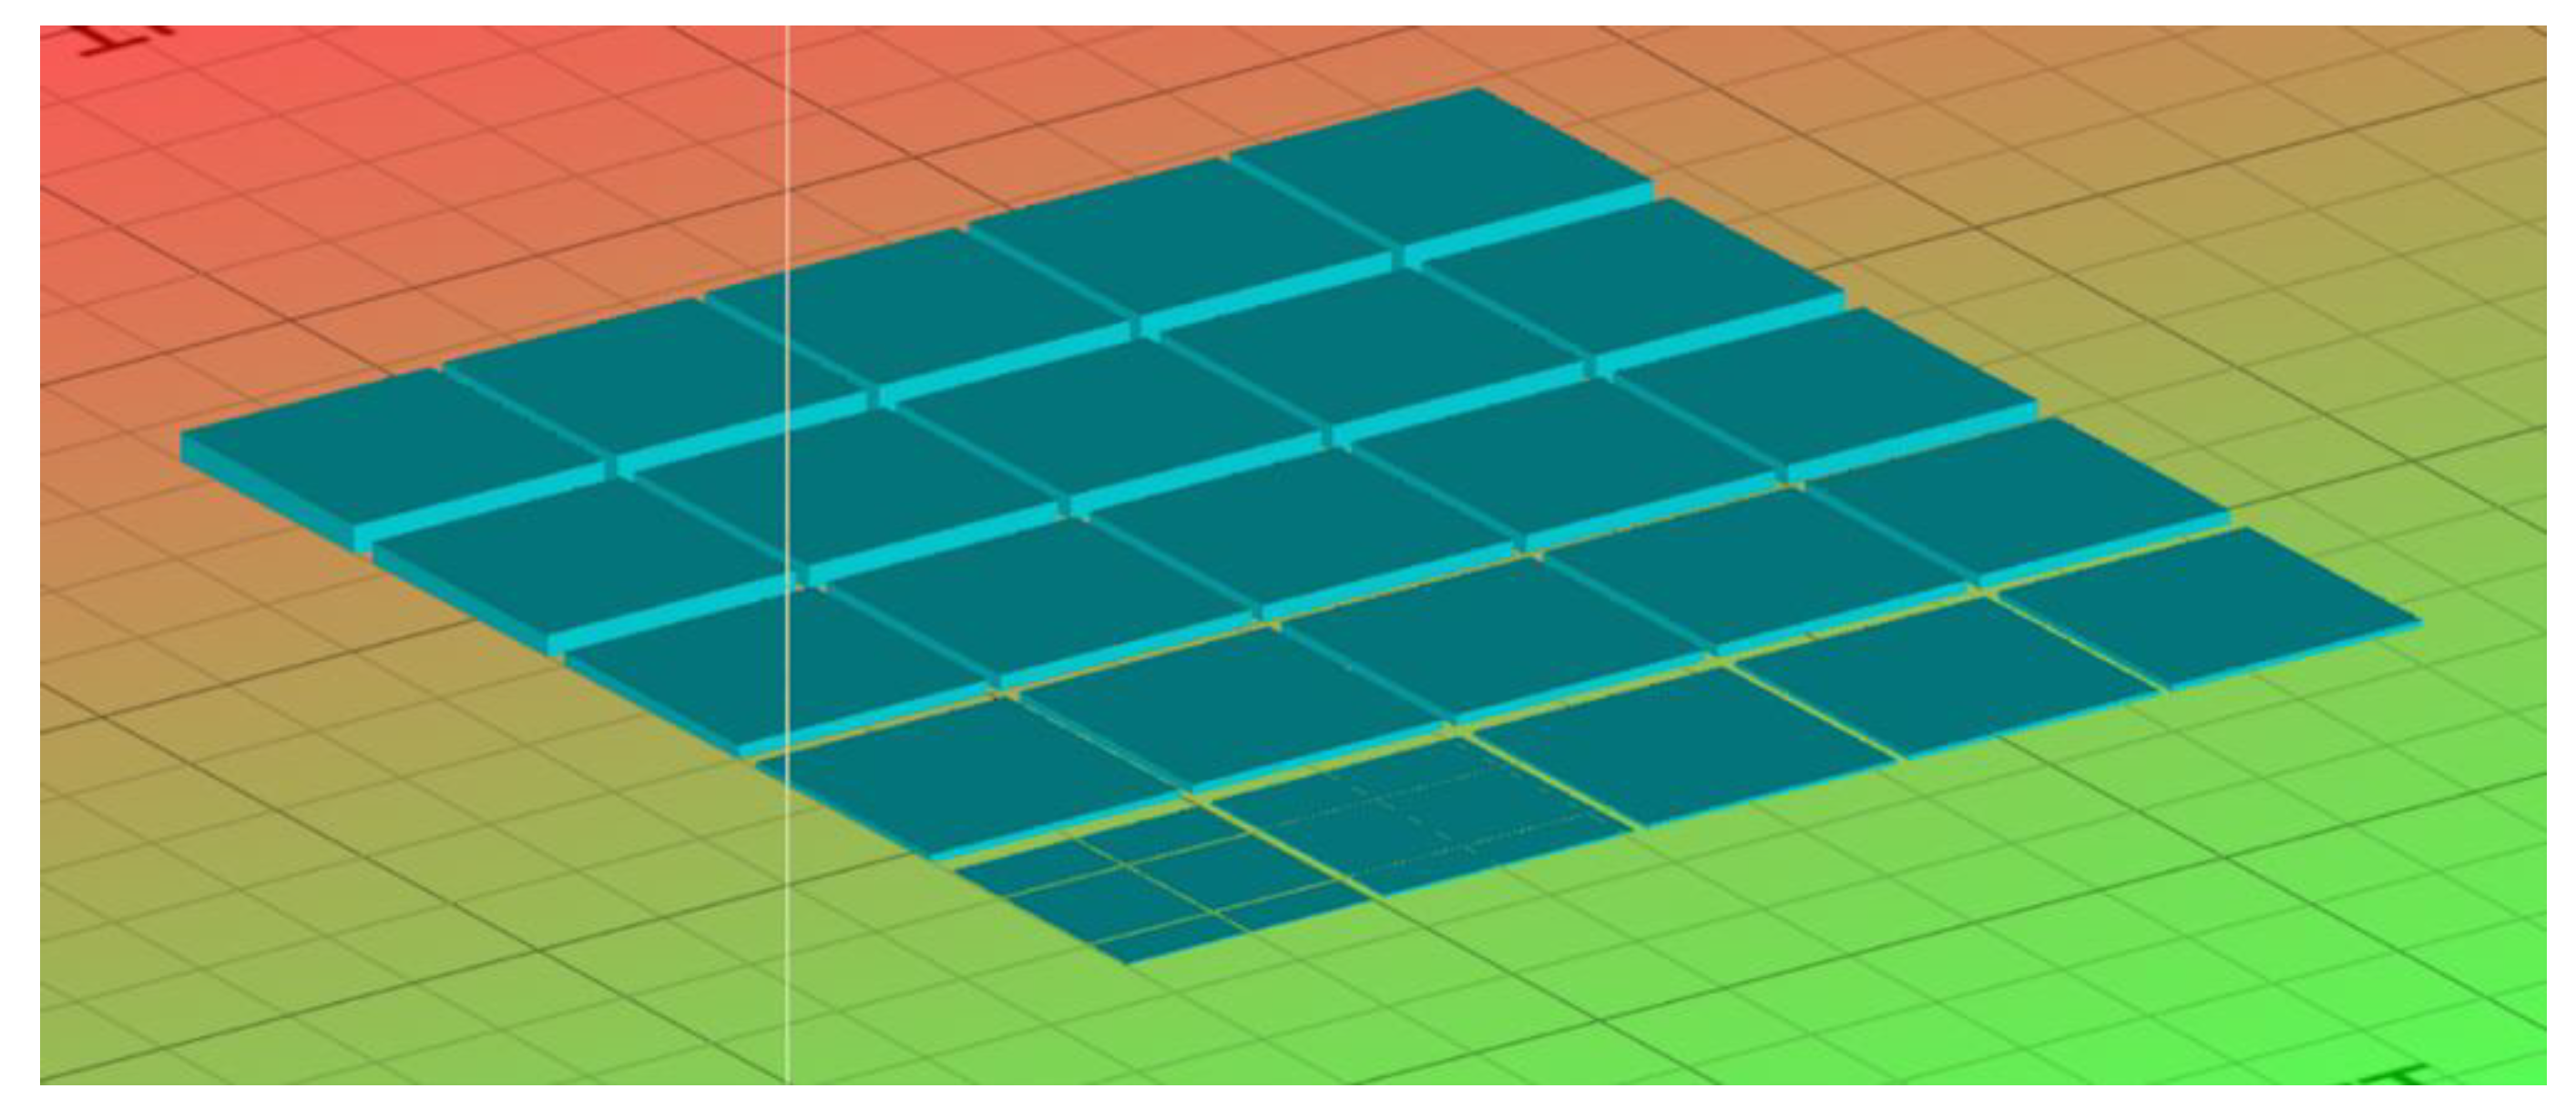
Ec was the X-intercept. To this aim, a square part composed of 25 equal-area square tiles (1 mm2), based on the model described by Bassett et al. [45], as shown in Figure 1, was printed using the Peopoly moai 130 SLA printer.
The part had 25 layers in total, with the height of each layer being 0.05 mm. Each square was exposed to light in an arithmetic progression increasing from 1 to 25. Furthermore, to avoid the effect of light scattering, the squares were separated by a gap of 1 mm. The height of each tile was measured three times using a digital caliper with 0.01 mm of resolution (Preciva Digital Caliper) and a ±10% deviation was assumed [46]. Finally, with the height of each tile, the maximum exposure of a tile was calculated using Equation (5).
E m a x = 2 n P L π W 0 V s ,
where n is the number of times the laser passed over the tile, PL is the laser power, W0 is the beam width, and Vs is the scanning speed. PL and W0 values are specific to the 3D printer; in this case, they were 150 mW and 0.07 mm, respectively. Three parts were printed with scanning speeds of 80 mm·s−1 and 200 mm·s−1.
When the MCCs and CNCs were added to the mixture, the light scattering effect exerted by these particles needed to be taken into account [44]. Thus, Dp was adjusted to consider the scattering effect, as shown by Equation (6).
D p = 2 3 d Q ϕ ,
where d is the filler mean size, φ is the filler volume fraction, and Q is the scattering efficiency. Q was calculated according to Equation (7), in which λ is the irradiation wavelength, h is the interparticle distance, and Δn is the difference in refractive index between the filler (nf) and the photosensitive material (n0).
Q = h λ Δ n 2 .

3. Results

3.1. Biobased Resin Characterization

3.1.1. FTIR Analysis

The FTIR spectra of 3D-printed specimens obtained by uncured and UV-cured AESO, PEGDA, and their combinations are shown in Figure 2. In the wavenumber domain between 1800 and 700 cm−1, the infrared spectrum of uncured AESO showed peaks between 1750 and 1700 cm−1 and at 1270 cm−1 attributed to carbonyl and ester groups, respectively. In particular, the presence of two different absorbance bands at 1737 and 1723 cm−1, both assigned to C=O, is consistent with a different chemical environment for carbonyl groups on monomers. Furthermore, four characteristic absorption peaks were assigned to the stretching vibration of the C=C double bonds at 1636, 1618, 1410, and 810 cm−1 [47,48]. Further infrared absorption bands for PEGDA were assigned to the C–O bonds of the ester groups (1270 cm−1, 1190 cm−1, and 985 cm−1) [49,50]. After the curing process, the FTIR spectra of both resins showed significant changes due to irradiation and copolymerization. In fact, under UV irradiation, the photo-initiator produced active radicals that opened the double bonds in the monomers, thereby promoting crosslinking reactions. The occurrence of photopolymerization was verified by monitoring the double-bond peaks at 1636, 1618, 1410, and 810 cm−1 [11,51,52,53,54,55]. As shown in Figure 2, at the end of the UV curing step, for the PEGDA sample, the double-bond peaks were reduced drastically, which means that they were continuously combining with the created radicals, participating in curing and increasing the crosslinking density. These modifications were more evident in the case of AESO resin, for which the disappearance of the infrared absorption bands assigned to unsaturated C=C bonds indicated that acrylate groups were completely depleted during the UV curing process. The absence of infrared bands assignable to unsaturated C=C bonds in PEGDAAESO spectra suggests the successful curing of PEGDA/AESO formulations. More specifically, the presence of AESO in the 3D printing formulations accounted for a higher conversion of PEGDA acrylic groups when PEGDA content was below 20 wt.%, as confirmed by the small peak observed at 810 cm−1 only for the samples containing 80 and 90 wt.% AESO [56]. Under the employed curing conditions, the presence of AESO, between 30% and 50%, significantly increased the conversion of C=C bonds measured by the area of the peak at 810 cm−1, reaching 100% for some of the investigated formulations (see Table 2). This phenomenon could be attributed to the structure of AESO, which has many polar groups (i.e., hydroxyl and epoxy groups) capable of interacting with PEGDA [57]. This result is particularly interesting for biomedical applications. In fact, the conversion of double bonds is directly related to the material biocompatibility issues, as the presence of unreacted free-radical groups may cause irritation and damage to the soft tissue [58].

3.1.2. Rheological Behavior

During the 3D printing process, each time the build platform is raised, a gap is formed between the polymerized layer and the VAT containing the resin. The resin must be fluid enough to be able to fill this gap [30]. Thus, controlling the viscosity is essential when developing a resin for 3D printing applications. The viscosity of commercial resins, such as Formlabs or Anycubic, is usually between 0.1 Pa·s and 1.5 Pa·s [45]. The viscosity of pure PEGDA is 0.057 Pa·s, while pure AESO has a viscosity of 15 Pa·s (which is too high for 3D printing). When 50 to 90 wt.% AESO was mixed with PEGDA, the resin viscosity increased according to the AESO loading, from 0.057 (pure PEGDA) to 0.38 (AESO loading: 50 wt.%), 0.25 (60 wt.%), 0.80 (70 wt.%), 1.27 (80 wt.%), and 2.85 (90 wt.%) Pa·s. The mixture containing 90 wt.% AESO was too viscous for the machine to print at room temperature, resulting into failed parts. Therefore, 80 wt.% was the maximum amount of AESO that could be mixed with PEGDA.

3.1.3. Mechanical Properties

The capability to tune and control the mechanical properties of 3D-printed systems is very important when developing objects for biomedical applications [10]. In the case of biomaterials, their molecular characteristics have a strong influence on the overall mechanical behavior [25,59]. The tensile strength of pure PEGDA is approximately 0.6 MPa ± 0.2 MPa [15,60]. When PEGDA was combined with AESO, the tensile strength showed a general increase (Figure 3) by 633% (4.4 ± 0.2 MPa) when 80 wt.% AESO was added to the 3D printing formulation. However, at the same time, the samples containing 60 and 70 wt.% of AESO demonstrated a lower tensile strength gain when compared with the other samples. This effect could be an indicative of network loosening [24], requiring a longer post-curing time.
The elongation at break is related to the material’s capability to bend and deform to some extent without cracking [61]. Usually, plant-based resins have a high elongation at break due to the presence of free fatty acids in their network structure [24,25,28]. The addition of AESO resulted in an increase in elongation for all samples (Figure 3). Pure PEGDA achieves a maximum elongation of 2% ± 1% [15]. When 50 and 80 wt.% AESO were added, the elongation at break increased by 815% (18.3% ± 2.0%) and 1150% (25% ± 2.3%), respectively.
As shown in Figure 3, among all samples, the formulation containing 80 wt.% AESO provided the best mechanical properties while having the highest bio-content percentage, equal to 68.8% (Equation (1)). Thus, it was selected as the base formulation for the incorporation of MCCs and CNCs.

3.2. Effect of the Incorporation of Micro- and Nanocrystalline Cellulose in 3D Printing Formulations

3.2.1. UV Curing

FTIR was also used to investigate the impact of the two fillers on the UV curing process. As shown in Table 3, the incorporation of MCCs and CNCs into the resin system containing 80 wt.% AESO did not have a significant impact on the conversion. The spectra, which displayed the typical bands of cellulose, are shown for both fillers in Figure S1. The broad peaks at around 3400–3300 cm−1, 2918–2849 cm−1, and 1430–1428 cm−1 were assigned to O–H stretching, to the asymmetric and symmetric stretching of methylene (–CH2–) groups in long alkyl chains, and to C–H in-plane bending of cellulose, respectively. Additionally, the infrared absorption bands at 1369, 1316, 1053 and 897 cm−1 were ascribed to C–H deformation stretching, C–H wagging and in-plane ring stretching, C–O stretching, and C–O–C stretching of the β-(1→4)-glycosidic linkage in cellulose, respectively. The incorporation of MCC and CNC into the PEGDA/AESO formulation was not expected to affect the UV-curing process; in fact, the same bands were still visible in the spectrum of the composite containing 2.4 wt.% MCCs or CNCs, where the signals at 1630 cm−1 and 806 cm−1, associated with stretching vibration for asymmetric vibration of out-of-plane vinyl groups, indicated the presence of unreacted double bonds.

3.2.2. Rheological Behavior

The addition of fillers can also increase the resin viscosity; thus, their form, sizes, and properties have a great impact on the 3D-printed outcome [62]. In order to test the influence of MCCs and CNCs in the optimized resin formulation, different amounts of fillers were incorporated. As shown in Table 4, both MCCs and CNCs showed a similar effect, irrespective of the size. However, the resin viscosity was slightly higher when MCCs were dispersed into the UV-curable system. This difference could be attributed either to the larger particle size of MCCs or to the formation of small aggregates, as shown by SEM analyses (see Section 3.2.4).

3.2.3. Mechanical Behavior

The addition of MCCs and CNCs to the P.A.20:80 mixture had opposite effects on tensile strength and elongation (Figure 4). When the fillers were incorporated into P.A.20:80, the elongation at break drastically decreased, from 25% ± 2.3% (unfilled resin system) to 3.6% ± 0.9%, with 0.6 wt.% MCC, and to 8.6% ± 0.2%, with 2.4 wt.% CNCs (i.e., corresponding to the highest loading). On the other hand, the tensile strength increased by 2.3% and 59.1% when 2.4 wt.% MCCs or CNCs were added, respectively. These findings can be attributed to the inherent stiffness of the cellulose structure [63]. However, although both fillers are derived from cellulose, CNCs performed better at higher loadings than MCCs; this finding could be ascribed to (i) the lower ductility of MCCs that may result in early breaks, or (ii) the formation of aggregates, which can decrease the tensile strength, as already observed by dos Santos et al., who incorporated CNCs and MCCs into poly(lactide) [64].
The Young’s modulus is generally used for assessing the stiffness of a solid material [65]. Unfilled PEGDA is reported to have a Young’s modulus of 26 ± 1 MPa [15]. However, when different concentrations of AESO were added, Young’s modulus decreased on average by 34.7%, as shown in Figure 5a. Furthermore, changing the AESO load did not affect the Young’s modulus; this finding may indicate that the elastic deformation was mainly dictated by AESOAESO interaction.
The incorporation of MCCs and CNCs remarkably increased the Young’s modulus of the optimized resin formulation. As observed in Figure 5b, when 0.15 wt.% MCCs or CNCs were incorporated, both fillers determined an increase in Young’s modulus from 16.8 ± 0.17 MPa to 145 ± 0.16 MPa and 144 ± 1.74 MPa, respectively. However, as the weight percentage of fillers in the resin system increased, the presence of MCCs resulted a higher Young’s modulus, nearly achieving two times the value observed in the presence of CNCs, when 2.4 wt.% of each filler was used. This variation could be due to the differences in morphology and chemical surface structure of the fillers, as already reported in the scientific literature [64,66].

3.2.4. Scanning Electron Microscopy

SEM analysis was carried out to assess the morphology of the composites and the level of distribution of the micro- and nanocellulose crystals. Some typical SEM images are shown in Figure 6. Unfilled 3D-printed P.A.20:80 (Figure 6a,b) showed a rough surface, which became quite smooth when each filler was embedded. The micrographs of the systems containing MCCs and CNCs ((Figure 6c–f), respectively) showed the achievement of good interfacial adhesion between the embedded fillers and the resin. Furthermore, it is noteworthy that both the systems were prone to forming some aggregates (average size between 10 and 20 microns), although the overall dispersion was quite uniform.

3.2.5. Thermogravimetric Analysis

Thermogravimetric analyses were carried out to assess the thermal and thermo-oxidative behavior of the different UV-cured systems. Table 5 presents the obtained data for the 3D-printed unfilled systems investigated as a function of AESO content; Table 6 and Table 7 show the results for the 3D-printed composites (resin system: P.A.20:80) containing MCCs and CNCs, respectively.
In nitrogen, the degradation of both PEGDA and AESO, as well as of their UV-cured mixtures, took place with a single degradation step between 300 °C and 500 °C, during which a progressive breaking of the (co)polymer network occurred. Conversely, the degradation in air showed two steps; the first involved the breaking of the (co)polymer network (between about 380 °C and 480 °C), and the second referred to the oxidation of the products formed during the first step. As observed from the data collected in Table 5, increasing the acrylated epoxidized soybean oil content decreased the T5% values in either air or inert atmosphere. This finding can be ascribed to the chemical structure and composition of AESO, which made the molecule less stable and, hence, more prone to degradation; meanwhile, the bio-sourced resin showed a sort of charring effect, as witnessed by the increase in residues collected in nitrogen at the end of the test.
Furthermore, as shown in Figure 7, the incorporation of micro-cellulose crystals into the optimized resin mixture containing 80 wt.% AESO seemed to have a very limited effect on the thermal and thermo-oxidative stability of the 3D-printed composites; in fact, all the characteristic temperatures were almost unchanged and very close to those of the unfilled system (see Table 6). A similar behavior was also found for the 3D-printed composites containing different amounts of nanocellulose crystals (see Table 7), notwithstanding a slight decrease in the T5% values in nitrogen for all filled systems, regardless of CNC loading.

3.2.6. Swelling Properties

The ability to not deform in an aqueous solution is crucial for tissue engineering when designing implants [15,18]. Changes in the material’s volume can result in deformations, such as wrinkles and surface breaks, which affect the long-term mechanical resistance of the component [67,68]. As shown in Figure 8, pure PEGDA absorbed between 38% and 40% of its weight in water over a 30 day period. The addition of AESO drastically decreased the water sorption of the 3D-printed specimens. After 10 days of immersion in water, the water sorption of the samples containing AESO stabilized without further significant changes. The samples containing 50 and 80 wt.% AESO showed swelling values of 9.4% (a 76% decrease) and 2.75% (a 93% decrease), respectively, after 30 days. The swelling decrease could be attributed to two factors: the AESO large carboxylic chains that prevented water molecules from interacting with the PEGDA hydroxyl groups and the increase in crosslinking density [69]. In fact, as more AESO was added to PEGDA, the chains became more entangled (and compact), further decreasing the space into which water could diffuse.
When MCCs and CNCs were added to P.A.20:80, only a small variation in swelling was observed after 30 days of immersion; moreover, swelling values were in the range between 2% and 2.5% (Figures S3 and S4). This means that the addition of the fillers did not significantly impact the water sorption of the 3D-printed parts. Nevertheless, increasing the concentrations of MCC and CNC in the mixture led to higher swelling. This finding could be attributed to the high number of –OH groups present in the cellulose structure, which increased the hydrophilicity [60]. Lastly, all the printed parts showed good mechanical integrity during the 30 days of immersion in water.

3.2.7. Contact Angle

In general, surfaces with moderate wettability are more able to bind to cells and tissues as compared with highly hydrophobic or hydrophilic surfaces [15,70,71]. Therefore, to determine the surface wettability of investigated composites, contact angles of PEGDA and AESO, as well as their combinations, were evaluated. PEGDA, which is known to be hydrophilic [72], showed a contact angle of 72.1° ± 3.83°, similar to what has been reported in the literature [15]. On the other hand, AESO displayed a contact angle of 92° ± 1.6°, indicating that it is practically hydrophobic. In fact, even though AESO bears some hydroxyl and epoxy functionalities (i.e., hydrophilic groups), it mainly consists of large nonpolar carboxylic chains [57]. Thus, upon adding AESO, the PEGDA wettability decreased (Table S1); the P.A.20:80 mixture exhibited a contact angle of 93° ± 2.3°, i.e., very close to that of pure AESO.
When MCCs and CNCs were dispersed in P.A.20:80, its wettability increased (see Table 8). This finding can be attributed to the high number of –OH groups on the surface of the cellulose, which enhanced the sample interaction with water. The contact angle decreased by about 34%, in the presence of MCCs, and by 43%, in the presence of CNCs. However, the wettability increase was not dependent on the filler concentration.

3.2.8. Working Curve Parameters

During the development of a photosensitive resin, it is important to know the correct amount of light or time needed to perform the curing. Models containing many empty spaces in their structure, being overexposed during the printing process, can result in these spaces also being cured. On the other hand, if the resin is underexposed, smaller structures could show deformations or fail to be printed [73]. A good rule of thumb is that the SLA resin should exhibit low values of Ec and high values of Dp, as it will need lower energy doses and the radiation will penetrate deeper in the resin [74].
The working curve parameters for the P.A.20:80 resin, Dp and Ec (Equation (4)), were calculated by ordinary least squares (OLS) regression of the cure depth Cd vs. ln(Emax). The regression had an R2 of 0.98. Ec was equal to 1.09 mJ·mm−2, which is in the range of other commercial resin formulations. On the other hand, the resin Dp value was 0.43 mm, which is higher than other commercial resins, such as PR48 (0.053 to 0.105 mm) and VeroWhitePlus (0.145 mm) [46,75]. Nevertheless, if needed, P.A.20:80 can be combined with photo-blocking agents to reduce its sensitivity to light.
Fillers can also reduce the resin sensitivity to light; this depends on the material type and loading. Usually, when fillers are incorporated into the polymer matrix, they tend to scatter the light, blocking part of the UV radiation reacting with the photo-initiators [76]. As shown in Table 9, as the concentration of MCC and CNC particles increased, Dp and Ec decreased. The lowest value of Dp was reached when 2.4 wt.% cellulose was incorporated; specifically, it shifted from 0.43 mm to 0.32 mm, with MCC, and to 0.35 mm, with CNC. Although this decrease would imply that more energy (or time) would be needed to perform the UV curing, its value is still higher than other standard commercial resins. Similarly to Dp, Ec also decreased as the filler content increased, as the fraction of liquid resin needing to be solidified was lower. Lastly, the difference between MCC and CNC Ec values could be related to their particles sizes [76].

4. Discussion

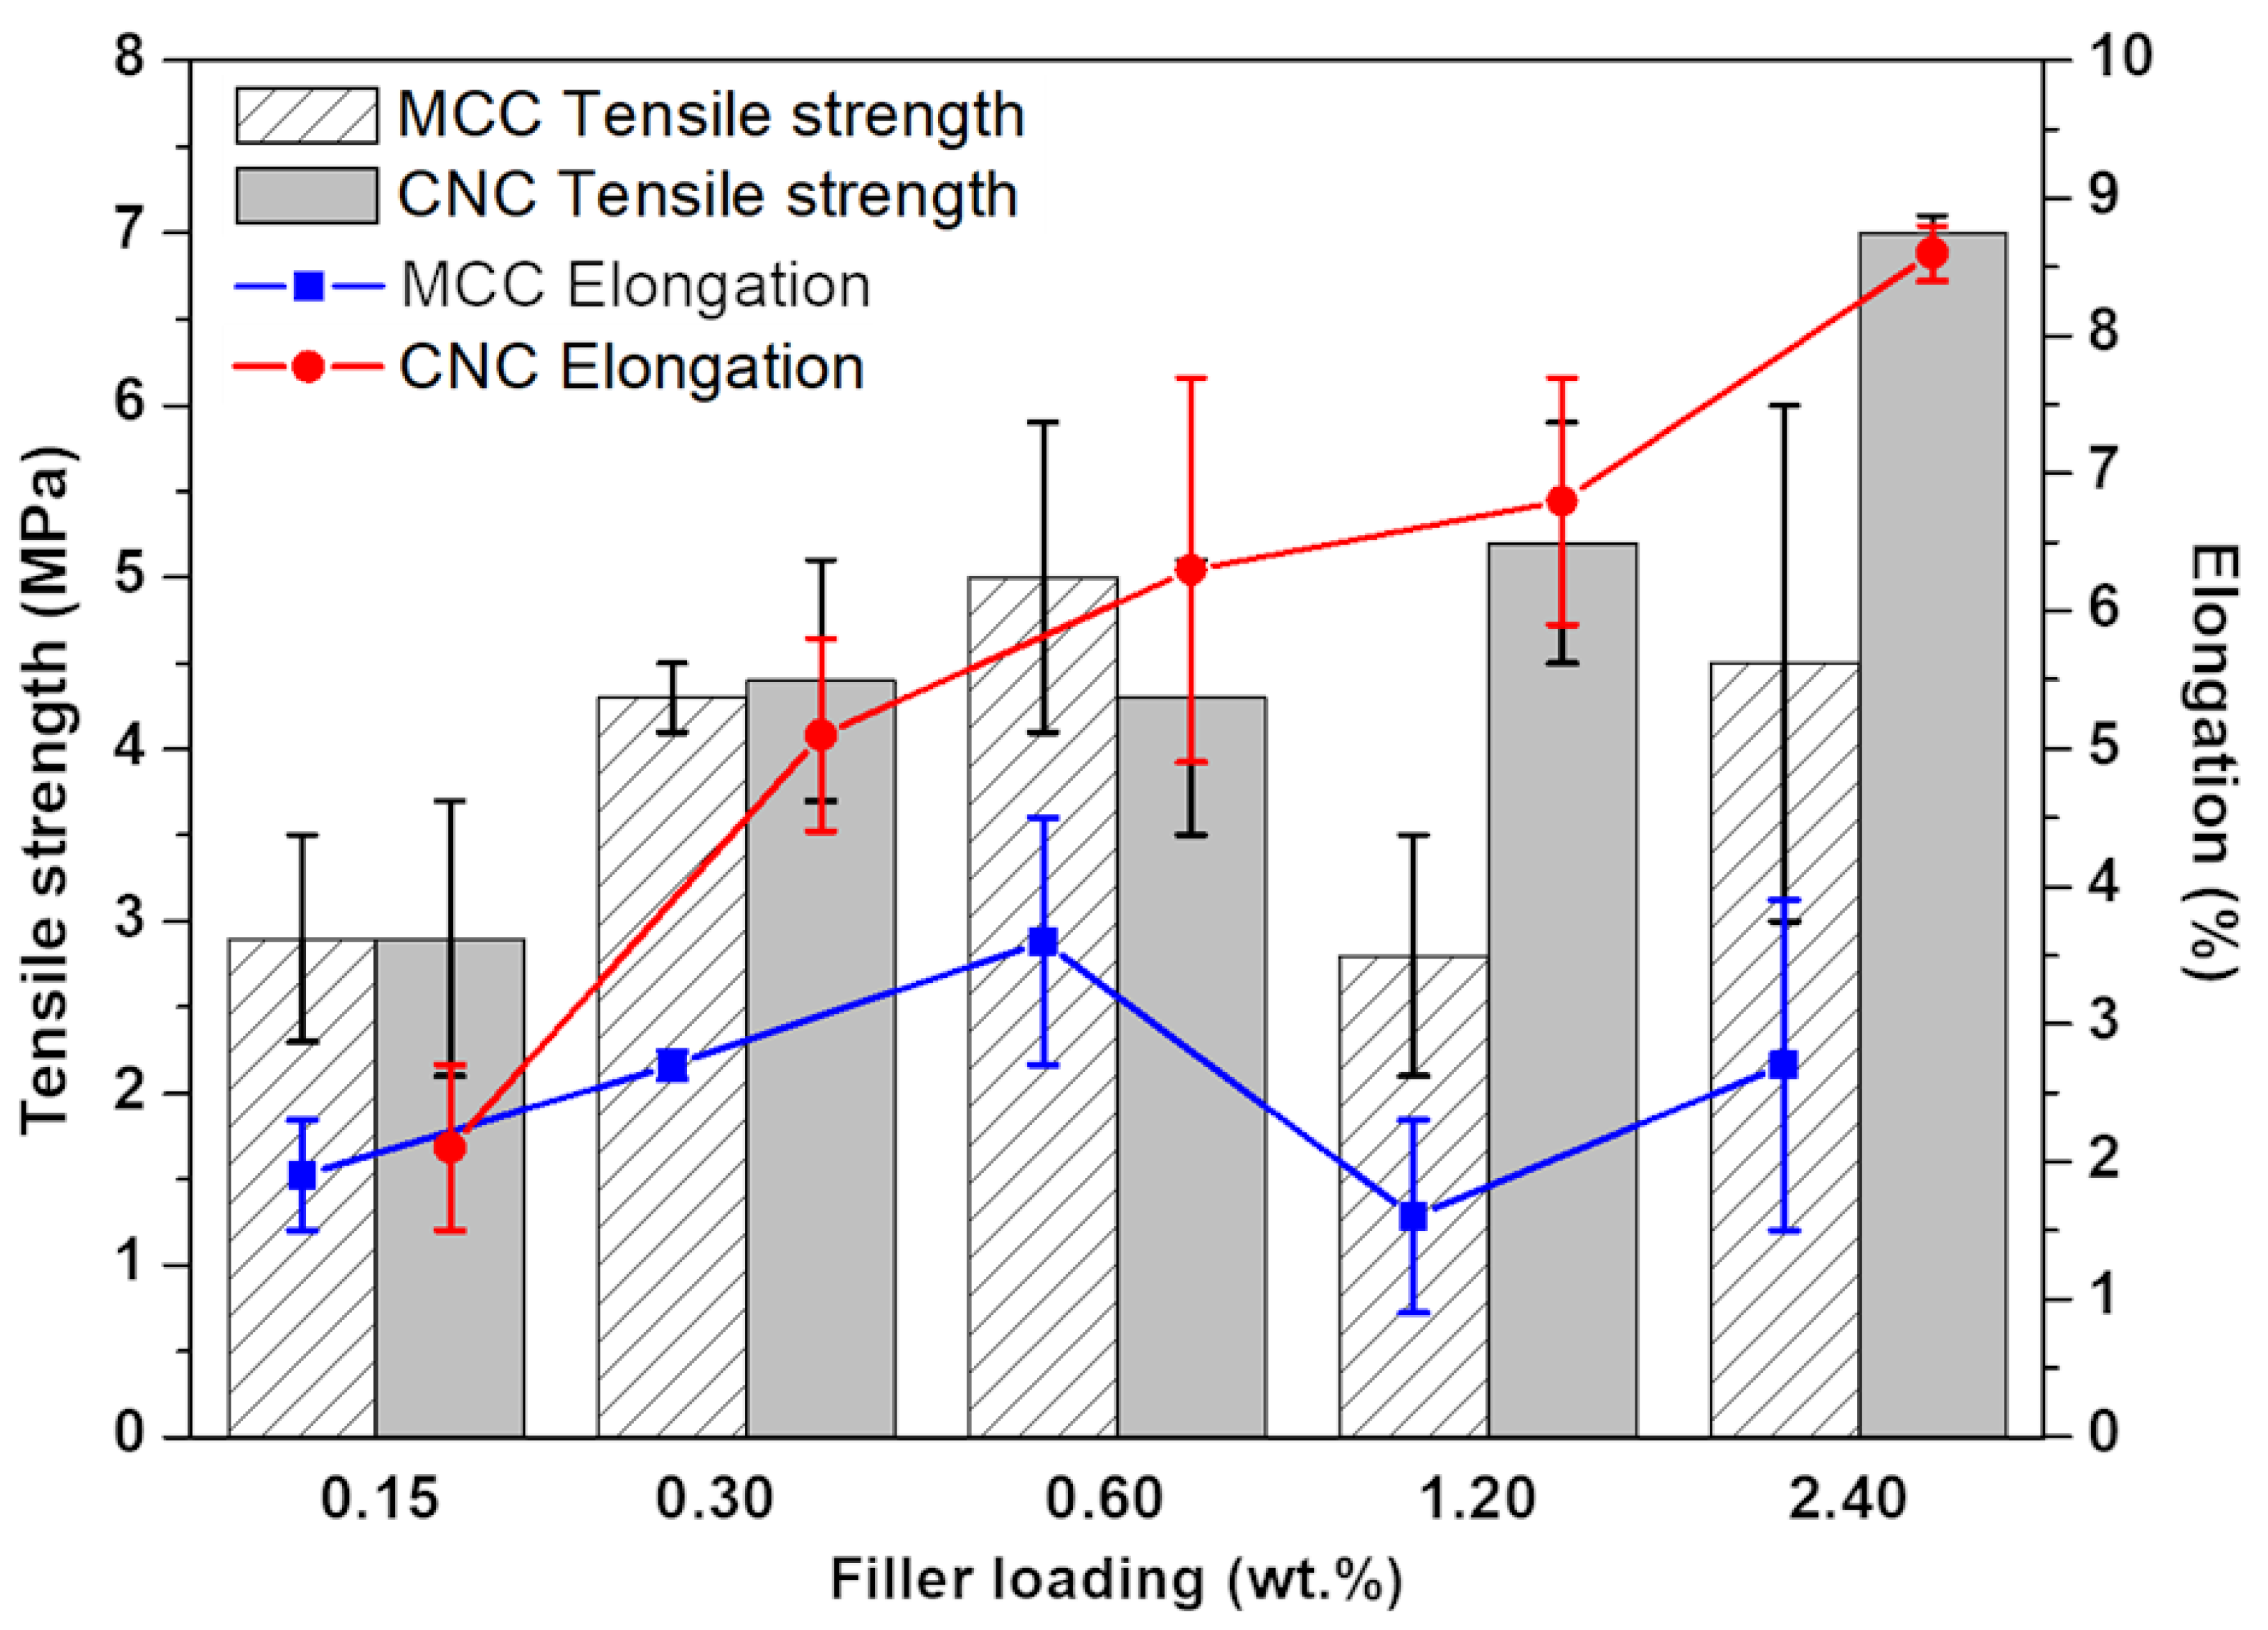
The development of biobased resins for 3D printing is essential to reduce the impact of fossil-based materials in nature and to design new applications. This study focused on the development and reinforcement of a biocompatible system capable of printing complex structures. The resin system was first optimized in order to identify the best PEGDA-to-AESO ratio suitable for the 3D printing process, i.e., with an appropriate viscosity, good mechanical properties, high bio-content, and high reactivity; in particular, the mixture containing 80 wt.% AESO was the most performing and was, therefore, chosen as the reference matrix for dispersing micro- and nanocellulose crystals, assessing their potential as fillers for 3D-printed composites. The incorporation of the fillers at different loadings (up to 2.4 wt.%) into the resin formulation containing 80 wt.% AESO did not interfere with the 3D printing process, nor had a significant impact on the resin critical energy and depth penetration. Furthermore, the presence of the cellulose crystals, irrespective of their size, increased the wettability of the printed parts (with a lowering of the water contact angle values by about 34% and 43%, when 2.4 wt.% CNCs and MCCs were incorporated, respectively). This finding was attributed to the highly polar characteristics of the fillers, bearing several hydroxyl functionalities. Meanwhile, as assessed by mechanical tests, the tensile strength increased by about 59%, in the presence of 2.4 wt.% CNCs, and the elastic modulus increased by 890%, when the same MCC loading was employed. However, further research on the influence of AESO:PEGDA resin and its combination with CNCs and MCCs on cellular proliferation and tissue response is needed to better understand its impact on living cells. In conclusion, the composite system developed in this work may represent a sustainable solution to the increasing demand for new environmentally friendly materials for additive manufacturing processes.

Supplementary Materials

The following supporting information can be downloaded at https://www.mdpi.com/article/10.3390/polym14091886/s1: Figure S1. FTIR spectra of MCC, P.A.20:80, and P.A.20:80 containing 2.4 wt.% MCC; Figure S2. FTIR spectra of CNC, P.A.20:80, and P.A.20:80 containing 2.4 wt.% CNC; Figure S3. Influence of different MCC mass percentages on the P.A.20:80 swelling after 5, 10, 20, and 30 days; Figure S4. Influence of different CNC mass percentages on the P.A.20:80 swelling after 5, 10, 20, and 30 days; Table S1. Contact angle measurements of 3D-printed samples with different AESO loadings.

Author Contributions

Conceptualization, R.P.R.; data curation, R.P.R.; formal analysis, R.A. and G.M.; investigation, R.P.R.; methodology, R.A.; supervision, G.R.; validation, R.P.R. and R.A.; writing—original draft, R.P.R., G.R., and G.M.; writing—review and editing, G.R. and G.M. All authors have read and agreed to the published version of the manuscript.

Funding

This research received no external funding.

Institutional Review Board Statement

Not applicable.

Informed Consent Statement

Not applicable.

Data Availability Statement

Not applicable.

Acknowledgments

The authors would like to thank Erico Lima Teodorak Vieira for helping with the design of the graphical abstract.

Conflicts of Interest

The authors declare no conflict of interest with respect to the research, authorship, and/or publication of this article.

References

  1. Ngo, T.D.; Kashani, A.; Imbalzano, G.; Nguyen, K.T.Q.; Hui, D. Additive Manufacturing (3D Printing): A Review of Materials, Methods, Applications and Challenges. Compos. Part B Eng. 2018, 143, 172–196. [Google Scholar] [CrossRef]
  2. Wu, H.; Fahy, W.P.; Kim, S.; Kim, H.; Zhao, N.; Pilato, L.; Kafi, A.; Bateman, S.; Koo, J.H. Recent Developments in Polymers/Polymer Nanocomposites for Additive Manufacturing. Prog. Mater. Sci. 2020, 111, 100638. [Google Scholar] [CrossRef]
  3. Thompson, M.K.; Moroni, G.; Vaneker, T.; Fadel, G.; Campbell, R.I.; Gibson, I.; Bernard, A.; Schulz, J.; Graf, P.; Ahuja, B.; et al. Design for Additive Manufacturing: Trends, Opportunities, Considerations, and Constraints. CIRP Ann. 2016, 65, 737–760. [Google Scholar] [CrossRef] [Green Version]
  4. Stansbury, J.W.; Idacavage, M.J. 3D Printing with Polymers: Challenges among Expanding Options and Opportunities. Dent. Mater. 2016, 32, 54–64. [Google Scholar] [CrossRef]
  5. Darwish, L.R.; Al-Qady, A.; El-Wakad, M.T.; Farag, M.M.; Darwish, R.R. Trends in 3D Printing Implants for Medical and Dental Applications. Ref. Modul. Mater. Sci. Mater. Eng. 2022. [Google Scholar] [CrossRef]
  6. ISO/ASTM 52900, Additive Manufacturing—General Principles—Terminology. 2018. Available online: https://www.iso.org/obp/ui/#iso:std:iso-astm:52900:dis:ed-2:v1:en (accessed on 23 December 2021).
  7. Taormina, G.; Sciancalepore, C.; Messori, M.; Bondioli, F. 3D Printing Processes for Photocurable Polymeric Materials: Technologies, Materials, and Future Trends. J. Appl. Biomater. Funct. Mater. 2018, 16, 151–160. [Google Scholar] [CrossRef] [Green Version]
  8. Ligon-Auer, S.C.; Schwentenwein, M.; Gorsche, C.; Stampfl, J.; Liska, R. Toughening of Photo-Curable Polymer Networks: A Review. Polym. Chem. 2015, 7, 257–286. [Google Scholar] [CrossRef]
  9. Ligon, S.C.; Liska, R.; Stampfl, J.; Gurr, M.; Mülhaupt, R. Polymers for 3D Printing and Customized Additive Manufacturing. Chem. Rev. 2017, 117, 10212–10290. [Google Scholar] [CrossRef] [Green Version]
  10. Voet, V.S.D.; Strating, T.; Schnelting, G.H.M.; Dijkstra, P.; Tietema, M.; Xu, J.; Woortman, A.J.J.; Loos, K.; Jager, J.; Folkersma, R. Biobased Acrylate Photocurable Resin Formulation for Stereolithography 3D Printing. ACS Omega 2018, 3, 1403–1408. [Google Scholar] [CrossRef]
  11. Pelletier, H.; Belgacem, N.; Gandini, A. Acrylated Vegetable Oils as Photocrosslinkable Materials. J. Appl. Polym. Sci. 2006, 99, 3218–3221. [Google Scholar] [CrossRef]
  12. Tan, S.G.; Chow, W.S. Biobased Epoxidized Vegetable Oils and Its Greener Epoxy Blends: A Review. Polym. Technol. Eng. 2010, 49, 1581–1590. [Google Scholar] [CrossRef]
  13. Branciforti, D.S.; Lazzaroni, S.; Milanese, C.; Castiglioni, M.; Auricchio, F.; Pasini, D.; Dondi, D. Visible Light 3D Printing with Epoxidized Vegetable Oils. Addit. Manuf. 2018, 25, 317–324. [Google Scholar] [CrossRef]
  14. Cheung, H.-Y.; Lau, K.-T.; Lu, T.-P.; Hui, D. A Critical Review on Polymer-Based Bio-Engineered Materials for Scaffold Development. Compos. Part B Eng. 2007, 38, 291–300. [Google Scholar] [CrossRef]
  15. Palaganas, N.B.; Mangadlao, J.D.; de Leon, A.C.C.; Palaganas, J.O.; Pangilinan, K.D.; Lee, Y.J.; Advincula, R.C. 3D Printing of Photocurable Cellulose Nanocrystal Composite for Fabrication of Complex Architectures via Stereolithography. ACS Appl. Mater. Interfaces 2017, 9, 34314–34324. [Google Scholar] [CrossRef] [PubMed]
  16. El-Sherbiny, I.M.; Yacoub, M.H. Hydrogel Scaffolds for Tissue Engineering: Progress and Challenges. Glob. Cardiol. Sci. Pract. 2013, 2013, 316–342. [Google Scholar] [CrossRef] [Green Version]
  17. Lü, J.-M.; Wang, X.; Marin-Muller, C.; Wang, H.; Lin, P.H.; Yao, Q.; Chen, C. Current Advances in Research and Clinical Applications of PLGA-Based Nanotechnology. Expert Rev. Mol. Diagn. 2009, 9, 325–341. [Google Scholar] [CrossRef] [Green Version]
  18. Hassan, M.; Dave, K.; Chandrawati, R.; Dehghani, F.; Gomes, V.G. 3D Printing of Biopolymer Nanocomposites for Tissue Engineering: Nanomaterials, Processing and Structure-Function Relation. Eur. Polym. J. 2019, 121, 109340. [Google Scholar] [CrossRef]
  19. Serra, T.; Ortiz-Hernandez, M.; Engel, E.; Planell, J.A.; Navarro, M. Relevance of PEG in PLA-Based Blends for Tissue Engineering 3D-Printed Scaffolds. Mater. Sci. Eng. C 2014, 38, 55–62. [Google Scholar] [CrossRef]
  20. Kuo, A.P.; Bhattacharjee, N.; Lee, Y.; Castro, K.; Kim, Y.T.; Folch, A. High-Precision Stereolithography of Biomicrofluidic Devices. Adv. Mater. Technol. 2019, 4, 1800395. [Google Scholar] [CrossRef]
  21. Seo, H.; Gil Heo, S.; Lee, H.; Yoon, H. Preparation of PEG Materials for Constructing Complex Structures by Stereolithographic 3D Printing. RSC Adv. 2017, 7, 28684–28688. [Google Scholar] [CrossRef] [Green Version]
  22. Della Sala, F.; Biondi, M.; Guarnieri, D.; Borzacchiello, A.; Ambrosio, L.; Mayol, L. Mechanical Behavior of Bioactive Poly(Ethylene Glycol) Diacrylate Matrices for Biomedical Application. J. Mech. Behav. Biomed. Mater. 2020, 110, 103885. [Google Scholar] [CrossRef] [PubMed]
  23. Voet, V.S.D.; Guit, J.; Loos, K. Sustainable Photopolymers in 3D Printing: A Review on Biobased, Biodegradable, and Recyclable Alternatives. Macromol. Rapid Commun. 2020, 42, e2000475. [Google Scholar] [CrossRef]
  24. Cui, Y.; Yang, J.; Lei, D.; Su, J. 3D Printing of a Dual-Curing Resin with Cationic Curable Vegetable Oil. Ind. Eng. Chem. Res. 2020, 59, 11381–11388. [Google Scholar] [CrossRef]
  25. Guit, J.; Tavares, M.B.L.; Hul, J.; Ye, C.; Loos, K.; Jager, J.; Folkersma, R.; Voet, V.S.D. Photopolymer Resins with Biobased Methacrylates Based on Soybean Oil for Stereolithography. ACS Appl. Polym. Mater. 2020, 2, 949–957. [Google Scholar] [CrossRef]
  26. Miao, S.; Zhu, W.; Castro, N.; Nowicki, M.; Zhou, X.; Cui, H.; Fisher, J.P.; Zhang, L.G. 4D Printing Smart Biomedical Scaffolds with Novel Soybean Oil Epoxidized Acrylate. Sci. Rep. 2016, 6, 27226. [Google Scholar] [CrossRef] [PubMed] [Green Version]
  27. Wu, Q.; Hu, Y.; Tang, J.; Zhang, J.; Wang, C.; Shang, Q.; Feng, G.D.; Liu, C.; Zhou, Y.; Lei, W. High-Performance Soybean-Oil-Based Epoxy Acrylate Resins: “Green” Synthesis and Application in UV-Curable Coatings. ACS Sustain. Chem. Eng. 2018, 6, 8340–8349. [Google Scholar] [CrossRef]
  28. Lebedevaite, M.; Talacka, V.; Ostrauskaite, J. High Biorenewable Content Acrylate Photocurable Resins for DLP 3D Printing. J. Appl. Polym. Sci. 2020, 138, 50233. [Google Scholar] [CrossRef]
  29. Manapat, J.Z.; Chen, Q.; Ye, P.; Advincula, R.C. 3D Printing of Polymer Nanocomposites via Stereolithography. Macromol. Mater. Eng. 2017, 302. [Google Scholar] [CrossRef]
  30. Weng, Z.; Zhou, Y.; Lin, W.; Senthil, T.; Wu, L. Structure-Property Relationship of Nano Enhanced Stereolithography Resin for Desktop SLA 3D Printer. Compos. Part A Appl. Sci. Manuf. 2016, 88, 234–242. [Google Scholar] [CrossRef]
  31. Trivedi, D.N.; Rachchh, N.V. Graphene and Its Application in Thermoplastic Polymers as Nano-Filler—A Review. Polymer 2021, 240, 124486. [Google Scholar] [CrossRef]
  32. Du, M.; Wu, Q.; Zuo, M.; Zheng, Q. Filler Effects on the Phase Separation Behavior of Poly (Methyl Methacrylate)/Poly (Styrene-Co-acrylonitrile) Binary Polymer Blends. Eur. Polym. J. 2013, 49, 2721–2729. [Google Scholar] [CrossRef]
  33. Ferreira, F.; Dufresne, A.; Pinheiro, I.; Souza, D.D.H.S.; Gouveia, R.; Mei, L.; Lona, L. How Do Cellulose Nanocrystals Affect the Overall Properties of Biodegradable Polymer Nanocomposites: A Comprehensive Review. Eur. Polym. J. 2018, 108, 274–285. [Google Scholar] [CrossRef]
  34. Carlmark, A.; Larsson, E.; Malmström, E. Grafting of Cellulose by Ring-Opening Polymerisation—A Review. Eur. Polym. J. 2012, 48, 1646–1659. [Google Scholar] [CrossRef] [Green Version]
  35. Mali, P.; Sherje, A.P. Cellulose Nanocrystals: Fundamentals and Biomedical Applications. Carbohydr. Polym. 2022, 275, 118668. [Google Scholar] [CrossRef]
  36. Dutta, S.D.; Hexiu, J.; Patel, D.K.; Ganguly, K.; Lim, K.-T. 3D-Printed Bioactive and Biodegradable Hydrogel Scaffolds of Alginate/Gelatin/Cellulose Nanocrystals for Tissue Engineering. Int. J. Biol. Macromol. 2021, 167, 644–658. [Google Scholar] [CrossRef]
  37. Wang, X.; Chang, C.H.; Jiang, J.; Liu, Q.; Liao, Y.; Lu, J.; Li, L.; Liu, X.; Kim, J.; Ahmed, A.; et al. The Crystallinity and Aspect Ratio of Cellulose Nanomaterials Determine Their Pro-Inflammatory and Immune Adjuvant Effects in Vitro and in Vivo. Small 2019, 15, e1901642. [Google Scholar] [CrossRef]
  38. Dai, L.; Cheng, T.; Duan, C.; Zhao, W.; Zhang, W.; Zou, X.; Aspler, J.; Ni, Y. 3D Printing Using Plant-Derived Cellulose and Its Derivatives: A Review. Carbohydr. Polym. 2018, 203, 71–86. [Google Scholar] [CrossRef]
  39. Yang, J.; An, X.; Liu, L.; Tang, S.; Cao, H.; Xu, Q.; Liu, H. Cellulose, Hemicellulose, Lignin, and Their Derivatives as Multi-Components of Bio-Based Feedstocks for 3D Printing. Carbohydr. Polym. 2020, 250, 116881. [Google Scholar] [CrossRef]
  40. Murphy, C.A.; Collins, M.N. Microcrystalline Cellulose Reinforced Polylactic Acid Biocomposite Filaments for 3D Printing. Polym. Compos. 2018, 39, 1311–1320. [Google Scholar] [CrossRef]
  41. Skliutas, E.; Lebedevaite, M.; Kasetaite, S.; Rekštytė, S.; Lileikis, S.; Ostrauskaite, J.; Malinauskas, M. A Bio-Based Resin for a Multi-Scale Optical 3D Printing. Sci. Rep. 2020, 10, 9758. [Google Scholar] [CrossRef]
  42. Murphy, C.A.; Lim, K.S.; Woodfield, T.B.F. Next Evolution in Organ-Scale Biofabrication: Bioresin Design for Rapid High-Resolution Vat Polymerization. Adv. Mater. 2022, 2022, 2107759. [Google Scholar] [CrossRef] [PubMed]
  43. Bártolo, P.J. (Ed.) Stereolithography; Springer: Boston, MA, USA, 2011. [Google Scholar]
  44. Zakeri, S.; Vippola, M.; Levänen, E. A Comprehensive Review of the Photopolymerization of Ceramic Resins Used in Stereolithography. Addit. Manuf. 2020, 35, 101177. [Google Scholar] [CrossRef]
  45. Bassett, A.W.; Honnig, A.E.; Breyta, C.M.; Dunn, I.C.; La Scala, J.J.; Stanzione, I.J.F. Vanillin-Based Resin for Additive Manufacturing. ACS Sustain. Chem. Eng. 2020, 8, 5626–5635. [Google Scholar] [CrossRef]
  46. Bennett, J. Measuring UV Curing Parameters of Commercial Photopolymers Used in Additive Manufacturing. Addit. Manuf. 2017, 18, 203–212. [Google Scholar] [CrossRef] [PubMed]
  47. Stansbury, J.W.; Dickens, S.H. Determination of Double Bond Conversion in Dental Resins by near Infrared Spectroscopy. Dent. Mater. 2001, 17, 71–79. [Google Scholar] [CrossRef]
  48. Decker, C.; Keller, L.; Zahouily, K.; Benfarhi, S. Synthesis of Nanocomposite Polymers by UV-Radiation Curing. Polymer 2005, 46, 6640–6648. [Google Scholar] [CrossRef]
  49. Auclair, N.; Kaboorani, A.; Riedl, B.; Landry, V. Acrylated Betulin as a Comonomer for Bio-Based Coatings. Part I: Characterization, Photo-Polymerization Behavior and Thermal Stability. Ind. Crop. Prod. 2015, 76, 530–537. [Google Scholar] [CrossRef]
  50. González-Henríquez, C.M.; Pizarro, G.D.C.; Sarabia-Vallejos, M.A.; Terraza, C.A.; López-Cabaña, Z.E. In Situ-Preparation and Characterization of Silver-HEMA/PEGDA Hydrogel Matrix Nanocomposites: Silver Inclusion Studies into Hydrogel Matrix. Arab. J. Chem. 2019, 12, 1413–1423. [Google Scholar] [CrossRef] [Green Version]
  51. Tathe, D.S.; Jagtap, R.N. Biobased Reactive Diluent for UV-Curable Urethane Acrylate Oligomers for Wood Coating. J. Coatings Technol. Res. 2015, 12, 187–196. [Google Scholar] [CrossRef]
  52. Barkane, A.; Platnieks, O.; Jurinovs, M.; Gaidukovs, S. Thermal Stability of UV-Cured Vegetable Oil Epoxidized Acrylate-Based Polymer System for 3D Printing Application. Polym. Degrad. Stab. 2020, 181, 109347. [Google Scholar] [CrossRef]
  53. Kunwong, D.; Sumanochitraporn, N.; Kaewpirom, S. Curing Behavior of a UV-Curable Coating Based on Urethane Acrylate Oligomer: The Influence of Reactive Monomers. Songklanakarin J. Sci. Technol. 2011, 33, 201–207. [Google Scholar]
  54. Yang, Z.; Peng, H.; Wang, W.; Liu, T. Crystallization Behavior of Poly(ε-Caprolactone)/Layered Double Hydroxide Nanocomposites. J. Appl. Polym. Sci. 2010, 116, 2658–2667. [Google Scholar] [CrossRef]
  55. Salih, A.M.; Bin Ahmad, M.; Ibrahim, N.A.; Dahlan, K.Z.H.M.; Tajau, R.; Mahmood, M.H.; Yunus, W.M.Z.W. Synthesis of Radiation Curable Palm Oil–Based Epoxy Acrylate: NMR and FTIR Spectroscopic Investigations. Molecules 2015, 20, 14191–14211. [Google Scholar] [CrossRef] [PubMed] [Green Version]
  56. Jiao, Z.; Wang, X.; Yang, Q.; Wang, C. Modification and Characterization of Urethane Acrylate Oligomers Used for UV-Curable Coatings. Polym. Bull. 2017, 74, 2497–2511. [Google Scholar] [CrossRef]
  57. Liu, W.; Fei, M.-E.; Ban, Y.; Jia, A.; Qiu, R. Preparation and Evaluation of Green Composites from Microcrystalline Cellulose and a Soybean-Oil Derivative. Polymers 2017, 9, 541. [Google Scholar] [CrossRef] [Green Version]
  58. Dos Santos, R.L.; De Sampaio, G.A.; De Carvalho, F.G.; Pithon, M.M.; Guênes, G.M.; Alves, P.M. Influence of Degree of Conversion on the Biocompatibility of Different Composites In Vivo. J. Adhes. Dent. 2014, 16, 15–20. [Google Scholar] [CrossRef]
  59. Skliutas, E.; Kašėtaitė, S.; Jonušauskas, L.; Ostrauskaite, J.; Malinauskas, M. Photosensitive Naturally Derived Resins toward Optical 3D Printing. Opt. Eng. 2018, 57, 041412. [Google Scholar] [CrossRef]
  60. Yang, J.; Han, C.-R.; Duan, J.-F.; Xu, F.; Sun, R.-C. Mechanical and Viscoelastic Properties of Cellulose Nanocrystals Reinforced Poly(Ethylene Glycol) Nanocomposite Hydrogels. ACS Appl. Mater. Interfaces 2013, 5, 3199–3207. [Google Scholar] [CrossRef]
  61. Hiemenz, P.; Lodge, T. Polymer Chemistry; CRC Press: Boca Raton, FL, USA, 2007. [Google Scholar]
  62. Rosa, R.P.; Rosace, G. Nanomaterials for 3D Printing of Polymers via Stereolithography: Concept, Technologies, and Applications. Macromol. Mater. Eng. 2021, 306, 2100345. [Google Scholar] [CrossRef]
  63. Kumar, S.; Hofmann, M.; Steinmann, B.; Foster, E.J.; Weder, C. Reinforcement of Stereolithographic Resins for Rapid Prototyping with Cellulose Nanocrystals. ACS Appl. Mater. Interfaces 2012, 4, 5399–5407. [Google Scholar] [CrossRef]
  64. dos Santos, F.A.; Iulianelli, G.C.V.; Tavares, M.I.B. Effect of Microcrystalline and Nanocrystals Cellulose Fillers in Materials Based on PLA Matrix. Polym. Test. 2017, 61, 280–288. [Google Scholar] [CrossRef]
  65. Jones, D.R.H.; Ashby, M.F. Elastic Moduli. In Engineering Materials 1. An Introduction to Properties, Applications and Design, 5th ed.; Elsevier: Amsterdam, Netherlands, 2019; pp. 31–47. [Google Scholar] [CrossRef]
  66. Dos Santos, F.A.; Iulianelli, G.C.V.; Tavares, M.I.B. Development and Properties Evaluation of Bio-Based PLA/PLGA Blend Films Reinforced with Microcrystalline Cellulose and Organophilic Silica. Polym. Eng. Sci. 2017, 57, 464–472. [Google Scholar] [CrossRef]
  67. IUPAC. Swelling Definition, Goldbook. Available online: https://goldbook.iupac.org/terms/view/S06202 (accessed on 10 December 2021).
  68. Necchi, S.; Molina, D.; Turri, S.; Rossetto, F.; Rietjens, M.; Pennati, G. Failure of Silicone Gel Breast Implants: Is the Mechanical Weakening Due to Shell Swelling a Significant Cause of Prostheses Rupture? J. Mech. Behav. Biomed. Mater. 2011, 4, 2002–2008. [Google Scholar] [CrossRef] [PubMed]
  69. Omer, R.A.; Hughes, A.; Hama, J.R.; Wang, W.; Tai, H. Hydrogels from Dextran and Soybean Oil by UV Photo-Polymerization. J. Appl. Polym. Sci. 2014, 132. [Google Scholar] [CrossRef]
  70. Hoffman, A.S. Hydrogels for Biomedical Applications. Adv. Drug Deliv. Rev. 2002, 54, 3–12. [Google Scholar] [CrossRef]
  71. Yuan, Y.; Hays, M.P.; Hardwidge, P.R.; Kim, J. Surface Characteristics Influencing Bacterial Adhesion to Polymeric Substrates. RSC Adv. 2017, 7, 14254–14261. [Google Scholar] [CrossRef] [Green Version]
  72. Zhao, T.; Zhang, H.; Zhou, D.; Gao, Y.; Dong, Y.; Greiser, U.; Tai, H.; Wang, W. Water Soluble Hyperbranched Polymers from Controlled Radical Homopolymerization of PEG Diacrylate. RSC Adv. 2015, 5, 33823–33830. [Google Scholar] [CrossRef] [Green Version]
  73. Li, Y.; Mao, Q.; Yin, J.; Wang, Y.; Fu, J.; Huang, Y. Theoretical Prediction and Experimental Validation of the Digital Light Processing (DLP) Working Curve for Photocurable Materials. Addit. Manuf. 2021, 37, 101716. [Google Scholar] [CrossRef]
  74. Licciulli, A.A.; Corcione, C.E.; Greco, A.; Amicarelli, V.; Maffezzoli, A. Laser Stereolithography of ZrO2 Toughened Al2O3. J. Eur. Ceram. Soc. 2005, 25, 1581–1589. [Google Scholar] [CrossRef]
  75. Sutton, J.T.; Rajan, K.; Harper, D.P.; Chmely, S.C. Lignin-Containing Photoactive Resins for 3D Printing by Stereolithography. ACS Appl. Mater. Interfaces 2018, 10, 36456–36463. [Google Scholar] [CrossRef]
  76. Fei, G.; Parra-Cabrera, C.; Zhong, K.; Tietze, M.L.; Clays, K.; Ameloot, R. Scattering Model for Composite Stereolithography to Enable Resin–Filler Selection and Cure Depth Control. ACS Appl. Polym. Mater. 2021, 3, 6705–6712. [Google Scholar] [CrossRef]
Scheme 1. The 3D printing process for the photocurable systems.
Polymers 14 01886 sch001
Figure 1. The 3D model used to determine the resin curing characteristics.
Polymers 14 01886 g001
Figure 2. FTIR spectra of PEGDA mixed with different AESO loadings (c = cured; unc = uncured).
Polymers 14 01886 g002
Figure 3. Variation of the tensile strength and elongation as a function of AESO loading. Statistical analysis for the elongation at break was performed using a one-way analysis of variance (ANOVA) with the level of significance set at probabilities of p < 0.05.
Polymers 14 01886 g003
Figure 4. Influence of MCC and CNC loadings on P.A.20:80 tensile strength and elongation at break. Statistical analysis for the elongation at break was performed using a one-way analysis of variance (ANOVA) with the level of significance set at probabilities of p < 0.05.
Polymers 14 01886 g004
Figure 5. Young’s modulus values of PEGDA/AESO 3D-printed systems (a) and of P.A.20:80 containing different amounts of MCCs and CNCs (b).
Polymers 14 01886 g005
Figure 6. Typical SEM micrographs of (a,b) unfilled P.A.20:80 and samples containing 0.60 wt.% (c,d) MCC and (e,f) CNC.
Polymers 14 01886 g006
Figure 7. Thermogravimetric curves of the resin mixture containing 80 wt.% AESO with varying concentrations of MCC (a,b) and CNC (c,d) in air and N2 heated at a constant rate of 10 °C·min−1.
Polymers 14 01886 g007
Figure 8. Swelling behavior of 3D-printed parts for 5, 10, 20, and 30 days with different AESO loadings.
Polymers 14 01886 g008
Table 1. Sample code, composition, and bio-content (BC) of each PEGDA/AESO mixture.
Sample CodePEGDA (%)AESO (%)BC (%)
P.A.50:50505043.0
P.A.40:60406051.6
P.A.30:70307060.2
P.A.20:80208068.8
P.A.10:90109077.4
Table 2. Double-bond conversion at 810 cm−1 for PEGDA, AESO, and their mixtures.
Sample CodePeak Area at Initial Time (cm2)Peak Area after 3D Printing (cm2)Conversion
(%)
PEGDA303.4784.7272.0
P.A.50:50227.910100
P.A.40:60200.150100
P.A.30:70204.450100
P.A.20:80189.902.3998.7
P.A.10:90180.498.7695.1
AESO161.044.9496.9
Table 3. Double-bond conversion at 810 cm−1 in the presence of different loadings of MCCs and CNCs in P.A.20:80.
Filler TypeFiller Percentage (%)Peak Area at Initial Time (cm2)Peak Area after 3D Printing (cm2)Conversion (%)
MCC0.15195.238.3695.7
0.30200.927.5696.2
0.60200.540.1799.9
1.20200.731.8499.1
2.40186.967.7795.8
CNC0.15175.082.1798.8
0.30173.325.2996.9
0.60177.201.0899.4
1.20173.347.7895.5
2.40187.907.1296.2
Table 4. Complex viscosity values of the UV-curable systems as a function of the filler loading in P.A.20:80.
Filler TypeLoading (wt.%)Complex Viscosity (Pa·s)
--1.27
MCC0.151.77
0.301.92
0.602.01
1.202.11
2.402.20
CNC0.151.62
0.301.75
0.601.86
1.201.96
2.402.05
Table 5. Thermogravimetric data for the different AESO/PEGDA 3D-printed systems (w/w).
Sample CodeAtmosphereT5% (°C)Tmax1 a (°C)Residue at Tmax1 (%)Tmax2 a (°C)Residue at Tmax2 (%)Residue at 700 °C (%)
PEGDANitrogen33742037.9--0.5
P.A.50:5033942938.9--0.5
P.A.40:6033642936.9--0.9
P.A.30:7033243233.9--1.0
P.A.20:8032242833.1--1.4
AESO30839059.0--2.7
PEGDAAir30841337.25382.40
P.A.50:5031042443.65542.60
P.A.40:6031242838.85284.00
P.A.30:7030842539.15393.60
P.A.20:8029942639.55543.70
AESO29339754.05525.70
a From derivative curve.
Table 6. Thermogravimetric data for MCC-based composites.
Sample CodeAtmosphereT5% (°C)Tmax1 a (°C)Residue at Tmax1 (%)Tmax2 a (°C)Residue at Tmax2 (%)Residue at 700 °C (%)
P.A.20:80Nitrogen32242833.1--0.9
+0.15% MCC32243134.2--1.1
+0.30% MCC32043032.1--0.9
+0.60% MCC31742932.9--0.8
+1.20% MCC32042934.2--1.2
+2.40% MCC31642933.0--1.1
P.A.20:80Air29942639.55543.70
+0.15% MCC29742041.25554.30
+0.30% MCC29842139.65504.30
+0.60% MCC30042140.05474.20
+1.20% MCC29841941.25474.10
+2.40% MCC29742139.55514.20
a From derivative curve.
Table 7. Thermogravimetric data for CNC-based composites.
Sample CodeAtmosphereT5% (°C)Tmax1 a (°C)Residue at Tmax1 (%)Tmax2 a (°C)Residue at Tmax2 (%)Residue at 700 °C (%)
P.A.20:80Nitrogen32242833.1--0.9
h31242333.7--0.9
+0.30% CNC31542435.8--1.0
+0.60% CNC31742434.9--1.1
+1.20% CNC31642434.4--1.2
+2.40% CNC30842234.4--1.3
P.A.20:80Air29942639.55543.70
+0.15% CNC28441247.25444.40
+0.30% CNC29041745.05444.50
+0.60% CNC29542139.05524.10
+1.20% CNC29242040.35504.20
+2.40% CNC29742140.25464.00
a From derivative curve.
Table 8. Contact angle values with water for PEGDA:AESO 20:80 and its composites containing MCCs or CNCs. Statistical analyses were performed using Pearson’s correlation for MCC and CNC with p < 0.05.
Filler TypeLoading (wt. %)Contact Angle (°)Standard Deviation
--93.02.3
MCC0.1561.95.1
0.3061.85.7
0.6060.53.8
1.2063.23.0
2.4059.04.0
CNC0.1551.92.1
0.3058.44.2
0.6053.90.7
1.2048.70.2
2.4052.12.4
Table 9. Depth penetration (Dp) and critical energy (Ec) as a function of MCC and CNC loadings. Statistical analyses were performed using Pearson’s correlation for MCC and CNC with p < 0.05.
Filler TypeLoading (wt. %)Ec (mJ·mm−2)Dp (mm)R2
MCC0.150.940.340.98
0.300.920.350.98
0.601.060.350.96
1.201.000.320.96
2.400.970.320.97
CNC0.151.160.390.99
0.301.040.360.98
0.601.050.370.96
1.201.030.360.98
2.401.040.350.97
Publisher’s Note: MDPI stays neutral with regard to jurisdictional claims in published maps and institutional affiliations.

