
Life-Cycle Cost Analysis of Long-Span CFRP Cable-Stayed Bridges


Abstract
:1. Introduction
2. Life-Cycle Cost of Bridges
2.1. Theoretical Basis
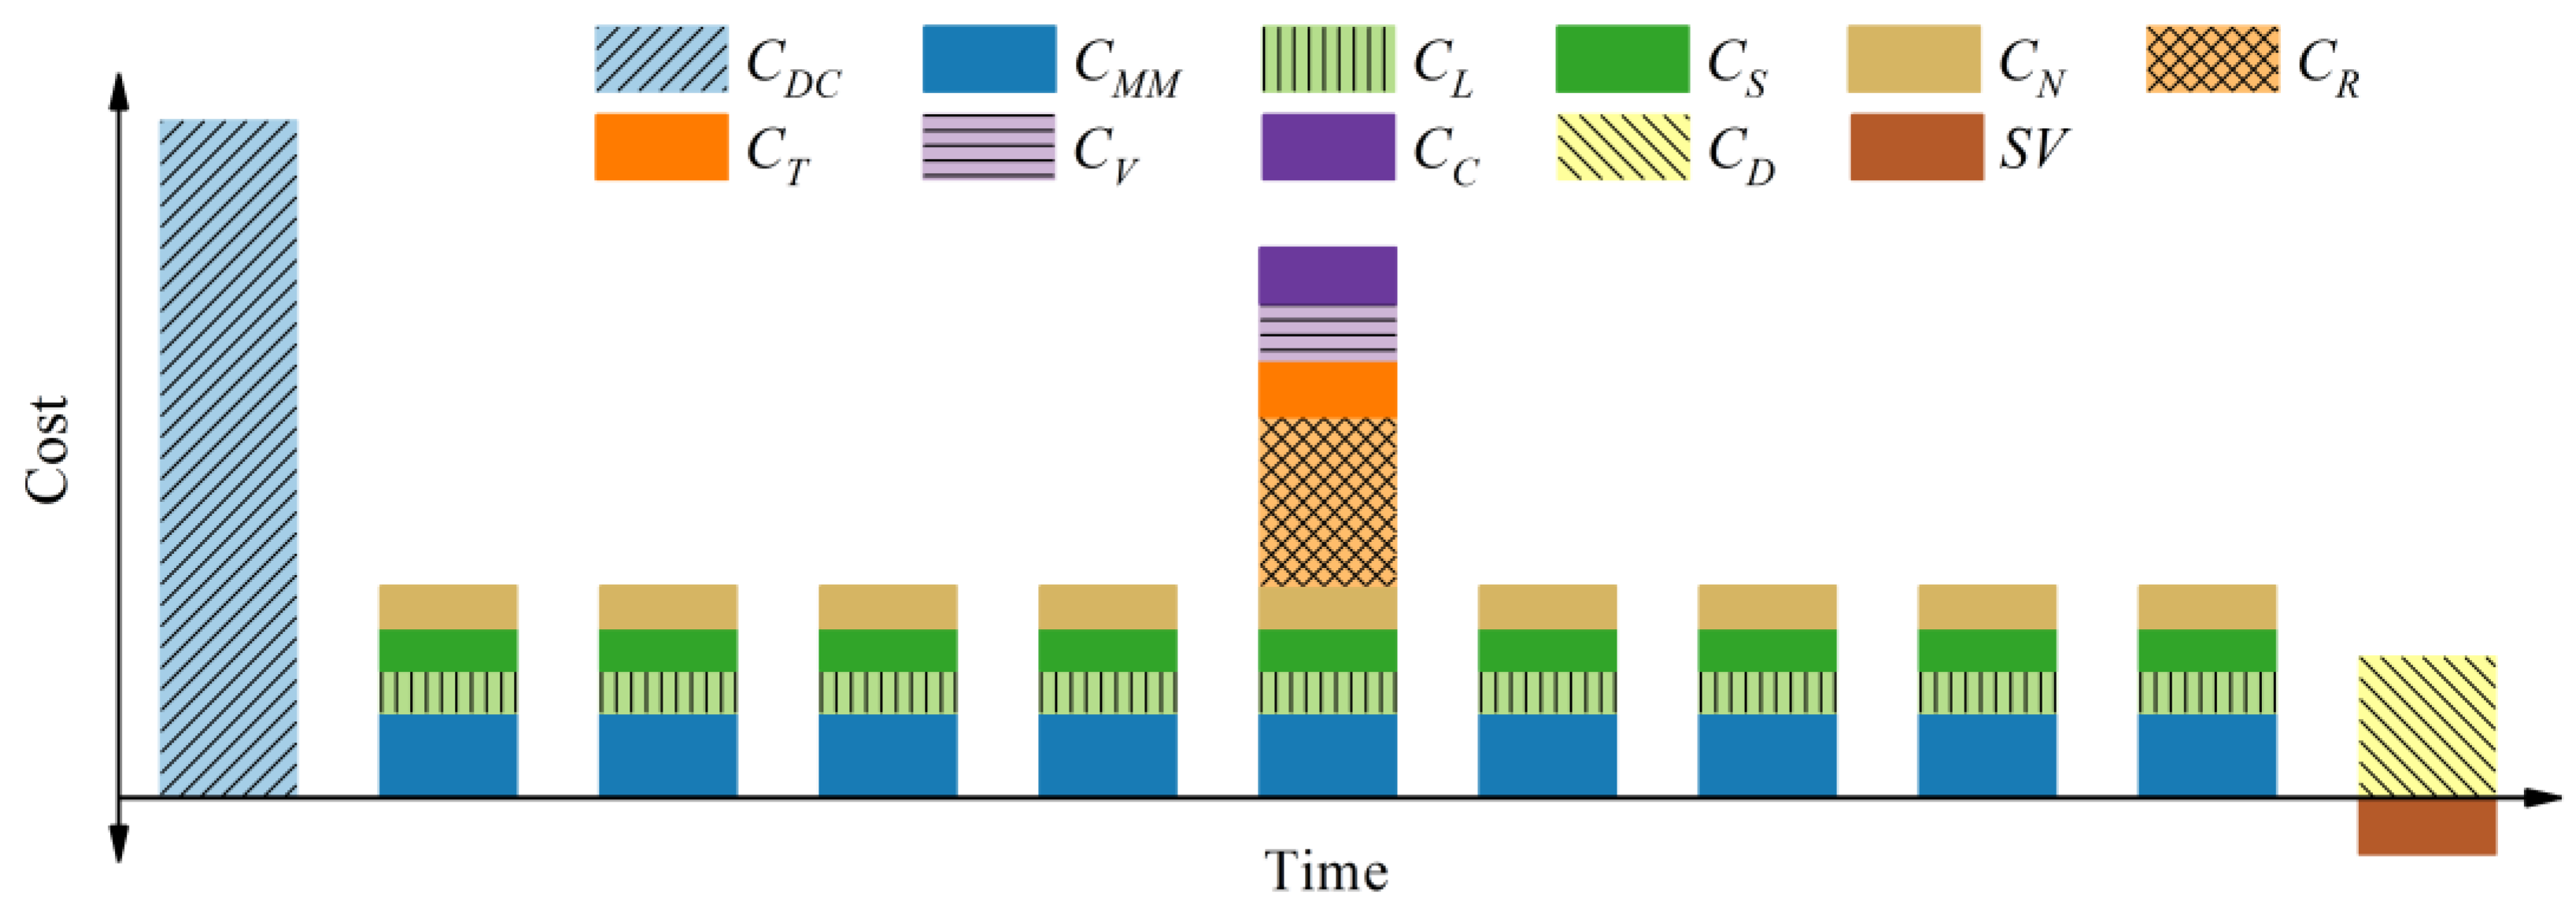
2.2. Life-Cycle Cost Calculation Model
- PV: Present value of cost;
- FV: Future value of cost at time n;
- n: Number of periods (generally years) between the present and future times;
- I: Discount rate, which can be calculated by Equation (2) [22]:
- : Interest rate;
- : Inflation rate.
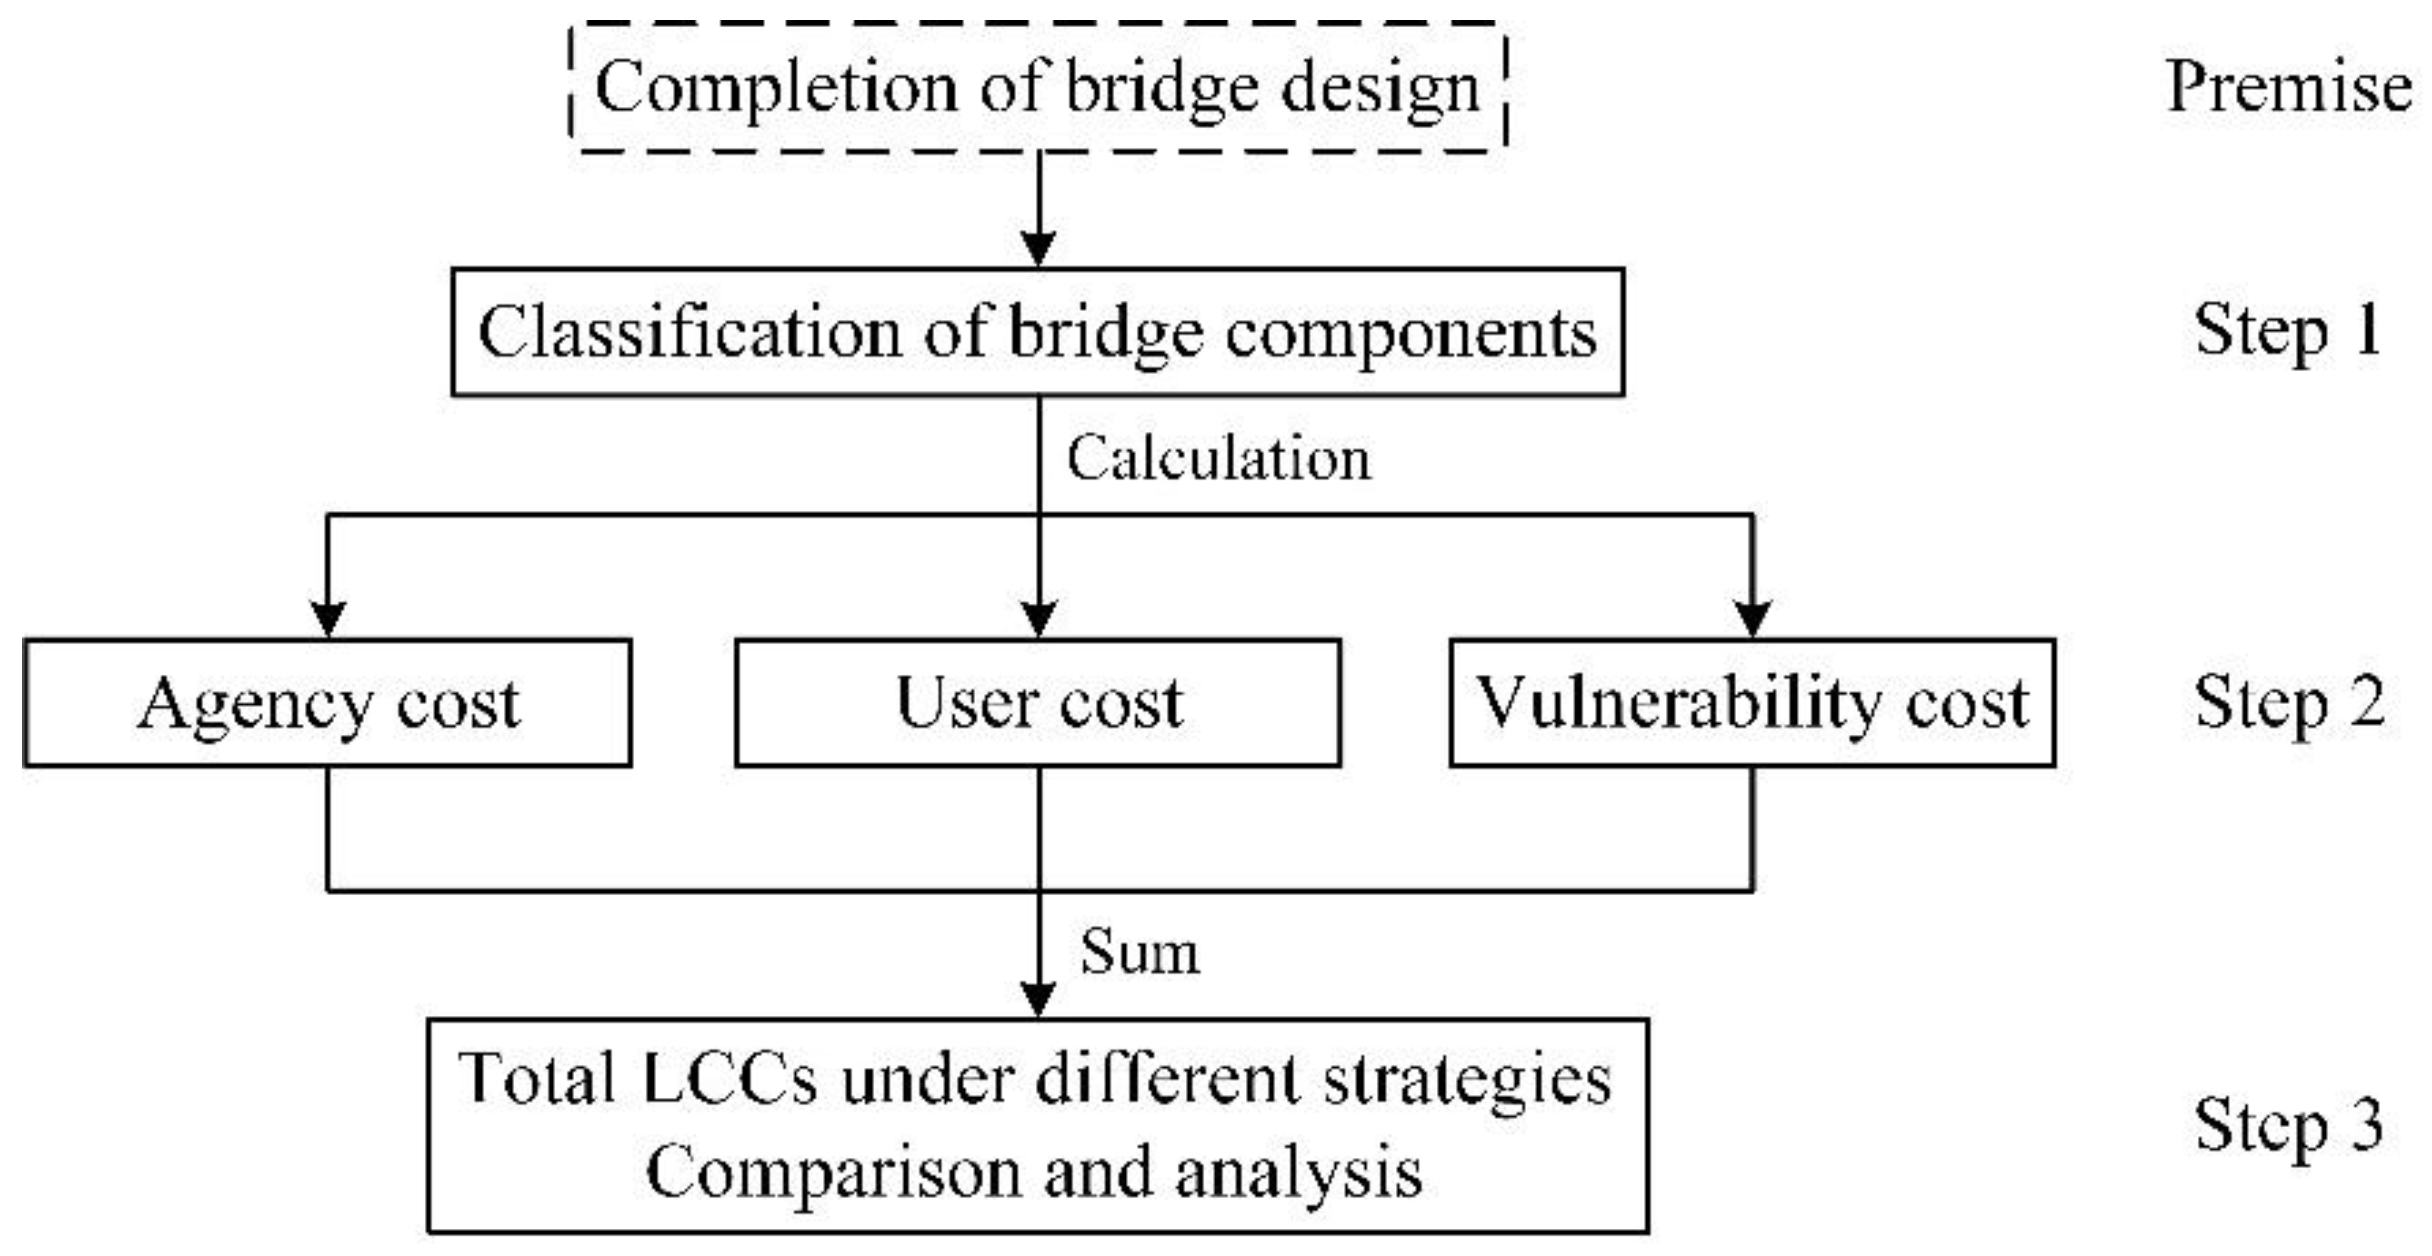
2.3. Process of Life-Cycle Cost Analysis
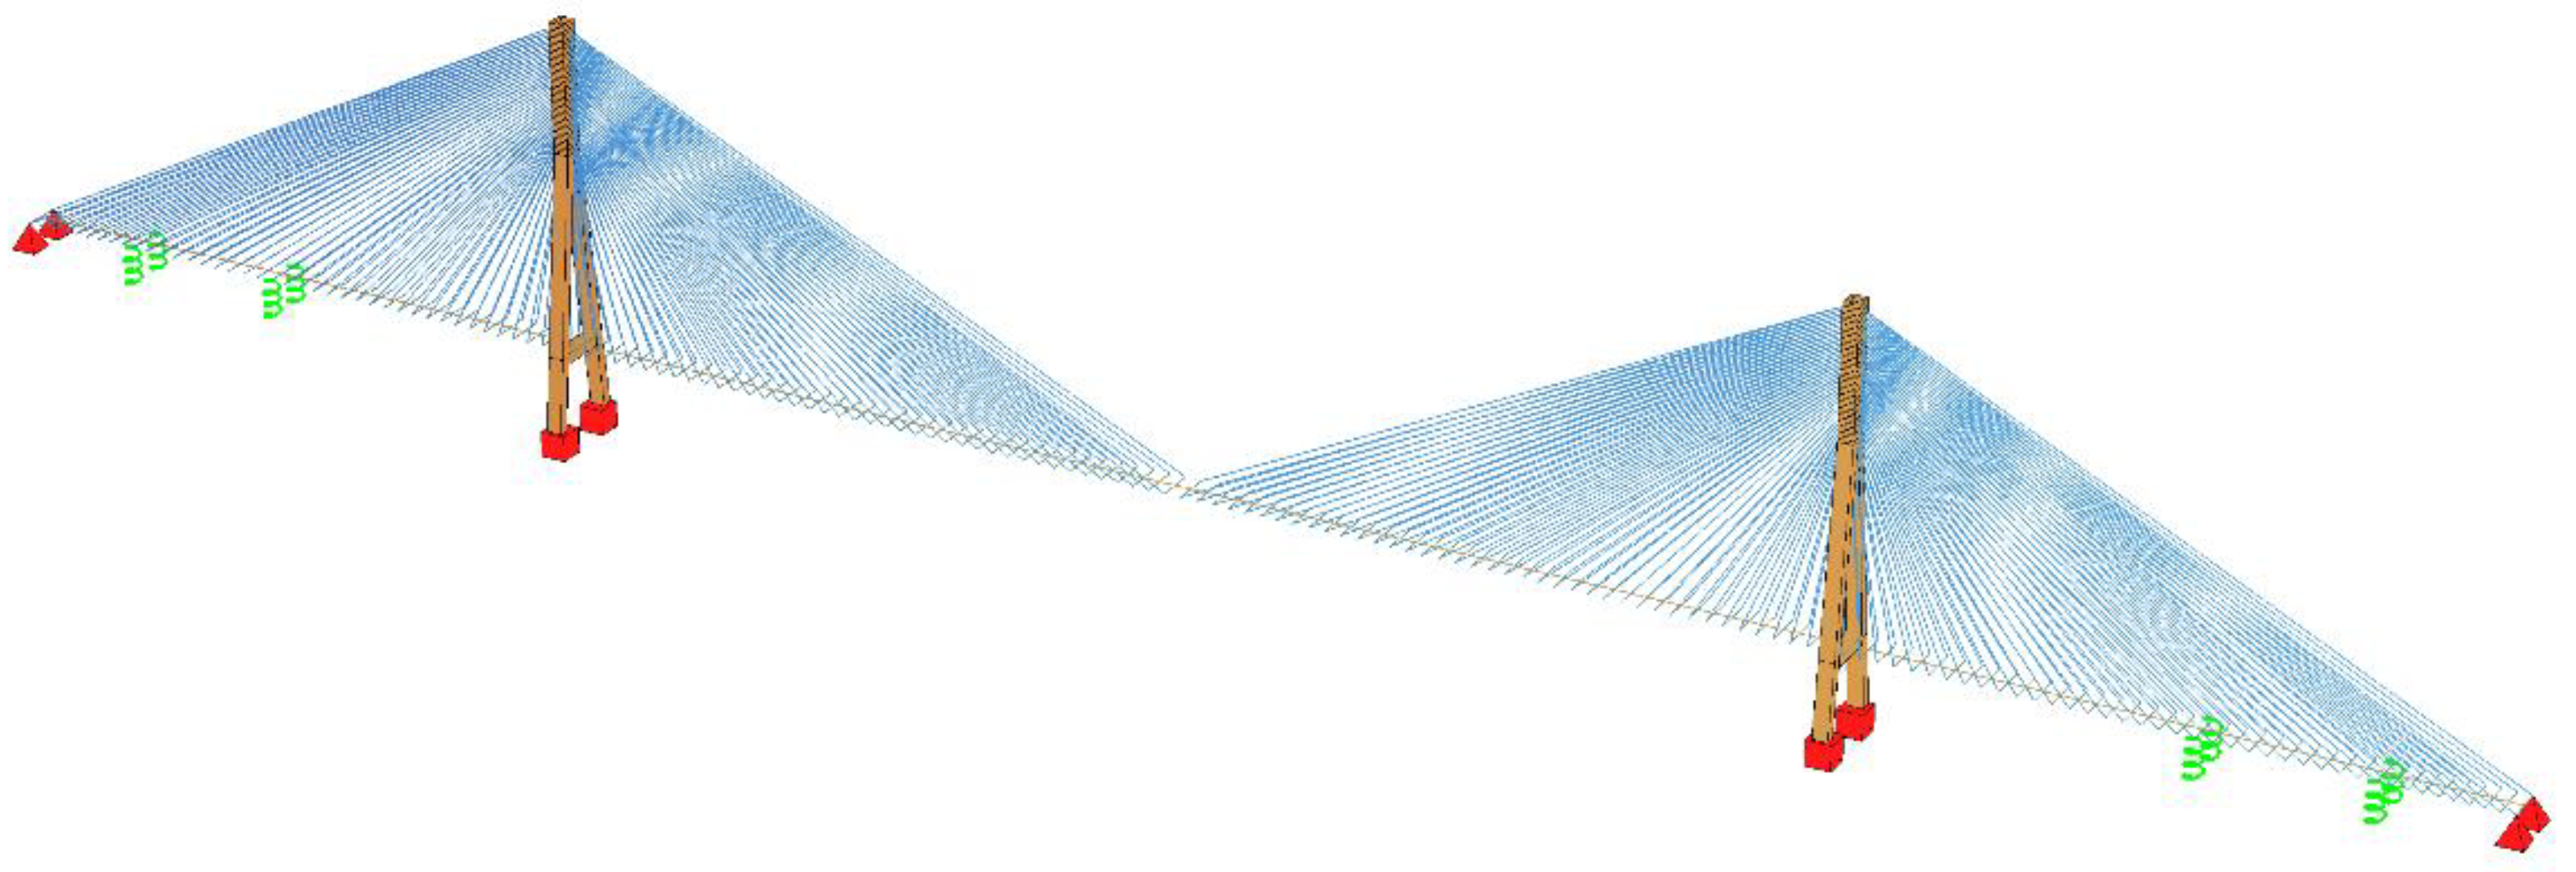
3. Design of Cable-Stayed Bridges
3.1. Design Conditions
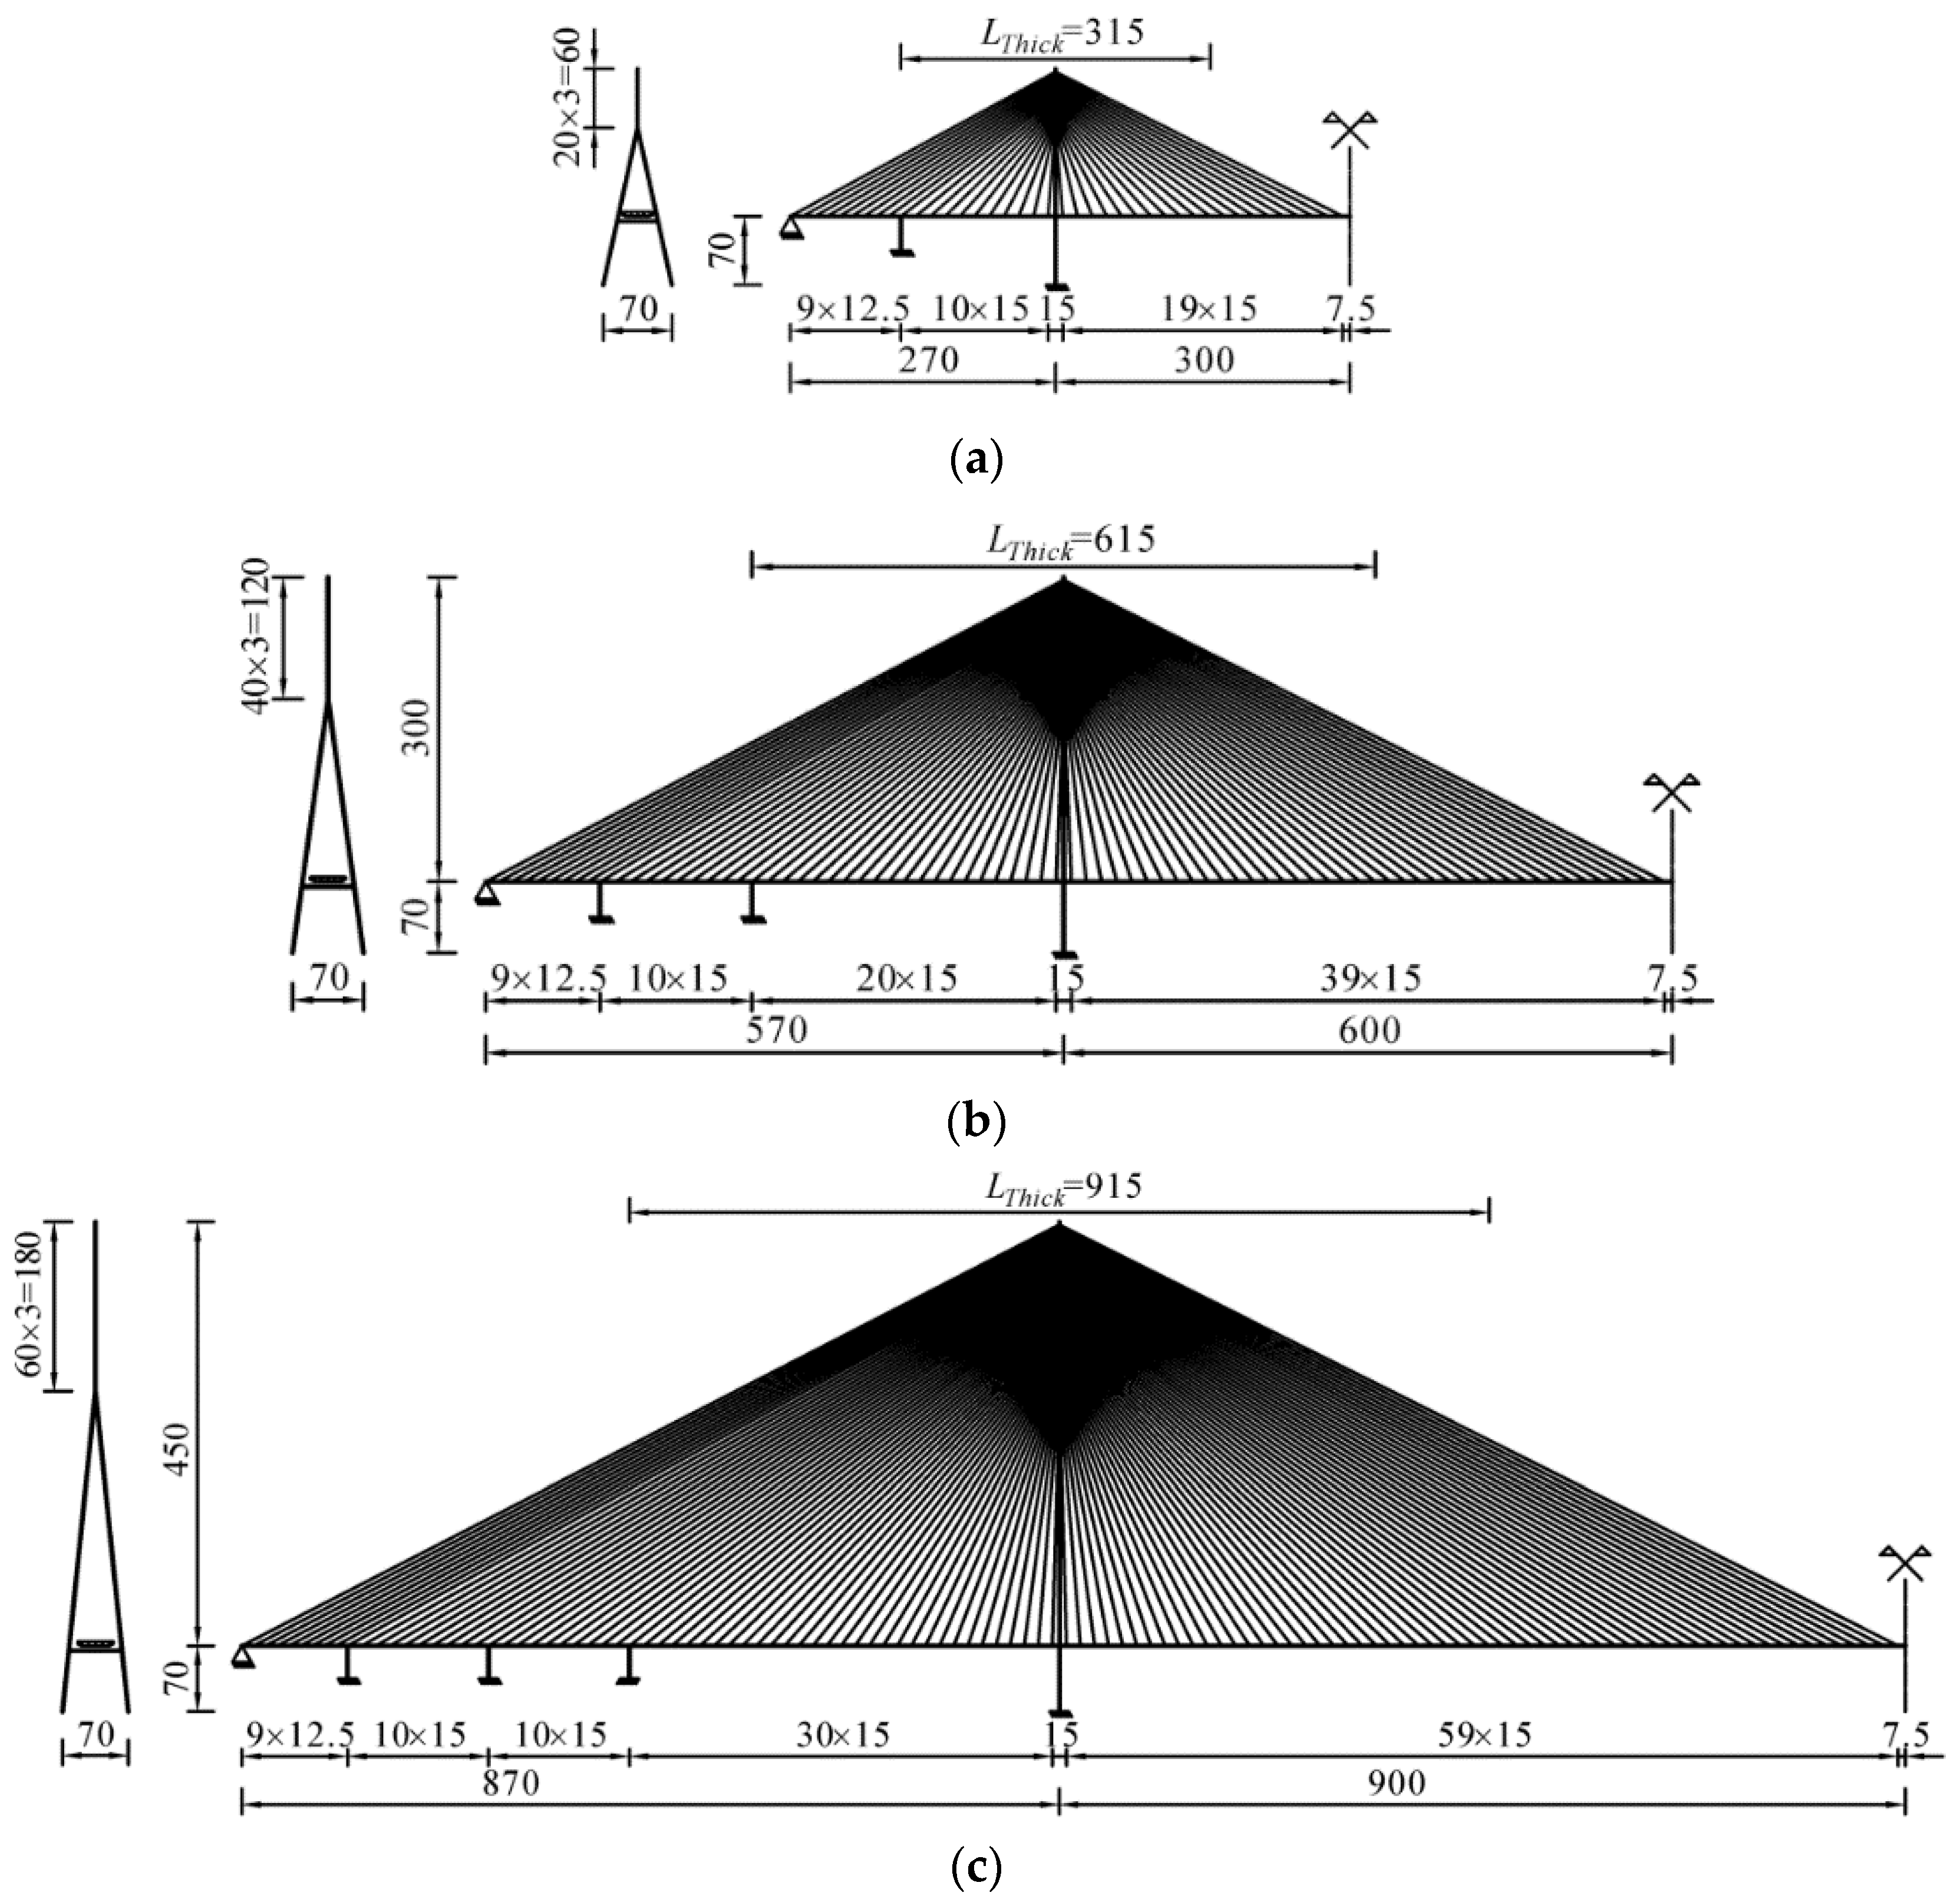
3.1.1. Bridge Location and Geometries
3.1.2. Properties of Materials Used
3.1.3. Design Loads and Load Combinations
3.2. Design Results
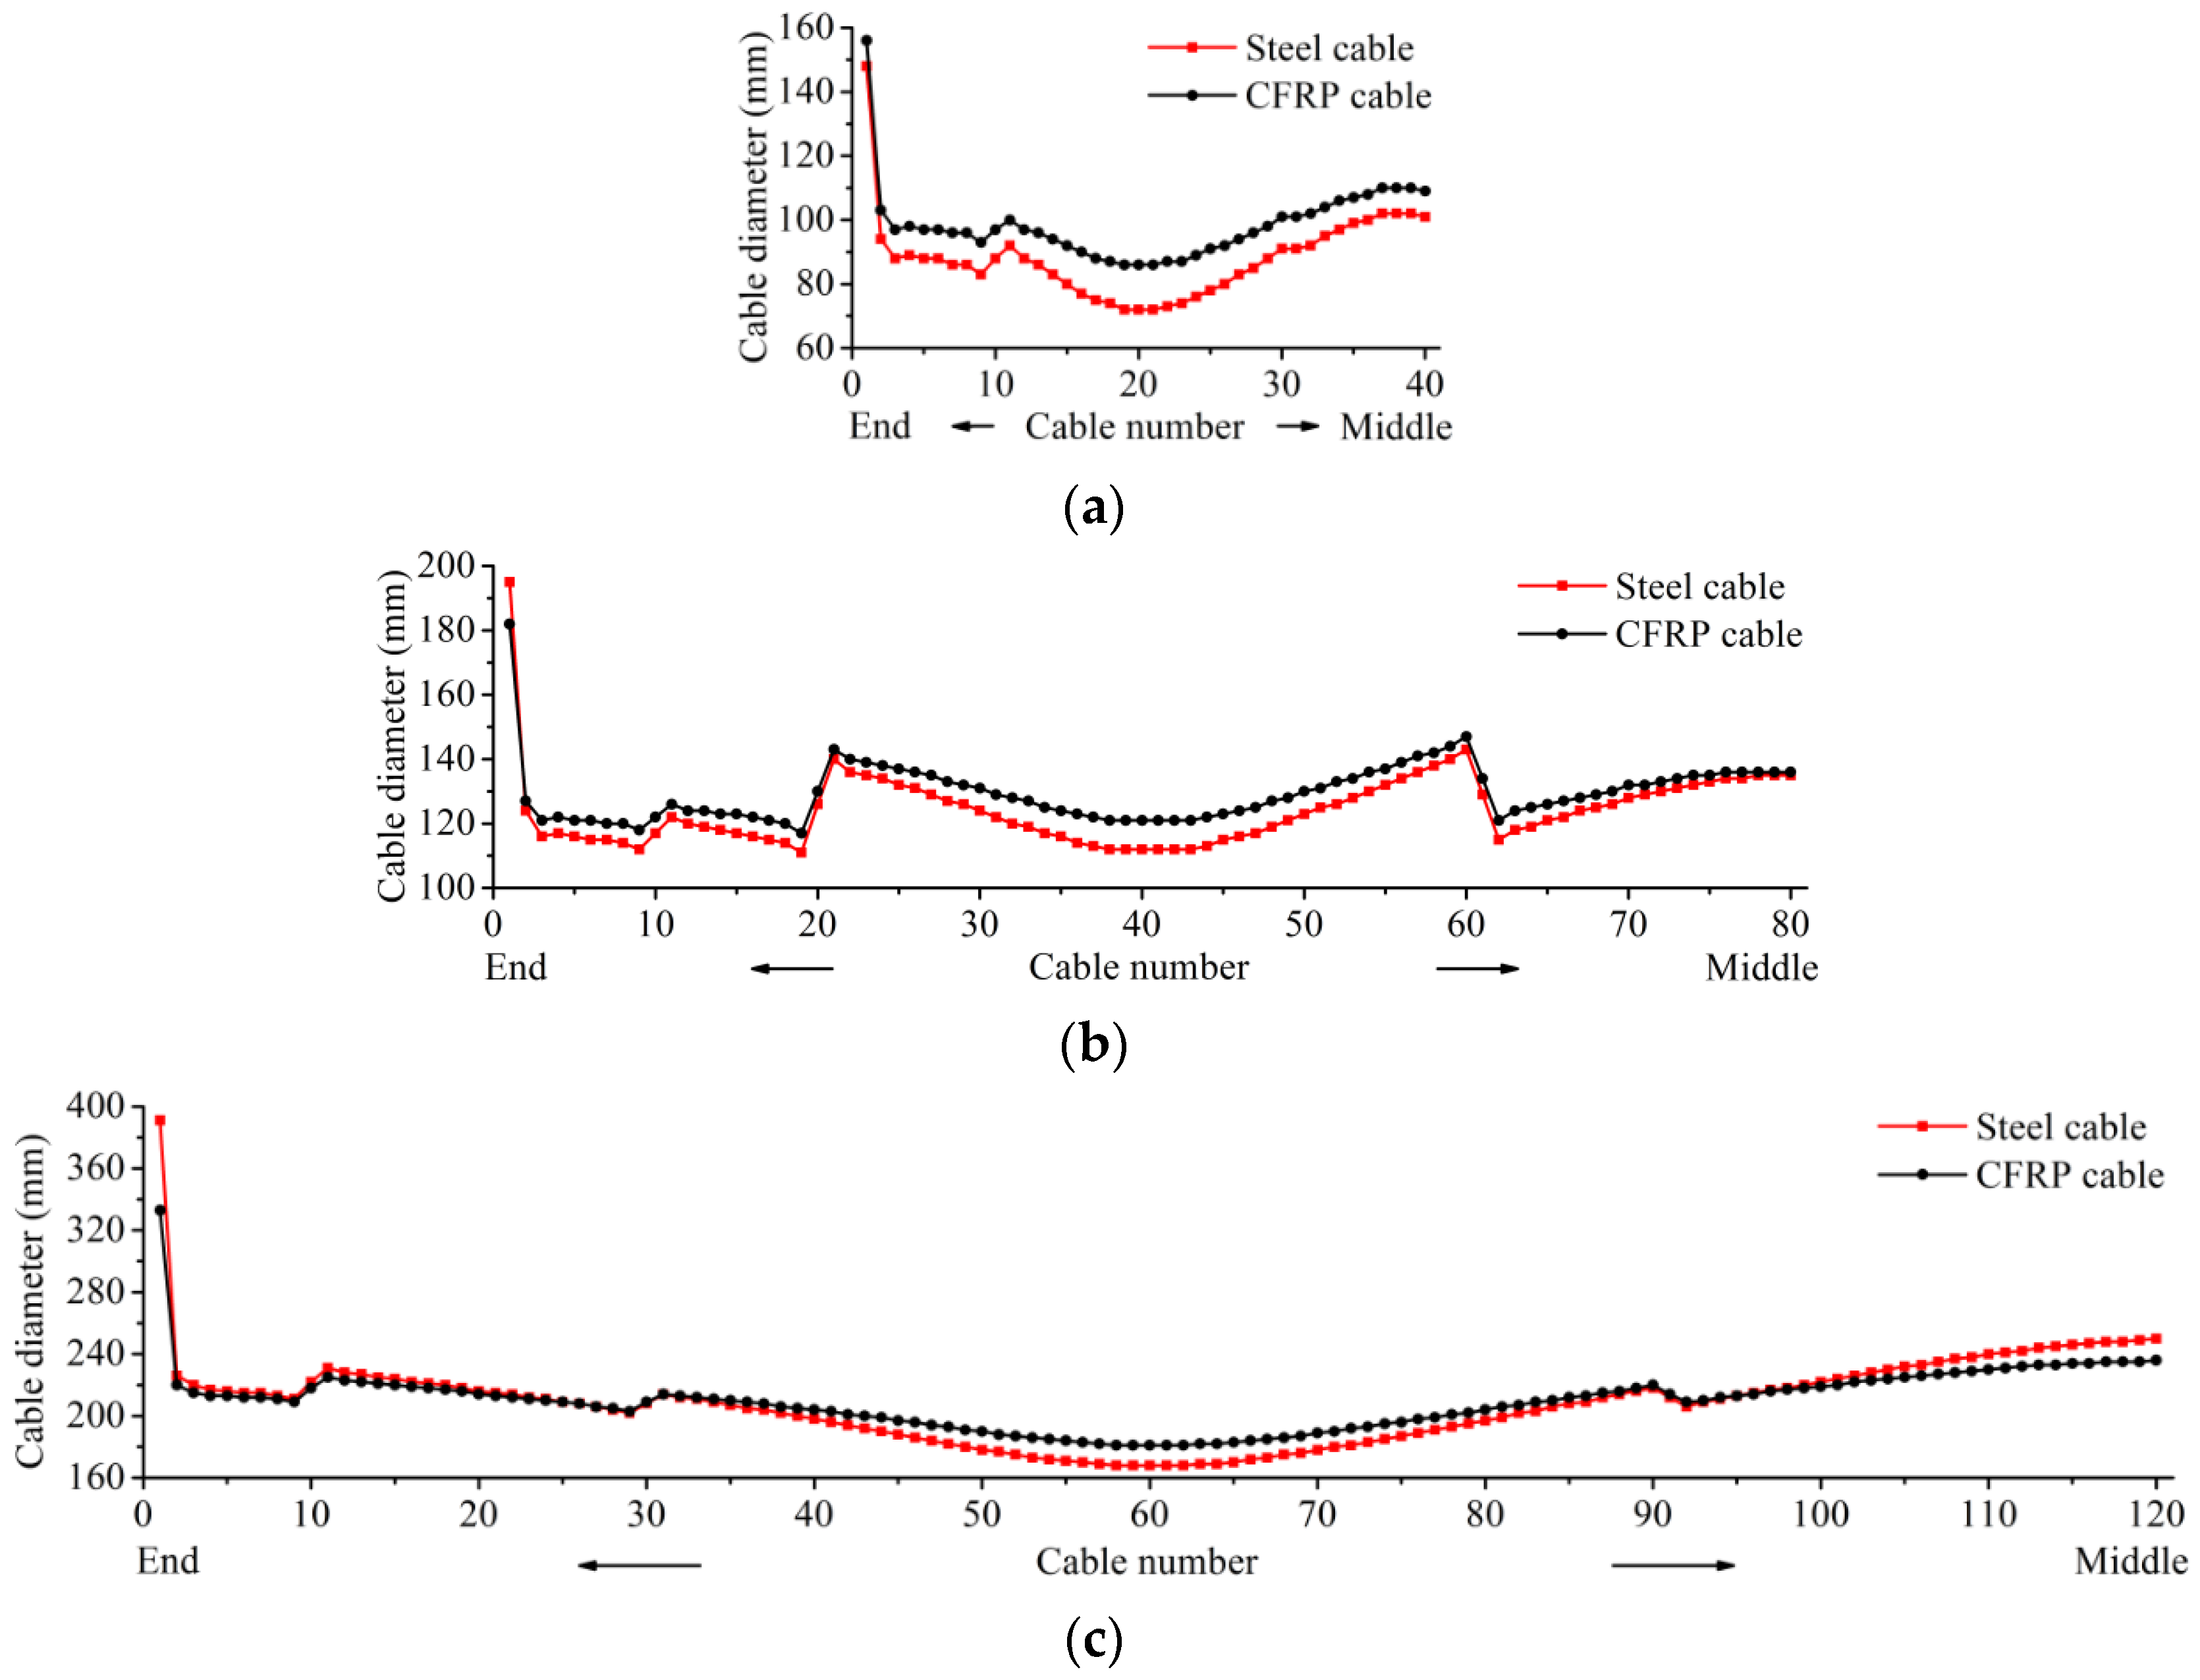
3.2.1. Stay Cables
3.2.2. Pylons, Girders, and Substructures
3.2.3. Auxiliary Facilities and Materials
4. Life-Cycle Cost Analysis (LCCA)
4.1. Classification of Bridge Components
4.2. Calculation of Various Life-Cycle Costs
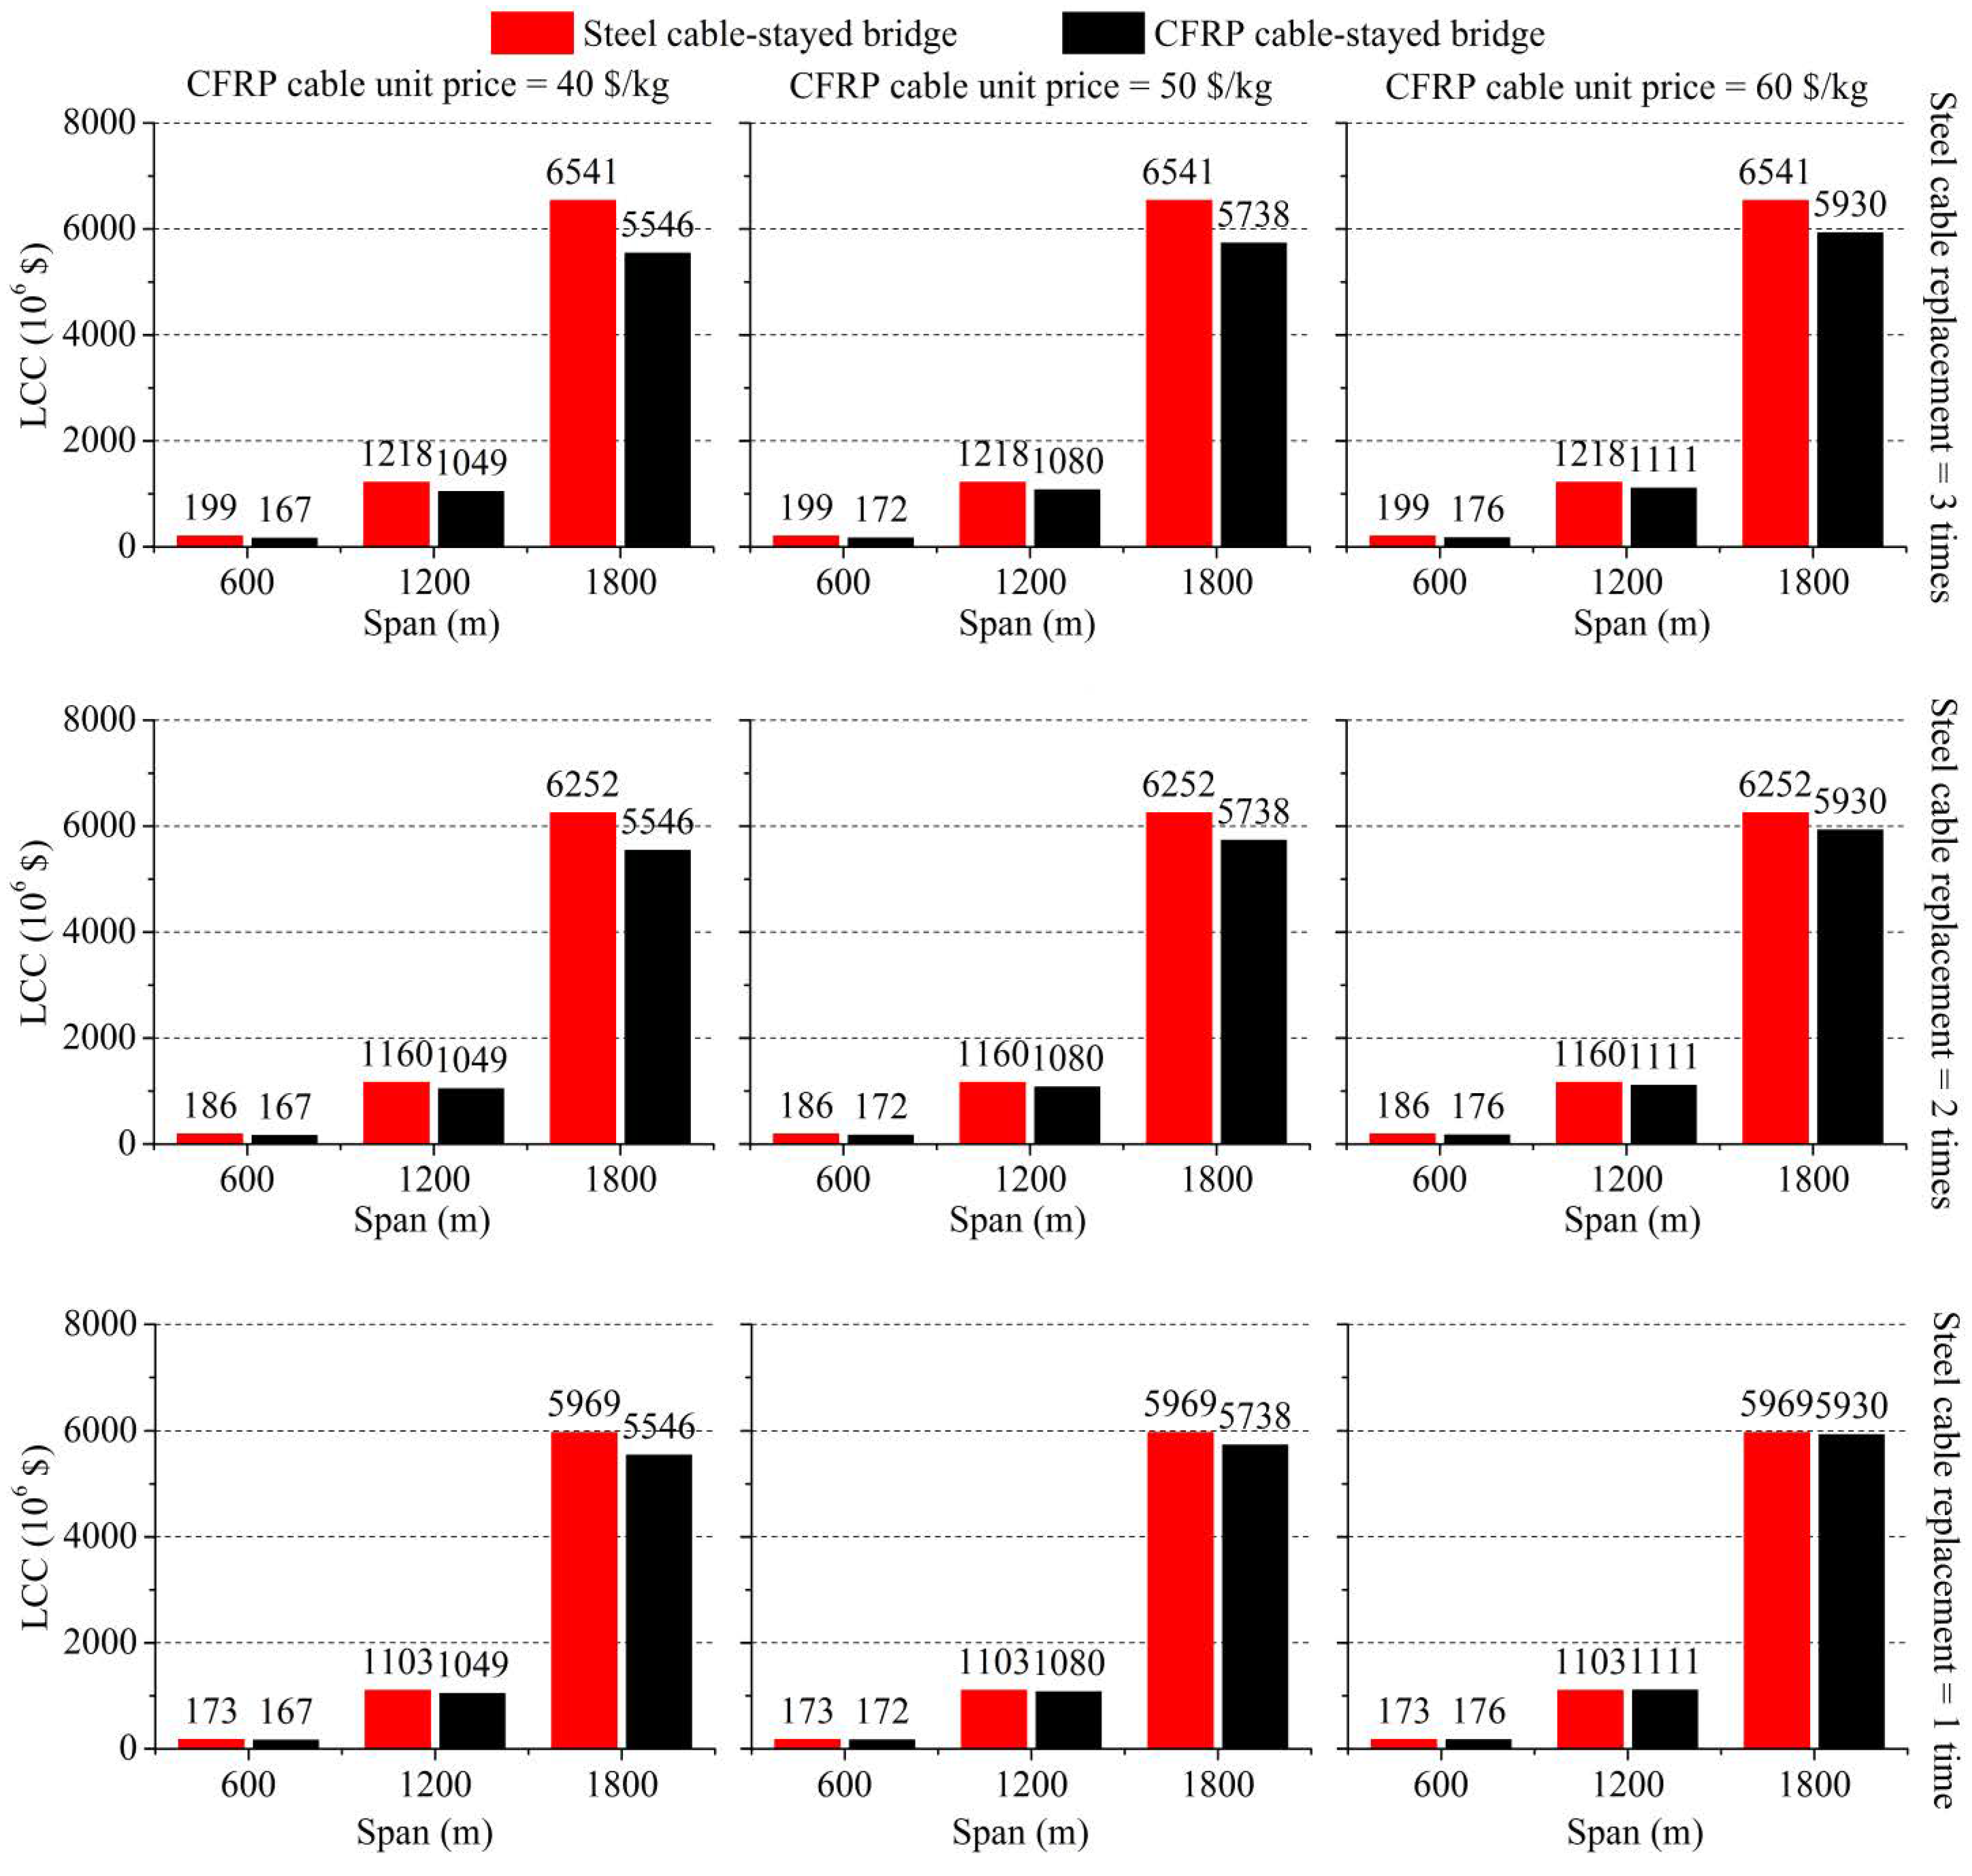
4.3. Results and Discussion
5. Conclusions
- If the main span of the cable-stayed bridge is long enough, the equivalent elastic moduli of CFRP cables become greater than those of steel cables, which enables substituting CFRP cables for steel cables to save the cable material, even though the elastic modulus of the CFRP cable is smaller than that of the steel cable.
- Although using CFRP cables can reduce the material used for the pylons and substructures, and may also save the cable material, the initial design and construction cost (CDC) of the long-span CFRP cable-stayed bridge is still higher than that of the corresponding steel cable-stayed bridge, primarily because the unit price of the CFRP cable is significantly higher than that of the steel cable.
- The LCC of either steel or CFRP cable-stayed bridges increases rapidly with the increase in the length of the main span. In the total LCC, the CDC is always the main part. Furthermore, the longer the main span, the greater the proportion of CDC will be.
- Despite the higher CDC, the long-span CFRP cable-stayed bridge can still achieve lower LCC than that of the long-span steel cable-stayed bridge, because it has significantly lower rehabilitation cost (CR) and user cost (UC), as well as slightly lower vulnerability cost (VC).
- With the increase in the length of main span and the decrease in the unit price of CFRP cables, the life-cycle cost advantage of the long-span CFRP cable-stayed bridges becomes more obvious. Decreasing the replacement frequency of steel cables can considerably reduce the LCC of long-span steel cable-stayed bridges, but still cannot eliminate the cost advantage of the CFRP.
Author Contributions
Funding
Institutional Review Board Statement
Informed Consent Statement
Data Availability Statement
Acknowledgments
Conflicts of Interest
References
- Liu, Y.; Zwingmann, B.; Schlaich, M. Carbon Fiber Reinforced Polymer for Cable Structures—A Review. Polymers 2015, 7, 2078–2099. [Google Scholar] [CrossRef] [Green Version]
- May, R. Building Knowledge, Constructing Histories; CRC Press: Boca Raton, FL, USA, 2018; p. 913. [Google Scholar]
- Bannazadeh, B.; Zomorodian, Z.S.; Maghareh, M.R. A Study on Cable-Stayed Bridges. Appl. Mech. Mater. 2012, 193-194, 1113–1118. [Google Scholar] [CrossRef]
- Hamilton, H.; Breen, J.; Frank, K. Investigation of Corrosion Protection Systems for Bridge Stay Cables; The University of Texas at Austin: Austin, TX, USA, 1995. [Google Scholar] [CrossRef]
- Watson, S.C.; Stafford, D. Cables in trouble. Civ. Eng. 1988, 58, 38. [Google Scholar]
- Otaola, J. Replacing Corroded Cables on a Cable-Stayed Bridge. Civ. Eng. ASCE 1982, 52, 78. [Google Scholar]
- Tabatabai, H. Inspection and Maintenance of Bridge Stay Cable Systems; The National Academies Press: Washington, DC, USA, 2005. [Google Scholar]
- Liu, Y.; Tafsirojjaman, T.; Dogar, A.U.R.; Hückler, A. Shrinkage behavior enhancement of infra-lightweight concrete through FRP grid reinforcement and development of their shrinkage prediction models. Constr. Build. Mater. 2020, 258, 119649. [Google Scholar] [CrossRef]
- Liu, Y.; Tafsirojjaman, T.; Dogar, A.U.R.; Hückler, A. Bond behaviour improvement between infra-lightweight and high strength concretes using FRP grid reinforcements and development of bond strength prediction models. Constr. Build. Mater. 2020, 270, 121426. [Google Scholar] [CrossRef]
- Meier, U. Carbon fiber-reinforced polymers: Modern materials in bridge engineering. Struct. Eng. Int. 1992, 2, 7. [Google Scholar] [CrossRef]
- Benmokrane, B.; Ali, A.H.; Mohamed, H.M.; Robert, M.; Elsafty, A. Durability Performance and Service Life of CFCC Tendons Exposed to Elevated Temperature and Alkaline Environment. J. Compos. Constr. 2016, 20, 04015043. [Google Scholar] [CrossRef]
- Feng, B.; Wang, X.; Wu, Z. Static and Fatigue Behavior of Multitendon CFRP Cables with Integrated Anchorages. J. Compos. Constr. 2019, 23, 04019051. [Google Scholar] [CrossRef]
- Meier, U. Proposal for a Carbon Fibre Reinforced Composite Bridge across the Strait of Gibraltar at its Narrowest Site. Proc. Inst. Mech. Eng. Part B Manag. Eng. Manuf. 1987, 201, 73–78. [Google Scholar] [CrossRef]
- Karbhari, V.M. Use of Composite Materials in Civil Infrastructure in Japan; International Technology Research Institute, World Technology Division: Baltimore, MA, USA, 1998. [Google Scholar]
- Liu, Y. Carbon Fibre Reinforced Polymer (CFRP) Cables for Orthogonally Loaded Cable Structures. Advant. Feasibility Struct. Eng. Int. 2016, 26, 96. [Google Scholar]
- Mohammadi, J.; Guralnick, S.A.; Yan, L. Incorporating Life-Cycle Costs in Highway-Bridge Planning and Design. J. Transp. Eng. 1995, 121, 417–424. [Google Scholar] [CrossRef]
- Chang, S.E.; Shinozuka, M. Life-Cycle Cost Analysis with Natural Hazard Risk. J. Infrastruct. Syst. 1996, 2, 118–126. [Google Scholar] [CrossRef]
- Stewart, M.G.; Safety, S. Reliability-based assessment of ageing bridges using risk ranking and life cycle cost decision analyses. Reliab. Eng. 2001, 74, 263. [Google Scholar] [CrossRef]
- Hawk, H. Bridge Life-Cycle Cost Analysis (BLCCA). Report 483. National Cooperative Highway Research Program (NCHRP), National Research Council (NRC); Transportation Research Board (TRB): Washington, DC, USA, 2003. [Google Scholar]
- Kendall, A.; Keoleian, G.A.; Helfand, G.E. Integrated Life-Cycle Assessment and Life-Cycle Cost Analysis Model for Concrete Bridge Deck Applications. J. Infrastruct. Syst. 2008, 14, 214–222. [Google Scholar] [CrossRef]
- Balafas, I.; Burgoyne, C. Economic viability of structures with FRP reinforcement and prestress. Can. Soc. Civ. Eng. 2004, 15, 195. [Google Scholar]
- Grace, N.F.; Jensen, E.A.; Eamon, C.D.; Shi, X. Life-Cycle Cost Analysis of Carbon Fiber-Reinforced Polymer Reinforced Concrete Bridges. ACI Struct. J. 2012, 109, 697–704. [Google Scholar]
- Meiarashi, S.; Nishizaki, I.; Kishima, T. Life-Cycle Cost of All-Composite Suspension Bridge. J. Compos. Constr. 2002, 6, 206–214. [Google Scholar] [CrossRef]
- Dhillon, B. Life Cycle Costing for Engineers; CRC Press: Boca Raton, FL, USA, 2009. [Google Scholar]
- Blanchard, B.S. Design and Manage to Life Cycle Cost; Dilithium Press: Beaverton, OR, USA, 1978. [Google Scholar]
- Miao, J. Research on Design Theory of Super Long-Span Cable-Stayed Bridge; Tongji University: Tianjin, China, 2006. [Google Scholar]
- M.o.C.o.t.P.s.R.o. China. Code for Design of Steel Structures; GB 50017-2003; China Planning Press: Beijing, China, 2003. [Google Scholar]
- Walther, R. Cable Stayed Bridges; Thomas Telford: London, UK, 1999. [Google Scholar]
- M.o.C.o.t.P.s.R.o. China. Code for Design of Concrete Structures; China Construction Industry Press: Beijing, China, 2010. [Google Scholar]
- M.o.T.o.t.P.s.R.o. China. General Specifications for Design of Highway Bridges and Culverts; China Communications Press: Beijing, China, 2015. [Google Scholar]
- Fu-you, X.; Ai-rong, C.E.M. 3-D flutter analysis of Sutong bridge. Eng. Mech. 2008, 25, 139. [Google Scholar]
- M.o.T.o.t.P.s.R.o. China. Guidelines for Deisgn of Highway Cable-Stayed Bridge; China Communications Press: Beijing, China, 2007. [Google Scholar]
- SOFiSTiK, A. SOFiSTiK Analysis Programs Version 2012; SOFiSTiK AG: Oberschleißheim, Germany, 2012. [Google Scholar]
- Gazzola, F. Mathematical Models for Suspension Bridges; Springer: Berlin/Heidelberg, Germany, 2015. [Google Scholar]
- Hu, J.; Liu, Y.; Guo, L. Research on Bridge Life-Cycle Cost model; Beijing University of Technology: Beijing, China, 2009. [Google Scholar]
- Pimenta, S.; Pinho, S. Recycling carbon fibre reinforced polymers for structural applications: Technology review and market outlook. Waste Manag. 2011, 31, 378–392. [Google Scholar] [CrossRef] [Green Version]
- Ehlen, M.A. Life-Cycle Costs of Fiber-Reinforced-Polymer Bridge Decks. J. Mater. Civ. Eng. 1999, 11, 224–230. [Google Scholar] [CrossRef]


| Category | Definition | Item | Description |
|---|---|---|---|
| Agency cost (AC) | The cost incurred by an agency responsible for bridge management | Design and construction cost CDC | Cost of materials, equipment, and human resources related to the design and construction |
| Maintenance and management cost CMM | Cost including all structural maintenance fees, detection fees, and bridge operating expenses | ||
| Rehabilitation cost CR | The cost associated with the replacement of bridge components | ||
| Demolition cost CD | The cost associated with the demolition and removal of a bridge | ||
| Salvage value SV | The residual value of a bridge at the end of the bridge’s life | ||
| User cost (UC) | Cost borne by bridge users | Travel time cost CT | Cost related to the additional time that drivers spend in traffic when bridge rehabilitation is taking place |
| Vehicle operating cost CV | Cost based on the additional time that vehicles spend in traffic when bridge rehabilitation is taking place | ||
| Crash cost CC | Accident costs cause by the higher probability of traffic accidents during the bridge rehabilitation | ||
| Vulnerability cost (VC) | The cost associated with risks of rare and extreme events | Load-related damage cost CL | Cost related to the incidental structural damage attributable to external loads |
| Severe traffic accident damage cost CS | Cost related to the structural damage due to incidental severe traffic accidents | ||
| Natural hazard damage cost CN | Cost related to the structural damage caused by incidental natural hazards, such as earthquakes |
| Material Type | Density (kg/m3) | Strength (MPa) | Elastic Modulus (GPa) | Unit Price (USD/kg) |
|---|---|---|---|---|
| CFRP cable | 1600 | 2500 | 160 | 40, 50 or 60 |
| Steel cable | 7850 | 1770 | 196 | 5 |
| Structural steel | 7850 | 345 | 210 | 1.5 |
| Reinforcing steel | 7850 | 235 | 210 | 0.75 |
| Concrete | 2500 | 30 | 30 | 0.02 |
| Main Span | 600 m | 1200 m | 1800 m | |||
|---|---|---|---|---|---|---|
| Cable Material | Steel | CFRP | Steel | CFRP | Steel | CFRP |
| Amount of cables (m3) | 211 | 257 | 1578 | 1686 | 10,653 | 10,395 |
| Weight of cables (t) | 1661 | 411 | 12,390 | 2698 | 83,627 | 16,633 |
| Material cost (USD 106) * | 8.30 | 20.55 | 61.95 | 134.91 | 418.14 | 831.63 |
| Main Span | 600 m | 1200 m | 1800 m | |||
|---|---|---|---|---|---|---|
| Cable Material | Steel | CFRP | Steel | CFRP | Steel | CFRP |
| Amount of cables (m3) | 2841 | 2647 | 22,630 | 20,252 | 139,467 | 121,715 |
| Material cost (USD 106) | 33.45 | 31.17 | 266.47 | 238.47 | 1642.22 | 1433.19 |
| Main Span | 600 m | 1200 m | 1800 m | |||
|---|---|---|---|---|---|---|
| Cable Material | Steel | CFRP | Steel | CFRP | Steel | CFRP |
| Amount of cables (m3) | 2165 | 2165 | 13,829 | 13,829 | 64,653 | 64,653 |
| Material cost (USD 106) | 25.49 | 25.49 | 162.83 | 162.83 | 761.29 | 761.29 |
| Main Span | 600 m | 1200 m | 1800 m | |||
|---|---|---|---|---|---|---|
| Cable Material | Steel | CFRP | Steel | CFRP | Steel | CFRP |
| Amount of cables (m3) | 119,700 | 115,800 | 244,600 | 226,400 | 790,300 | 689,800 |
| Amount of steel (m3) | 600 | 579 | 1223 | 1132 | 3952 | 3449 |
| Material cost (USD 106) | 9.52 | 9.20 | 97.15 | 89.92 | 565.04 | 493.16 |
| Main Span | 600 m | 1200 m | 1800 m |
|---|---|---|---|
| Bearings | 0.32 | 0.72 | 1.28 |
| Extension joints | 0.0036 | 0.0054 | 0.0072 |
| Dampers | 0.30 | 0.60 | 0.90 |
| Windbreaks | 0.10 | 0.20 | 0.30 |
| Deck pavements | 1.64 | 3.37 | 5.10 |
| Railings | 0.023 | 0.046 | 0.069 |
| Paint coatings * | 0.38 | 0.90 | 1.52 |
| Other facilities | 0.20 | 0.40 | 0.60 |
| Component Name | Component Type | Service Life (Years) | Replacement Times |
|---|---|---|---|
| Steel cable * | Replaceable | 25, 33.3 or 50 | 3, 2 or 1 |
| CFRP cable | Unreplaceable | 100 | - |
| Pylon | Unreplaceable | 100 | - |
| Girder | Unreplaceable | 100 | - |
| Bearing | Replaceable | 25 | 3 |
| Extension joint | Replaceable | 20 | 4 |
| Damper | Replaceable | 25 | 3 |
| Windbreaks | Replaceable | 20 | 4 |
| Deck pavement | Replaceable | 20 | 4 |
| Railing | Replaceable | 50 | 1 |
| Paint coatings | Replaceable | 20 | 4 |
| Other facilities | Replaceable | 20 | 4 |
| Main Span | 600 m | 1200 m | 1800 m | |||
|---|---|---|---|---|---|---|
| Cable Material | Steel | CFRP | Steel | CFRP | Steel | CFRP |
| L (km) | 4.34 | 4.34 | 5.54 | 5.54 | 6.74 | 6.74 |
| Sr (km/h) | 40 | 40 | 40 | 40 | 40 | 40 |
| Sn (km/h) | 100 | 100 | 100 | 100 | 100 | 100 |
| Ar (%/km) | 2.93/106 | 2.93/106 | 2.93/106 | 2.93/106 | 2.93/106 | 2.93/106 |
| An (%/km) | 1.72/106 | 1.72/106 | 1.72/106 | 1.72/106 | 1.72/106 | 1.72/106 |
| AADT (number/d) | 160,000 | 160,000 | 160,000 | 160,000 | 160,000 | 160,000 |
| N (d) * | 45 or 62 | 2 or 45 | 90 or 123 | 3 or 90 | 135 or 184 | 4 or 135 |
| T (USD) | 11.95 | 11.95 | 11.95 | 11.95 | 11.95 | 11.95 |
| V (USD) | 10.48 | 10.48 | 10.48 | 10.48 | 10.48 | 10.48 |
| C (USD) | 96,800 | 96,800 | 96,800 | 96,800 | 96,800 | 96,800 |
| Main Span | 600 m | 1200 m | 1800 m | |||
|---|---|---|---|---|---|---|
| Cable Material | Steel | CFRP | Steel | CFRP | Steel | CFRP |
| CLi (USD 106), Pi | 0.026, 13.20% | 0.026, 13.20% | 0.052, 13.20% | 0.052, 13.20% | 0.078, 13.20% | 0.078, 13.20% |
| 0.190, 1.50% | 0.190, 1.50% | 0.380, 1.50% | 0.380, 1.50% | 0.569, 1.50% | 0.569, 1.50% | |
| 1.556, 0.15% | 1.556, 0.15% | 3.112, 0.15% | 3.112, 0.15% | 4.668, 0.15% | 4.668, 0.15% | |
| CSj (USD 106), Pj | 0.0013, 5.00% | 0.0013, 5.00% | 0.0013, 10.00% | 0.0013, 10.00% | 0.0013, 15.00% | 0.0013, 15.00% |
| 0.013, 0.50% | 0.013, 0.50% | 0.013, 1.00% | 0.013, 1.00% | 0.013, 1.50% | 0.013, 1.50% | |
| 0.092, 0.05% | 0.092, 0.05% | 0.092, 0.10% | 0.092, 0.10% | 0.092, 0.15% | 0.092, 0.15% | |
| CNk (USD 106), Pk | 0.204, 2.10% | 0. 204, 2.10% | 0.427, 2.10% | 0.427, 2.10% | 0.710, 2.10% | 0.710, 2.10% |
| 0.815, 0.25% | 0.815, 0.25% | 1.707, 0.25% | 1.707, 0.25% | 2.839, 0.25% | 2.839, 0.25% | |
| 45.833, 0.05% | 43.076, 0.05% | 389.088, 0.05% | 351.554, 0.05% | 2360.007, 0.05% | 2059.663, 0.05% | |
| Main Span | 600 m | 1200 m | 1800 m | ||||
|---|---|---|---|---|---|---|---|
| Cable Material | Steel | CFRP | Steel | CFRP | Steel | CFRP | |
| AC | CDC | 112.28 | 121.02 | 841.59 | 865.76 | 4810.58 | 4831.98 |
| CMM | 14.72 | 15.86 | 110.32 | 113.49 | 630.61 | 633.42 | |
| CR | 20.56 | 6.29 | 119.70 | 13.22 | 739.26 | 20.62 | |
| CD | 3.22 | 3.47 | 24.16 | 24.86 | 138.12 | 138.73 | |
| SV | −0.81 | −0.78 | −6.04 | −5.59 | −34.53 | −31.21 | |
| Sum | 149.97 | 145.86 | 1089.73 | 1011.74 | 6284.04 | 5593.54 | |
| UC | CT | 18.78 | 9.61 | 47.76 | 24.35 | 87.04 | 44.32 |
| CV | 16.47 | 8.43 | 41.88 | 21.36 | 76.33 | 38.87 | |
| CC | 12.27 | 6.28 | 31.21 | 15.91 | 56.87 | 28.96 | |
| Sum | 47.52 | 24.32 | 120.85 | 61.62 | 220.24 | 112.15 | |
| VC | CL | 0.38 | 0.38 | 0.75 | 0.75 | 1.13 | 1.13 |
| CS | 0.0077 | 0.0077 | 0.015 | 0.015 | 0.023 | 0.023 | |
| CN | 0.96 | 0.92 | 6.28 | 5.74 | 35.40 | 31.02 | |
| Sum | 1.35 | 1.31 | 7.05 | 6.51 | 36.55 | 32.17 | |
| LCC | 198.84 | 171.49 | 1217.63 | 1079.87 | 6540.83 | 5737.86 | |
Publisher’s Note: MDPI stays neutral with regard to jurisdictional claims in published maps and institutional affiliations. |
© 2022 by the authors. Licensee MDPI, Basel, Switzerland. This article is an open access article distributed under the terms and conditions of the Creative Commons Attribution (CC BY) license (https://creativecommons.org/licenses/by/4.0/).
Share and Cite
Liu, Y.; Gu, M.; Liu, X.; Tafsirojjaman, T. Life-Cycle Cost Analysis of Long-Span CFRP Cable-Stayed Bridges. Polymers 2022, 14, 1740. https://doi.org/10.3390/polym14091740
Liu Y, Gu M, Liu X, Tafsirojjaman T. Life-Cycle Cost Analysis of Long-Span CFRP Cable-Stayed Bridges. Polymers. 2022; 14(9):1740. https://doi.org/10.3390/polym14091740
Chicago/Turabian StyleLiu, Yue, Mingyang Gu, Xiaogang Liu, and T. Tafsirojjaman. 2022. "Life-Cycle Cost Analysis of Long-Span CFRP Cable-Stayed Bridges" Polymers 14, no. 9: 1740. https://doi.org/10.3390/polym14091740
APA StyleLiu, Y., Gu, M., Liu, X., & Tafsirojjaman, T. (2022). Life-Cycle Cost Analysis of Long-Span CFRP Cable-Stayed Bridges. Polymers, 14(9), 1740. https://doi.org/10.3390/polym14091740