
Evaluation of Changes in Polymer Material Properties Due to Aging in Different Environments


Abstract
:
1. Introduction
2. Methods
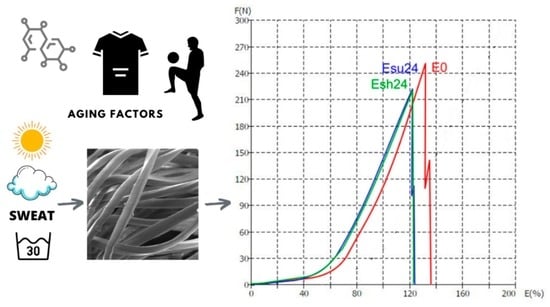
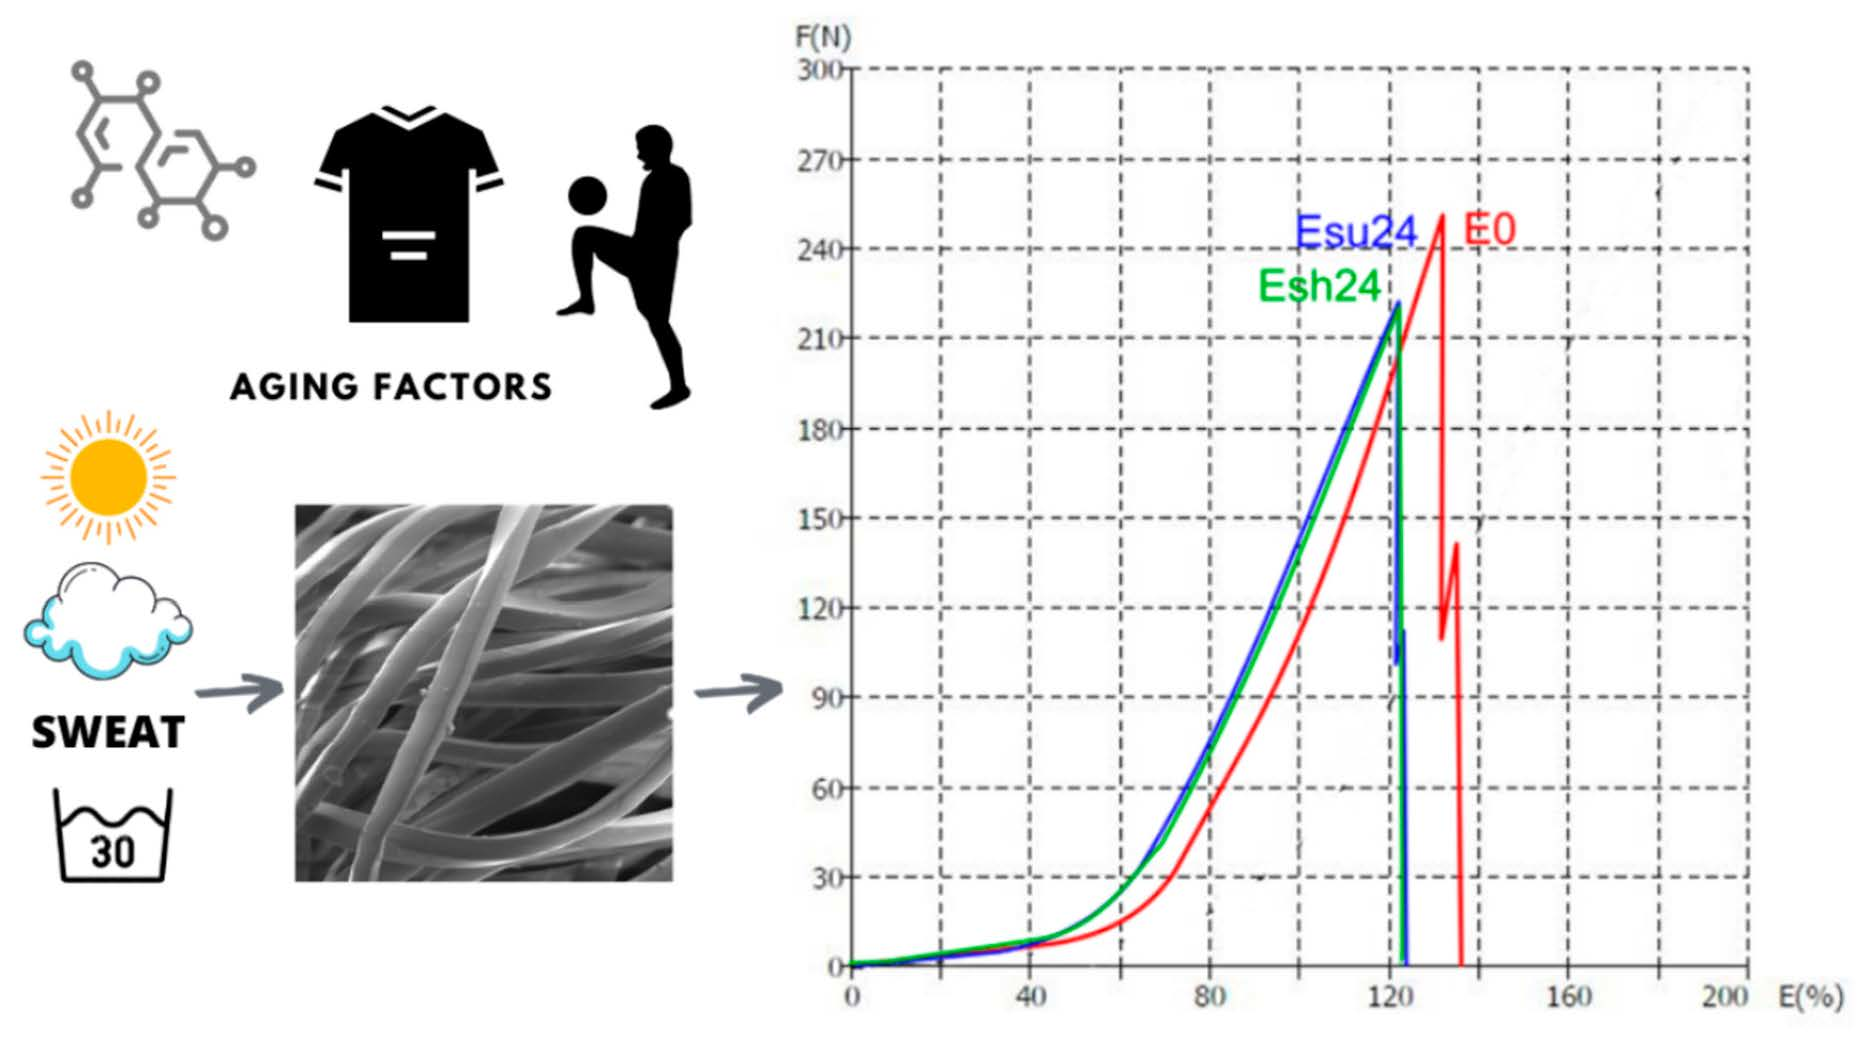
2.1. Aging Protocol
- Selection of the target group;
- Defining training conditions;
- Selection of material samples;
- Defining aging factors;
- Defining the order of aging;
- Selection of test methods.
2.2. Test Methods
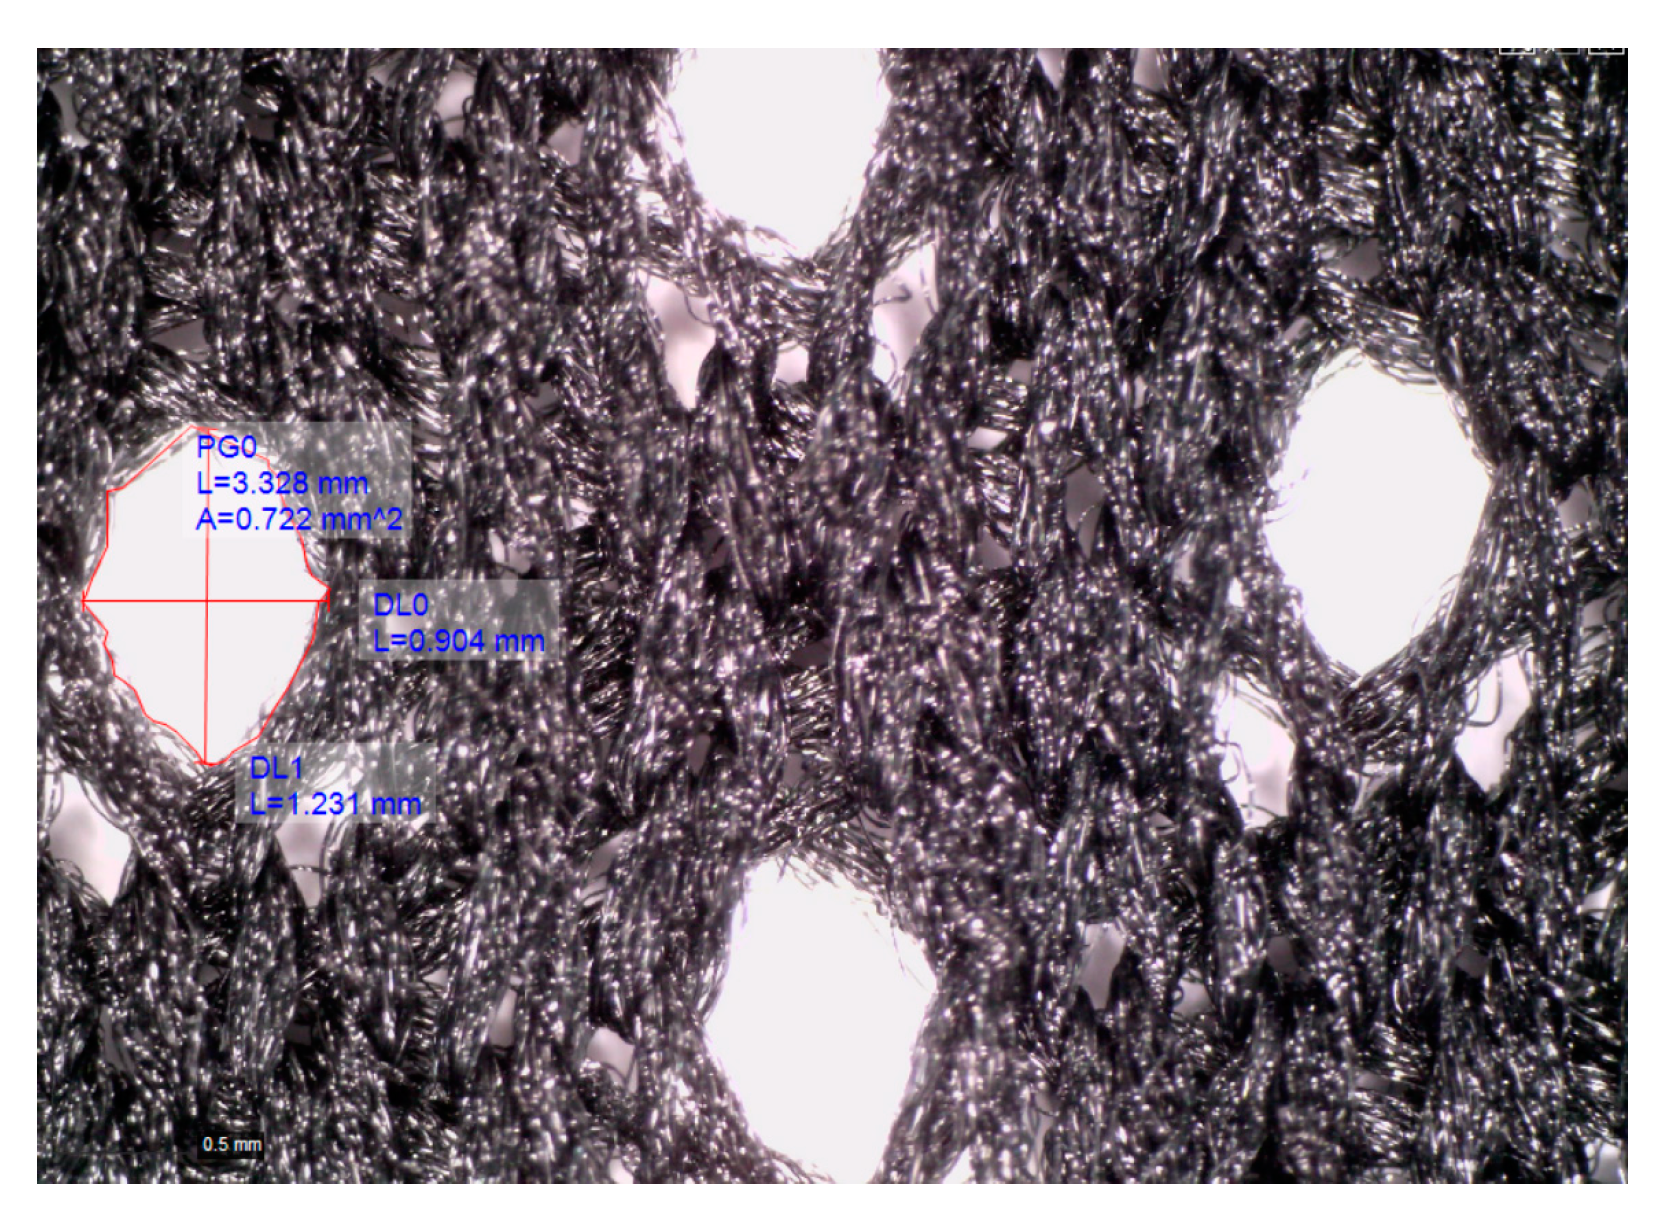
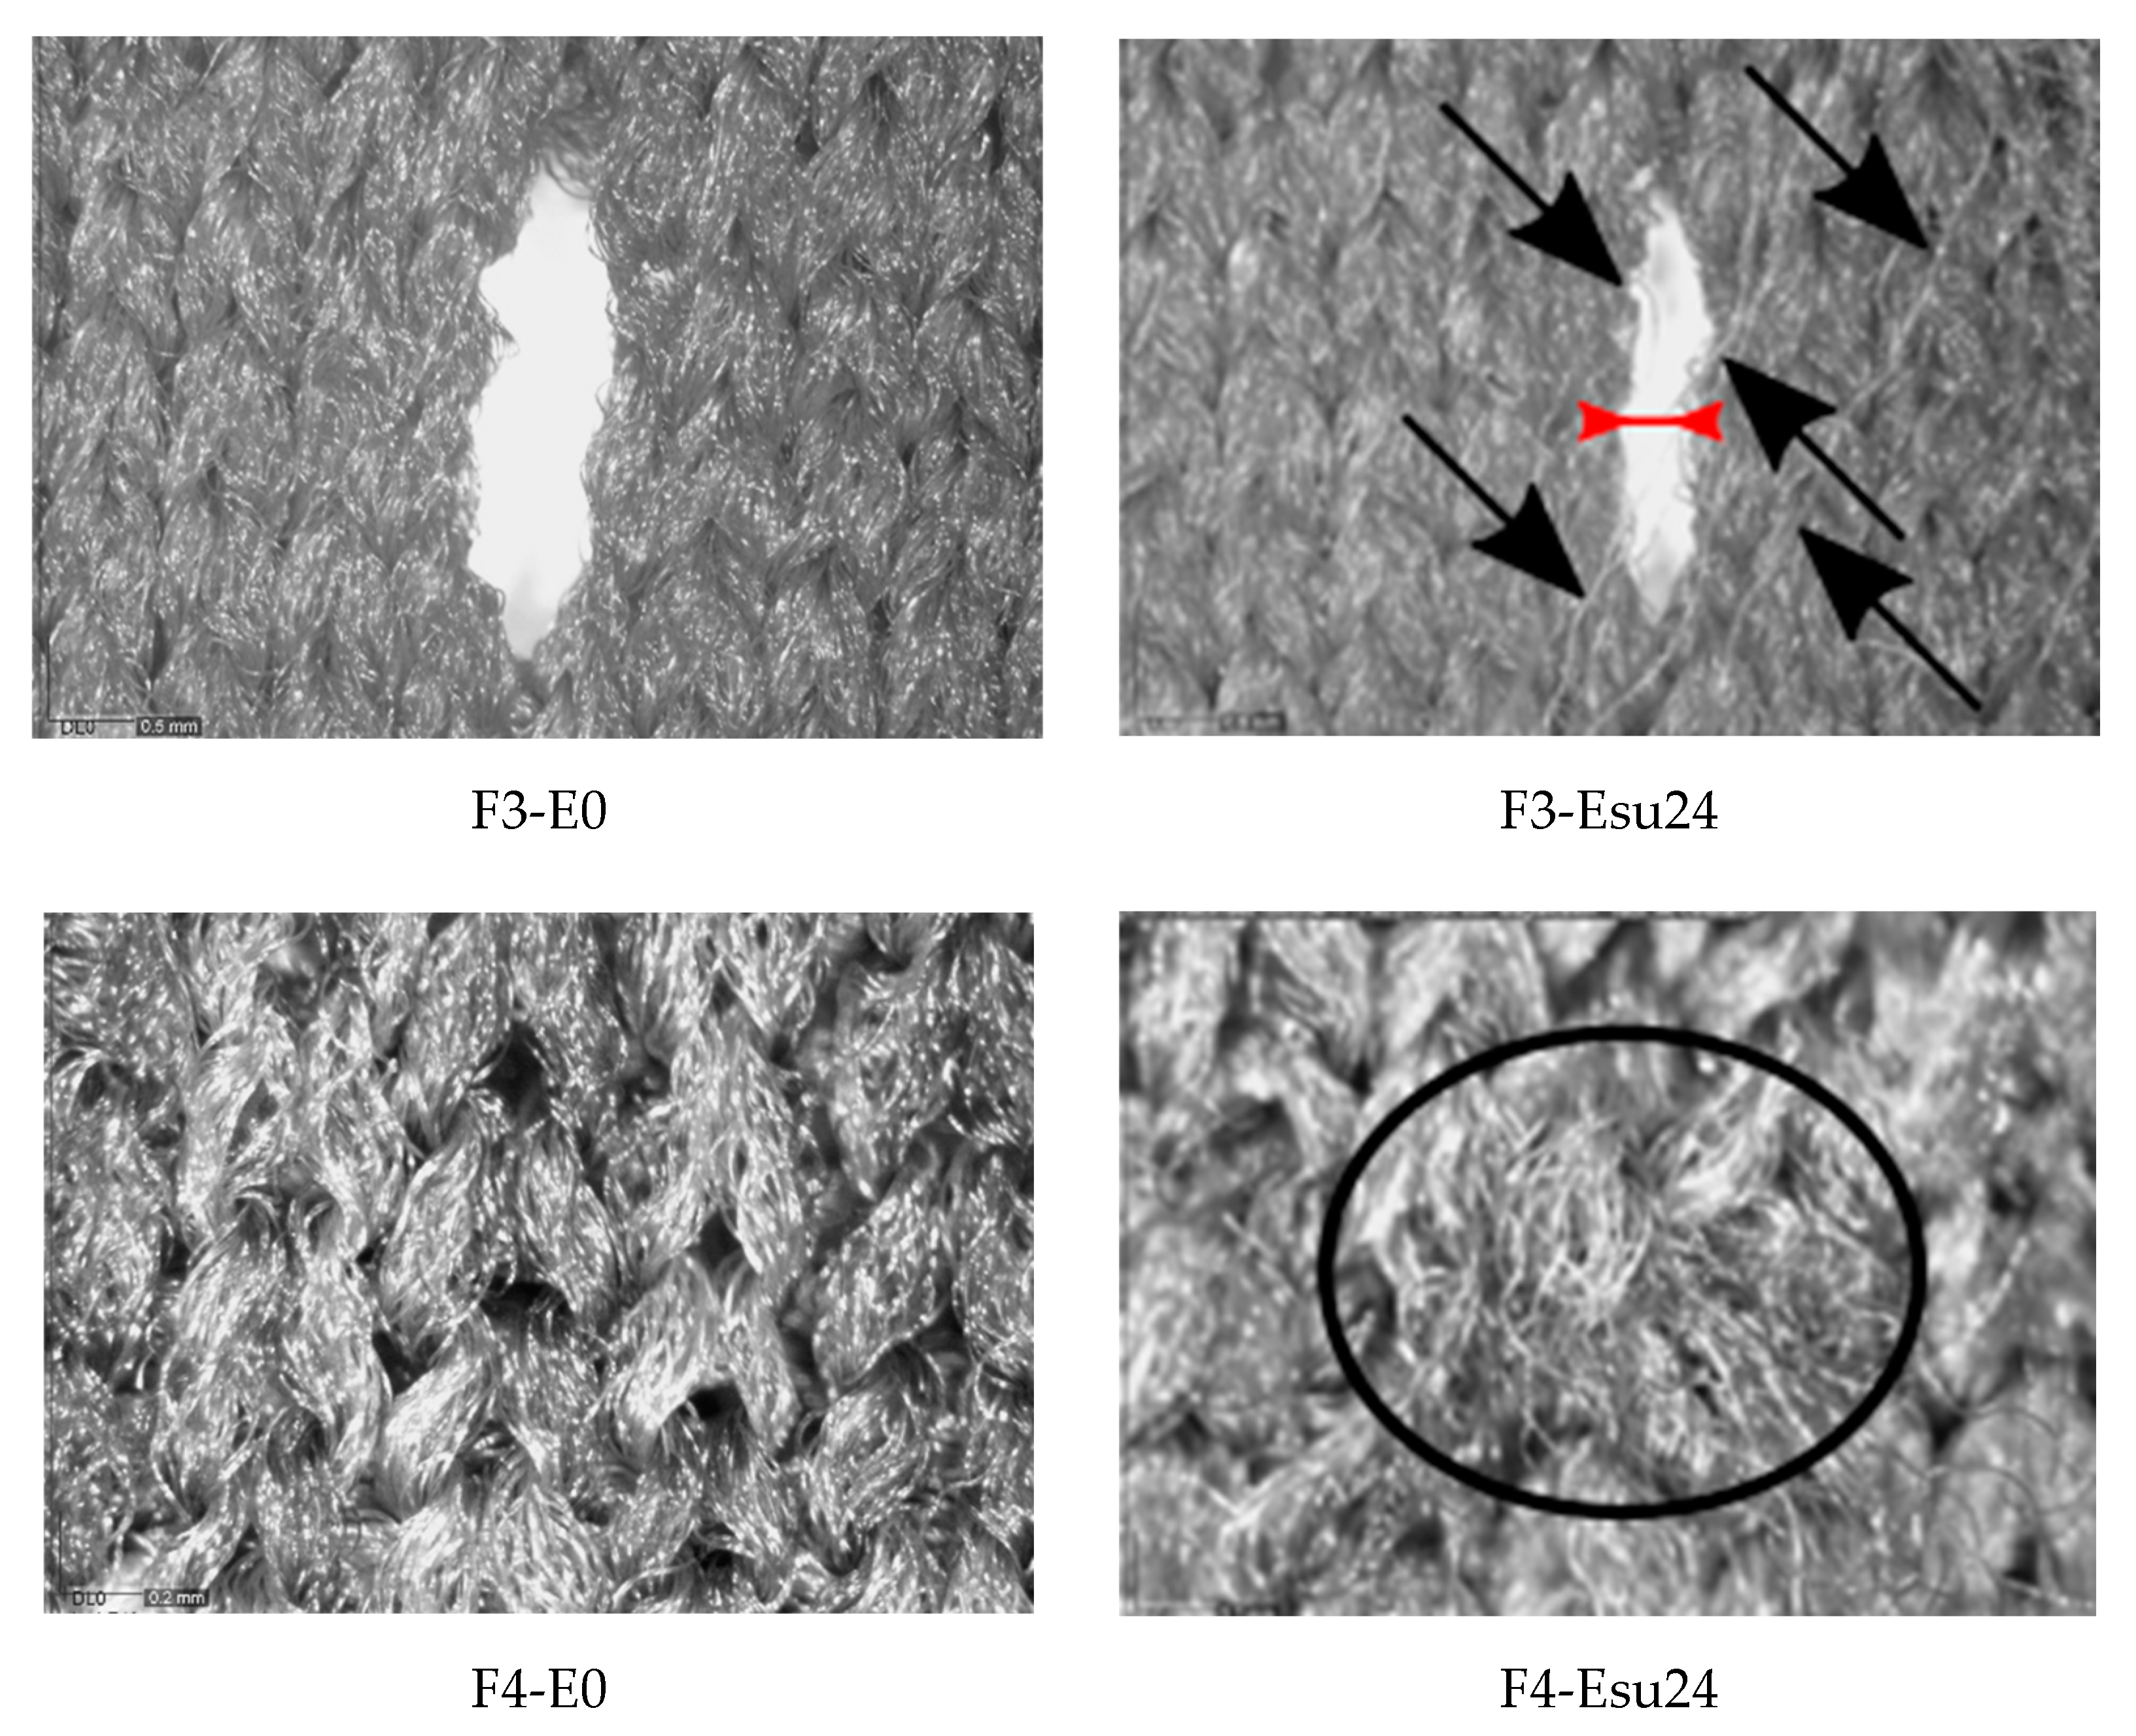
2.2.1. Topographic Characterization
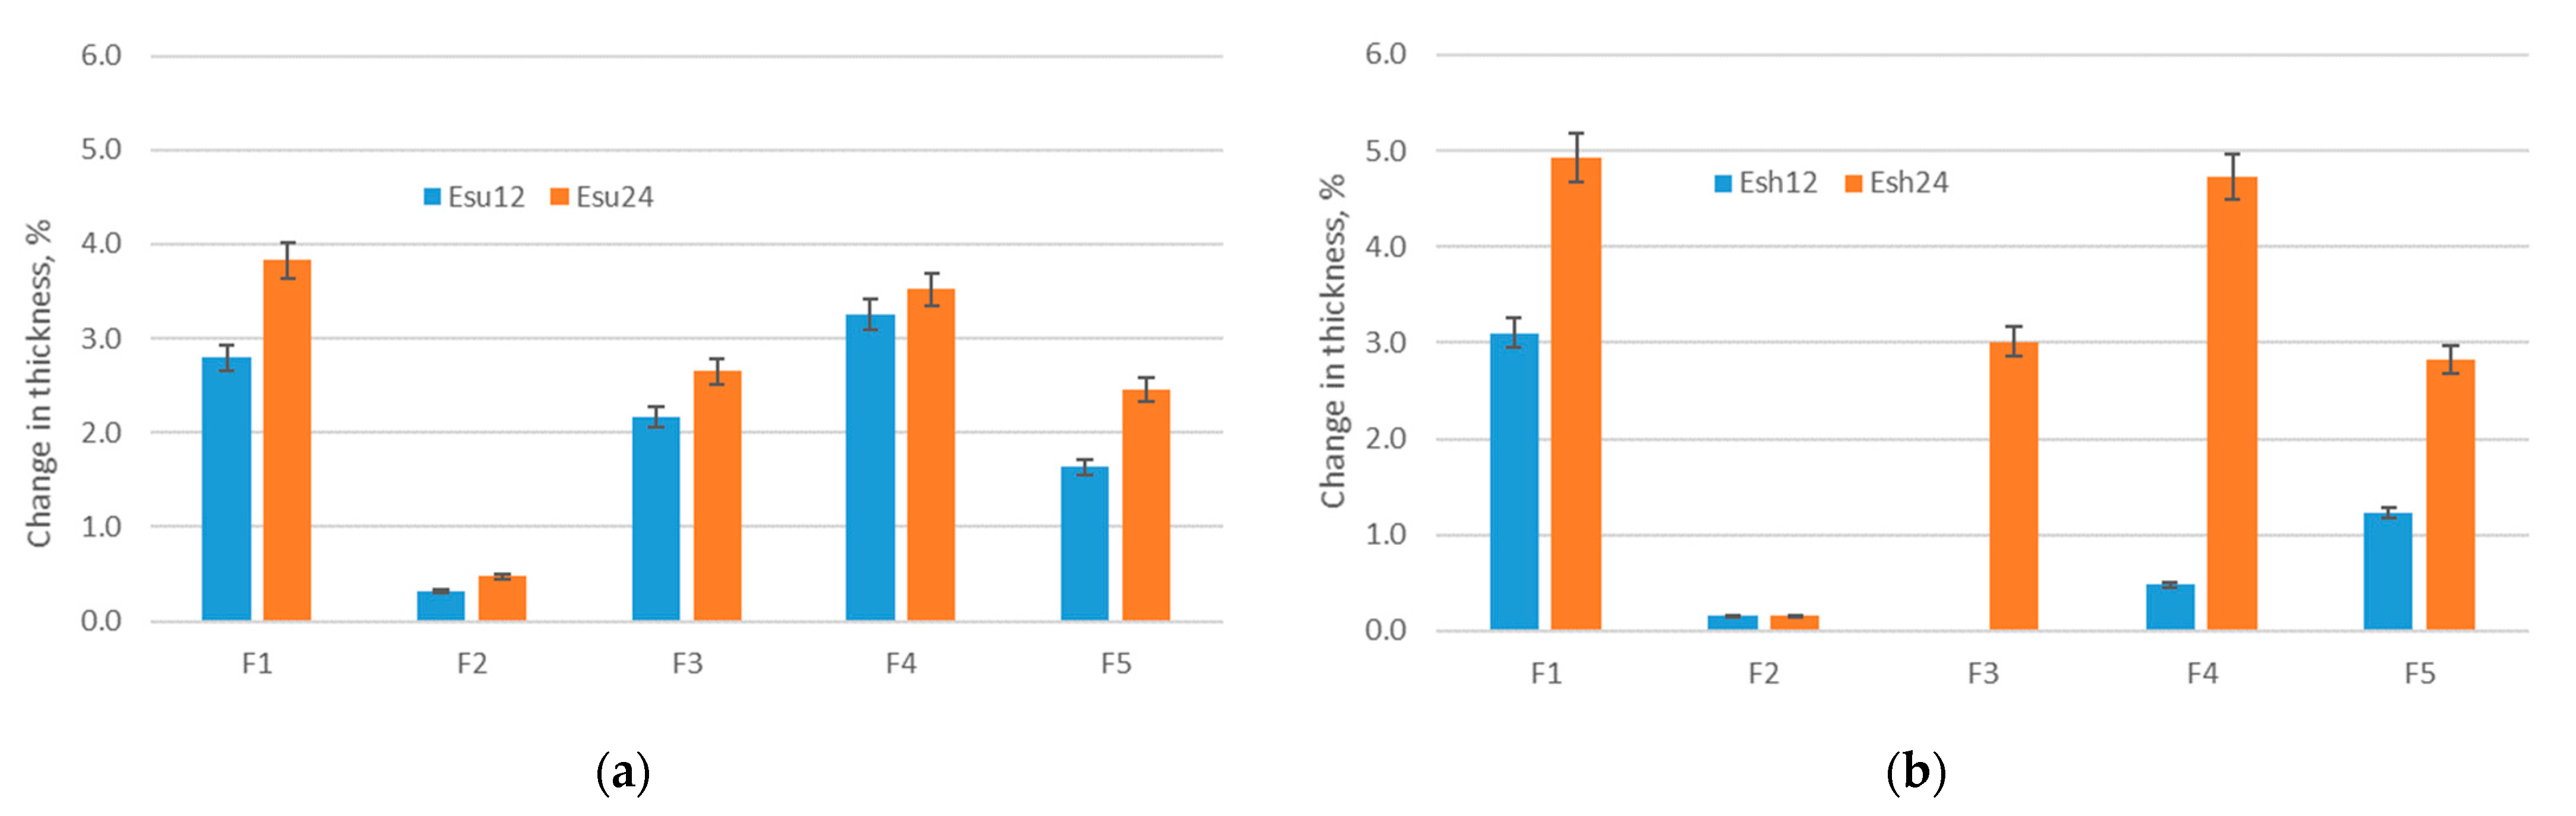
2.2.2. Material Thickness
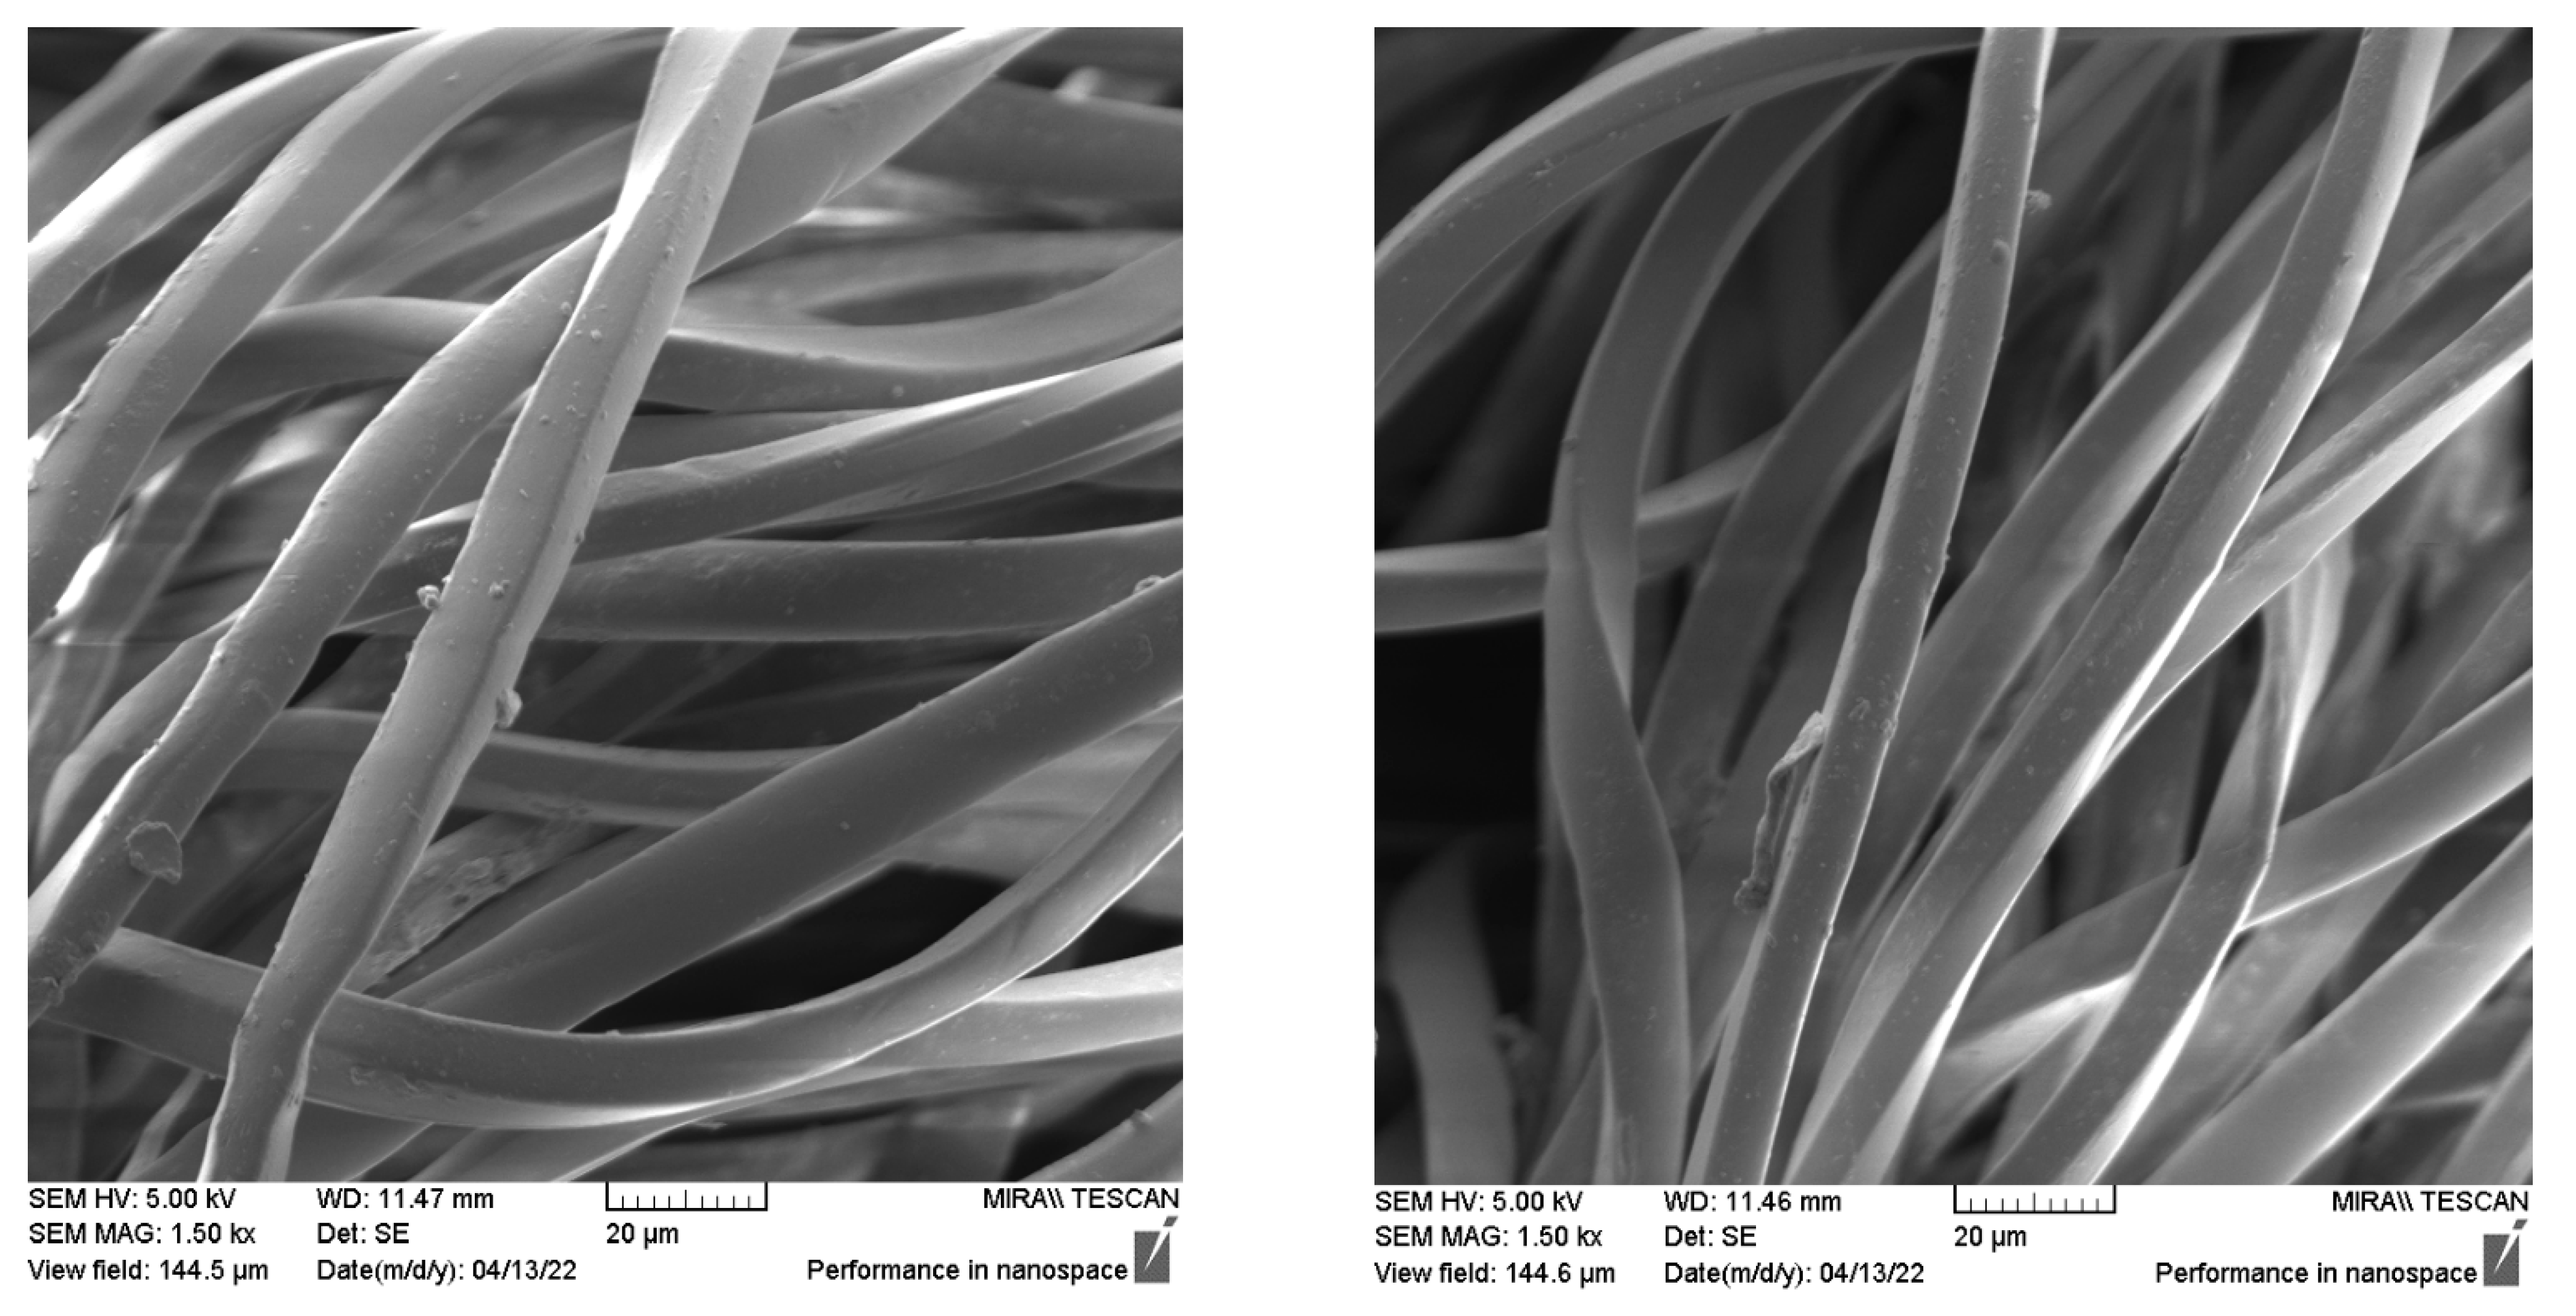
2.2.3. SEM Analysis
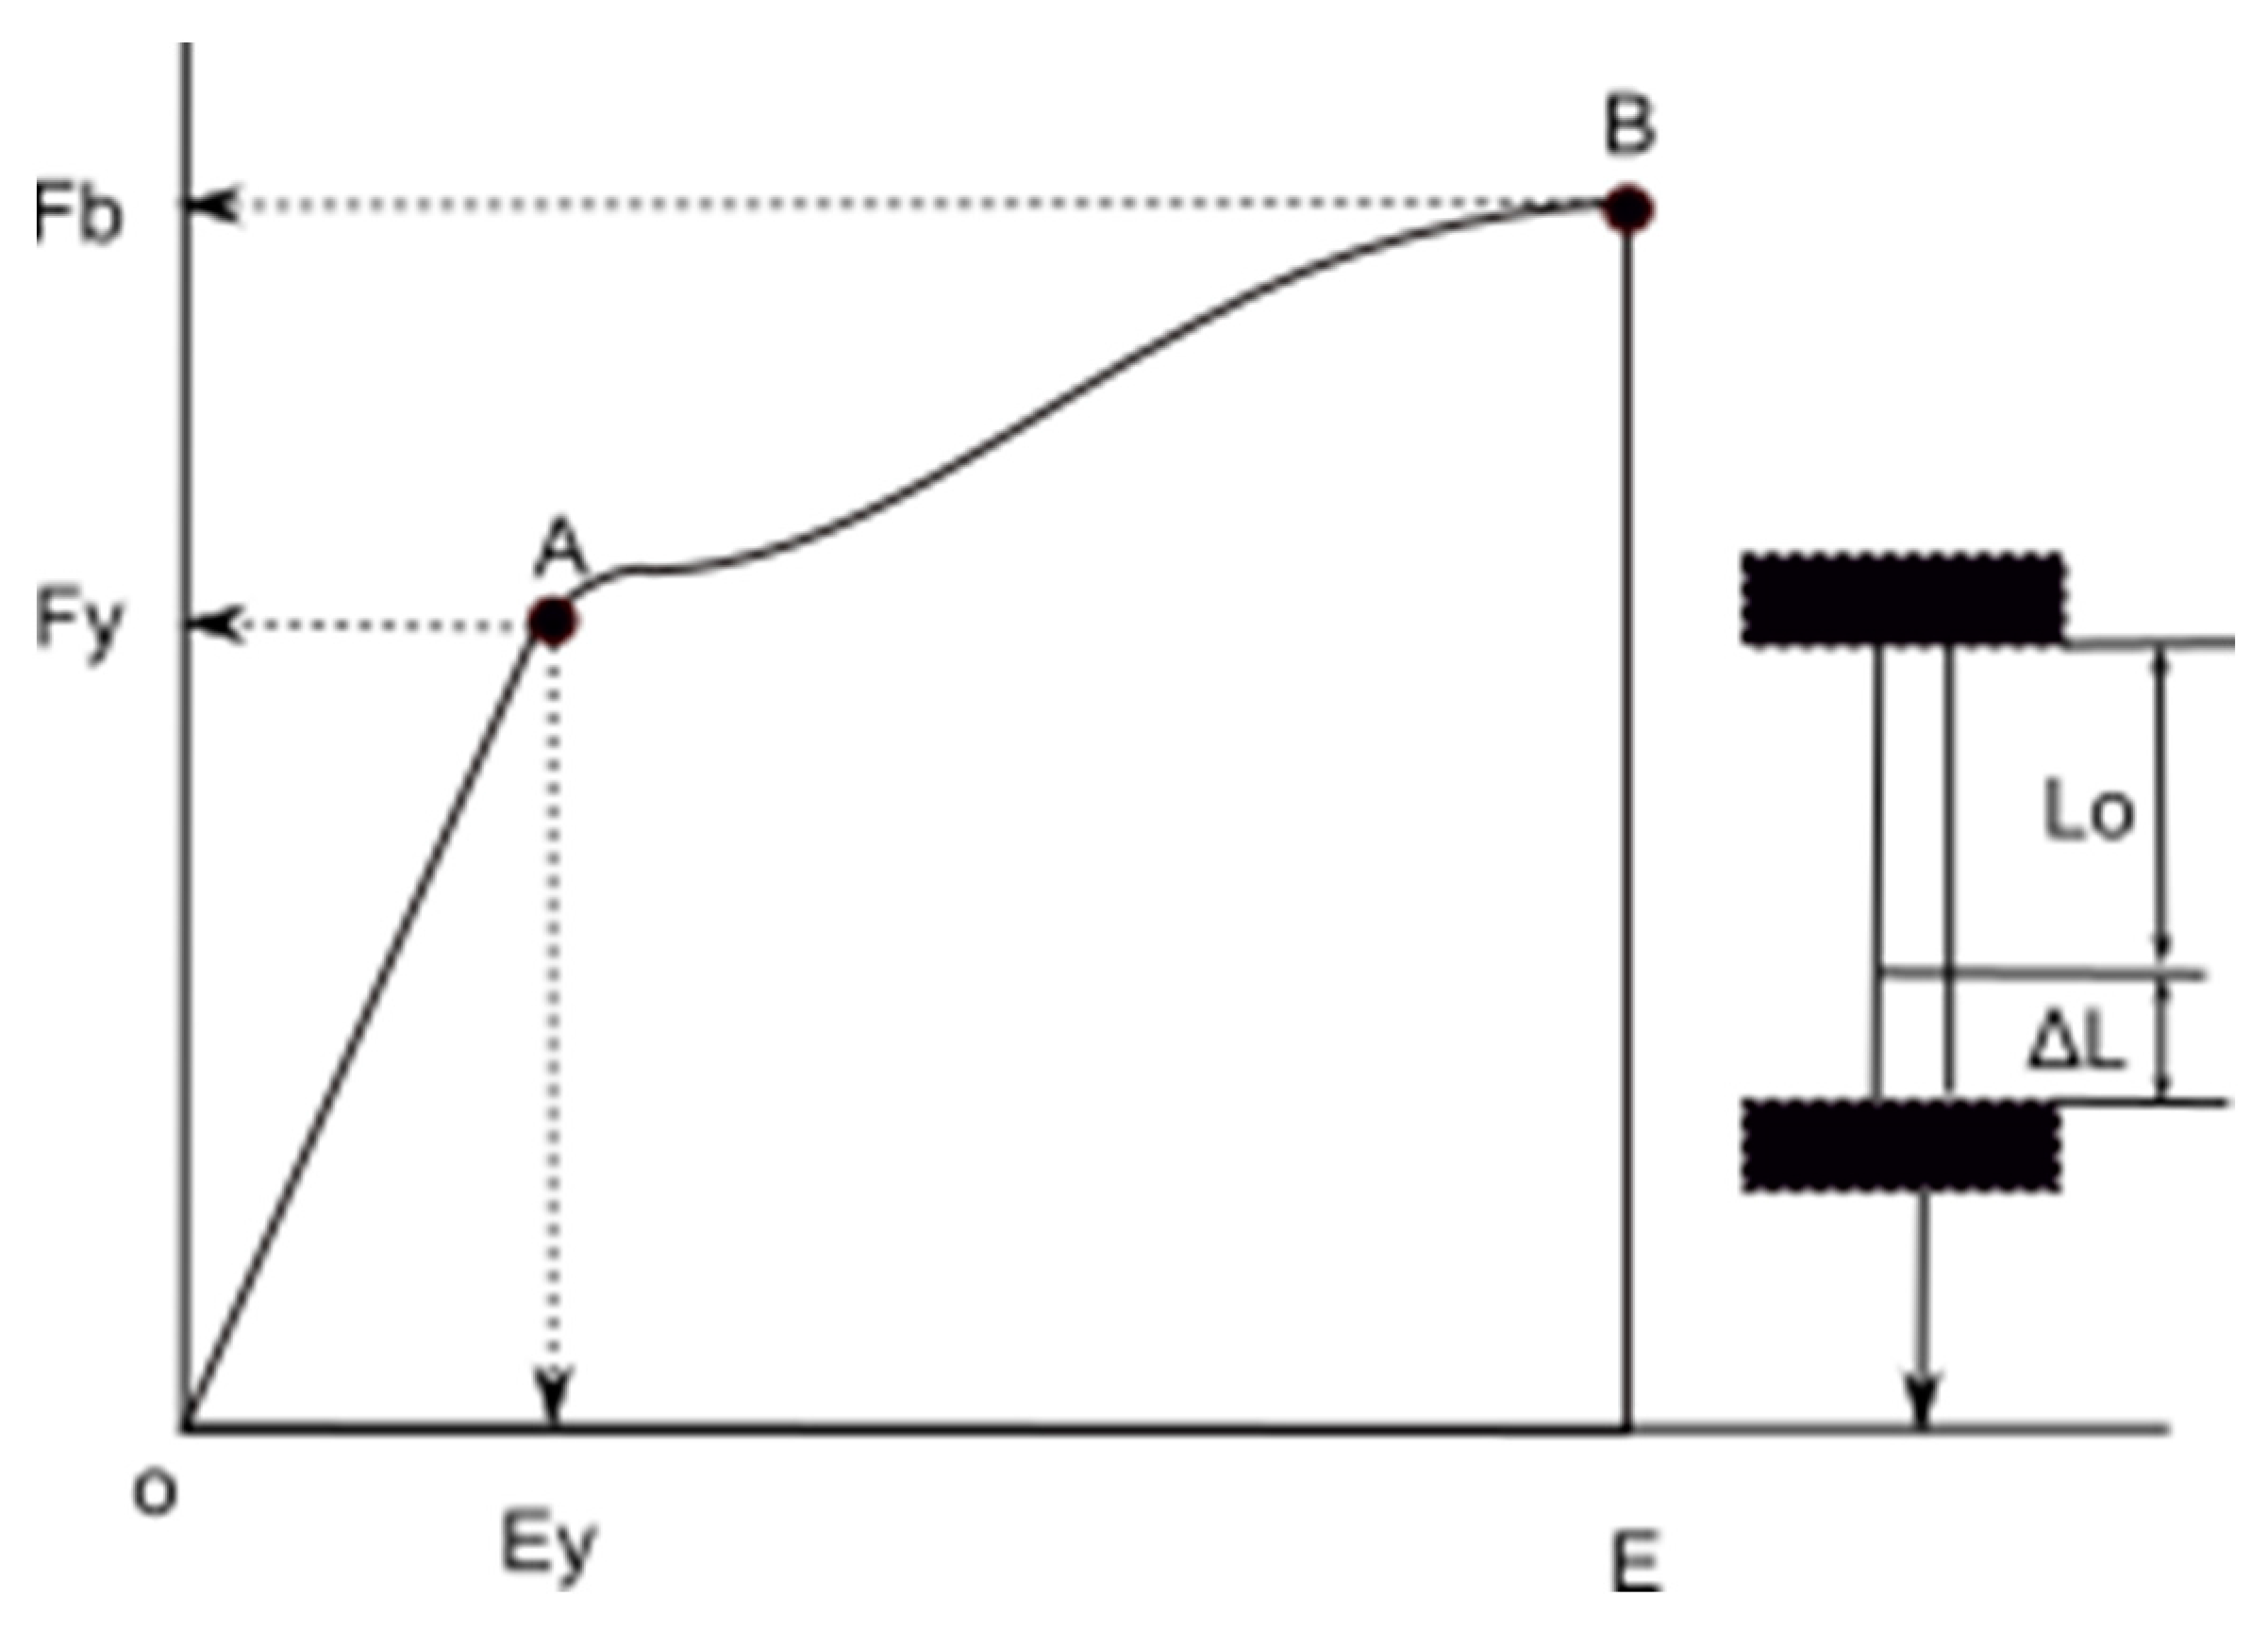
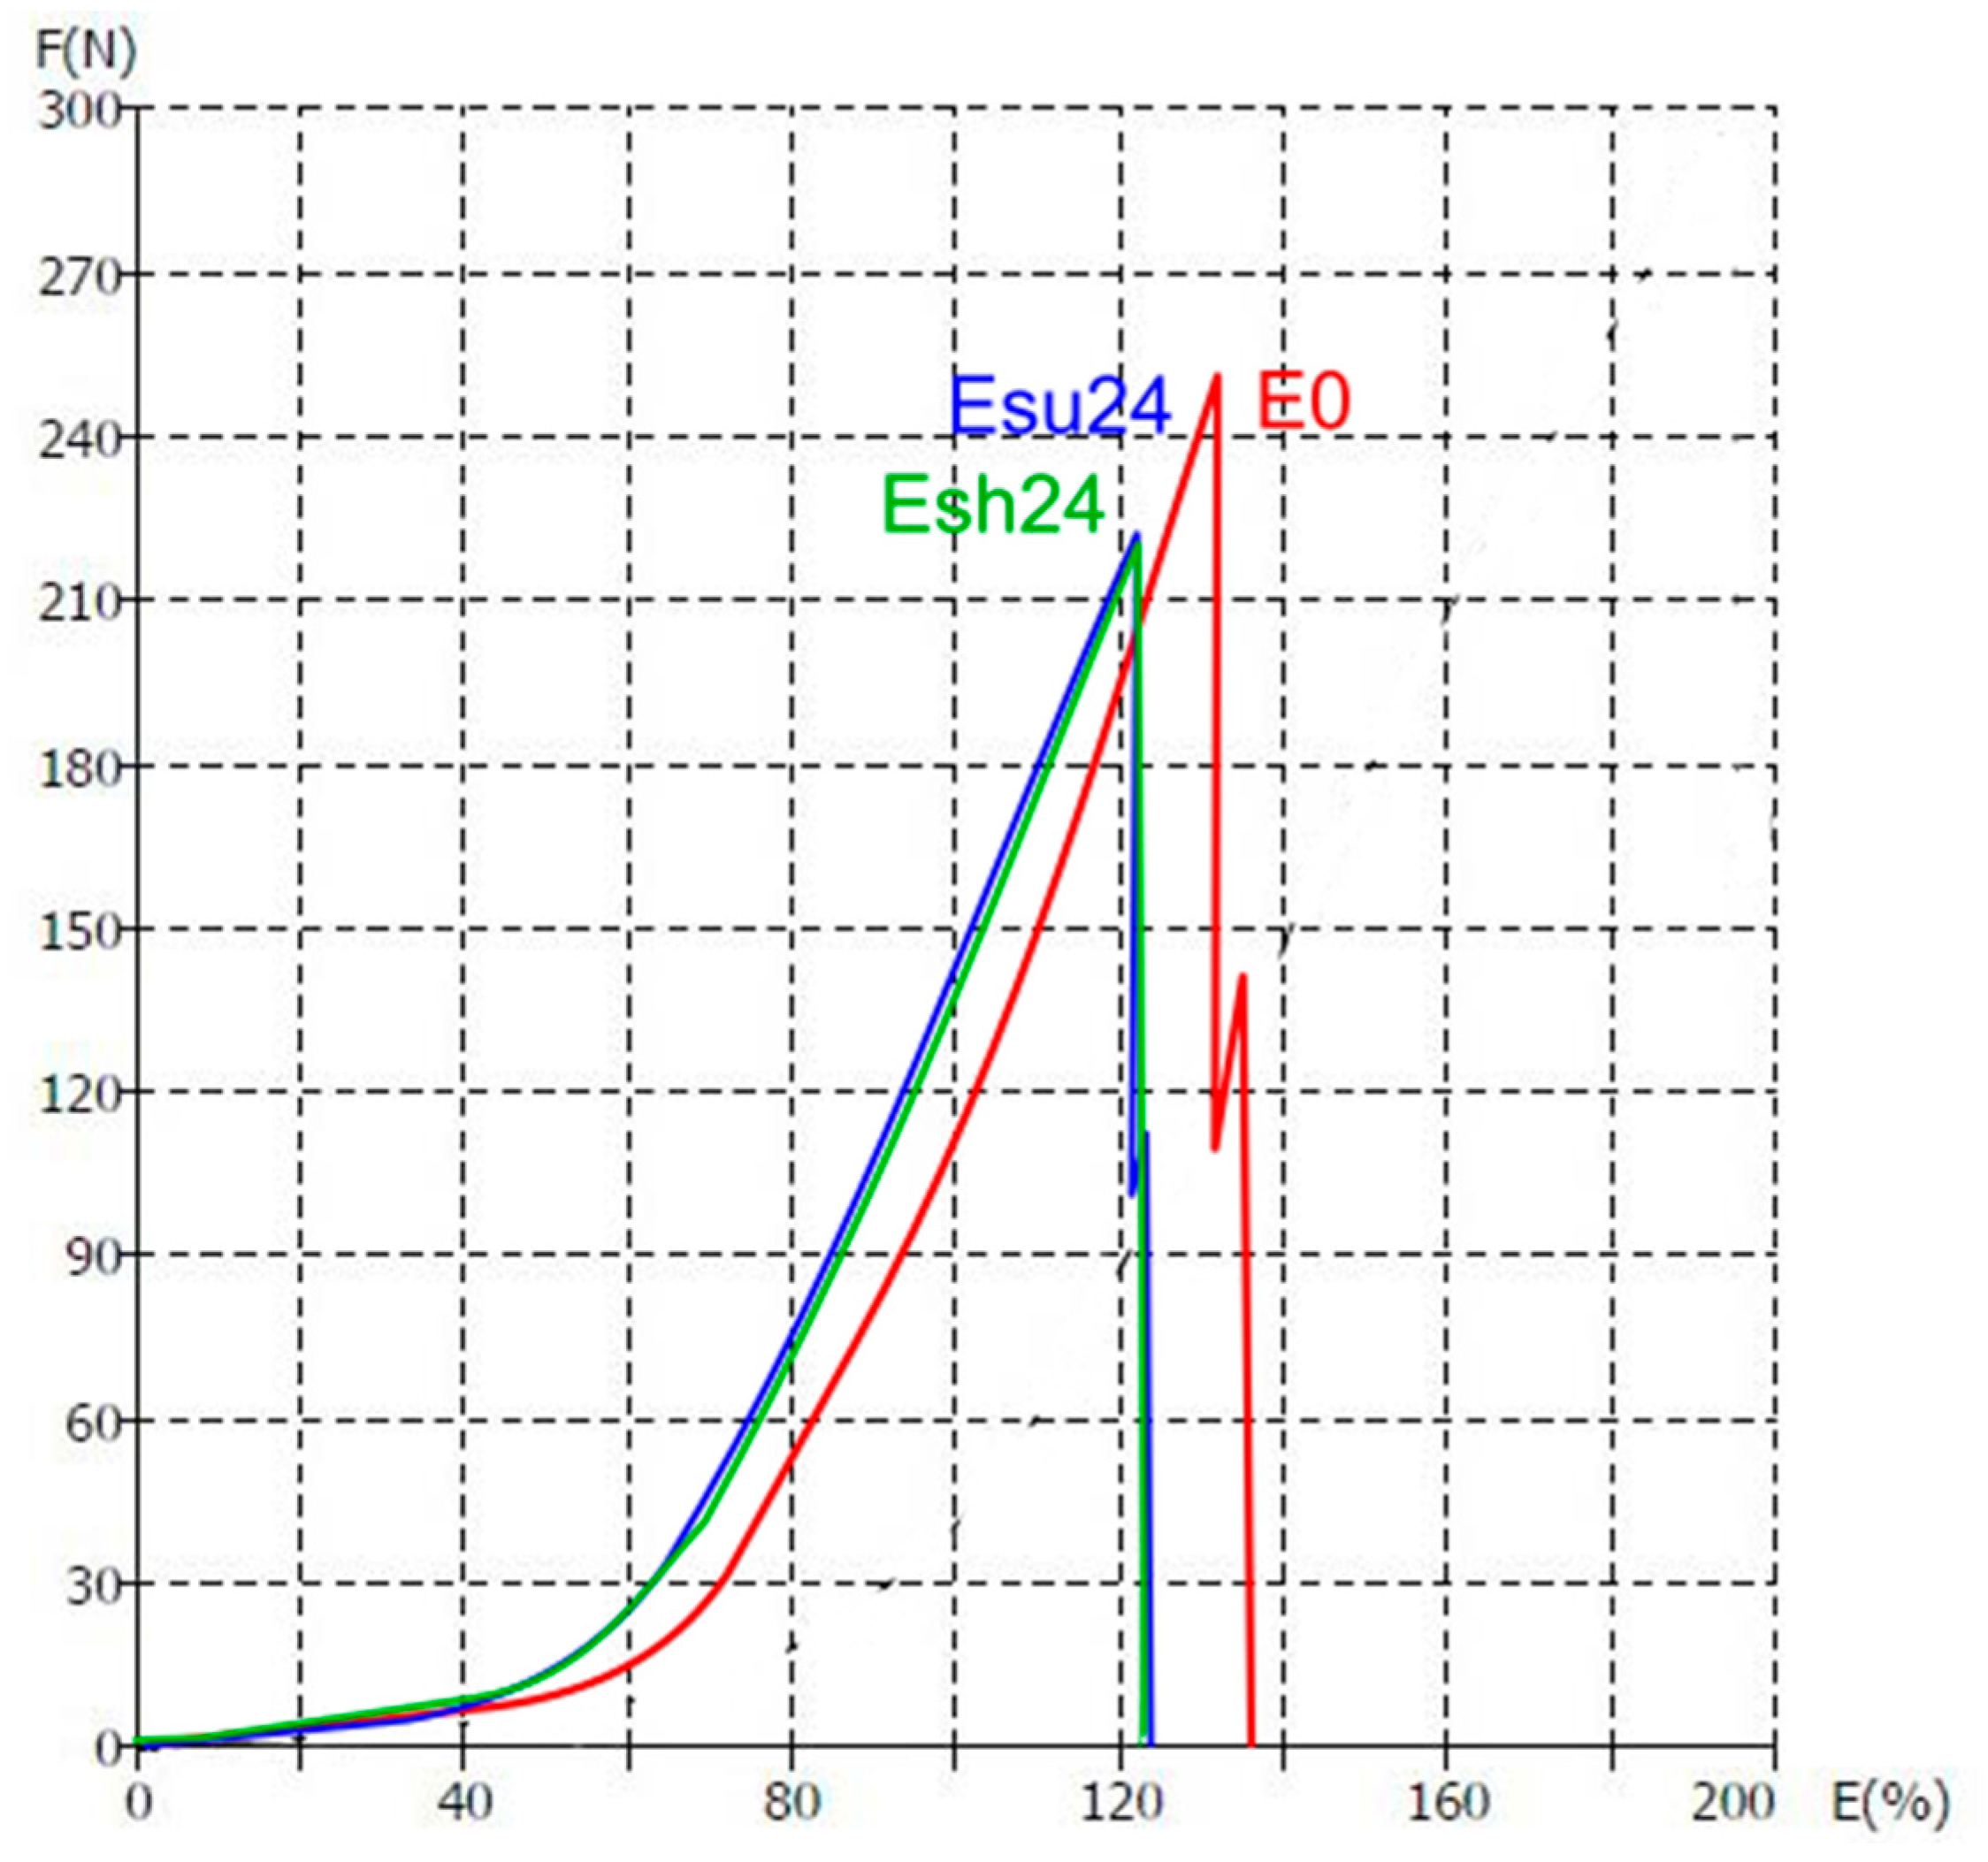
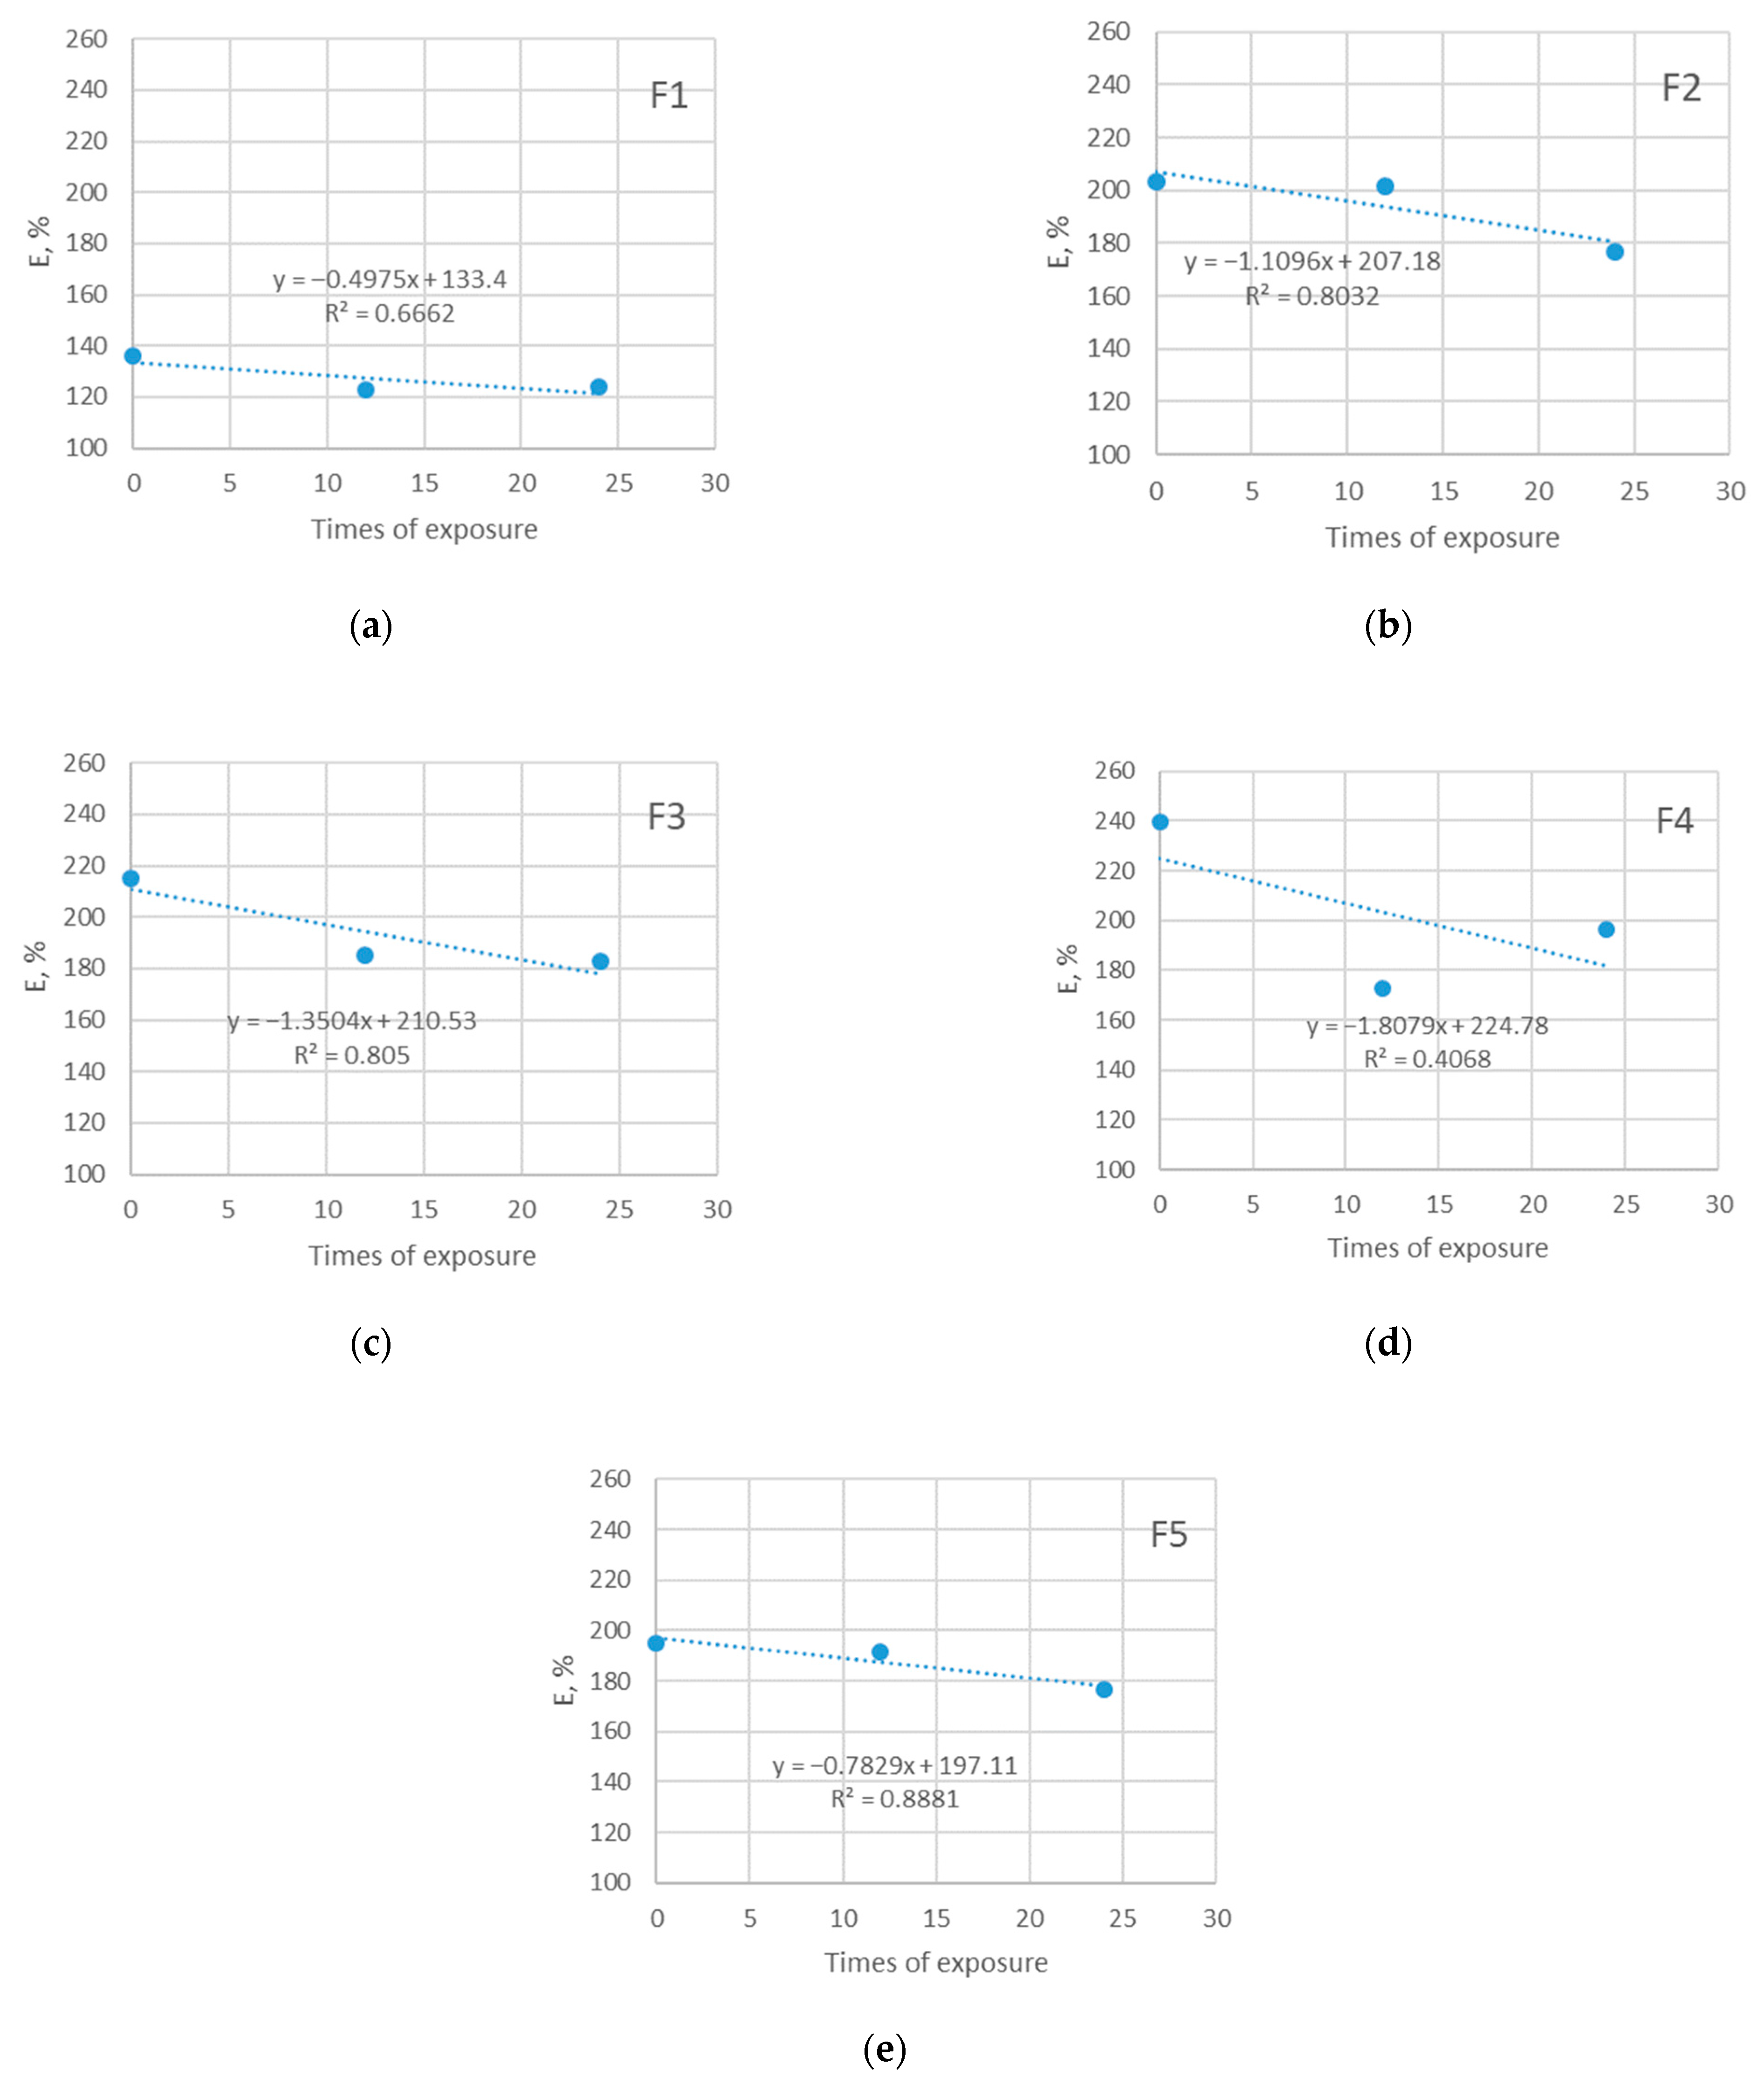
2.2.4. Elongation at Break
2.2.5. Bursting Force
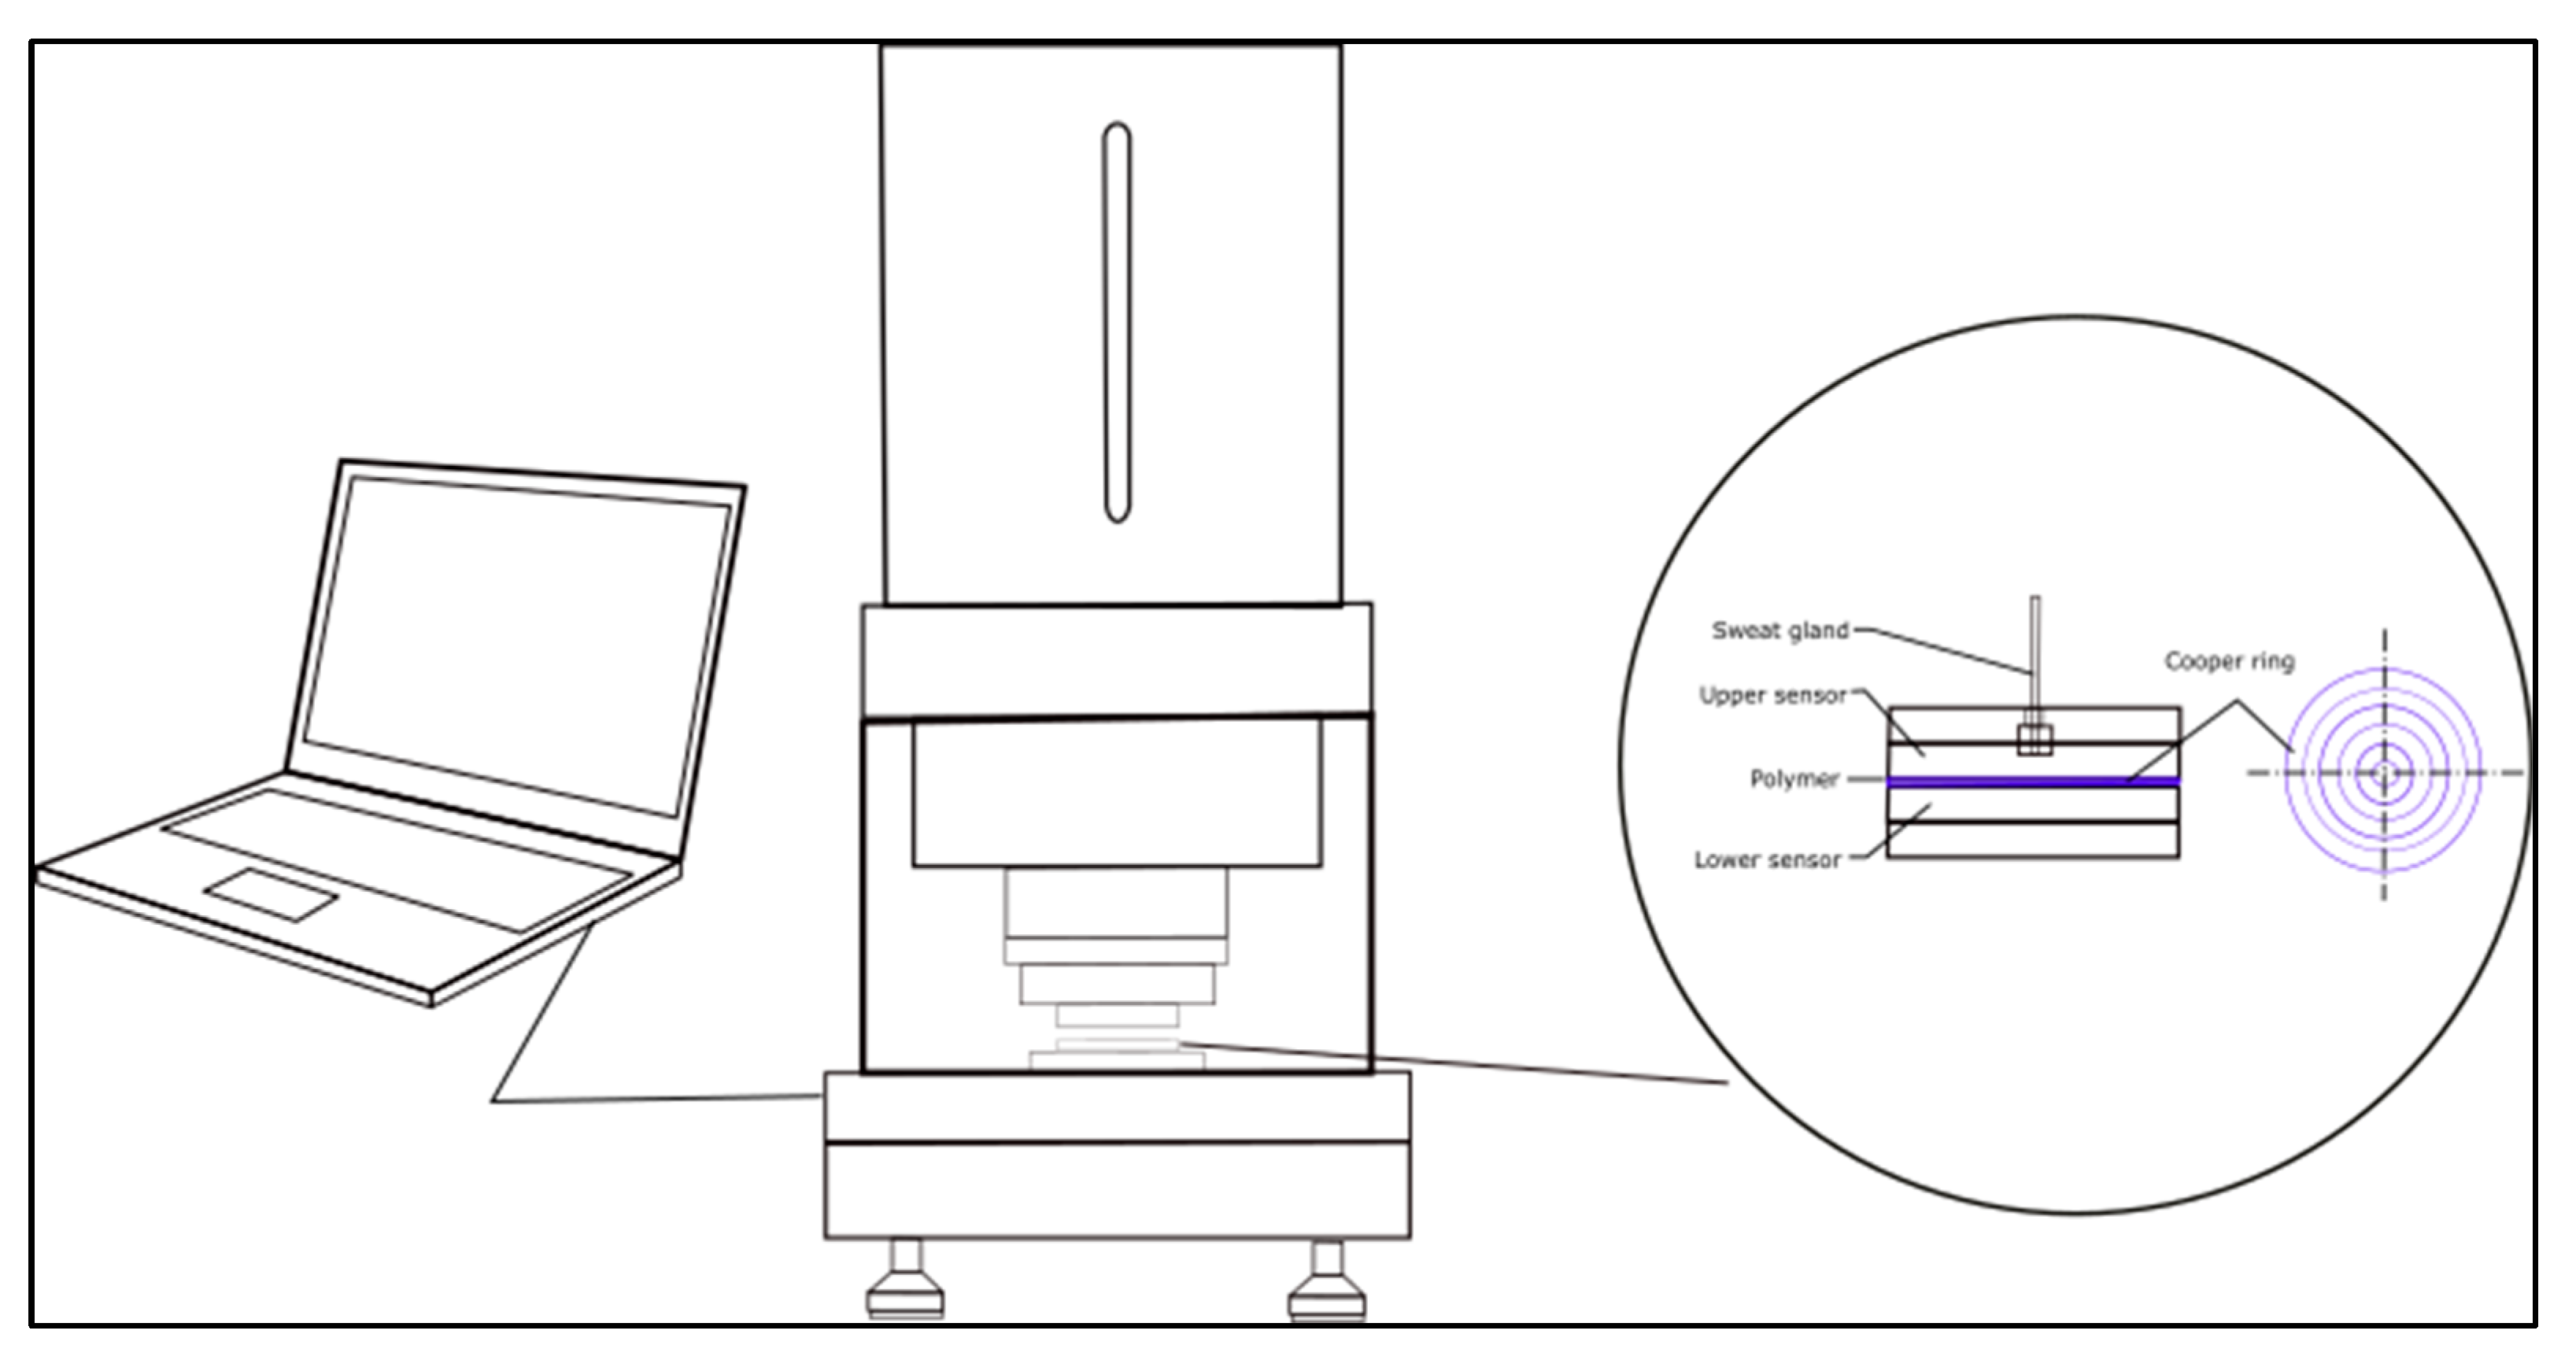
2.2.6. Moisture Management
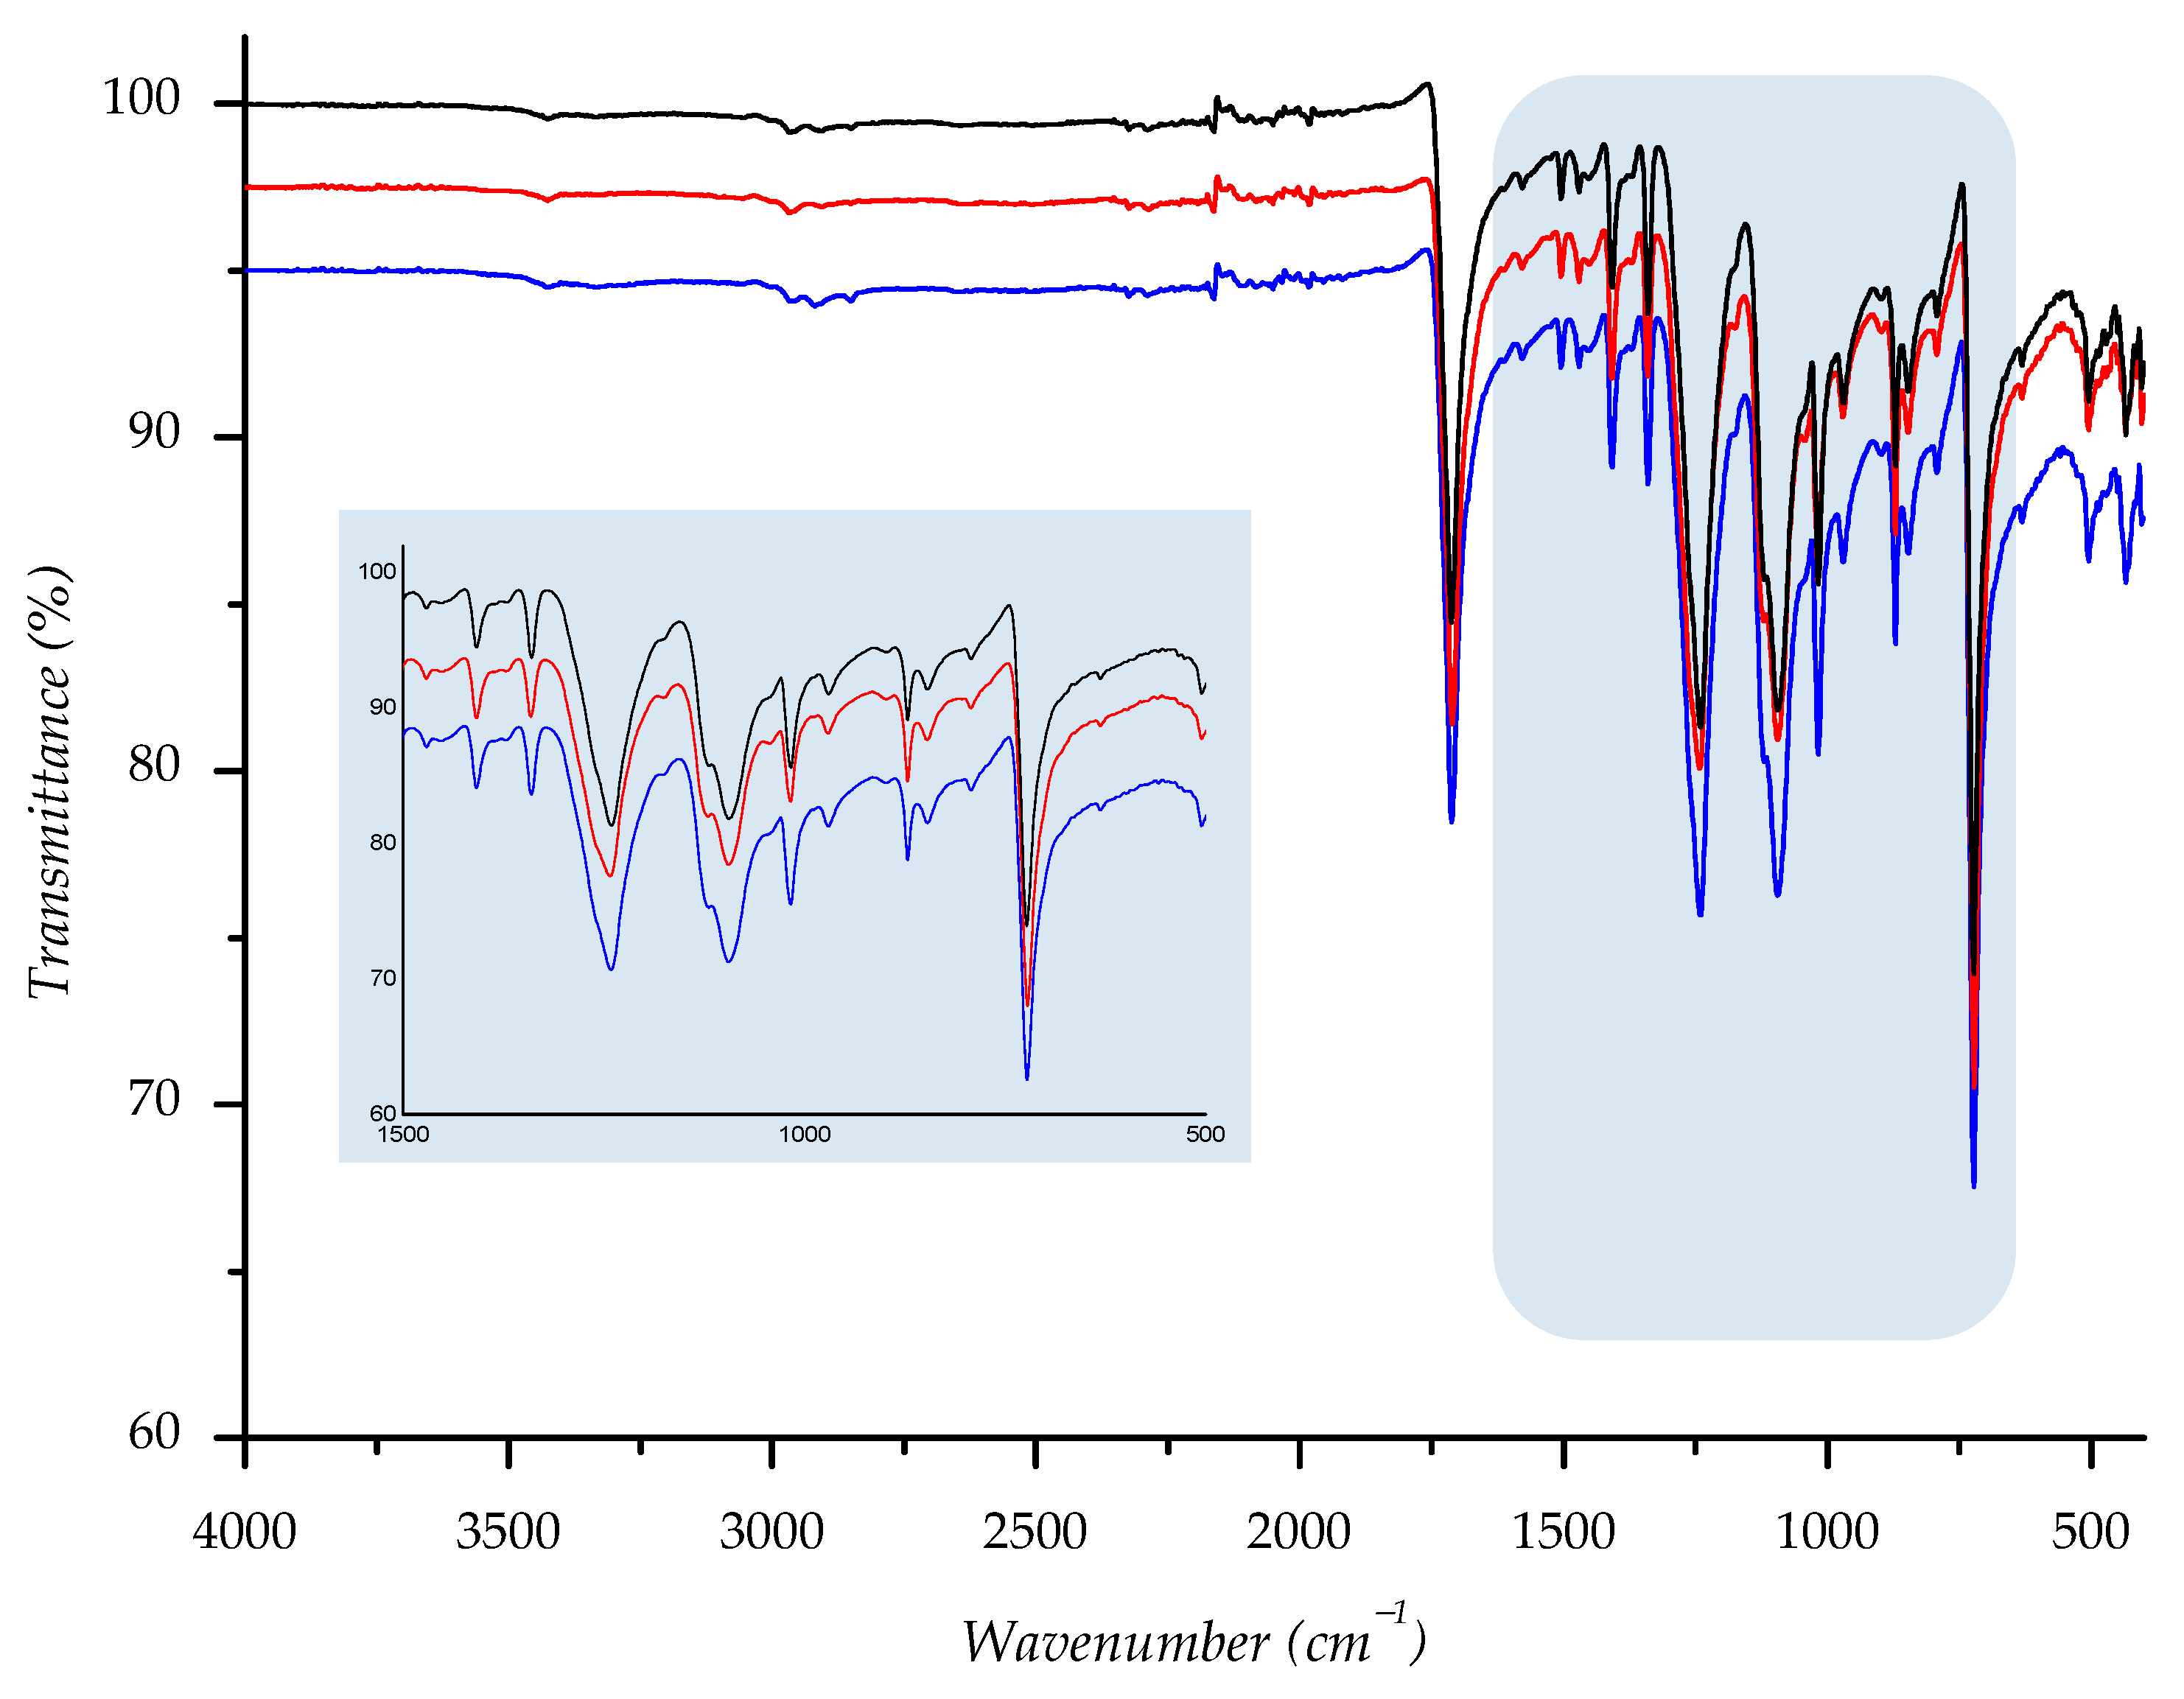
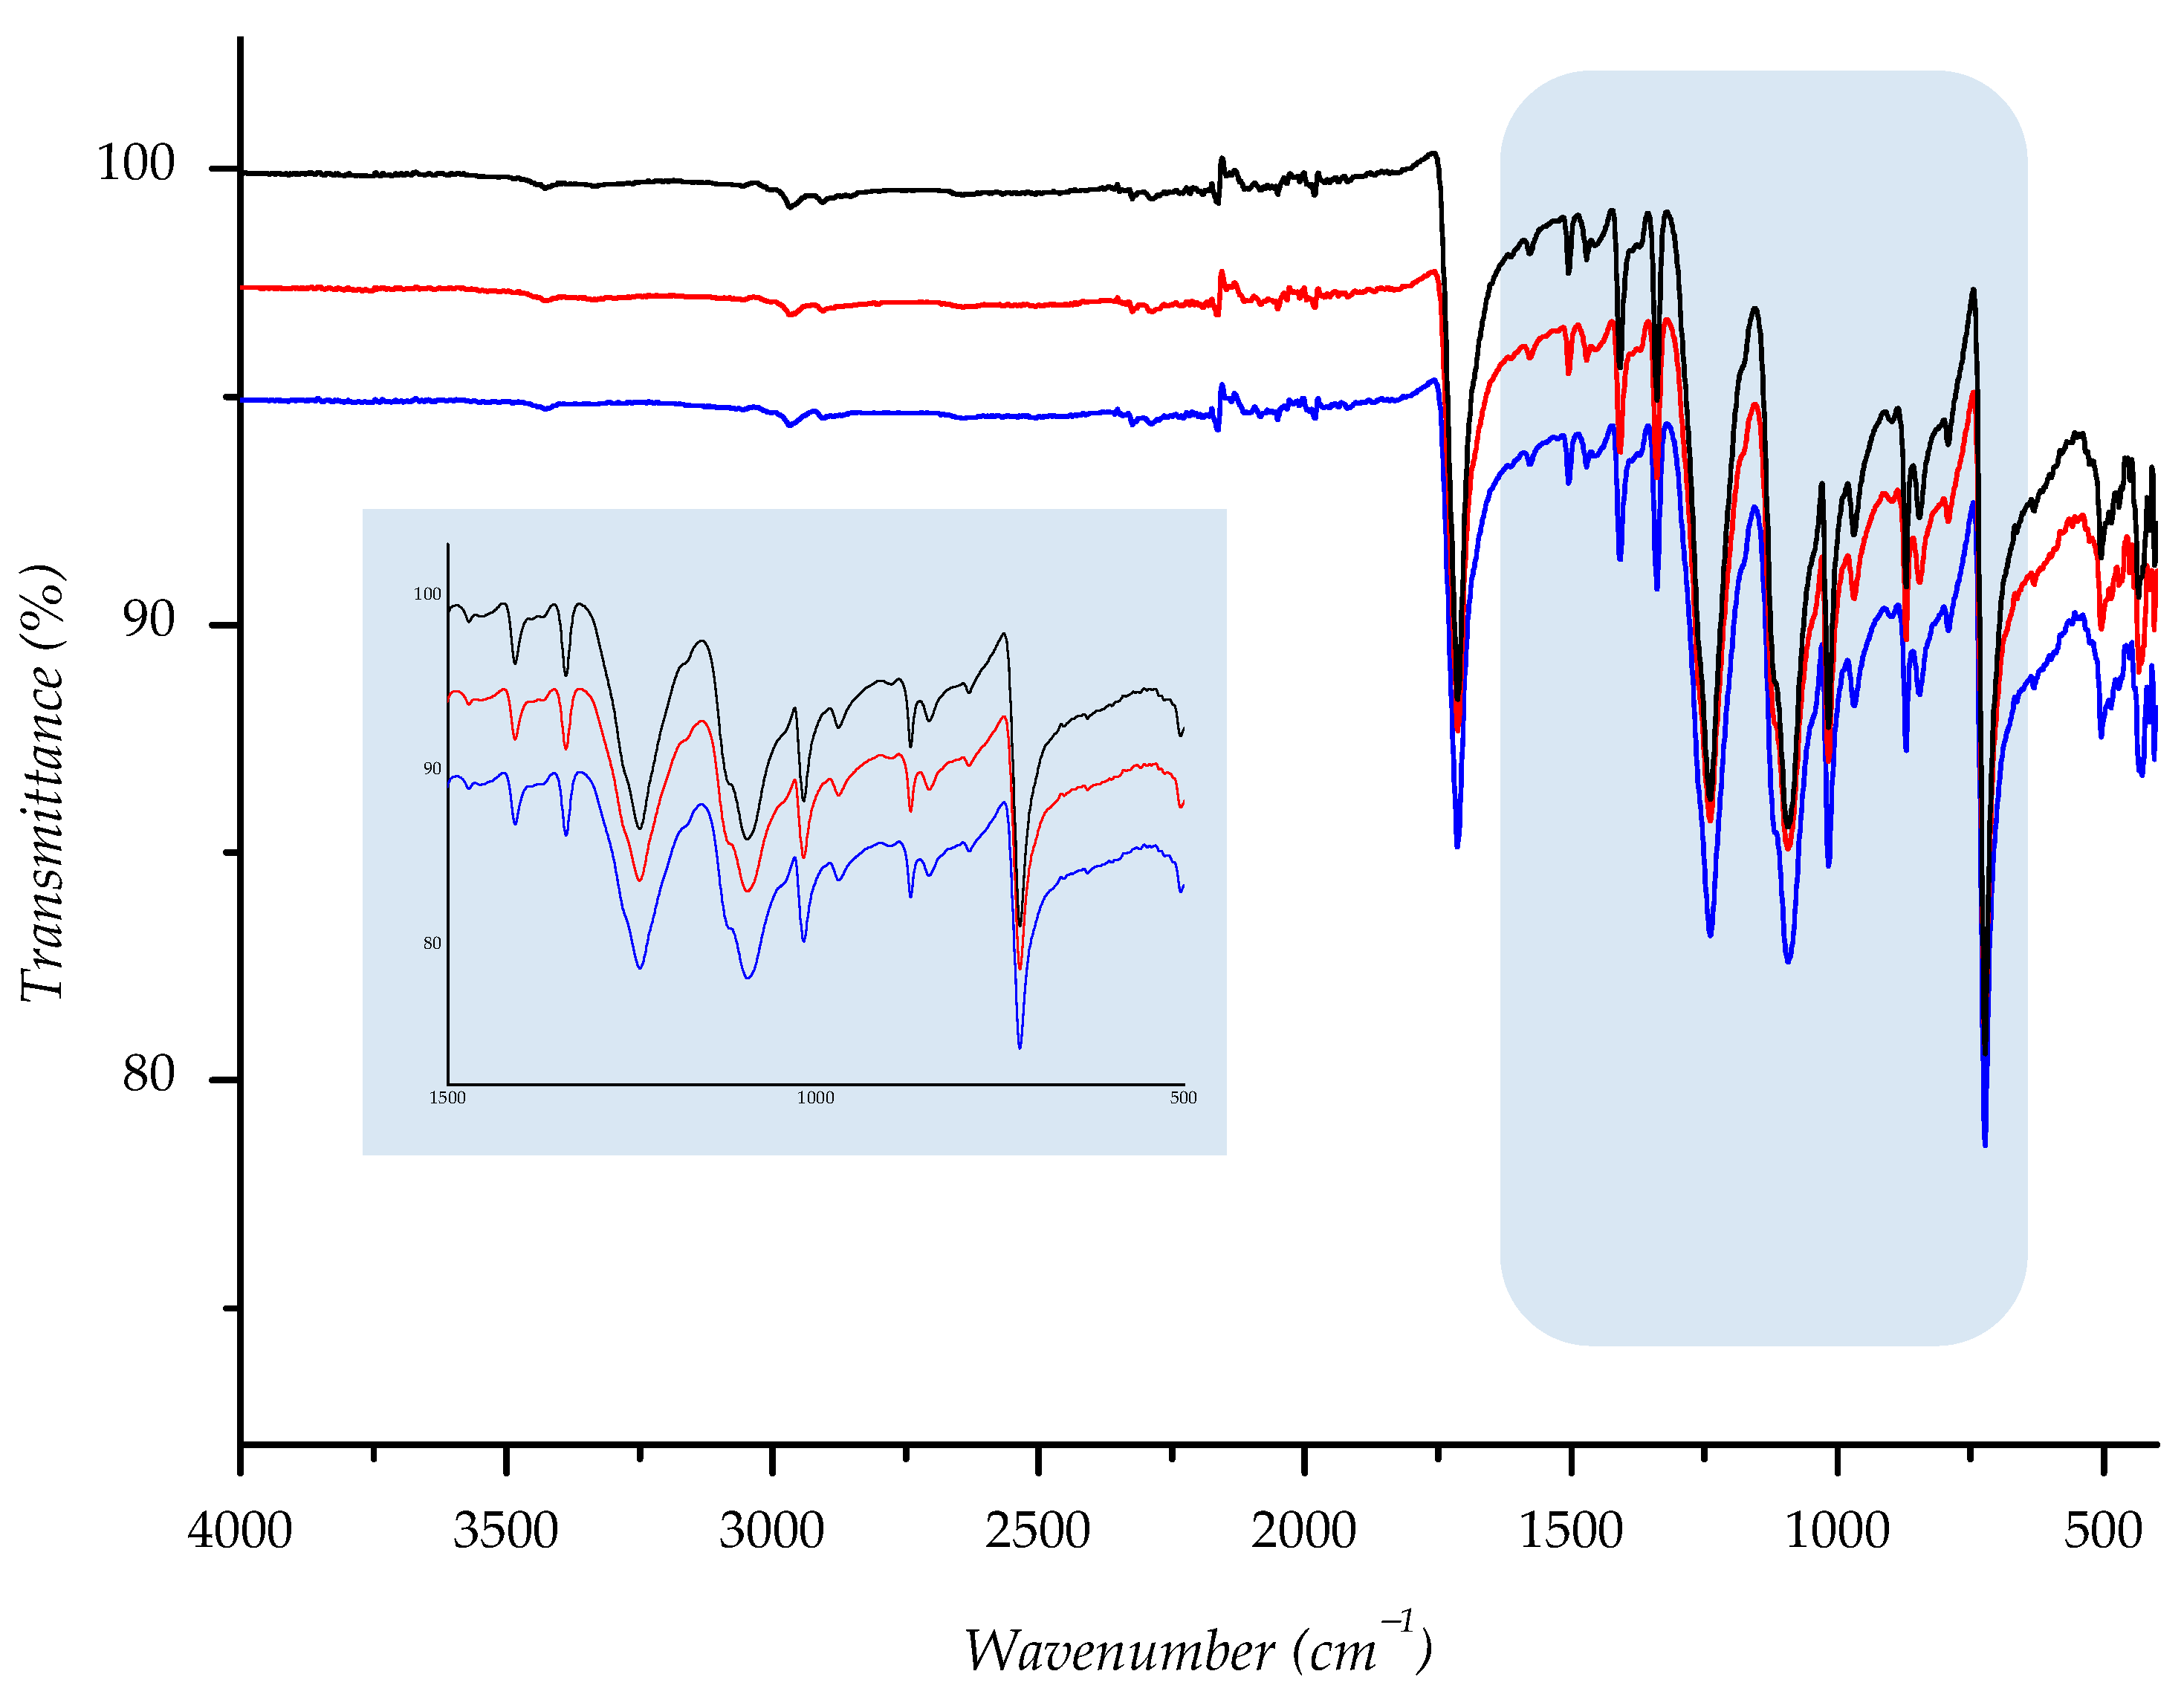
2.2.7. FTIR Analysis
3. Results and Discussion
3.1. Results of the Topographic Characterization
3.2. Results of Thickness Testing
3.3. Results of SEM Analysis
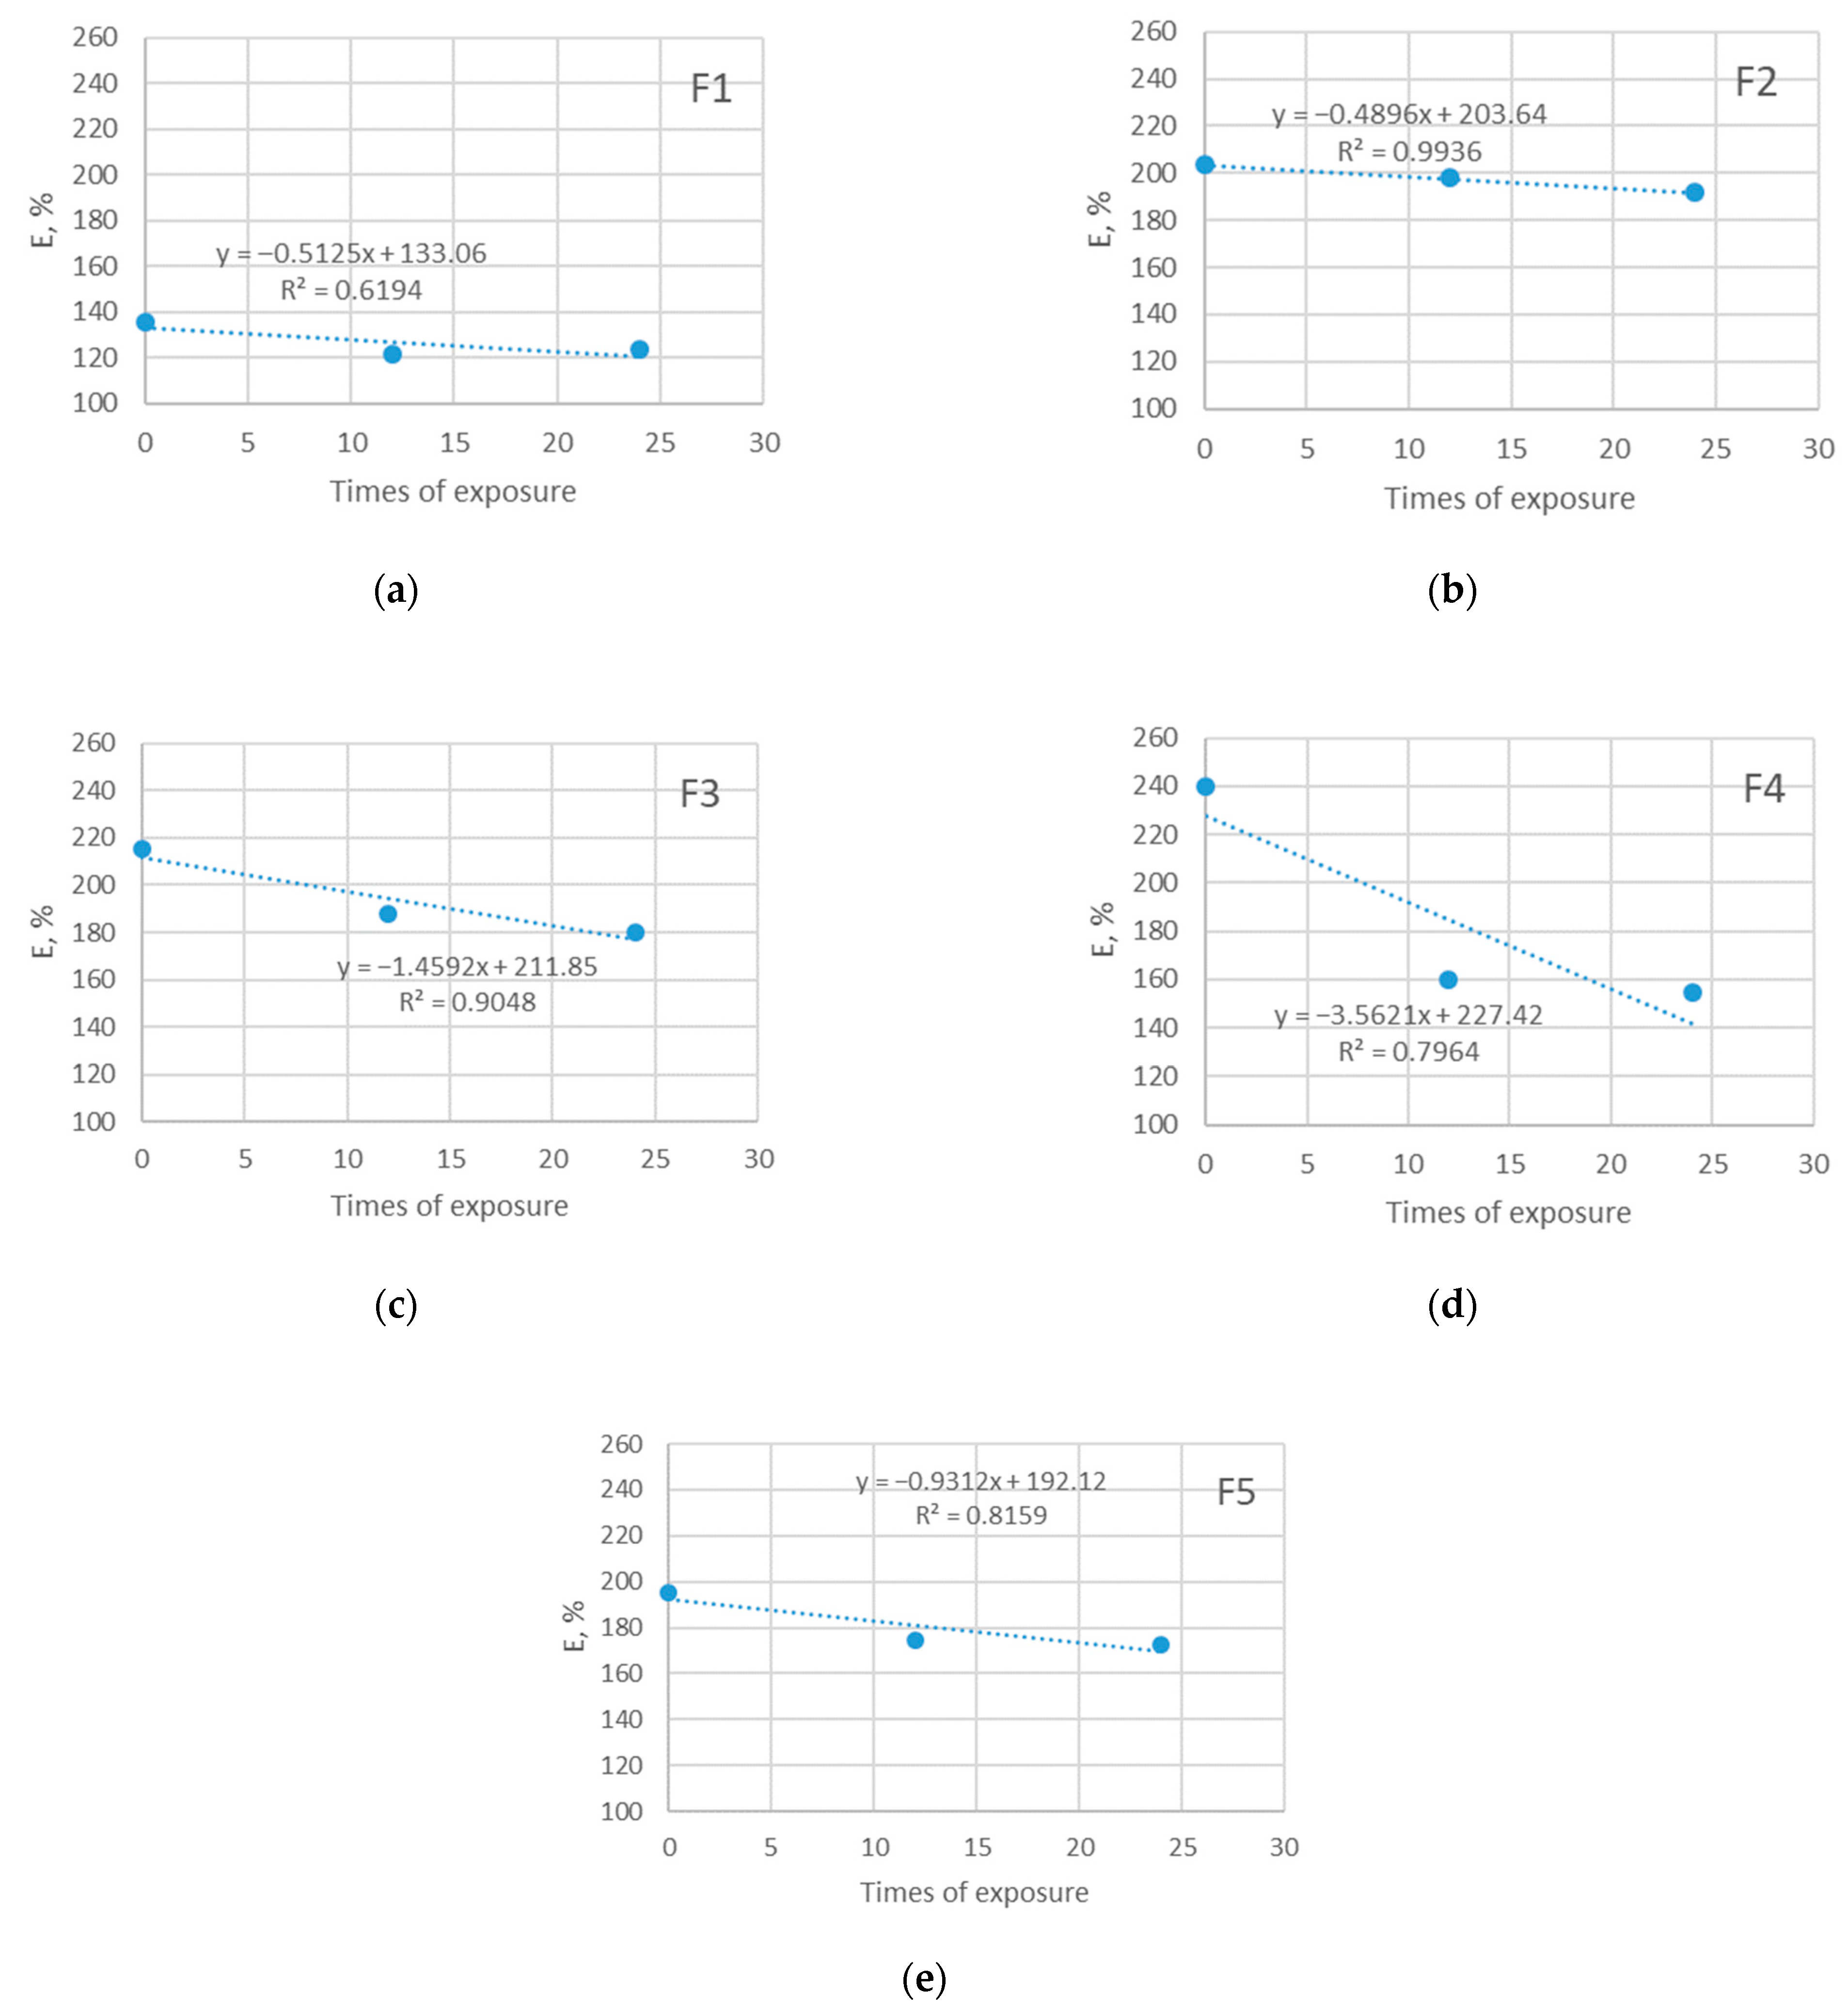
3.4. Results of Elongation at Break Testing
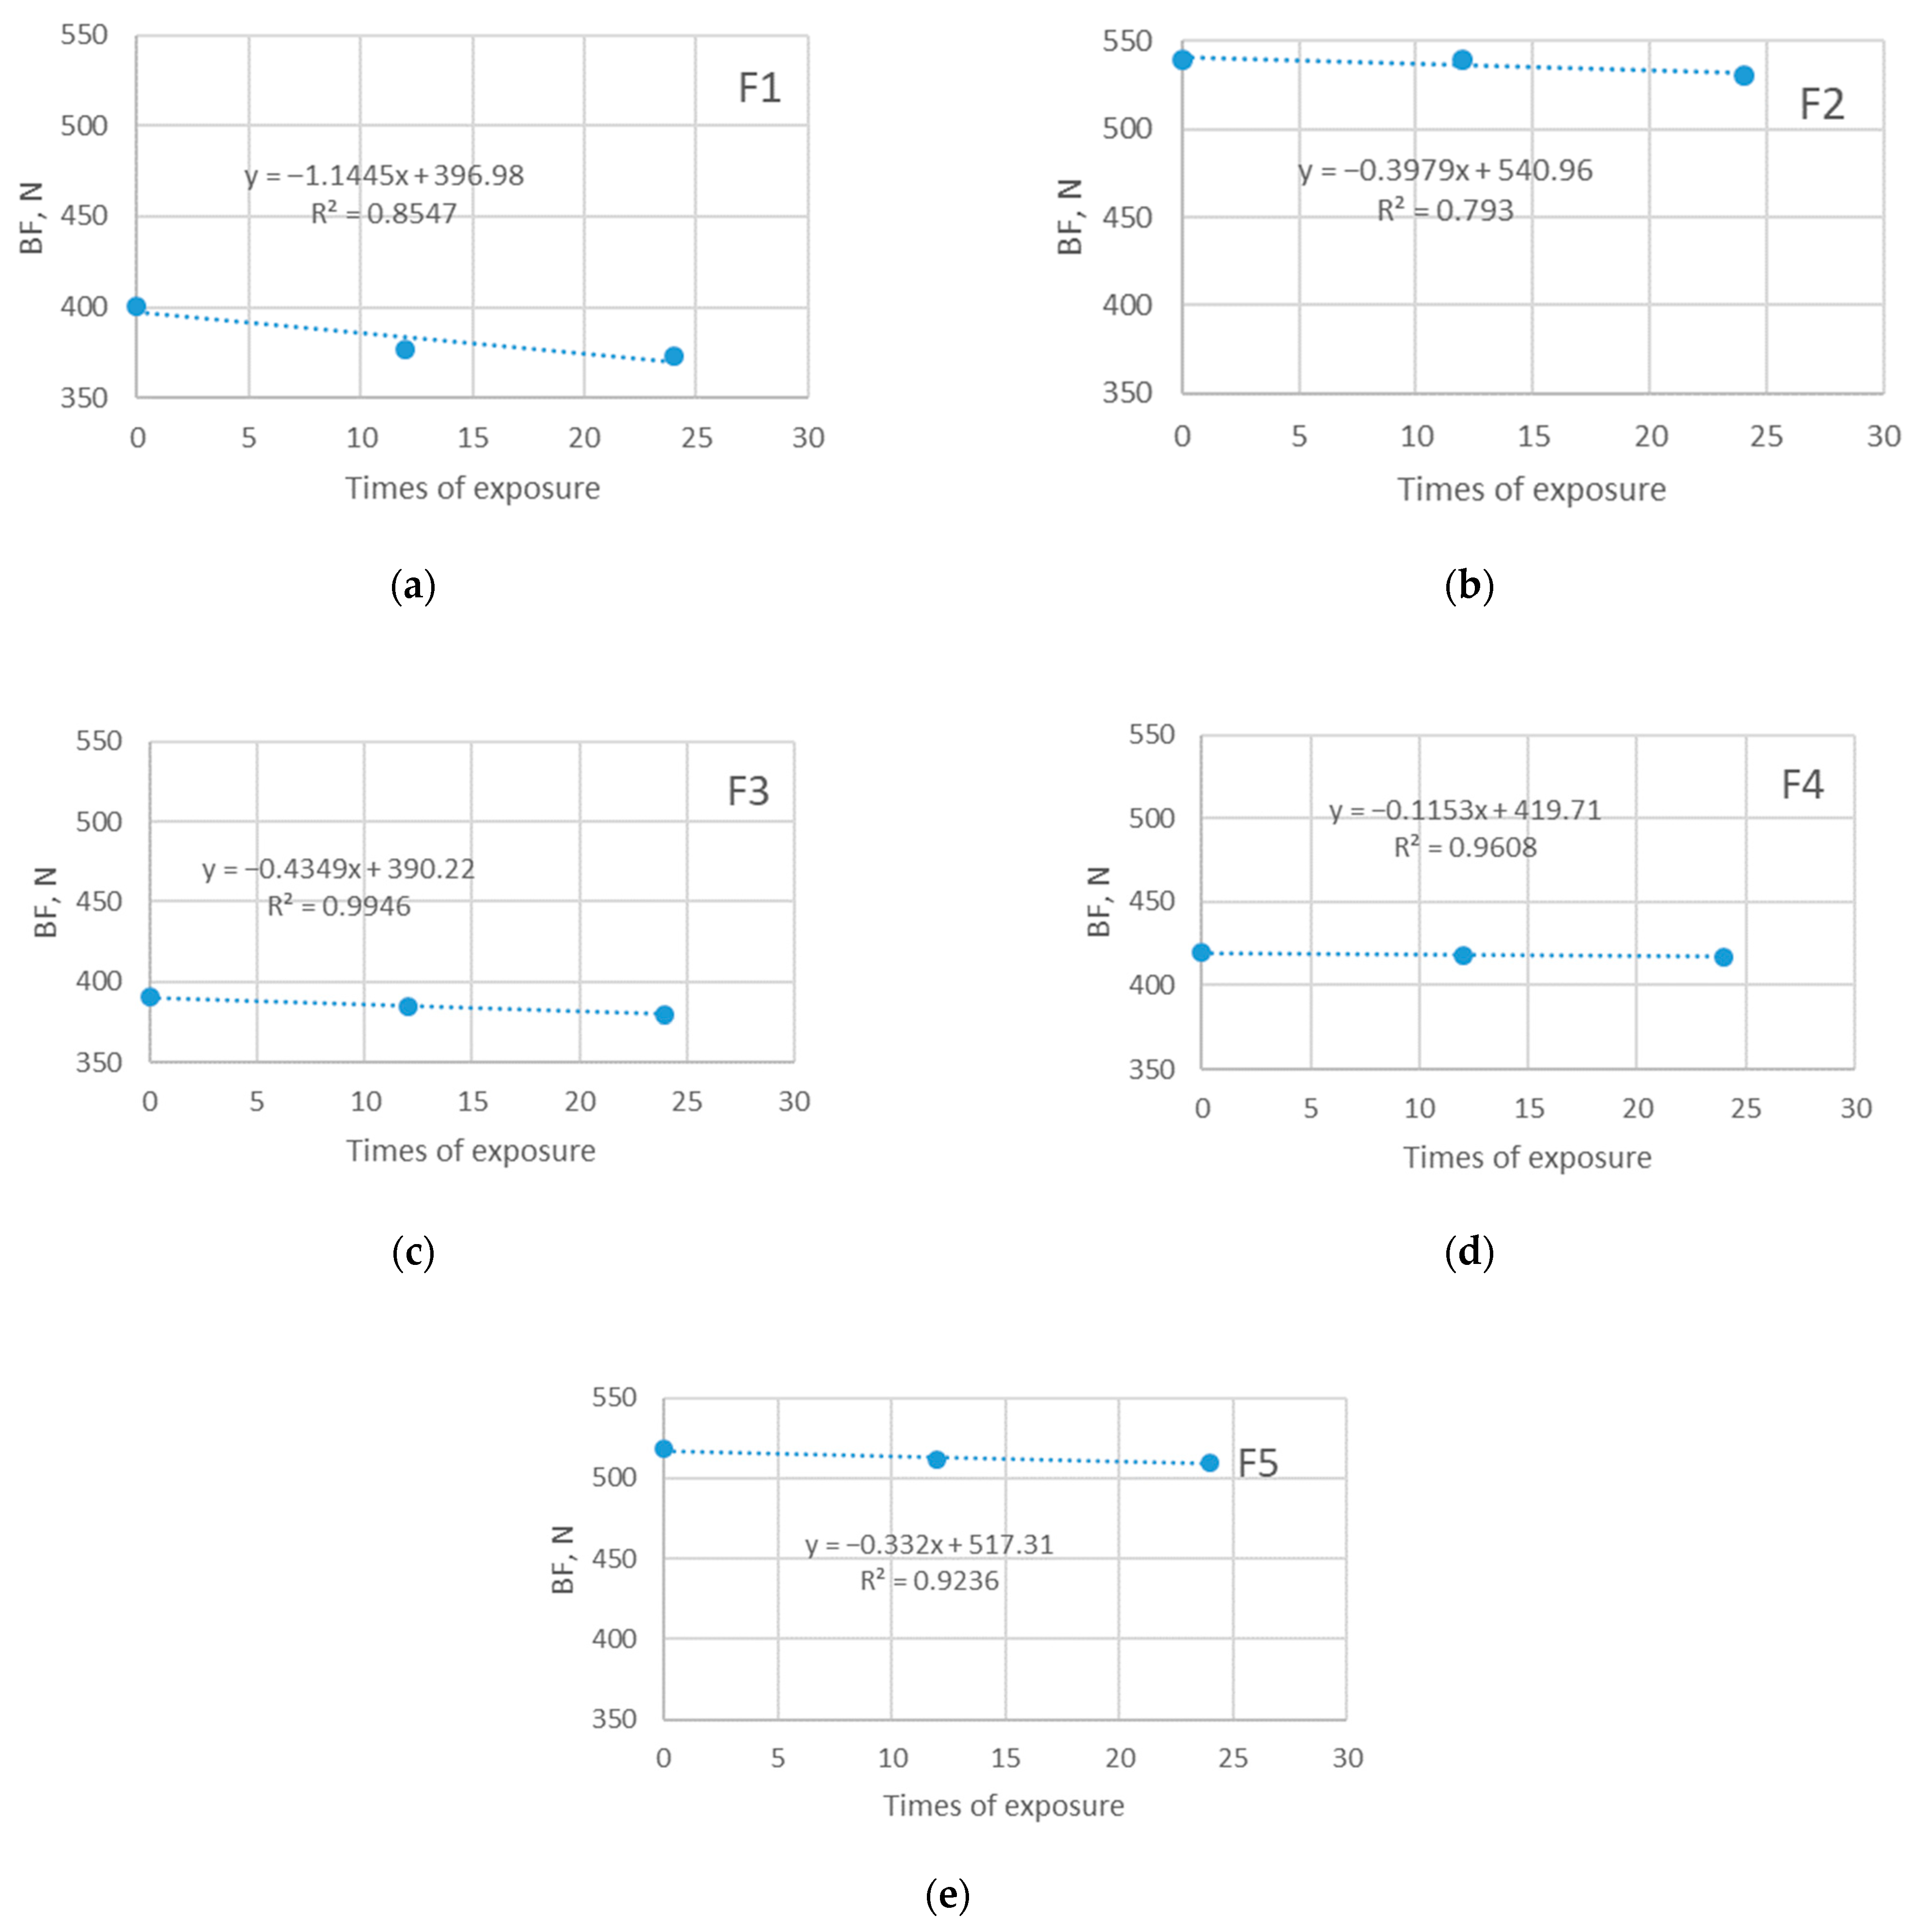
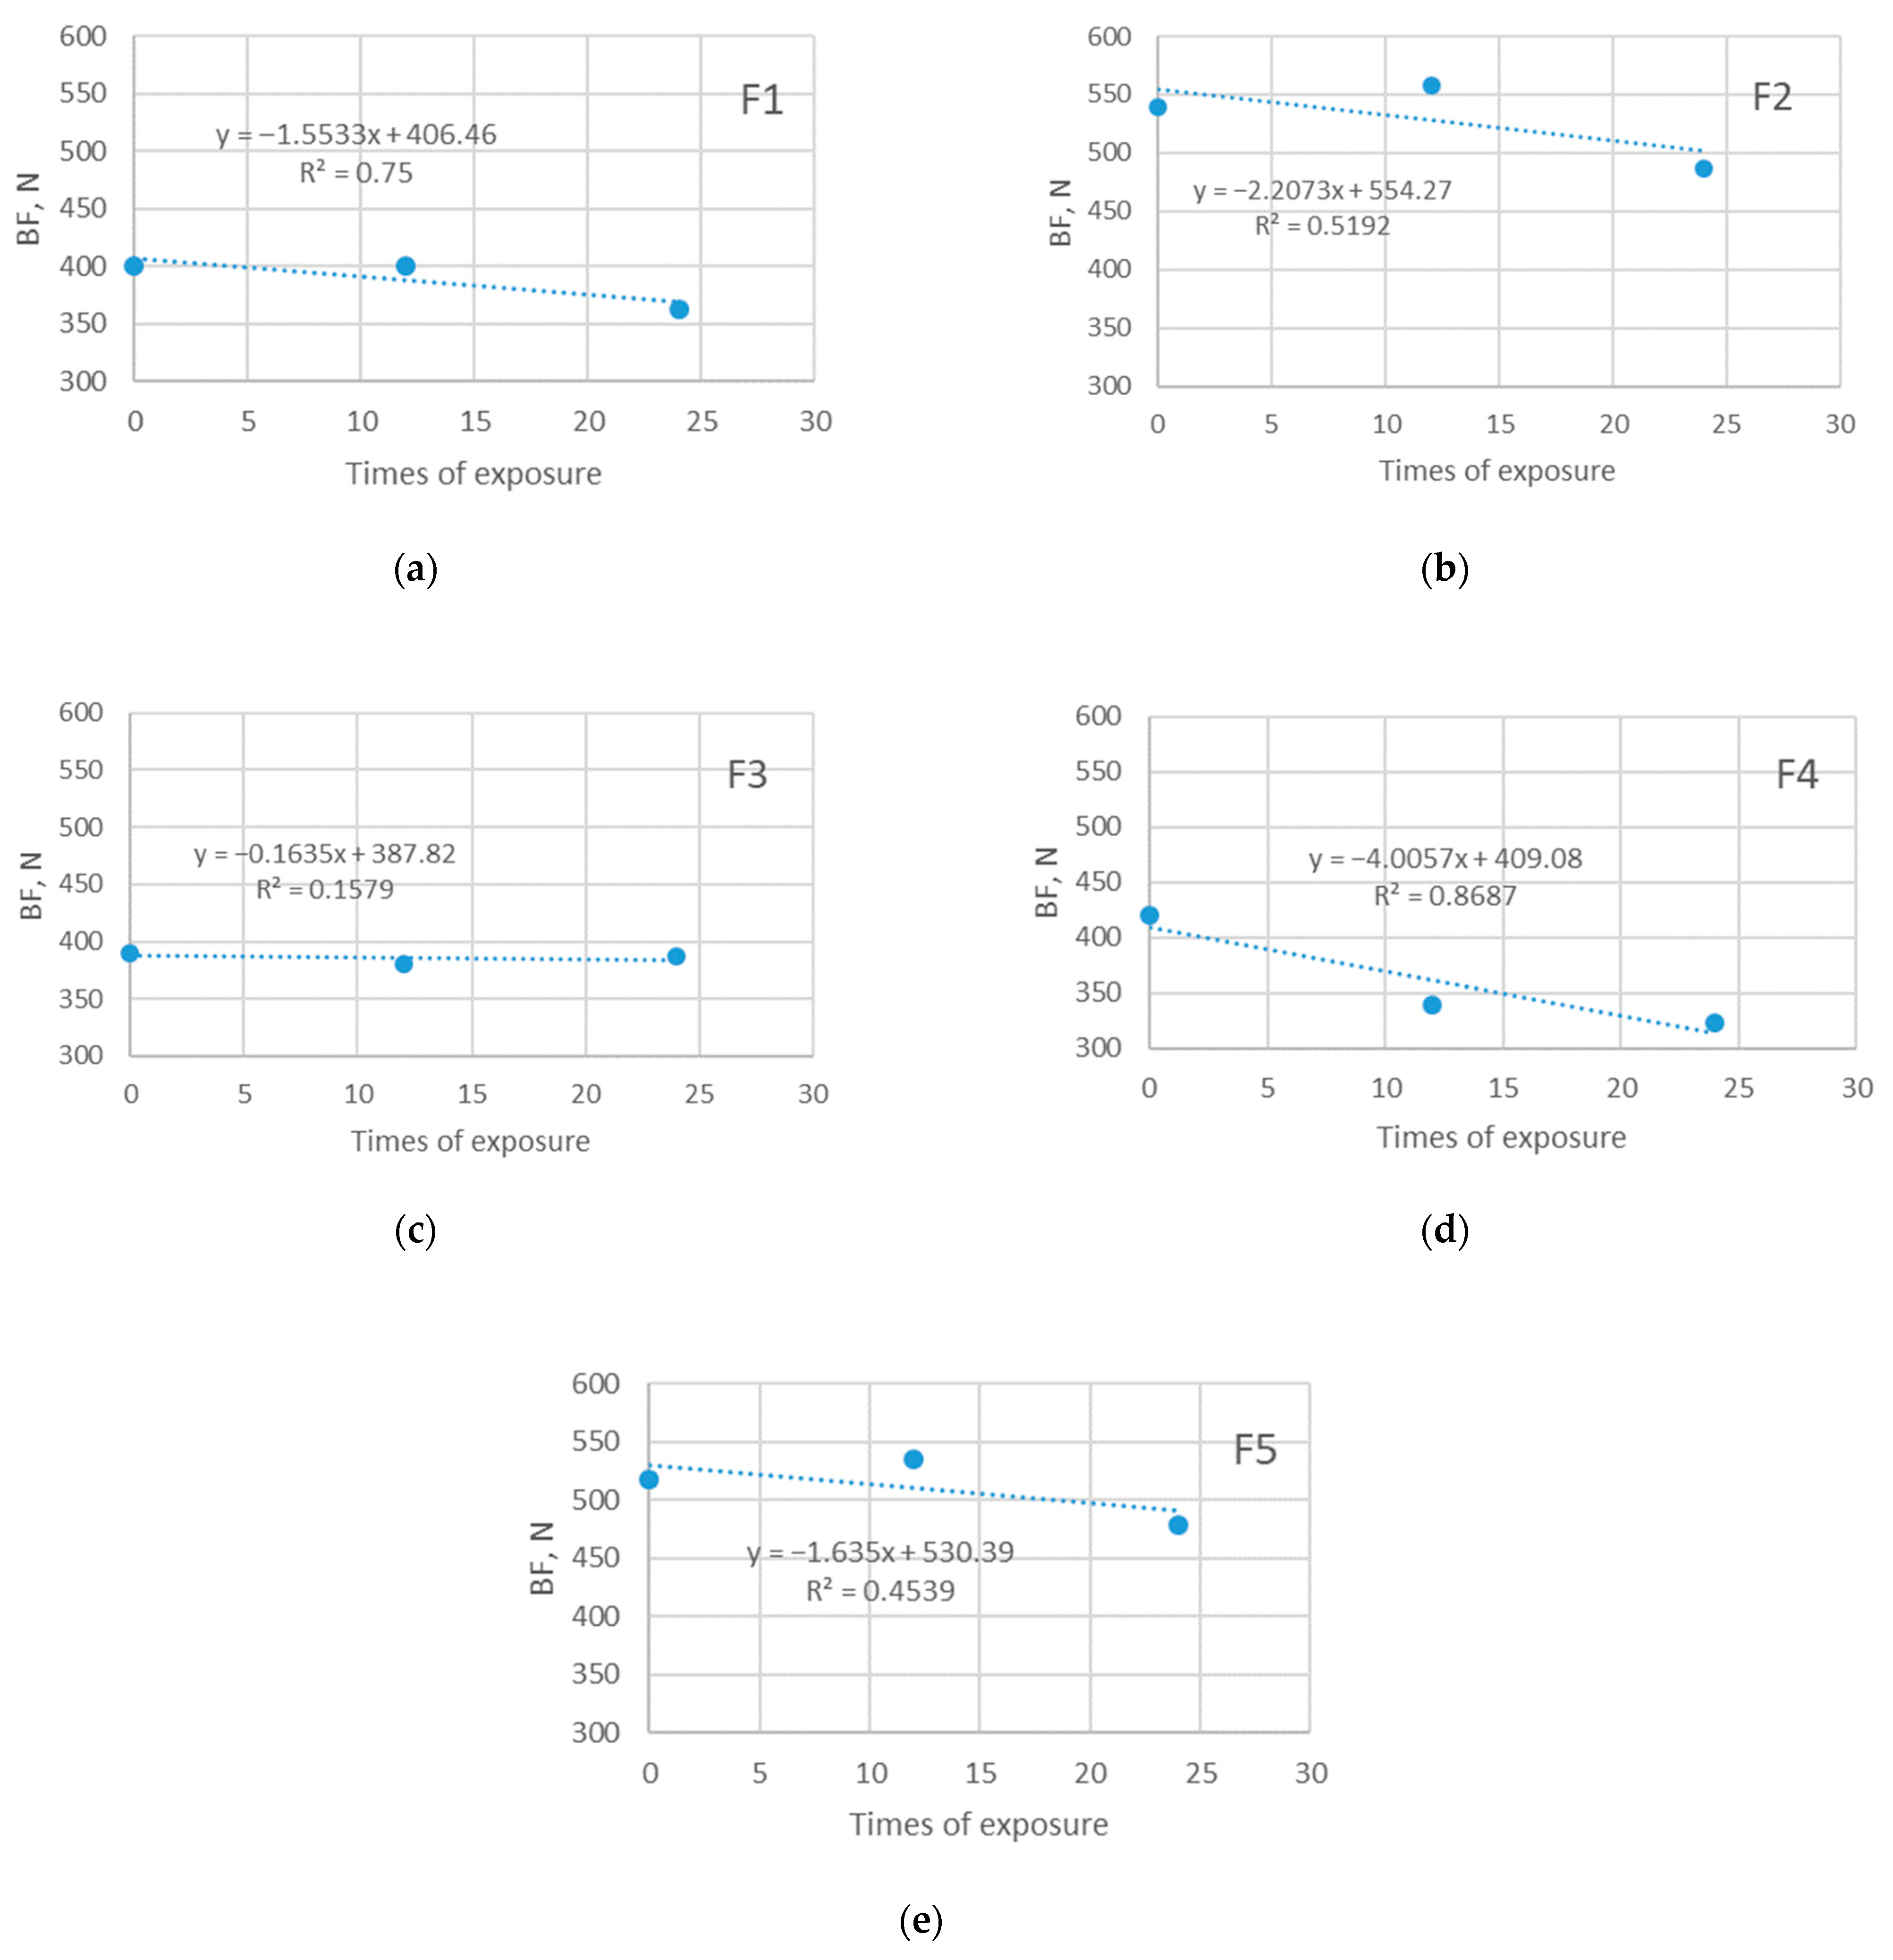
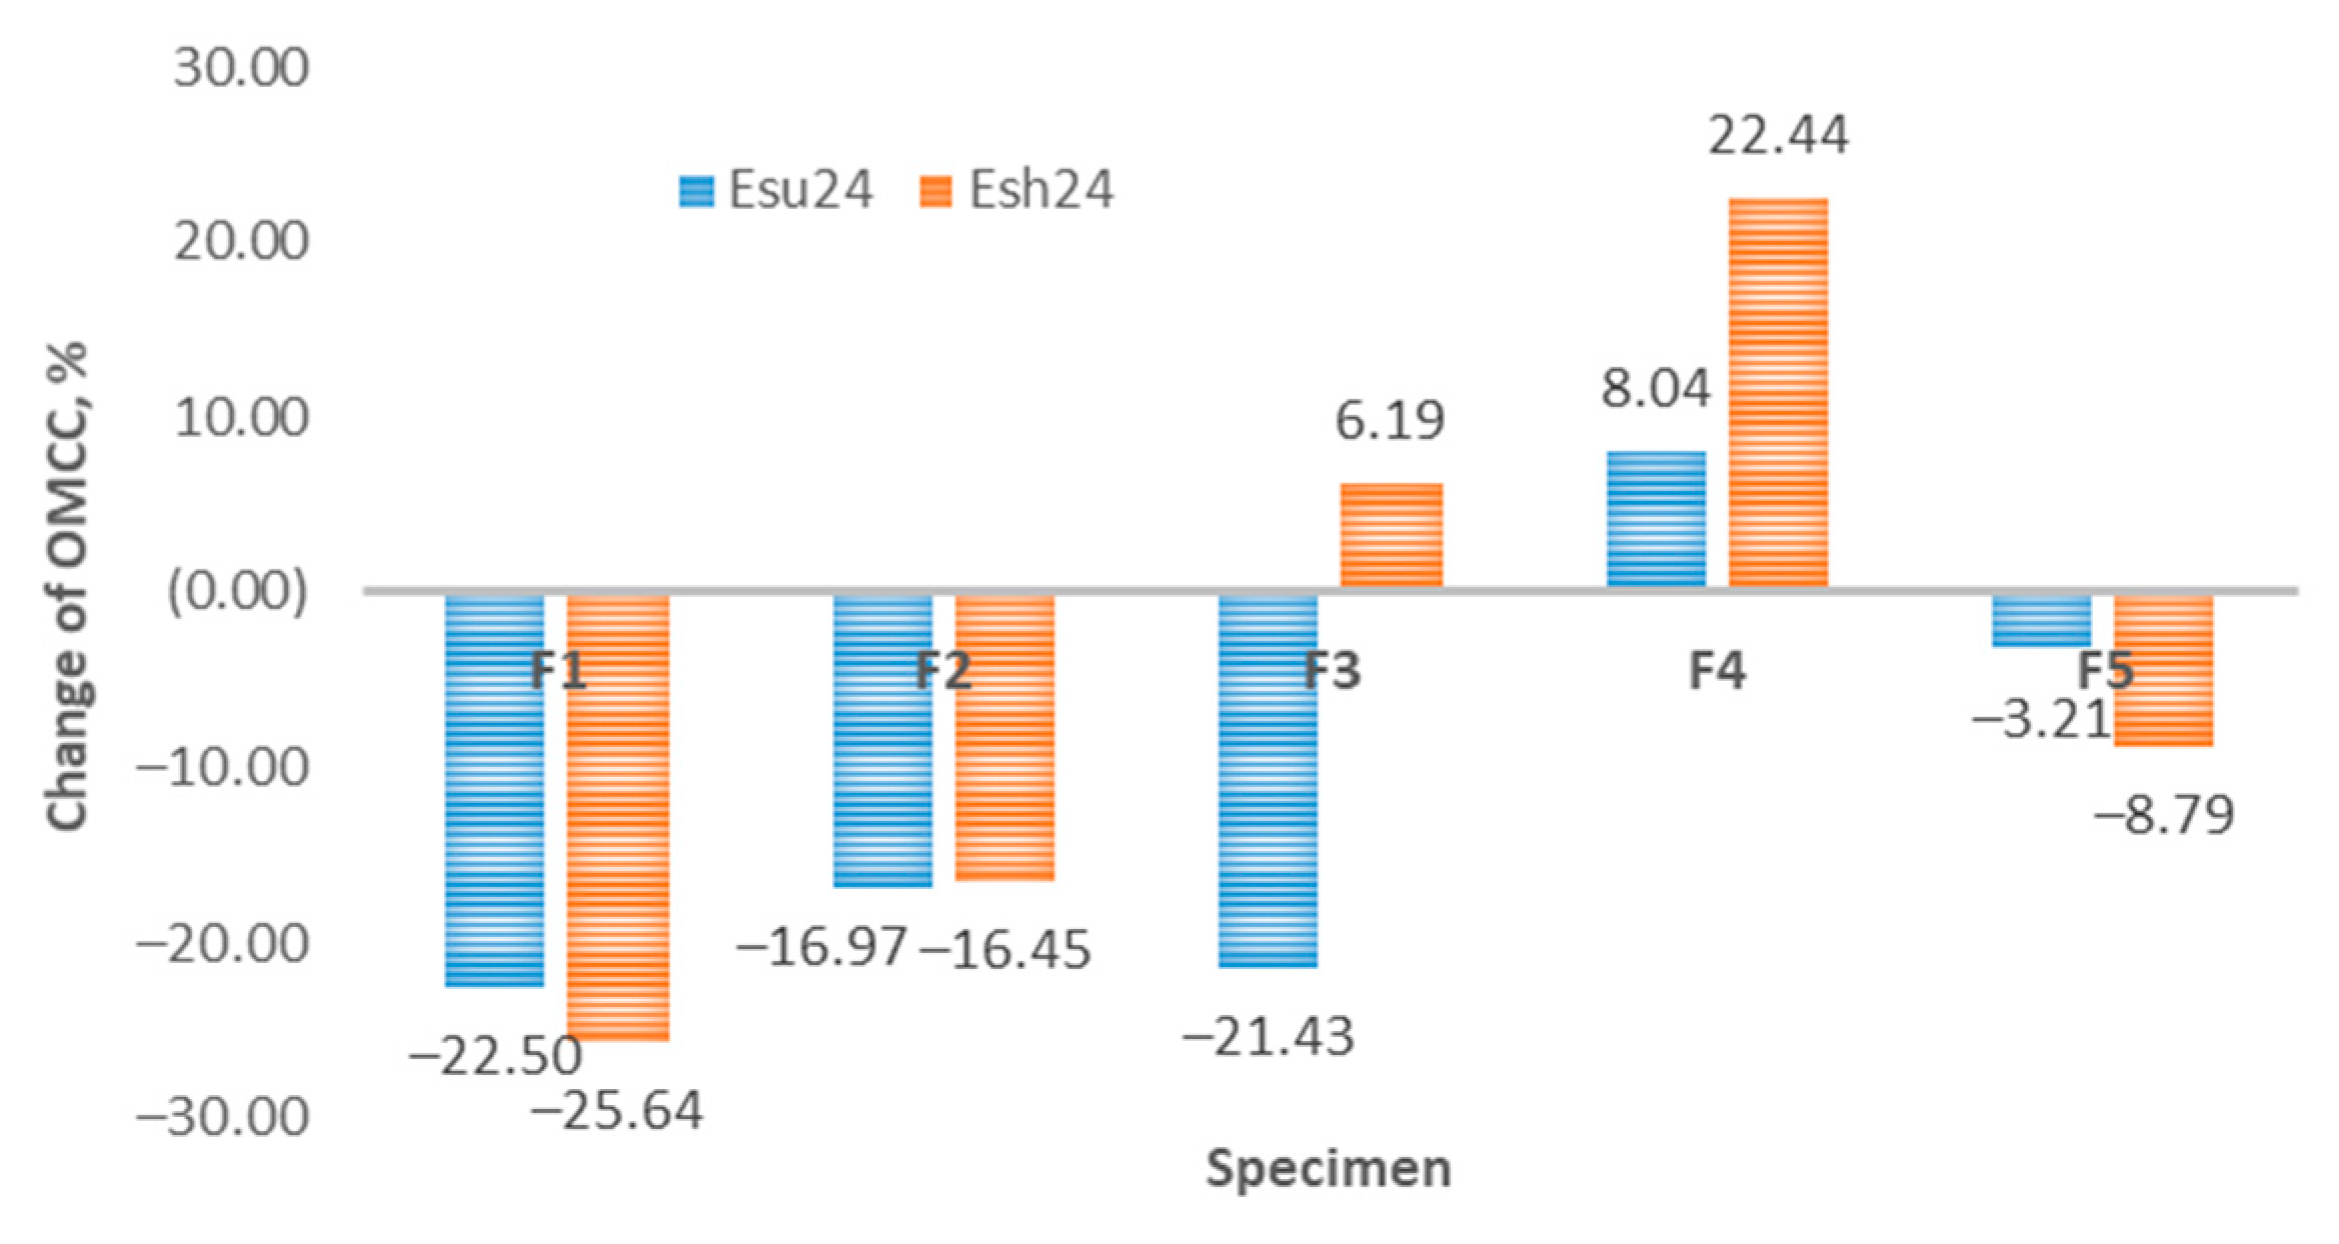
3.5. Results of Bursting Force Testing
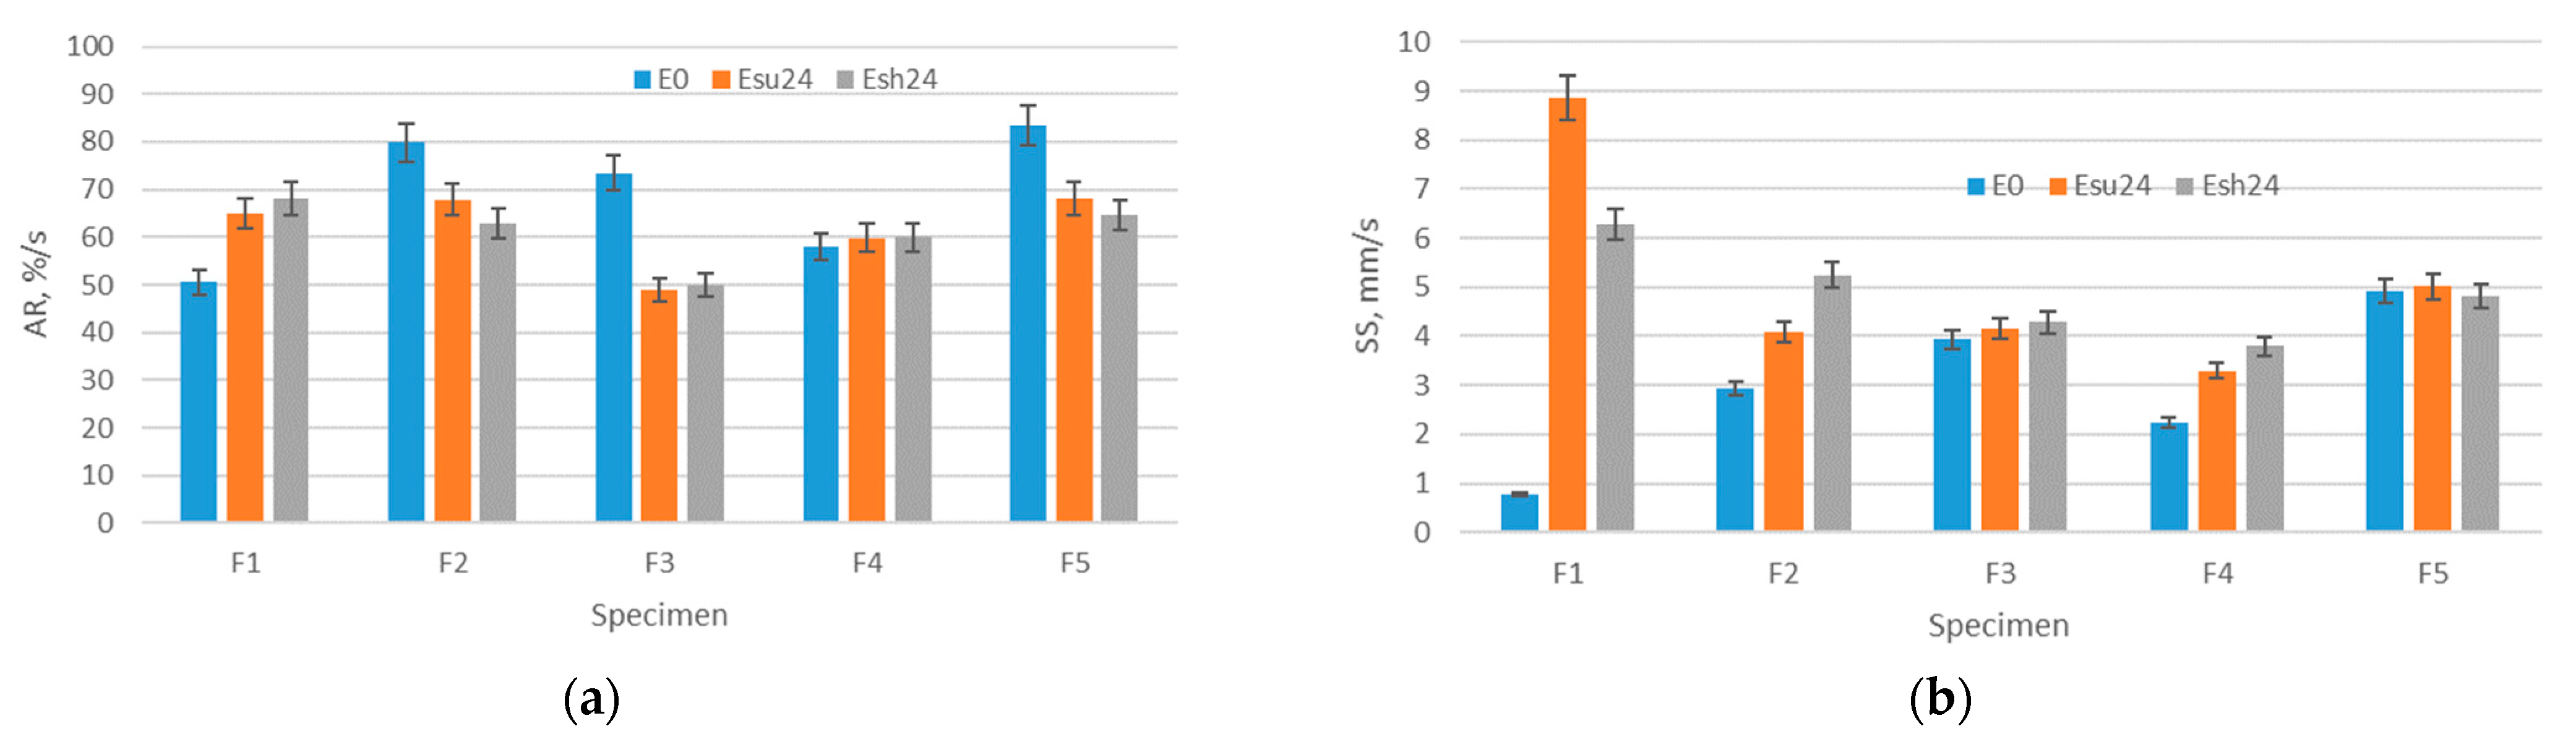
3.6. Results of Moisture Management Testing
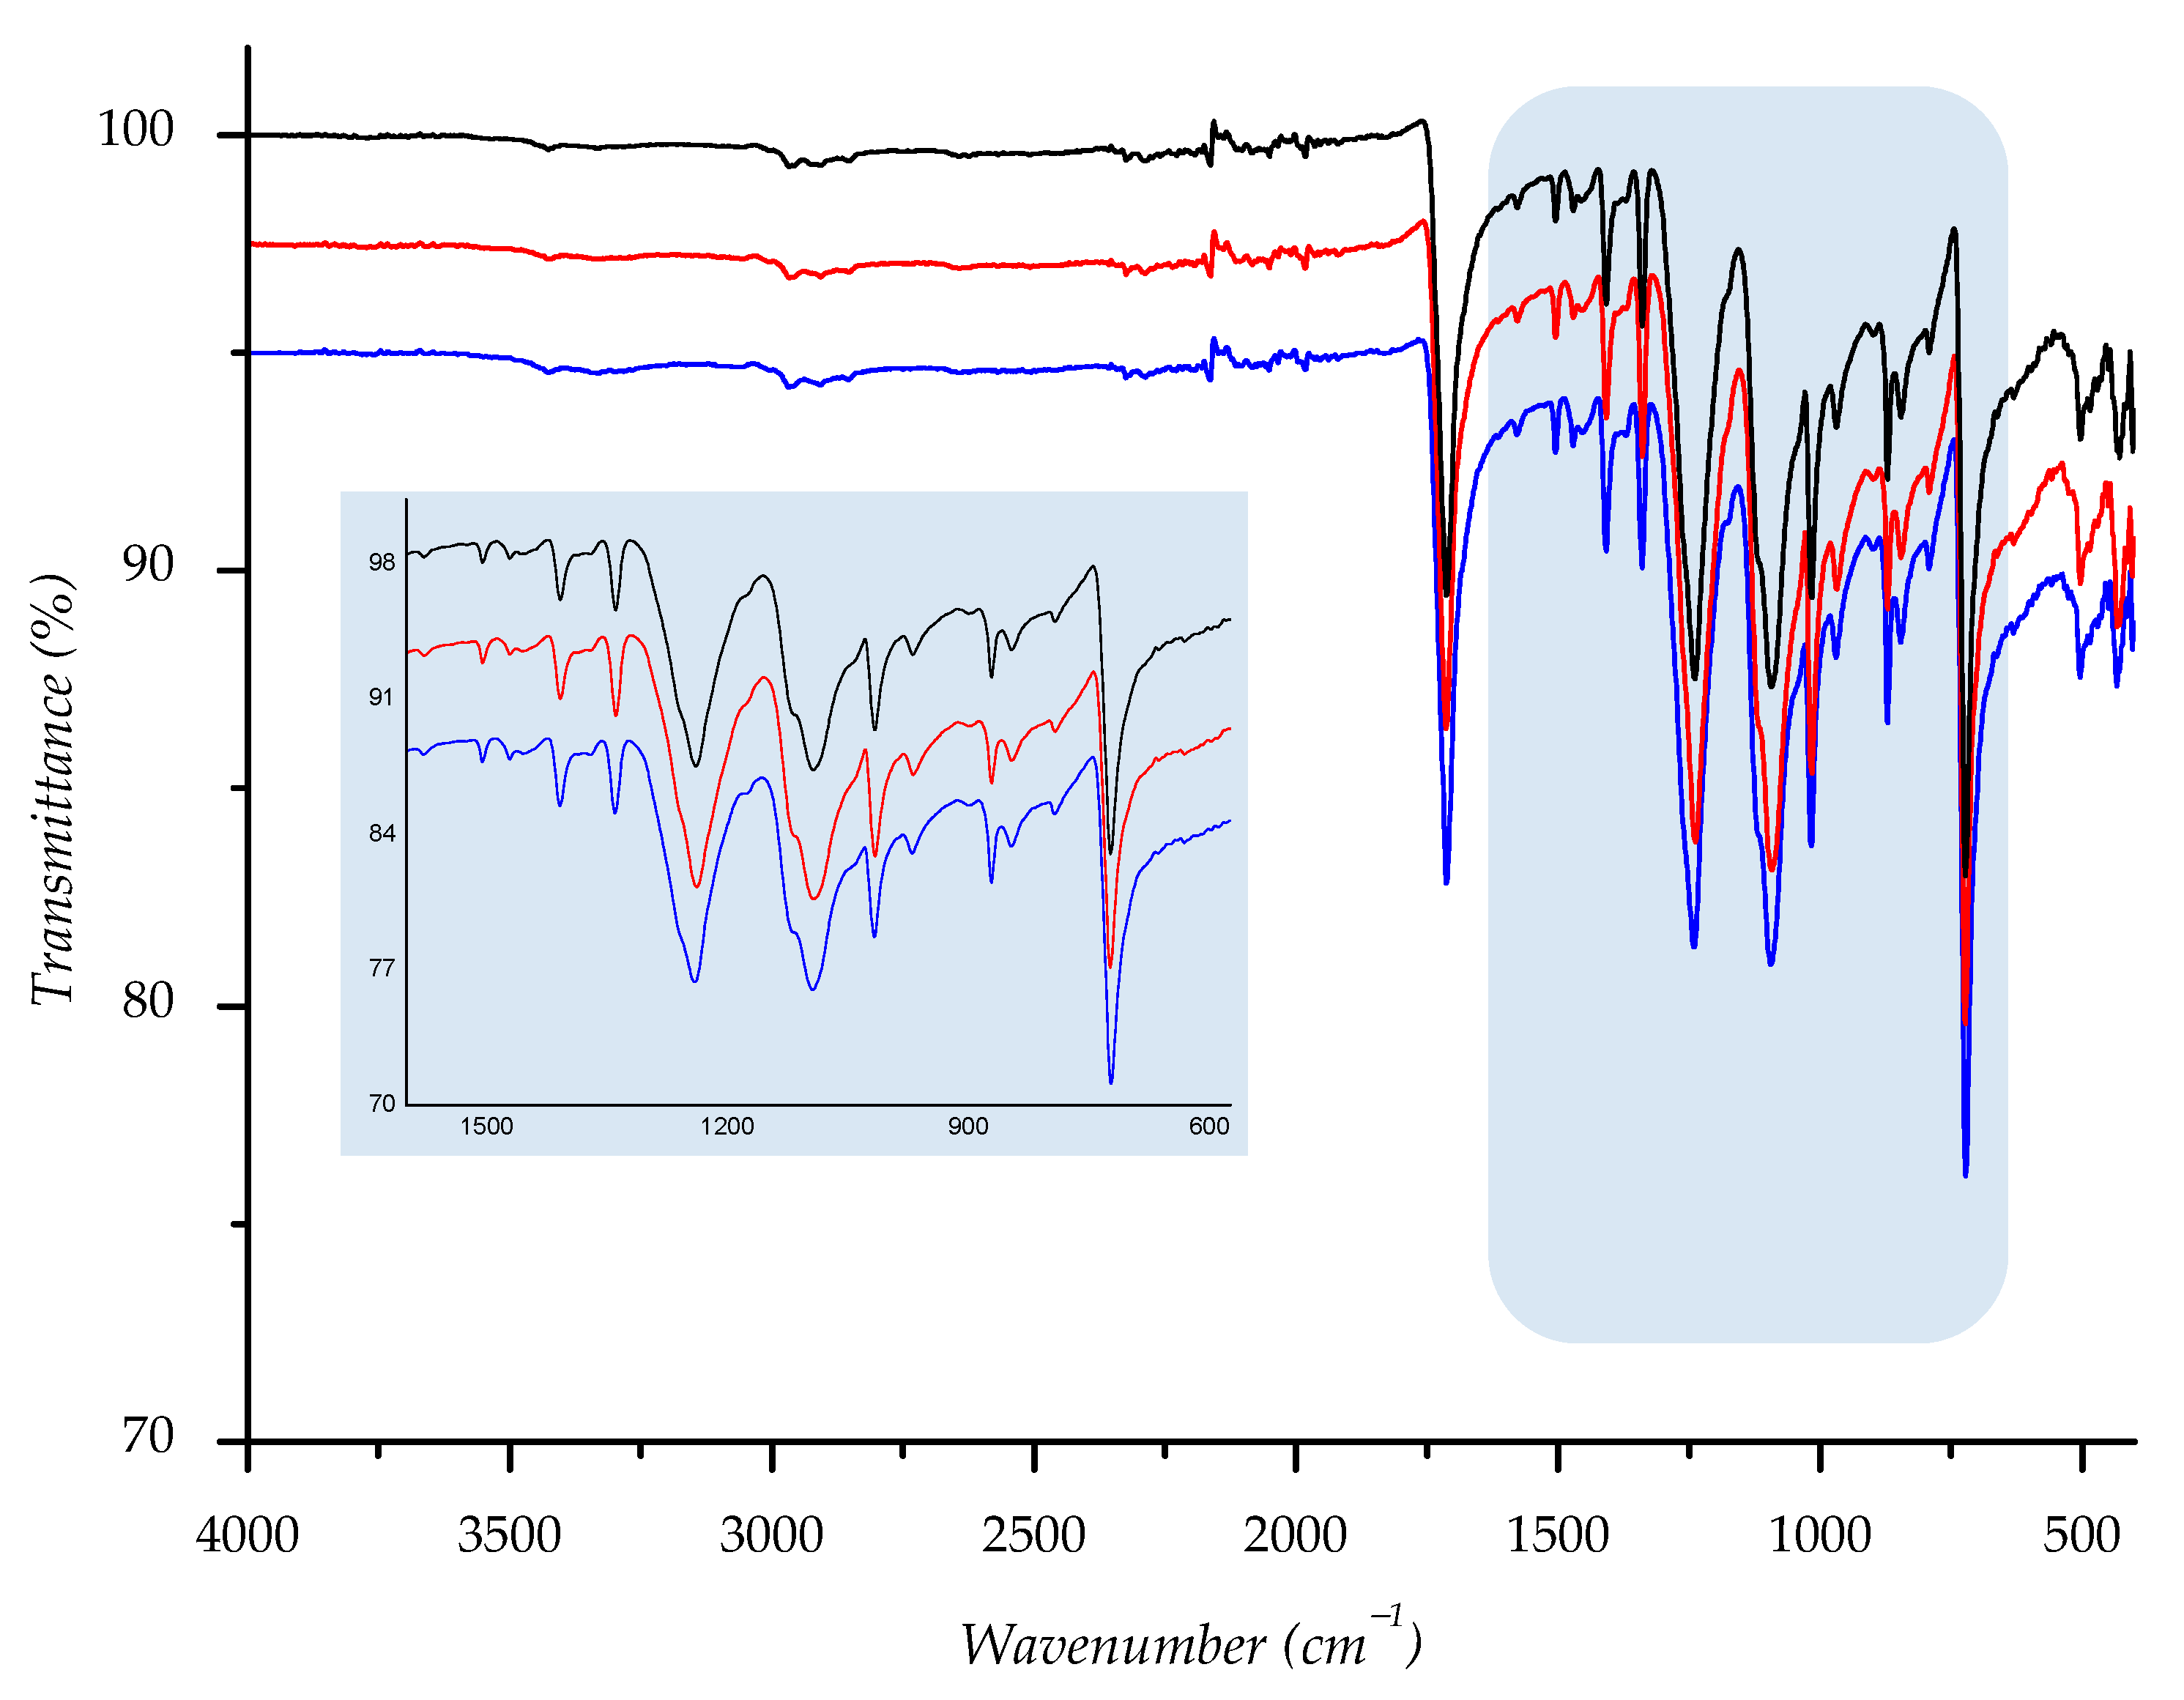
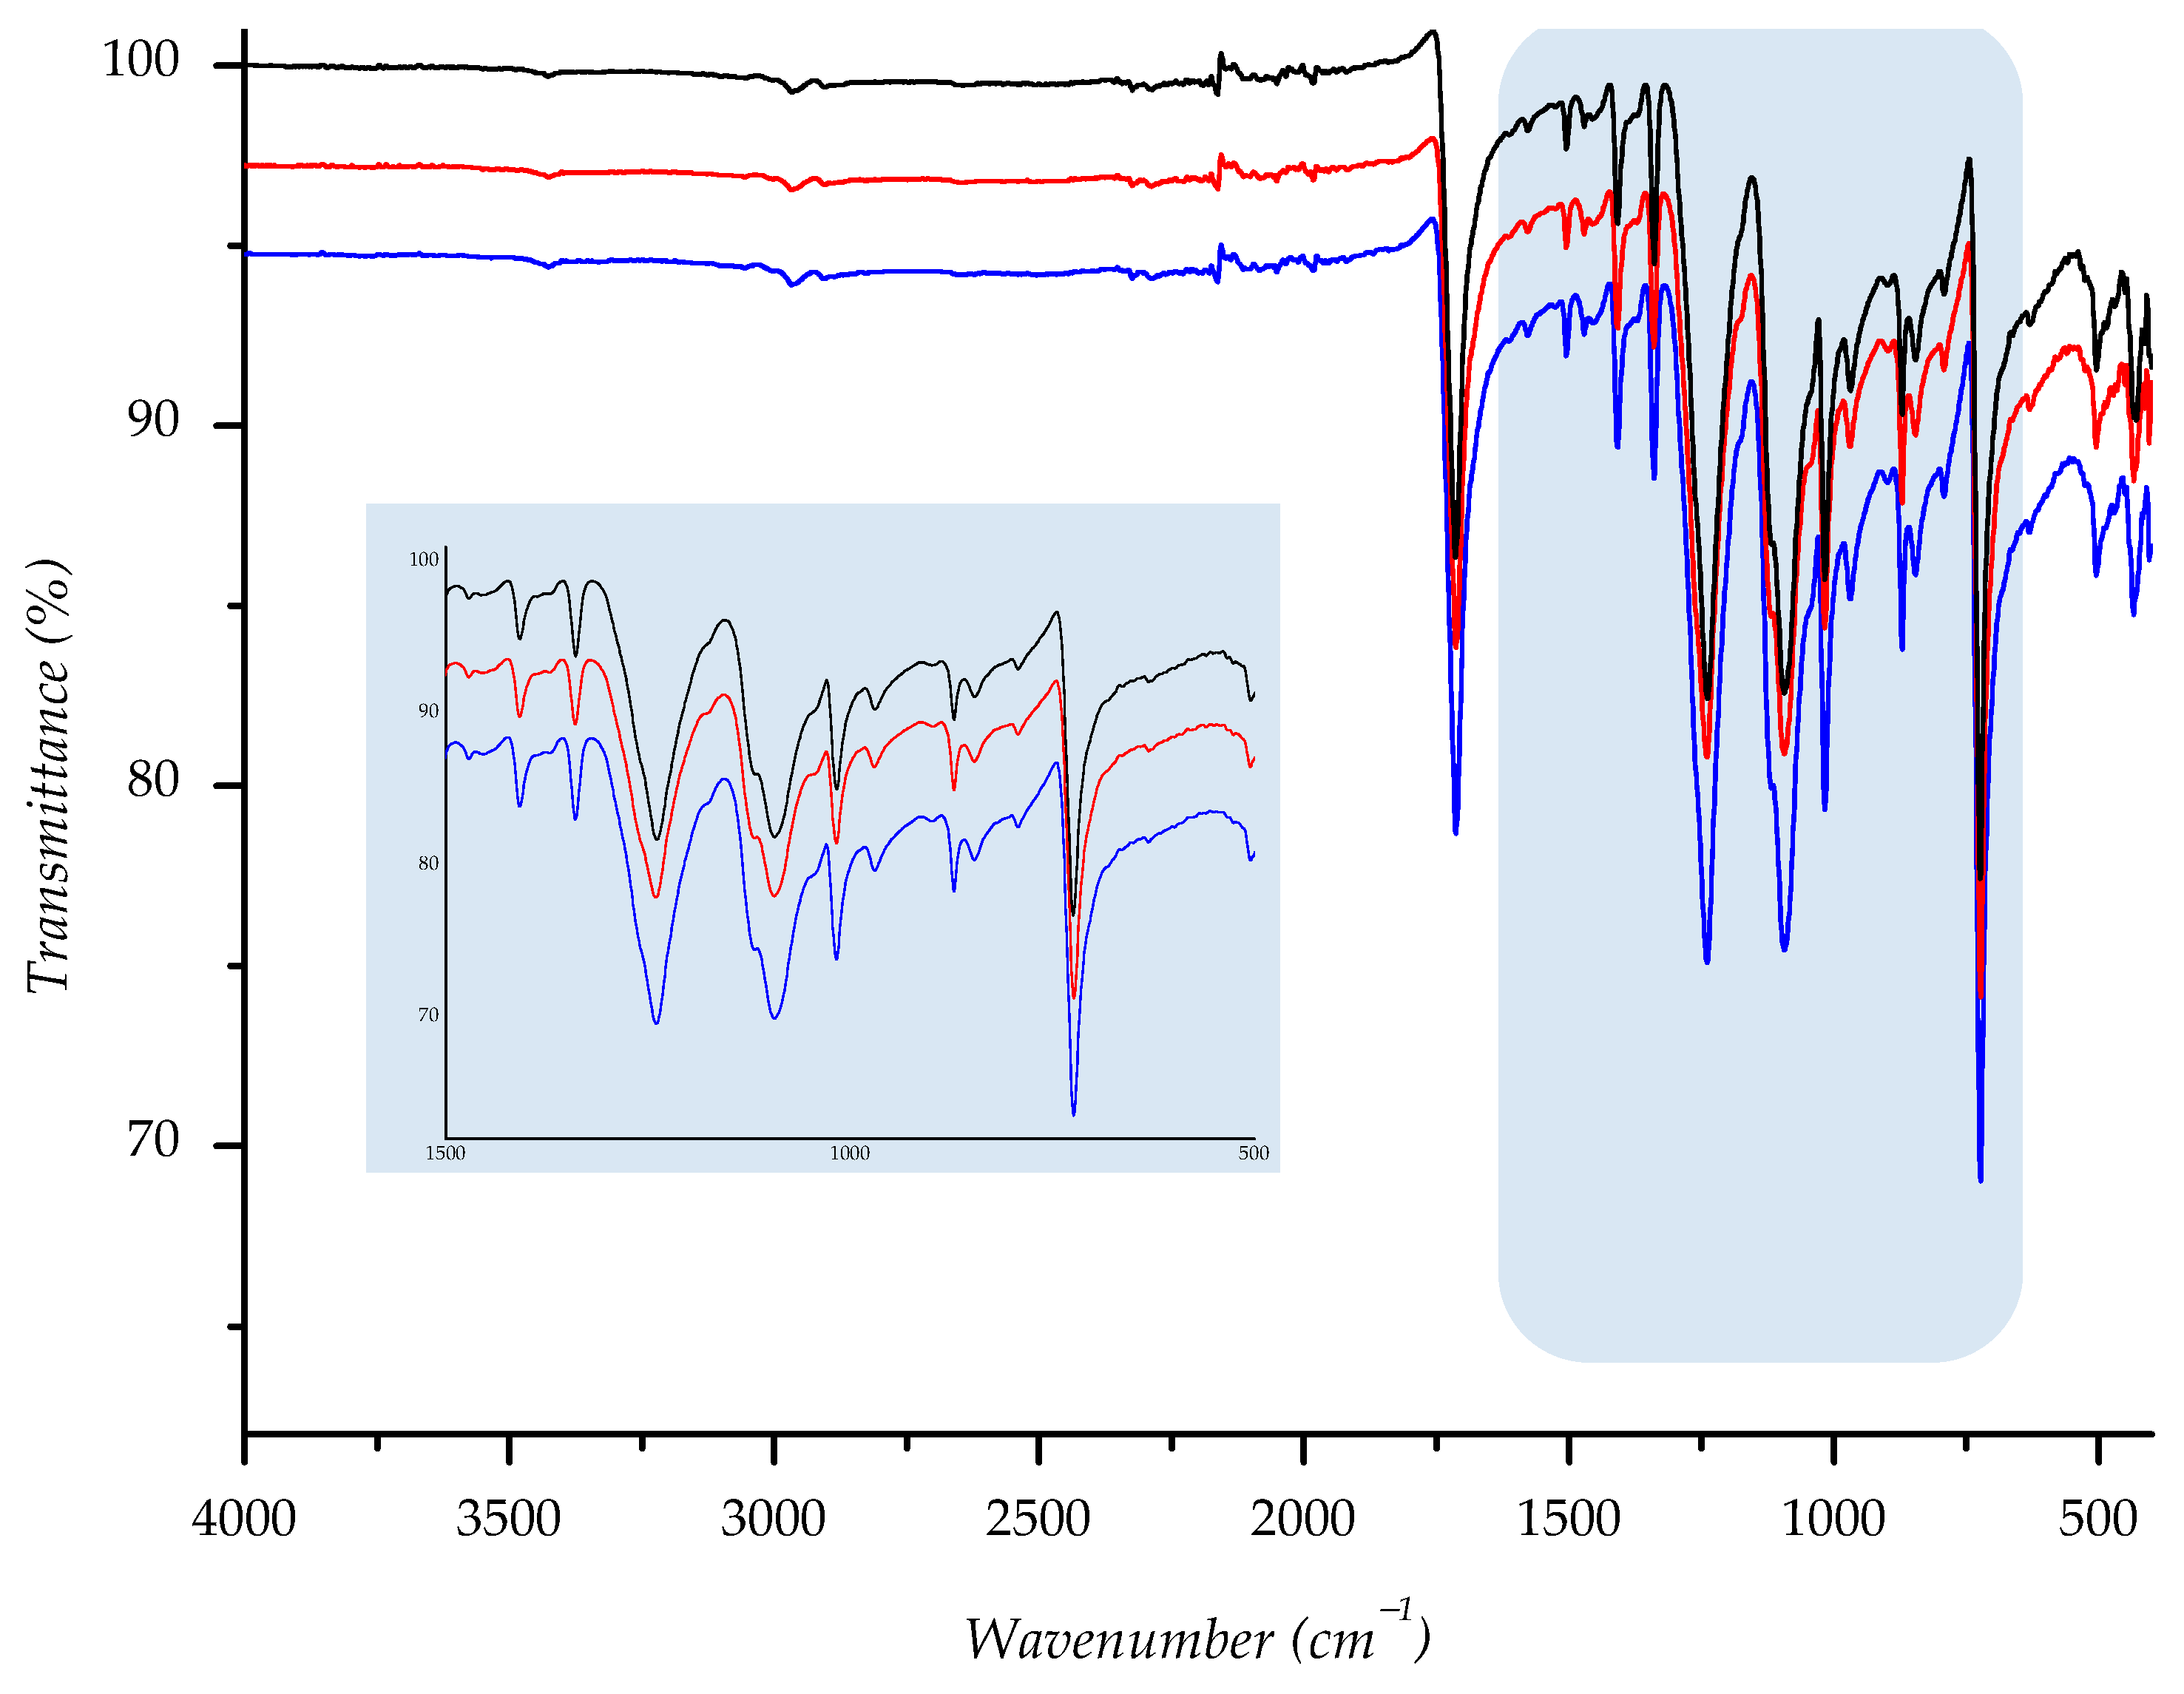
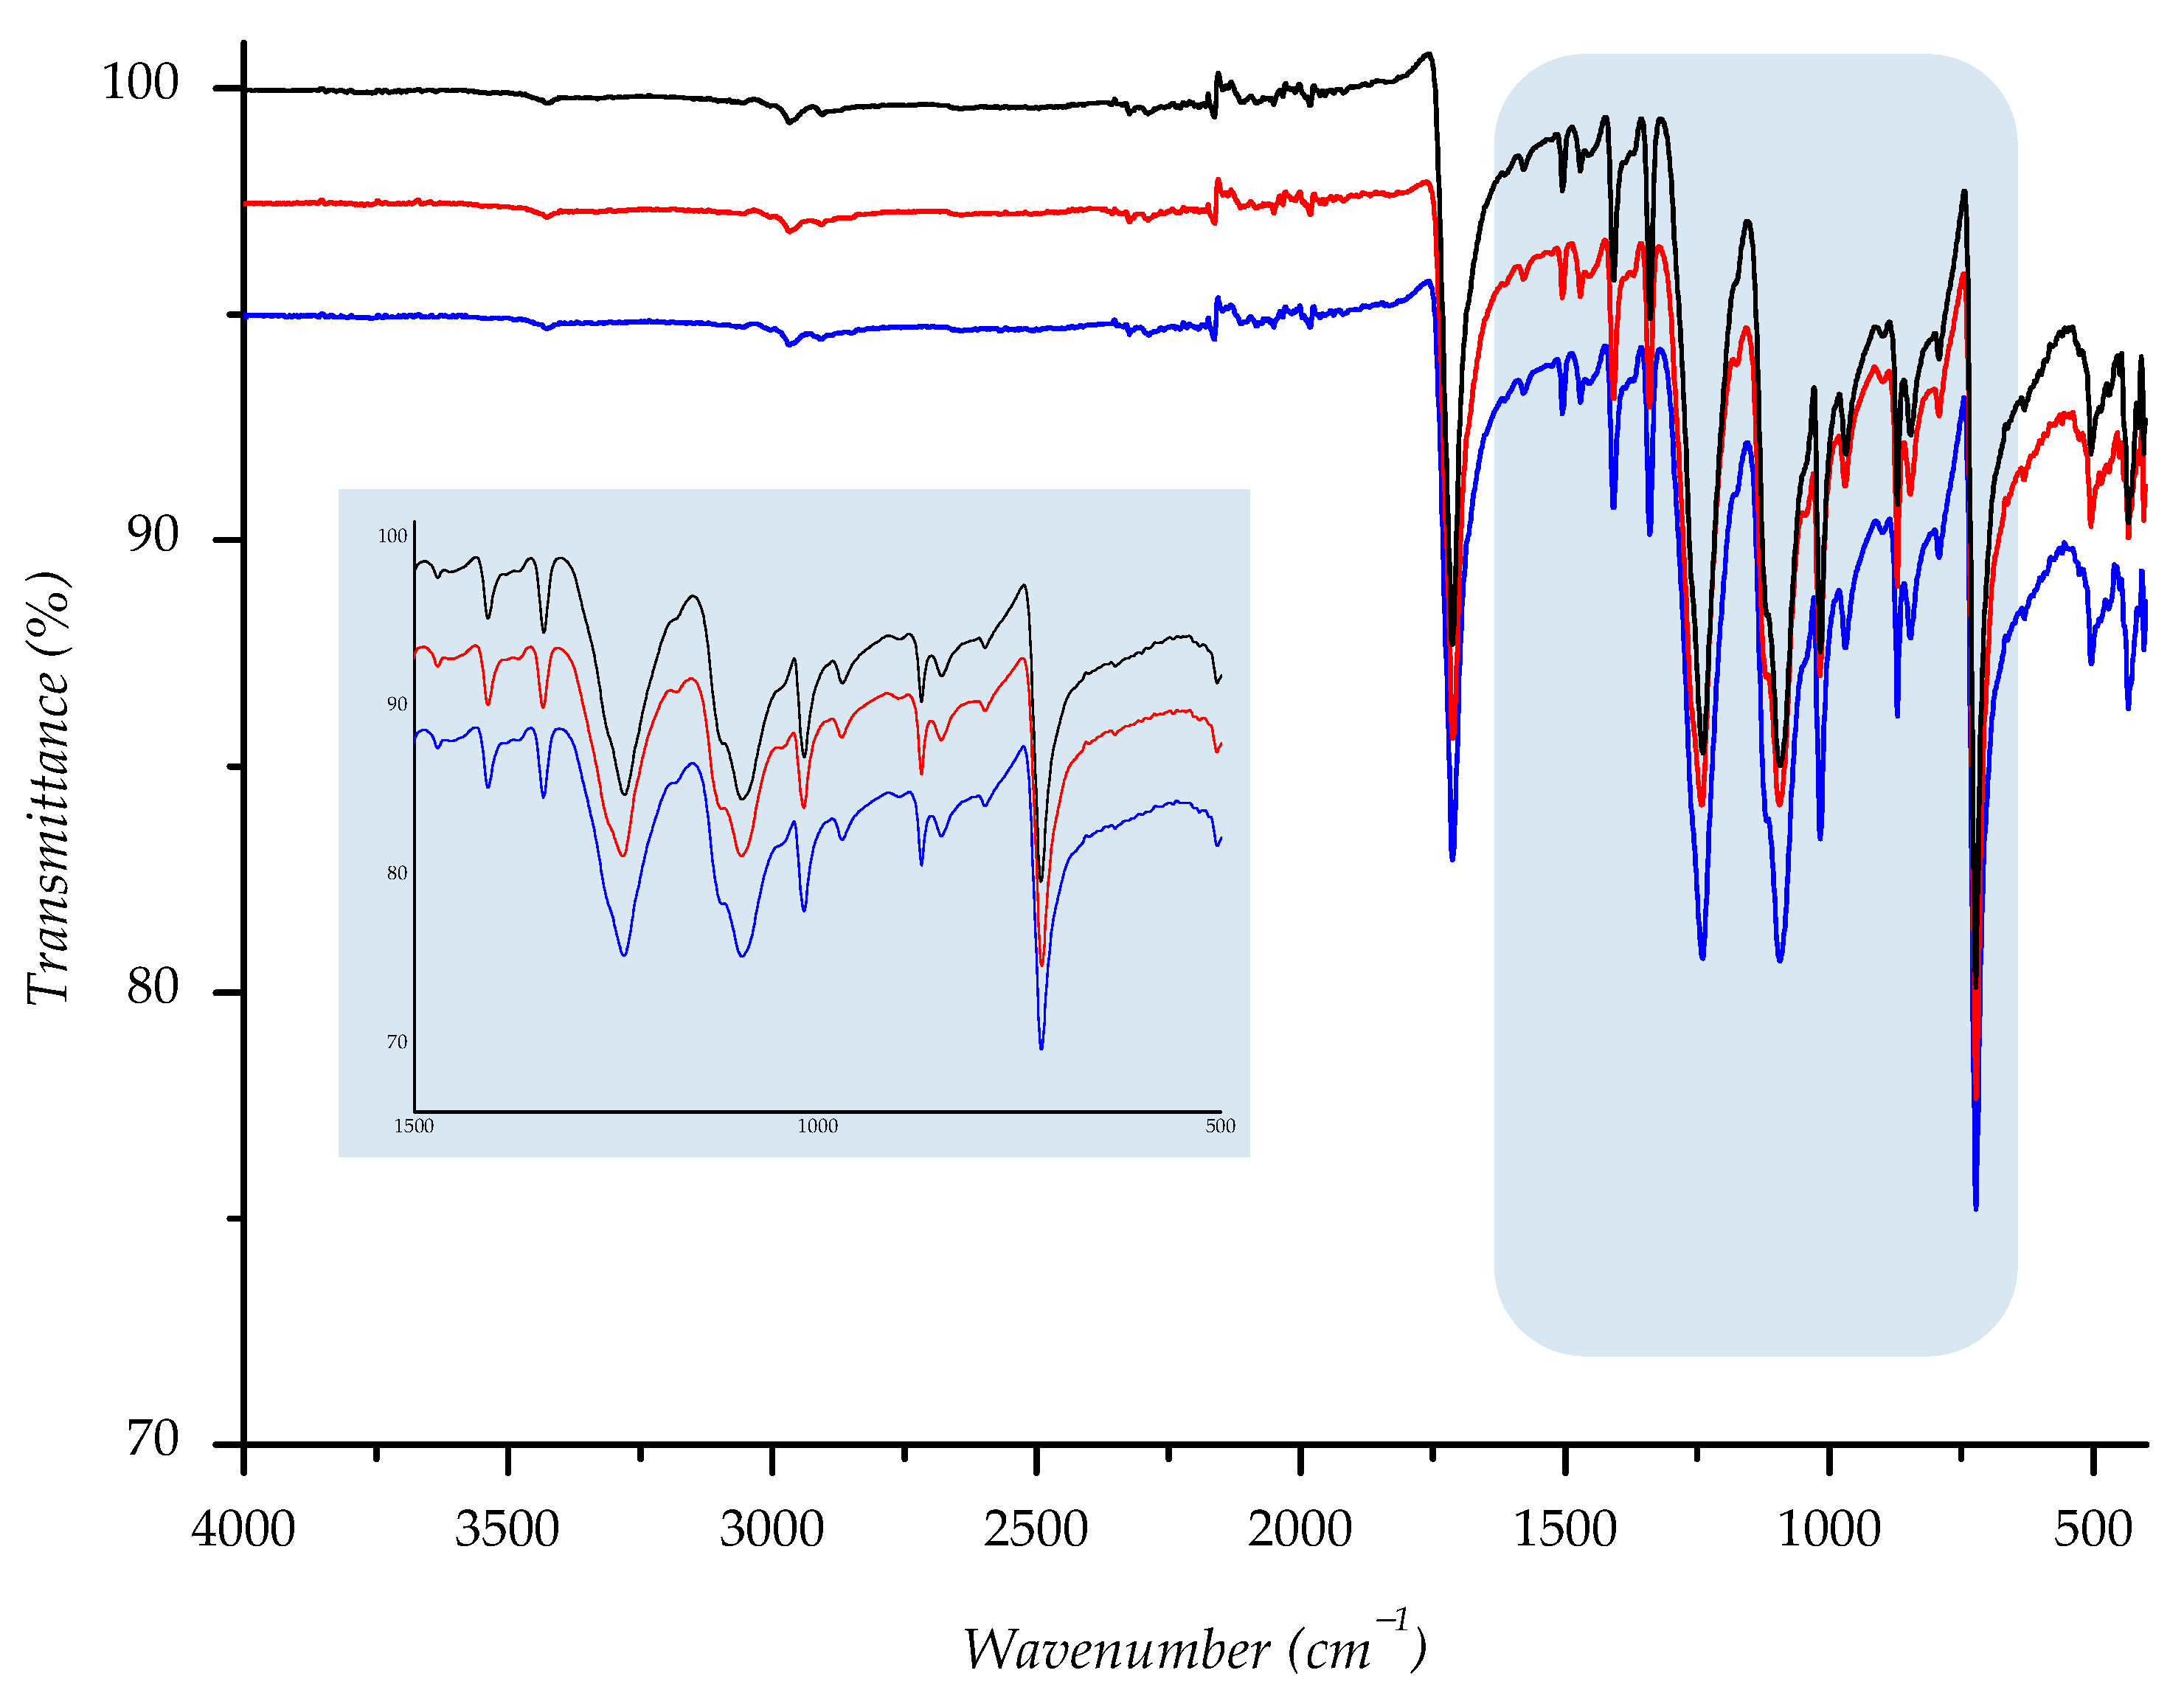
3.7. Results of FTIR Analysis
4. Conclusions
Supplementary Materials
Author Contributions
Funding
Institutional Review Board Statement
Informed Consent Statement
Data Availability Statement
Conflicts of Interest
References
- Wypych, G. Handbook of Material Weathering, 5th ed.; ChemTec Publishing: Scarborough, ON, Canada, 2013. [Google Scholar]
- Hayes, S.G.; Venkatraman, P. Materials and Technology for Sportswear and Performance Apparel, 1st ed.; E-Book—PDF; Taylor & Francis Group: New York, NY, USA, 2016. [Google Scholar]
- Deopura, B.L.; Alagirusamy, R.; Joshi, M.; Gupta, B. Polyesters and Polyamides, 1st ed.; E-Book; Woodhead Publishing Limited: Cambridge, UK, 2008. [Google Scholar]
- Shishoo, R. Textiles in Sport, 1st ed.; E-Book; Woodhead Publishing Limited: Cambridge, UK, 2005. [Google Scholar]
- Zhou, R.; Yu, J.; Qin, J. Comfort properties of modified knitted polyester fabrics. Melliand Int. 2014, 20, 38–41. [Google Scholar]
- Selli, F.; Hufenus, R.; Gooneie, A.; Erdogan, U.H.; Perret, E. Structure–Property Relationship in Melt-Spun Poly(hydroxybutyrate-co-3-hexanoate) Monofilaments. Polymers 2022, 14, 200. [Google Scholar] [CrossRef] [PubMed]
- Pliquet, M.; Rapeaux, M.; Delange, F.; Bussiere, P.; Therias, S.; Gardette, J. Multiscale analysis of the thermal degradation of polyamide 6,6: Correlating chemical structure to mechanical properties. Polym. Degrad. Stab. 2021, 185, 109496. [Google Scholar] [CrossRef]
- Marjo, C.E.; Gatenby, S.; Rich, A.M.; Gong, B.; Chee, S. ATR-FTIR as a tool for assessing potential for chemical aging in Spandex/Lycra®/elastane-based fabric collections. Stud. Conserv. 2016, 62, 343–353. [Google Scholar] [CrossRef]
- Čubrić, G.; Salopek Čubrić, I.; Rogale, D.; Rogale, S.F. Mechanical and Thermal Properties of Polyurethane Materials and Inflated Insulation Chambers. Materials 2021, 14, 1541. [Google Scholar] [CrossRef]
- Lacruz, A.; Salvador, M.; Blanco, M.; Vidal, K.; Goitandia, A.M.; Martinková, L.; Kyselka, M.; de Ilarduya, A.M. Biobased Waterborne Polyurethane-Urea/SWCNT Nanocomposites for Hydrophobic and Electrically Conductive Textile Coatings. Polymers 2021, 13, 1624. [Google Scholar] [CrossRef]
- Değırmenci, Z. Study on the Loss of Strength of Denim-like Knitted Fabrics after Different Washing Treatments. Fibres Text. East. Eur. 2017, 25, 98–105. [Google Scholar] [CrossRef]
- Andersen, E.; Mikkelsen, R.; Hinge, M. Real-time aging of polyesters with varying diols. Mater. Chem. Phys. 2021, 261, 124240. [Google Scholar] [CrossRef]
- Salopek Čubrić, I.; Potočić Matković, V.M.; Skenderi, Z.; Tarbuk, A. Impact of substrate on water vapour resistance of naturally weathered coated fabrics. Text. Res. J. 2017, 87, 1541–1553. [Google Scholar] [CrossRef]
- Matković, V.M.P.; Čubrić, I.S.; Skenderi, Z. Thermal resistance of polyurethane-coated knitted fabrics before and after weathering. Text. Res. J. 2014, 84, 2015–2025. [Google Scholar] [CrossRef]
- Salopek Čubrić, I.; Potočić Matković, V.M.; Skenderi, Z. Changes of the Knitted Fabric Properties due to Exposure to Outdoor Natural Weathering. J. Eng. Fibers Fabr. 2014, 9, 90–96. [Google Scholar] [CrossRef] [Green Version]
- Salopek Čubrić, I.; Čubrić, G. Behavior of Knitted Fabrics Exposed to Natural Aging. Melliand Int. 2021, 27, 73–75. [Google Scholar]
- Salopek Čubrić, I.; Čubrić, G.; Potočić Matković, V.M. Behavior of Polymer Materials Exposed to Aging in the Swimming Pool: Focus on Properties That Assure Comfort and Durability. Polymers 2021, 13, 2414. [Google Scholar] [CrossRef]
- Smith, C.; Havenith, G. Body mapping of sweating patterns in athletes: A sex comparison. Med. Sci. Sports Exerc. 2012, 44, 2350–2361. [Google Scholar] [CrossRef] [PubMed] [Green Version]
- Salopek Čubrić, I.; Čubrić, G. Body-mapping based on thermographic measurements under different influencing factors. Sigurnost 2021, 63, 143–154. [Google Scholar] [CrossRef]
- Wang, F.; Shi, W.; Lu, Y.; Song, G.; Rossi, R.M.; Anaheim, S. Effects of moisture content and clothing fit on clothing apparent “wet” thermal insulation: A thermal manikin study. Text. Res. J. 2015, 86, 57–63. [Google Scholar] [CrossRef]
- Matusiak, M. Thermal Comfort Index as a Method of Assessing the Thermal Comfort of Textile Materials. Fibres Text. East. Eur. 2010, 18, 45–50. [Google Scholar]
- Merla, A.; Mattei, P.A.; Di Donato, L.; Romani, G.L. Thermal imaging of cutaneous temperature modifications in runners during graded exercise. Annf. Biomed. Eng. 2010, 38, 158–163. [Google Scholar] [CrossRef]
- Mijović, B.; Salopek Čubrić, I.; Skenderi, Z.; Reischl, U. Thermographic Assessment of Sweat Evaporation within Different Clothing Systems. Fibres Text. East. Eur. 2012, 20, 81–86. [Google Scholar]
- Du, B.; Yang, R.; Xie, X.-M. Investigation of Hydrolysis in Poly(ethylene terephthalate) by FTIR-ATR. Chin. J. Polym. Sci. 2014, 32, 230–235. [Google Scholar] [CrossRef]
- Chung, C.; Lee, M.; Choe, E.K. Characterization of cotton fabric scouring by FT-IR ATR spectroscopy. Carbohydr. Polym. 2004, 58, 417–420. [Google Scholar] [CrossRef]
- Machnowski, W.; Was-Gubala, J. Evaluation of Selected Thermal Changes in Textile Materials Arising in the Wake of the Impact of Heat Radiation. SN Appl. Sci. 2021, 11, 6989. [Google Scholar] [CrossRef]
- Peets, P.; Kaupmees, K.; Vahur, S.; Leito, I. Reflectance FT-IR spectroscopy as a viable option for textile fiber identification. Herit. Sci. 2019, 7, 93. [Google Scholar] [CrossRef]
- Śmigiel-Kamińska, D.; Pośpiech, J.; Makowska, J.; Stepnowski, P.; Wąs-Gubała, J.; Kumirska, J. The Identification of Polyester Fibers Dyed with Disperse Dyes for Forensic Purposes. Molecules 2019, 24, 613. [Google Scholar] [CrossRef] [Green Version]
- Cionek, C.A.; Nunes, C.; Freitas, A.; Homem, N.; Muniz, E.; Amorim, T. Degradation study of polyester fiber in swimming pool water. Text. Res. J. 2021, 91, 51–61. [Google Scholar] [CrossRef]
- Egan, J.; Salmon, S. Strategies and progress in synthetic textile fiber biodegradability. SN Appl. Sci. 2022, 4, 22. [Google Scholar] [CrossRef]
- Sørensen, L.; Groven, A.S.; Hovsbakken, I.-A.; Del Puerto, O.; Krause, D.F.; Sarno, A.; Booth, A.M. UV degradation of natural and synthetic microfibers causes fragmentation and release of polymer degradation products and chemical additives. Sci. Total Environ. 2021, 755, 143170. [Google Scholar] [CrossRef]
- Venkatachalam, S.; Nayak, S.G.; Labde, J.V. Degradation and Recyclability of Poly(ethylene terephthalate). In Polyester; Saleh, H.E.-D.M., Ed.; InTech: Rijeka, Croatia, 2012; pp. 75–98. [Google Scholar] [CrossRef] [Green Version]
- Nguyen-Tri, P.; Prud’homme, R.E. Nanoscale analysis of the photodegradation of polyester fibres by AFM-IR. J. Photochem. Photobiol. A 2019, 371, 196–204. [Google Scholar] [CrossRef]
- ECMWF. Available online: https://www.ecmwf.int/en/forecasts/datasets/set-i (accessed on 12 February 2022).
- ISO 105-F03:2001; Textiles—Tests for Color Fastness—Part F03: Specification for Polyamide Adjacent Fabric. International Organization for Standardization: Geneva, Switzerland, 2001.
- ISO 6330:2021; Textiles—Domestic Washing and Drying Procedures for Textile Testing. International Organization for Standardization: Geneva, Switzerland, 2021.
- ISO 5084:1996; Textiles—Determination of Thickness of Textiles and Textile Products. International Organization for Standardization: Geneva, Switzerland, 1996.
- ISO 139:2005; Textiles—Standard Atmospheres for Conditioning and Testing. International Organization for Standardization: Geneva, Switzerland, 2005.
- ISO 13934-1:2013; Textiles—Tensile Properties of Fabrics—Part 1: Determination of Maximum Force and Elongation at Maximum Force Using the Strip Method. International Organization for Standardization: Geneva, Switzerland, 2013.
- ASTM D3787; Textile Ball Burst Testing. ADMET, Inc.: Norwood, MA, USA, 2020.
- AATCC TM 195-2021; Liquid Moisture Management Properties of Textile Fabrics. American Association of Textile Chemists and Colorists (AATCC): Research Triangle Park, NC, USA, 2020.
- M290 Moisture Management Tester, Instruction Manual, Rev. 1.4 (06/18), SDL Atlas. Available online: https://sdlatlas.com/products/mmt-moisture-management-tester#product-details (accessed on 19 April 2022).
- Lo, T.; Ng, S.; Lai, D.T.L. Relaxation of knitted fabric by low-pressure evaporation. Text. Res. J. 2012, 82, 2019–2029. [Google Scholar] [CrossRef]
- Onal, L.; Candan, C. Contribution of Fabric Characteristics and Laundering to Shrinkage of Weft Knitted Fabrics. Text. Res. J. 2003, 73, 187–191. [Google Scholar] [CrossRef]
- Pfueller, T.; Illing-Guenther, H.; Naumann, R.; Franitza, P.; Kovačević, Z.; Magovac, Z.; Flinčec Grgac, S.; Bischof, S. Investigation of thermal behavior and ageing of thermoplastic polymers used for protective textiles. In Book of Proceedings of 6th International Textile, Clothing & Design Conference—Magic World of Textiles; Dragčević, Z., Ed.; University of Zagreb Faculty of Textile Technology: Zagreb, Croatia, 2012; pp. 561–566. [Google Scholar]
- Ebrahimi, I.; Kiumarsi, A.; Parvinzadeh, M.; Rashidian, R.; Norouzi, M.H. Atmospheric-air plasma enhances coating of different lubricating agents on polyester fiber. EPJ Appl. Phys. 2011, 56, 10801–10810. [Google Scholar] [CrossRef]
- dos Santos Pereira, A.P.; Prado da Silva, M.H.; Lima, E.P., Jr.; dos Santos Paula, A.; Tommasini, F.J. Processing and Characterization of PET Composites Reinforced With Geopolymer Concrete Waste. Mater. Res. 2017, 20, 1–10. [Google Scholar] [CrossRef] [Green Version]
- Cai, Z.; Ji, B.; Yan, K.; Zhu, Q. Investigation on Reaction Sequence and Group Site of Citric Acid with Cellulose Characterized by FTIR in Combination with Two-Dimensional Correlation Spectroscopy. Polymers 2019, 11, 2071. [Google Scholar] [CrossRef] [Green Version]
- Partini, M.; Pantani, R. FTIR analysis of hydrolysis in aliphatic polyesters. Polym. Degrad. Stab. 2007, 92, 1491–1497. [Google Scholar] [CrossRef]


| Material ID | Type | Mass, g/m2 | Yarn Fineness, Tex | |
|---|---|---|---|---|
| Avg., g/m2 | CV, % | |||
| F1 | DH | 105.91 | 3.13 | 12 |
| F2 | D | 152.95 | 0.14 | 12 |
| F3 | DH | 192.09 | 2.66 | 12 |
| F4 | DP | 157.82 | 3.65 | 15 |
| F5 | DP | 136.39 | 3.27 | 12 |
| Designation | Weathering Exposure | Total Duration, min | Artificial AS Exposure | Total Duration, min |
|---|---|---|---|---|
| E0 | - | 0 | - | 0 |
| Esu12 | +sun | 180 | + | 540 |
| Esu24 | +sun | 360 | + | 1080 |
| Esh12 | +shade | 180 | + | 540 |
| Esh24 | +shade | 360 | + | 1080 |
| Material ID | Aiy | |||||
|---|---|---|---|---|---|---|
| E0 | Esu24 | Esh24 | ||||
| Avg., mm2 | CV, % | Avg., mm2 | CV, % | Avg., mm2 | CV, % | |
| F1 | 0.722 | 2.24 | 0.625 | 3.52 | 0.651 | 3.81 |
| F2 | 0.029 | 0.98 | 0.024 | 1.30 | 0.024 | 1.11 |
| F3 | 1.762 | 2.12 | 1.429 | 4.23 | 1.458 | 4.11 |
| F4 | 0.010 | 0.67 | 0.008 | 1.35 | 0.009 | 1.31 |
| F5 | 0.021 | 0.55 | 0.018 | 1.08 | 0.019 | 0.98 |
| Material ID | Dh | Dv | ||
|---|---|---|---|---|
| Esu24 | Esh24 | Esu24 | Esh24 | |
| F1 | 3.9 | 3.5 | 3.2 | 3.3 |
| F2 | 0.6 | 0.5 | 0.4 | 0.0 |
| F3 | 1.4 | 2.6 | 1.2 | 0.7 |
| F4 | 2.4 | 2.4 | 2.2 | 2.2 |
| F5 | 1.6 | 1.3 | 1.6 | 1.1 |
Publisher’s Note: MDPI stays neutral with regard to jurisdictional claims in published maps and institutional affiliations. |
© 2022 by the authors. Licensee MDPI, Basel, Switzerland. This article is an open access article distributed under the terms and conditions of the Creative Commons Attribution (CC BY) license (https://creativecommons.org/licenses/by/4.0/).
Share and Cite
Čubrić, I.S.; Čubrić, G.; Katić Križmančić, I.; Kovačević, M. Evaluation of Changes in Polymer Material Properties Due to Aging in Different Environments. Polymers 2022, 14, 1682. https://doi.org/10.3390/polym14091682
Čubrić IS, Čubrić G, Katić Križmančić I, Kovačević M. Evaluation of Changes in Polymer Material Properties Due to Aging in Different Environments. Polymers. 2022; 14(9):1682. https://doi.org/10.3390/polym14091682
Chicago/Turabian StyleČubrić, Ivana Salopek, Goran Čubrić, Ines Katić Križmančić, and Monika Kovačević. 2022. "Evaluation of Changes in Polymer Material Properties Due to Aging in Different Environments" Polymers 14, no. 9: 1682. https://doi.org/10.3390/polym14091682
APA StyleČubrić, I. S., Čubrić, G., Katić Križmančić, I., & Kovačević, M. (2022). Evaluation of Changes in Polymer Material Properties Due to Aging in Different Environments. Polymers, 14(9), 1682. https://doi.org/10.3390/polym14091682