
Formulation and Evaluation of Transdermal Gel Containing Tacrolimus-Loaded Spanlastics: In Vitro, Ex Vivo and In Vivo Studies


 ,
,
Abstract
:1. Introduction
2. Materials and Methods
2.1. Materials
2.2. Methods
2.2.1. Preparation of TCR-Loaded SPLs
2.2.2. In Vitro Characterization of TCR-Loaded SPLs
Size of the TCR-Loaded SPLs
Zeta Potential
Entrapment Efficiency Percent (EE)
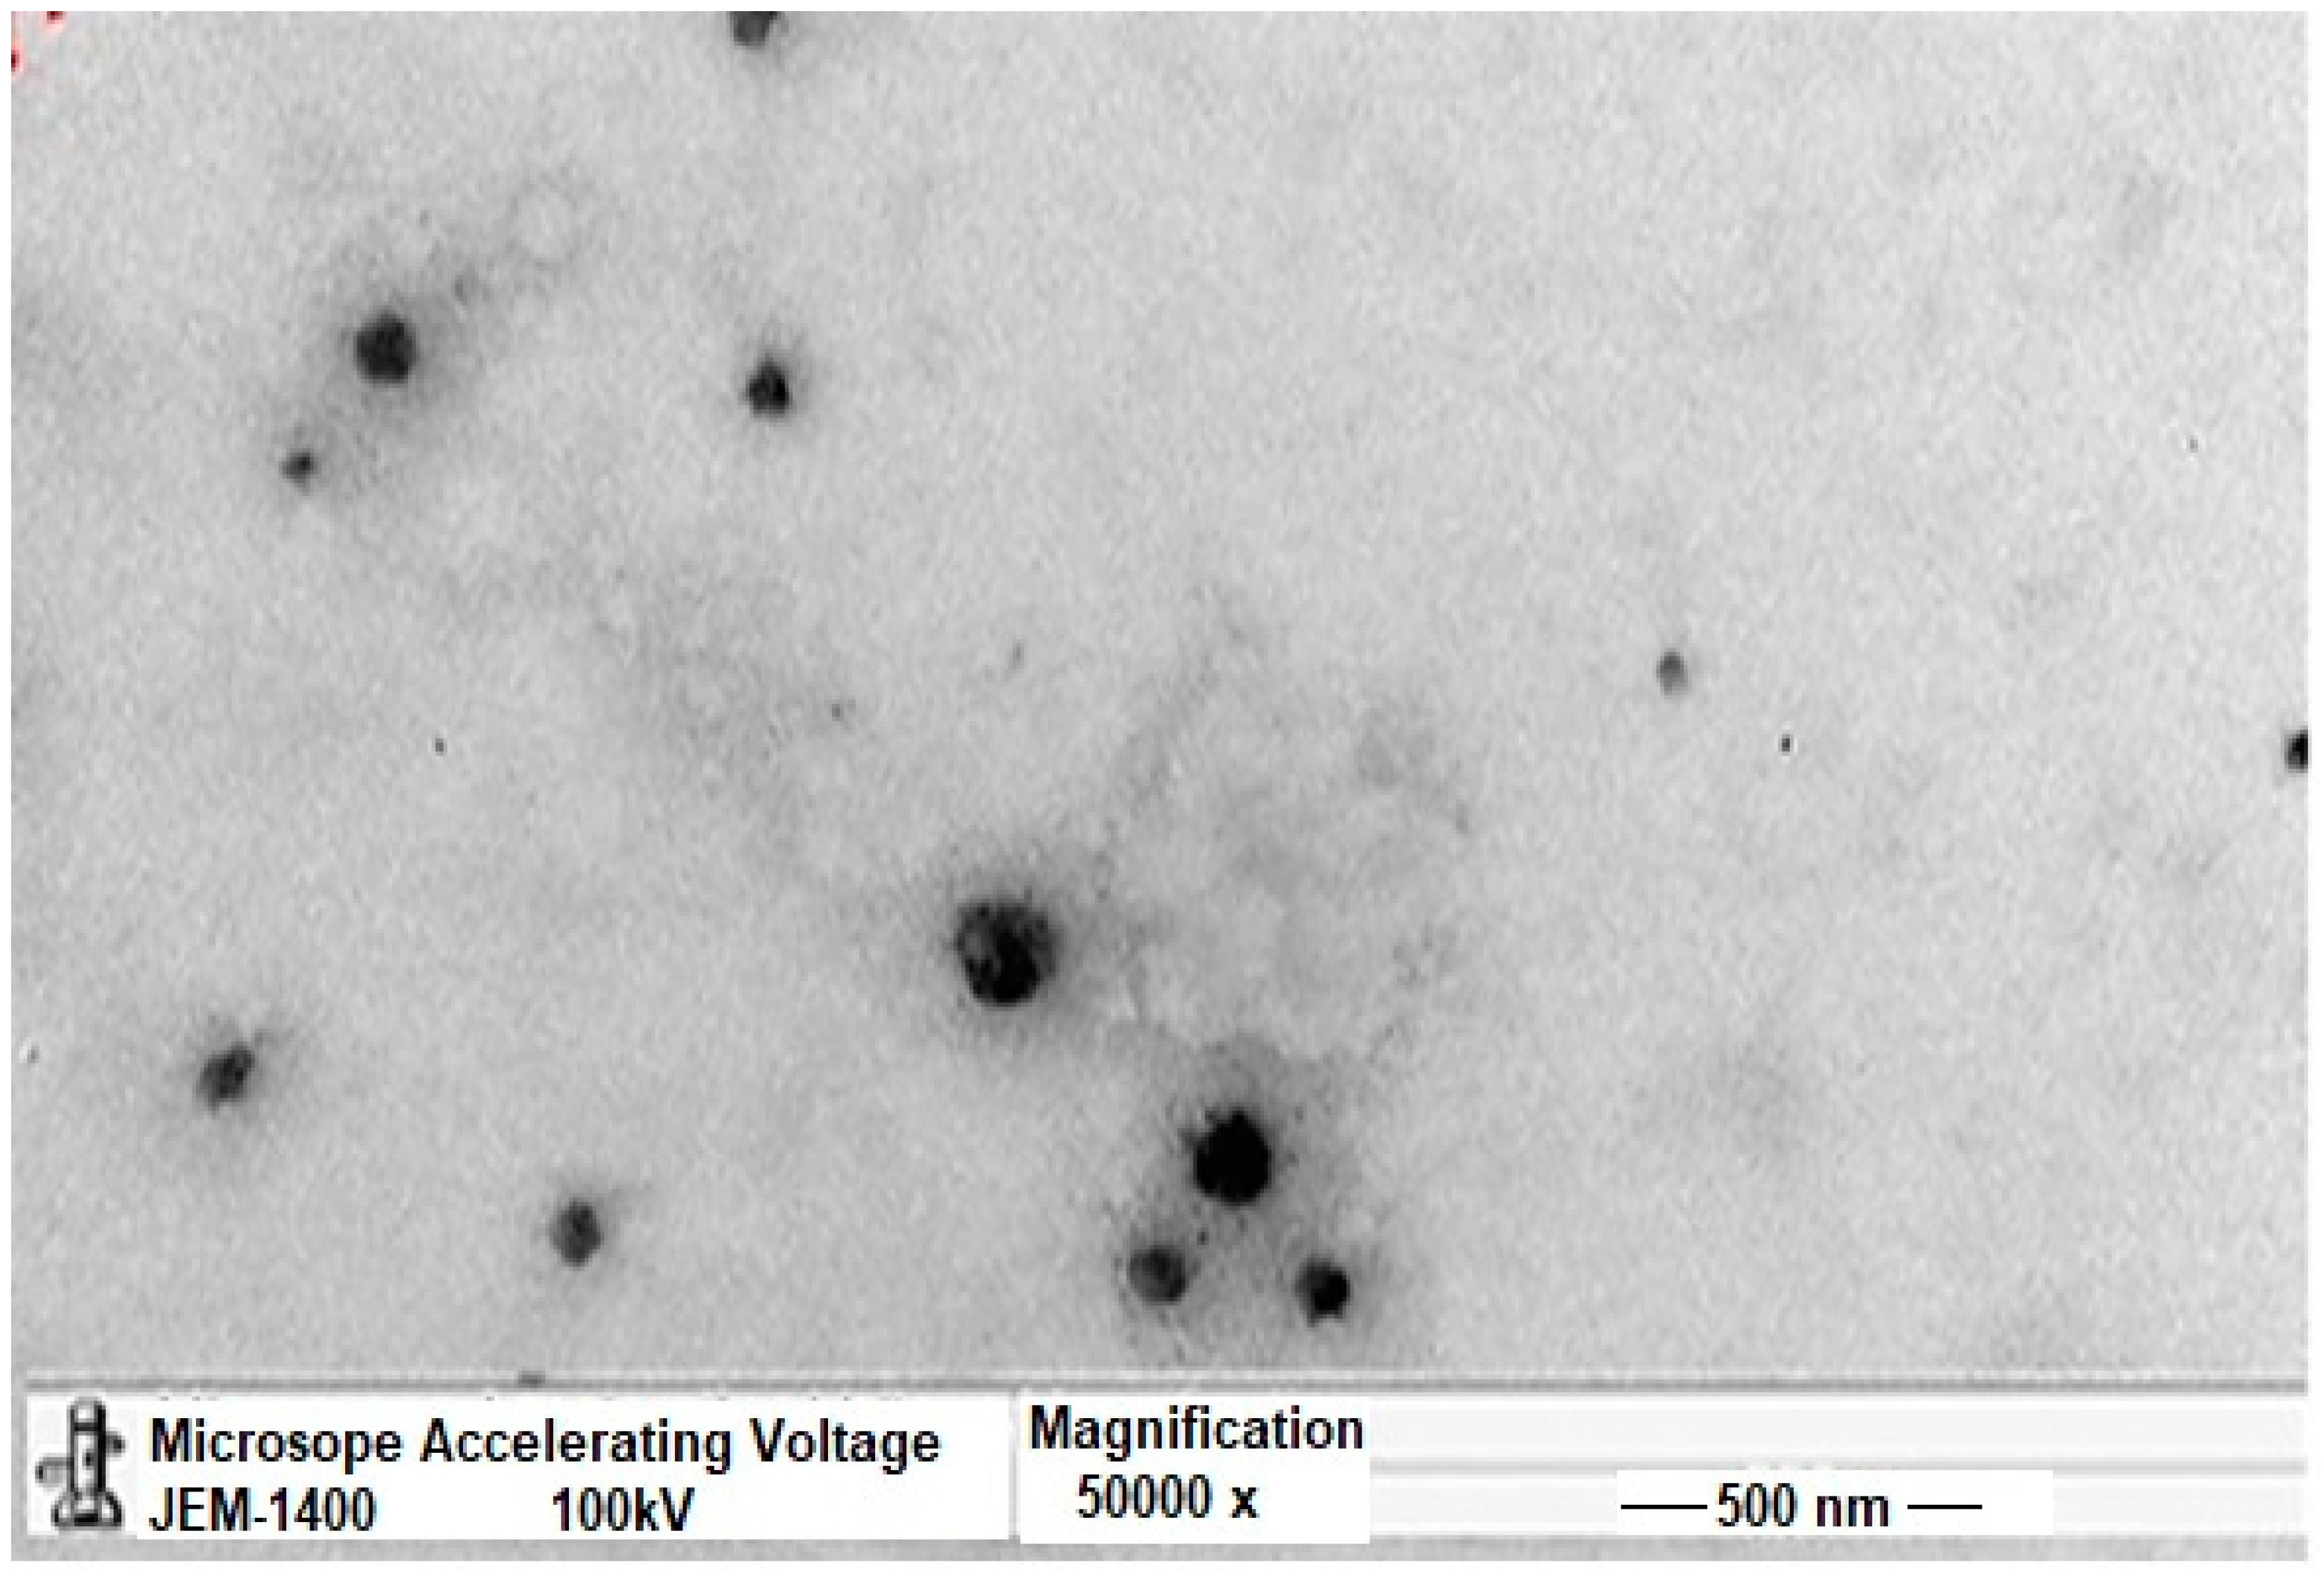
Transmission Electron Microscopy (TEM)
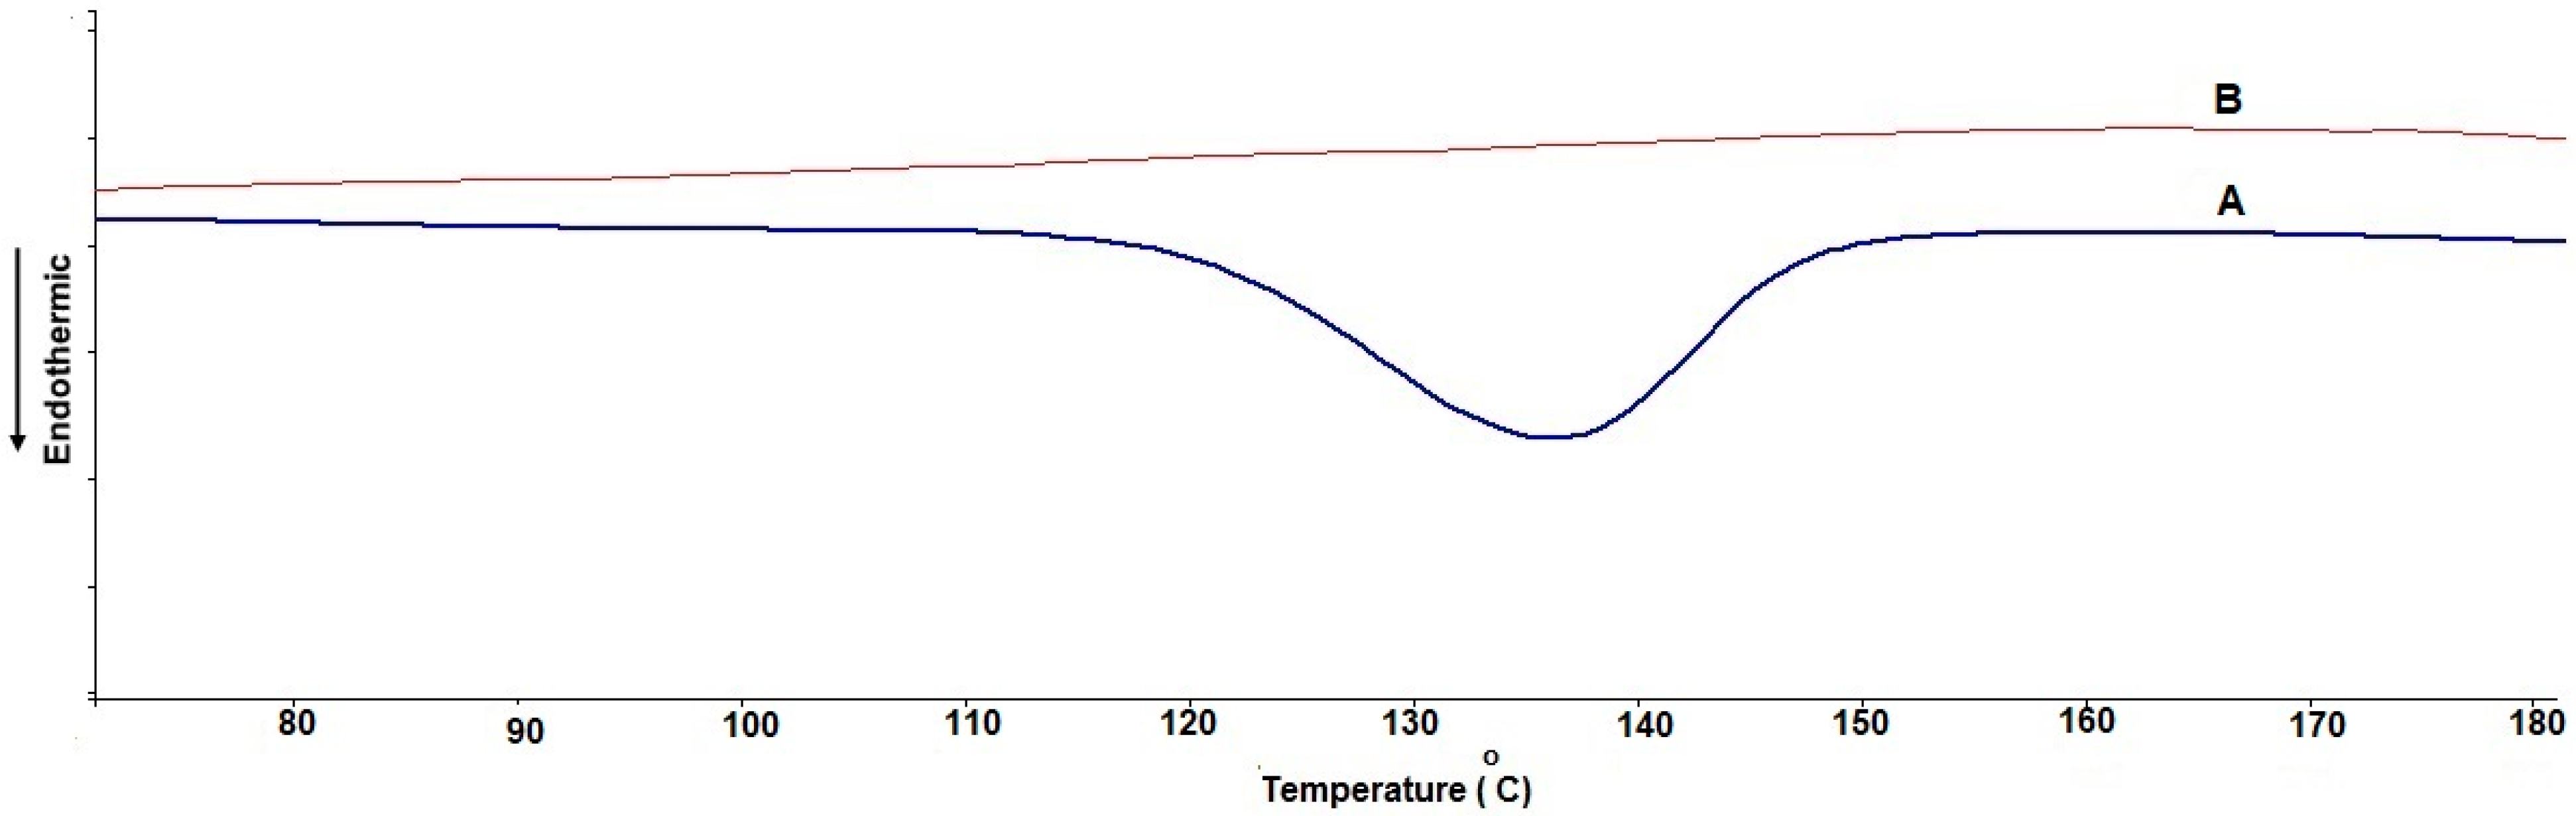
Differential Scanning Calorimetry (DSC)
Formulation of TCR-Loaded SPL Gel Bases
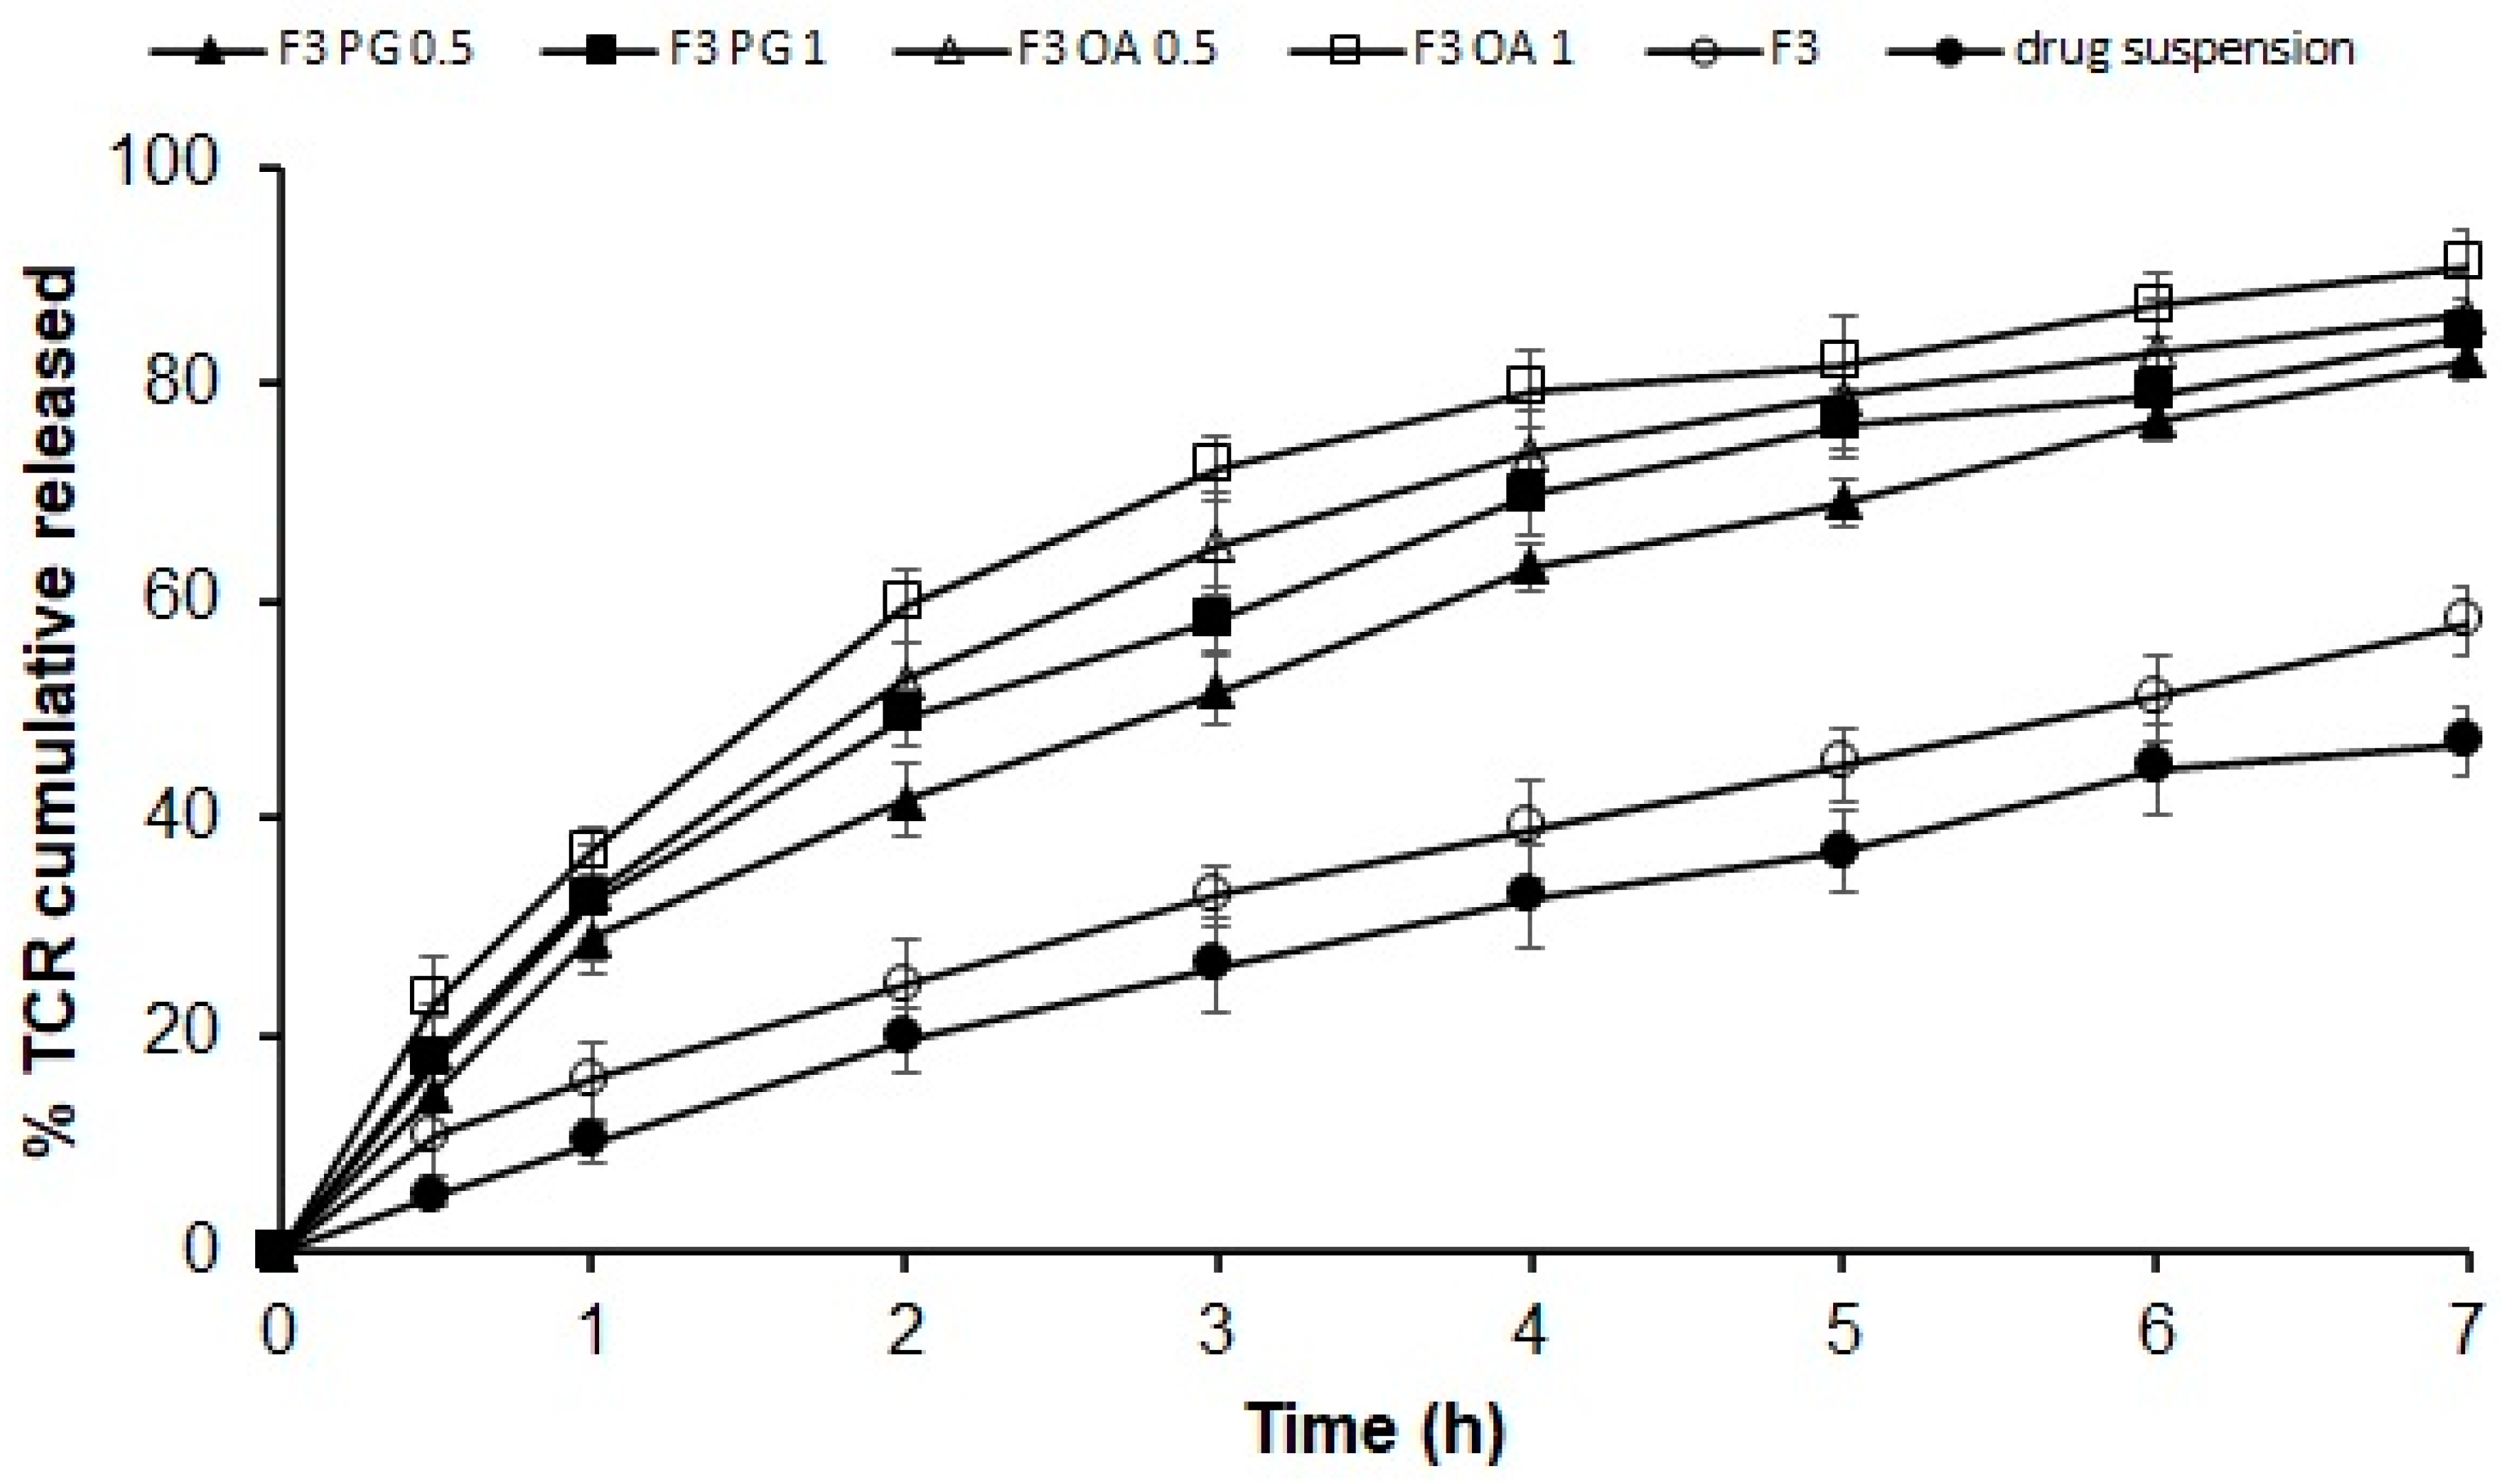
In Vitro Release Studies
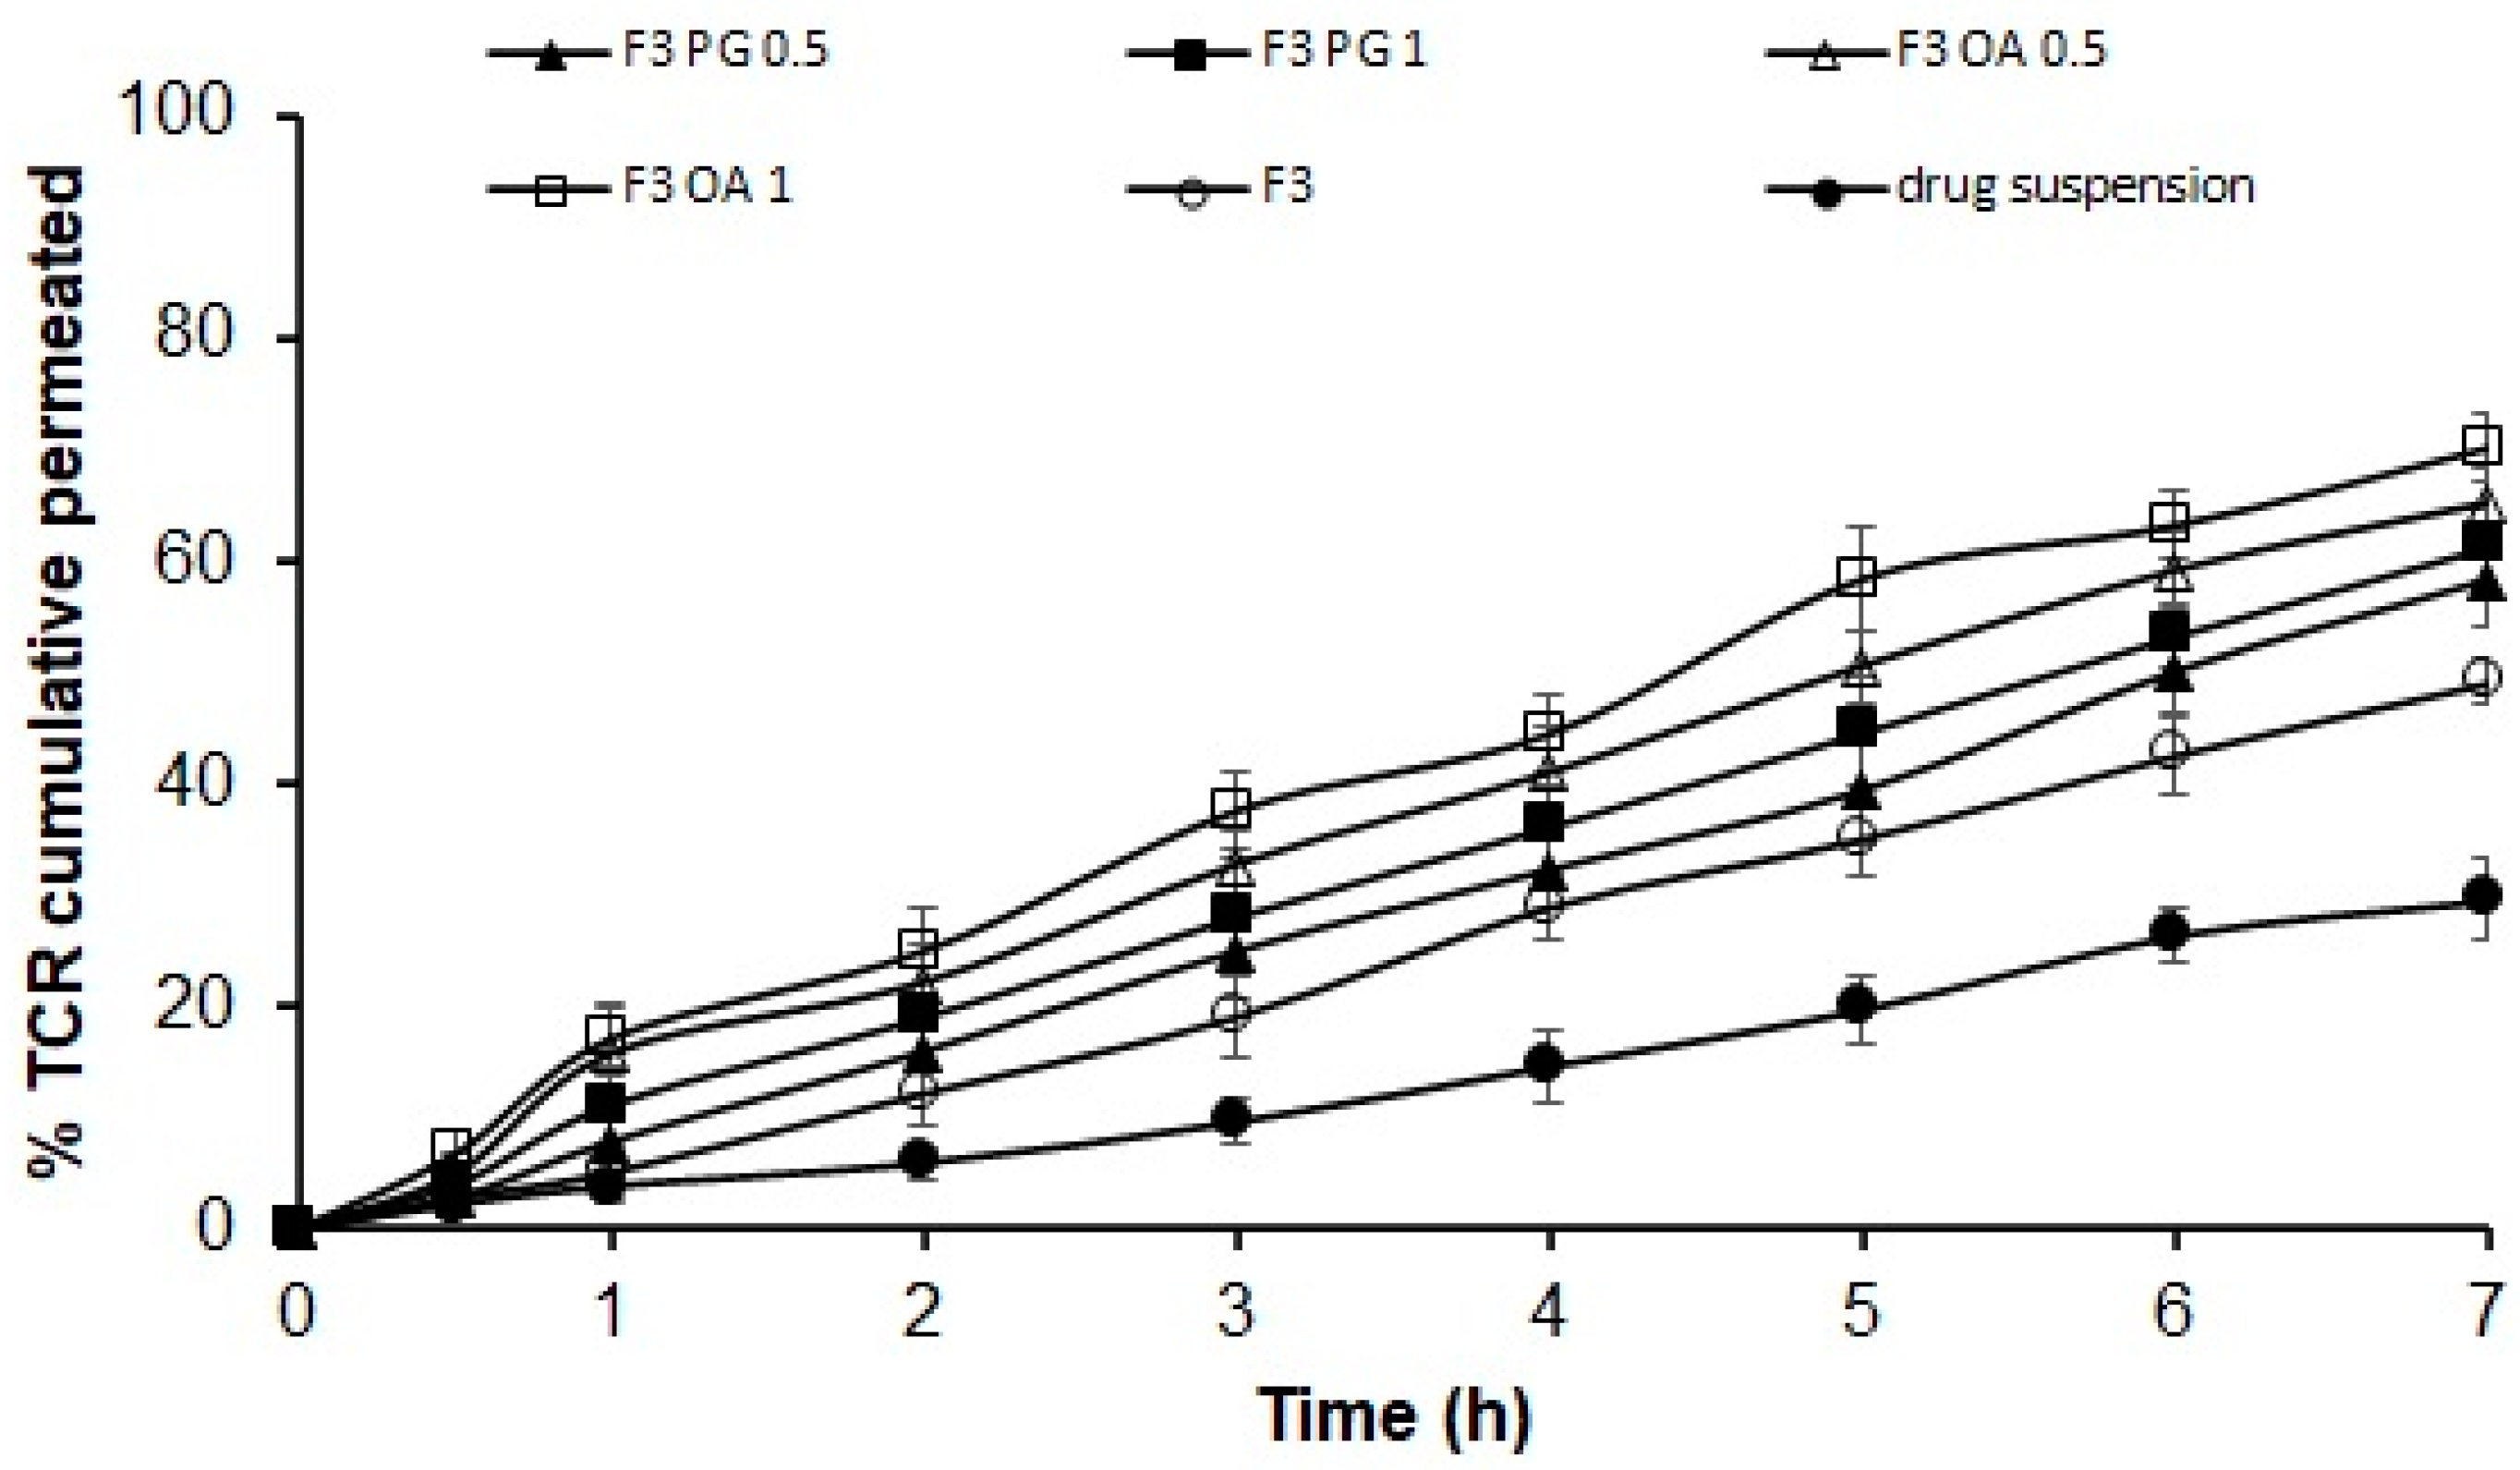
2.2.3. Ex Vivo Permeation Study
2.2.4. Pharmacokinetics of TCR from SPL Gel Base
Sample Preparation for Pharmacokinetic Analysis
Pharmacokinetic Parameters (PK)
2.2.5. Statistical Data Analysis
3. Results and Discussion
3.1. Characterization of TCR-Loaded SPLs
3.2. Transmission Electron Microscopy (TEM)
3.3. Differential Scanning Calorimetry (DSC)
3.4. In Vitro Release of Different Permeation Enhancers Containing TCR–SPLs
3.5. Ex Vivo Permeation of TCR-Loaded SPL Formula through Hairless Rat Skin
3.6. Characterization of TCR-Loaded SPL Gel Formulation
3.7. In Vitro Release of TCR from SPL-Loaded Gel Formulation
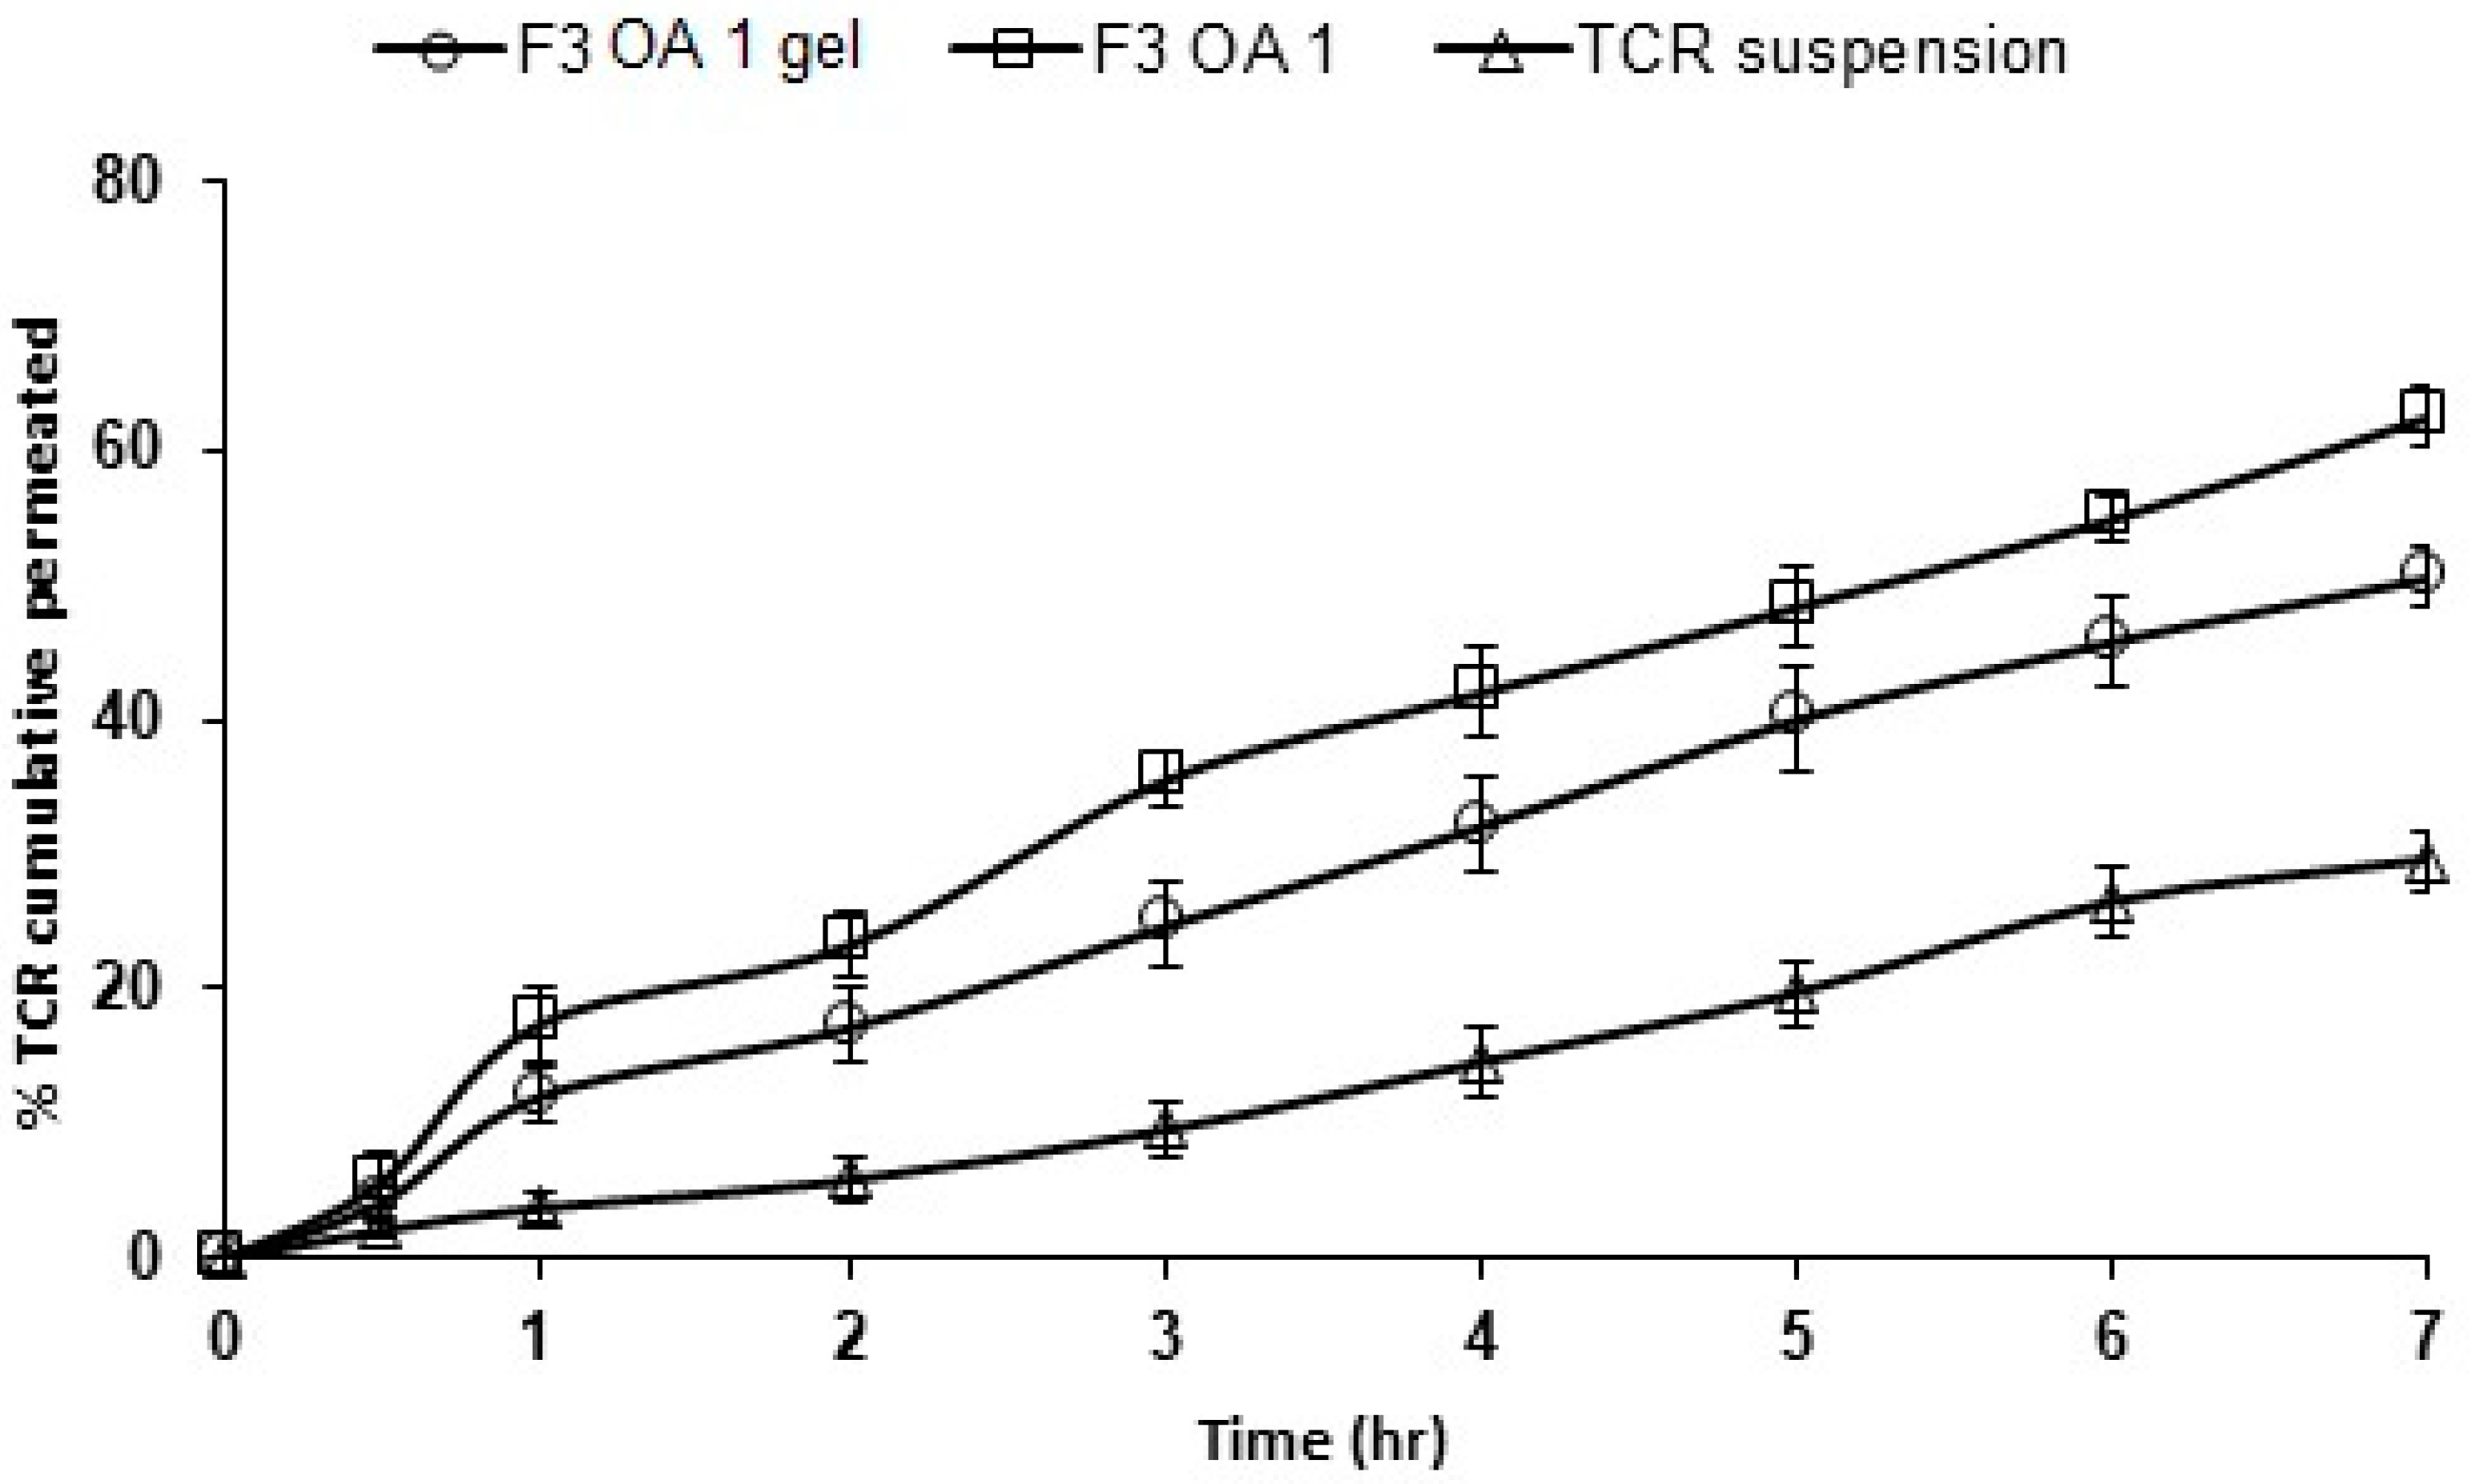
3.8. Ex Vivo Permeation of TCR from SPLs-Loaded Gel Formulations
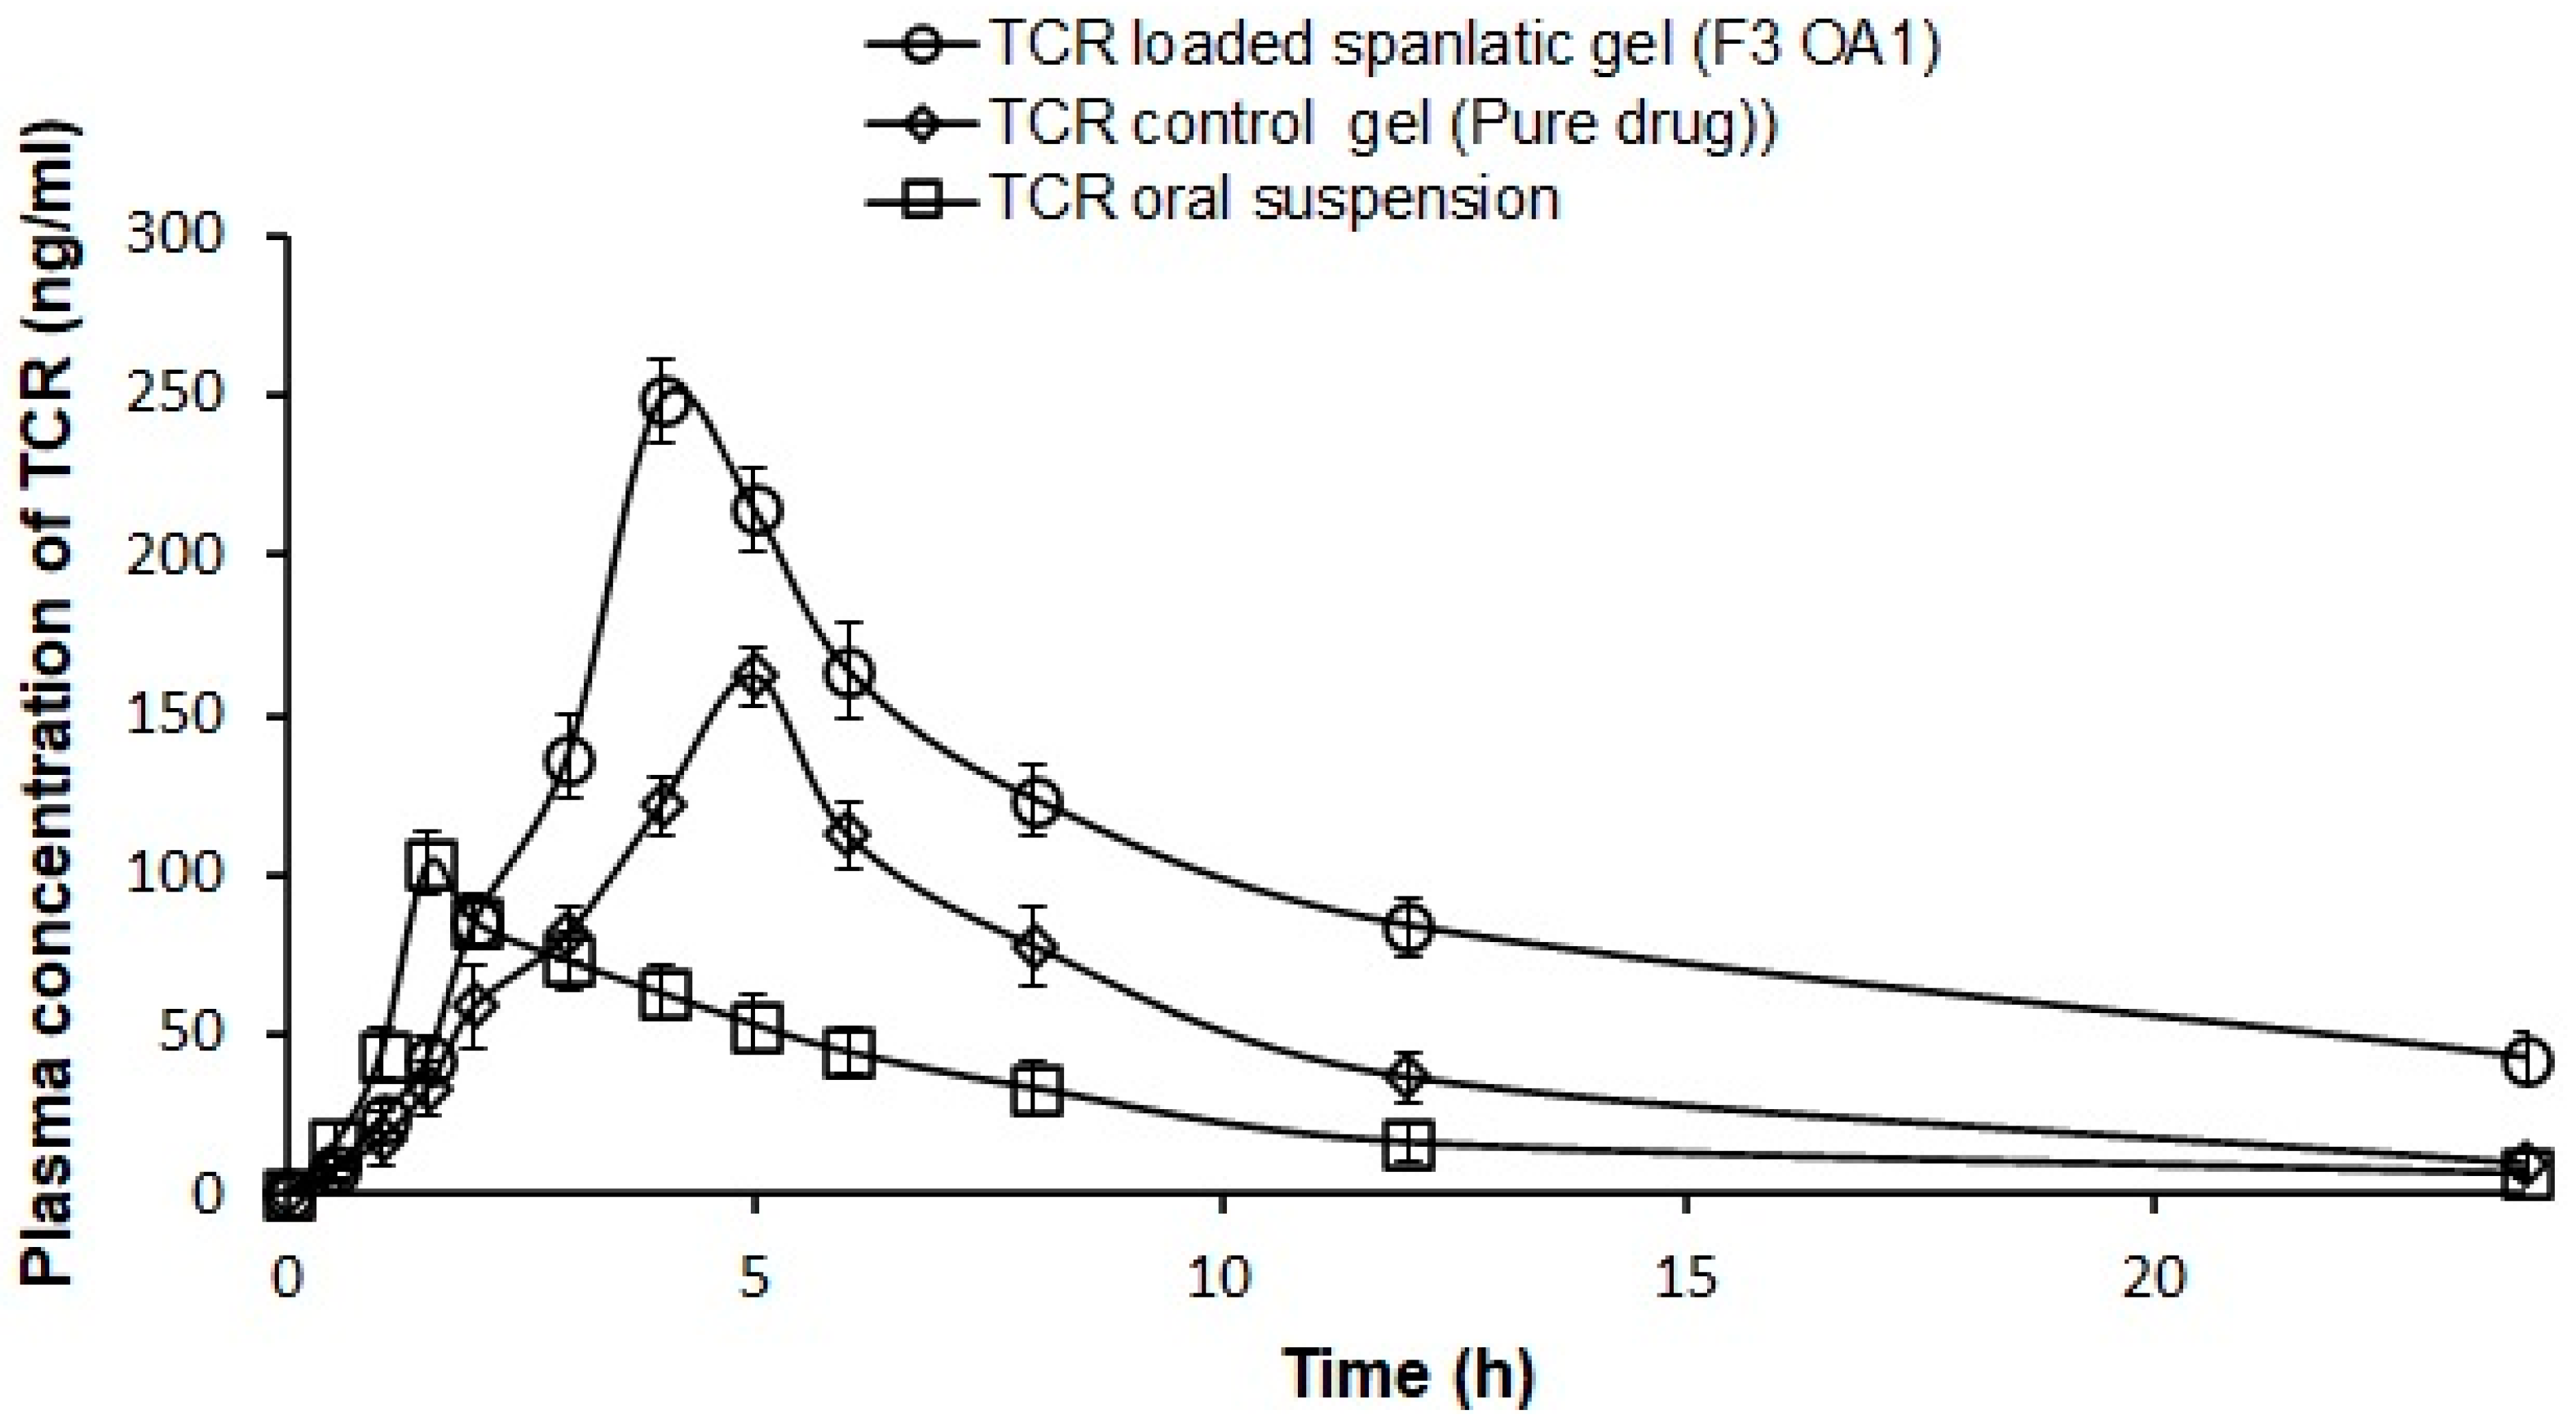
3.9. Pharmacokinetic Studies
4. Conclusions
Author Contributions
Funding
Institutional Review Board Statement
Informed Consent Statement
Data Availability Statement
Acknowledgments
Conflicts of Interest
References
- Russell, J.J. Topical TCR: A new therapy for atopic dermatitis. Am. Fam. Physician 2002, 66, 1899–1902. [Google Scholar] [PubMed]
- Pascual, J.C.; Fleisher, A.B. TCR ointment (Protopic) for atopic dermatitis Skin. Ther. Lett. 2004, 9, 1–5. [Google Scholar]
- Antignac, M.; Barrou, B.; Farinotti, R.; Lechat, P.; Urien, S. Population pharmacokinetics and bioavailability of TCR in kidney transplant patients. Br. J. Clin. Pharmacol. 2007, 64, 750–757. [Google Scholar] [PubMed] [Green Version]
- Goebel, A.S.; Neubert, R.H.; Wohlrab, J. Dermal targeting of TCR using colloidal carrier systems. Int. J. Pharm. 2011, 404, 159–168. [Google Scholar] [CrossRef]
- Yamanaka, M.; Yokota, S.; Iwao, Y.; Noguchi, S.; Itai, S. Development and evaluation of a TCR cream formulation using a binary solvent system. Int. J. Pharm. 2014, 464, 19–26. [Google Scholar] [CrossRef]
- Gabriel, D.; Mugnier, T.; Courthion, H.; Kranidioti, K.; Karagianni, N.; Denis, M.C.; Lapteva, M.; Kalia, Y.; Möller, M.; Gurny, R. Improved topical delivery of TCR: A novel composite hydrogel formulation for the treatment of psoriasis. J. Control. Release. 2016, 242, 16–24. [Google Scholar] [CrossRef]
- Sharma, A.; Pahwa, S.; Bhati, S.; Kudeshia, P. Spanlastics: A modern approach for nanovesicular drug delivery. Int. J. Pharm. Sci. Res. 2020, 11, 1057–1065. [Google Scholar]
- Shah, H.S.; Usman, F.; Ashfaq–Khan, M.; Khalil, R.; Ul-Haq, Z.; Mushtaq, A.; Qaiser, R.; Iqbal, J. Preparation and characterization of anticancer niosomal withaferin & ndash; A formulation for improved delivery to cancer cells: In vitro, in vivo, and in silico evaluation. J. Drug Deliv. Sci. Technol. 2020, 59, 101863. [Google Scholar] [CrossRef]
- Ge, X.; Wei, M.; He, S.; Yuan, W.-E. Advances of Non-Ionic Surfactant Vesicles (Niosomes) and Their Application in Drug Delivery. Pharmaceutics 2019, 11, 55. [Google Scholar] [CrossRef] [Green Version]
- Sinico, C.; Fadda, A.N. Vesicular carriers for dermal drug delivery. Exp. Opin. Drug Deliv. 2009, 6, 813–825. [Google Scholar] [CrossRef]
- Bartelds, R.; Nematollahi, M.H.; Pols, T.; Stuart, M.C.A.; Pardakhty, A.; Asadikaram, G.; Poolman, B. Niosomes, an alternative for liposomal delivery. PLoS ONE. 2018, 12, e0194179. [Google Scholar] [CrossRef] [PubMed] [Green Version]
- Naresh, R.A.R.; Chandrasekhar, G.; Pillai, G.K.; Udupa, N. Anti-inflammatory activity of Niosome encapsulated diclofenac sodium with Tween-85 in Arthritic rats. Ind. J. Pharmacol. 1994, 26, 46–48. [Google Scholar]
- Parthasarathi, G.; Udupa, N.; Umadevi, P.; Pillai, G.K. Niosome encapsulated of vincristine sulfate: Improved anticancer activity with reduced toxicity in mice. J. Drug Target 1994, 2, 173–182. [Google Scholar] [CrossRef] [PubMed]
- Mazyed, E.A.; Helal, D.A.; Elkhoudary, M.M.; Abd Elhameed, A.G.; Yasser, M. Formulation and Optimization of nanospanlastics for improving the bioavailability of green tea epigallocatechin gallate. Pharmaceuticals 2021, 14, 68. [Google Scholar] [CrossRef]
- Farghaly, D.A.; Aboelwafa, A.A.; Hamza, M.Y. Topical delivery of fenoprofen calcium via elastic nano-vesicular spanlastics: Optimization using experimental design and in vivo evaluation. AAPS PharmSciTech. 2017, 18, 2898–2909. [Google Scholar] [CrossRef]
- Elhabak, M.; Ibrahim, S.; Abouelatta, S.M. Topical delivery of l-ascorbic acid spanlastics for stability enhancement and treatment of UVB induced damaged skin. Drug Deliv. 2021, 28, 445–453. [Google Scholar] [CrossRef]
- Sharma, N.; Parashar, B.; Sharma, S.; Mahajan, U. Blooming Pharma Industry with Transdermal Drug Delivery System. Indo. Global J. Pharm. Sci. 2012, 2, 262–278. [Google Scholar]
- Jeong, W.Y.; Kwon, M.; Choi, H.E.; Kim, K.S. Recent advances in transdermal drug delivery systems: A review. Biomater Res. 2021, 25, 1–15. [Google Scholar] [CrossRef]
- Padula, C.; Pescina, S.; Nicoli, S.; Santi, P. New Insights on the Mechanism of Fatty Acids as Buccal Permeation Enhancers. Pharmaceutics 2018, 10, 201. [Google Scholar] [CrossRef] [Green Version]
- Fahmy, A.M.; El-Setouhy, D.A.; Ibrahim, A.B.; Habib, B.A.; Tayel, S.A.; Bayoumi, N.A. Penetration enhancer-containing spanlastics (PECSs) for transdermal delivery of haloperidol: In vitro characterization, ex vivo permeation and in vivo biodistribution studies. Drug Deliv. 2018, 25, 12–22. [Google Scholar] [CrossRef] [Green Version]
- Małgorzata, M.; Agnieszka, K.-P.; Mariola, S. Nanoemulsion Gel Formulation Optimization for Burn Wounds: Analysis of Rheological and Sensory Properties. Processes 2020, 8, 1416. [Google Scholar] [CrossRef]
- Almoshari, Y. Novel Hydrogels for Topical Applications: An Updated Comprehensive Review Based on Source. Gels 2022, 8, 174. [Google Scholar] [CrossRef]
- ElMeshad, A.N.; Mohsen, A.M. Enhanced corneal permeation and antimycotic activity of itraconazole against candida albicans via a novel nanosystem vesicle. Drug Deliv. 2016, 23, 2115–2123. [Google Scholar] [CrossRef] [PubMed]
- Hyun Kang, J.I.; Chon, J.; Kim, Y.I.L.; Lee, H.J.; Oh, D.W.; Lee, H.G.; Han, C.S.; Kim, D.W.; Park, C.W. Preparation and evaluation of TCR-loaded thermosensitive solid lipid nanoparticles for improved dermal distribution. Int. J. Nanomed. 2019, 14, 5381–5396. [Google Scholar] [CrossRef] [PubMed] [Green Version]
- Abou El Ela, A.E.F.; Ibrahim, M.A.; Alqahtani, Y.; Almomen, A.; Aleanizy, F.S. Fluconazole nanoparticles prepared by antisolvent precipitation technique: Physicochemical, in vitro, ex vivo and in vivo ocular evaluation. Saudi Pharm. J. 2021, 29, 576–585. [Google Scholar] [CrossRef]
- Nekkanti, V.; Rueda, J.; Wang, Z.; Betageri, G.V. Design, characterization, and in vivo pharmacokinetics of TCR proliposomes. AAPS PharmSciTech. 2016, 17, 1019–1029. [Google Scholar] [CrossRef] [Green Version]
- John, G.K.; Lake Villa, I.L.; David, H.W.; Zion, I.L. Method of Tacrolimus Extraction and Quantification Using Aqueous Detergents. U.S. Patent 7,575,875 B2, 18 August 2009. [Google Scholar]
- Kakkar, S.; Kaur, I.P. Spanlastics—A novel nanovesicular carrier system for ocular delivery. Int. J. Pharm. 2011, 413, 202–210. [Google Scholar] [CrossRef]
- Al-Mahallawi, A.M.; Abdelbary, A.A.; Aburahma, M.H. Investigating the potential of employing bilosomes as a novel vesicular carrier for transdermal delivery of tenoxicam. J. Pharm. Sci. 2015, 485, 329–340. [Google Scholar] [CrossRef]
- Ghasemiyeh, P.; Mohammadi-Samani, S. Potential of Nanoparticles as Permeation Enhancers and Targeted Delivery Options for Skin: Advantages and Disadvantages. Drug Des. Devel. Ther. 2020, 14, 3271–3289. [Google Scholar] [CrossRef]
- Mura, S.; Manconi, M.; Fadda, A.M.; Sala, M.C.; Perricci, J.; Pini, E.; Sinico, C. Penetration enhancer-containing vesicles (PEVs) as carriers for cutaneous delivery of minoxidil. Int. J. Pharm. 2009, 380, 72–79. [Google Scholar] [CrossRef]
- Shamma, R.N.; Sayed, S.; Sabry, N.A.; El-Samanoudy, S.I. Enhanced skin targeting of retinoic acidspanlastics: In vitro characterization and clinical evaluation in acne patients. J. Liposome Res. 2019, 29, 283–290. [Google Scholar] [CrossRef] [PubMed]
- Wójcik-Pastuszka, D.; Krzak, J.; Macikowski, B.; Berkowski, R.; Osi’nski, B.; Musiał, W. Evaluation of the release kinetics of a pharmacologically active substance from model intra-articular implants replacing the cruciate ligaments of the knee. Materials 2019, 12, 1202. [Google Scholar] [CrossRef] [Green Version]
- Tamura, S.; Ohike, A.; Ibuki, R.; Amidon, G.L.; Yamashita, S. TCR is a class II low-solubility high permeability drug: The effect of P-glycoprotein efflux on regional permeability of TCR in rats. J. Pharm. Sci. 2002, 91, 719–729. [Google Scholar] [CrossRef] [PubMed]
- Trickler, W.J.; Nagvekar, A.A.; Dash, A.K. A novel nanoparticle formulation for sustained paclitaxel delivery. AAPS PharmSciTech. 2008, 9, 486–493. [Google Scholar] [CrossRef] [PubMed]
- Naik, A.; Pechtold, L.A.; Potts, R.O.; Guy, R.H. Mechanism of oleic acid-induced skin penetration enhancement in vivo in humans. J. Control. Release 1995, 37, 299–306. [Google Scholar] [CrossRef]
- Hadgraft, J.; Guy, R. Transderm Drug Deliv, 2nd ed.; Marcel Dekker: New York, NY, USA, 2003; Volume 123, pp. 1–10. [Google Scholar]
- Ono, S.; Imai, R.; Ida, Y.; Shibata, D.; Komiya, T.; Matsumura, H. Increased wound pH as an indicator of local wound infection in second degree burns. Burns 2015, 41, 820–824. [Google Scholar] [CrossRef] [PubMed]
- Heba, F.S.; Mohamed, M.N.; Rasha, M.K.; Omnia, A.A.-E.; Hanan, O.F. Novel Enhanced Therapeutic Efficacy of Dapoxetine Hcl by Nano-vesicle Transdermal Gel for Treatment of Carrageenan-Induced Rat Paw Edema. AAPS PharmSciTech 2020, 21, 113. [Google Scholar]
- Mutalik, S.; Udupa, N. Transdermal delivery of glibenclamide and glipizide: In vitro permeation studies through mouse skin. Die Pharm. 2002, 57, 838–841. [Google Scholar]


| Formula No. | Span 60 (mg) | Tween 80 (mg) | Tacrolimus (mg) | Permeation Enhancer (%) | |
|---|---|---|---|---|---|
| Propylene Glycol (PG) | Oleic Acid (OA) | ||||
| F1 | 85 | 15 | 5 | - | - |
| F2 | 80 | 20 | 5 | - | - |
| F3 | 75 | 25 | 5 | - | - |
| F4 | 70 | 30 | 5 | - | - |
| F5 | 50 | 50 | 5 | - | - |
| F3 PG 0.5 | 75 | 25 | 5 | 0.5 | - |
| F3 PG 1 | 75 | 25 | 5 | 1 | - |
| F3 OA 0.5 | 75 | 25 | 5 | - | 0.5 |
| F3 OA 1 | 75 | 25 | 5 | - | 1 |
| Formulation Code | EE% (Mean ± SD) | Vesicle Size (nm ± SD) | PDI (±SD) | Zeta Potential (mV ± SD) |
|---|---|---|---|---|
| F1 | 55.8 ± 1.7 | 38.1 ± 7.01 | 0.112 ± 0.0 | −20.16 ± 2.8 |
| F2 | 71.1 ± 1.5 | 143.8 ± 6.3 | 0.176 ± 0.0 | −16 ± 1.30 |
| F3 | 85.7 ± 1.4 | 240.7 ± 6.5 | 0.213 ± 0.1 | −22.2 ± 2.7 |
| F4 | 77.8 ± 2.9 | 360.8 ± 6.6 | 0.311 ± 0.1 | −19.3 ± 2.05 |
| F5 | 65.1 ± 2.1 | 407.3 ± 8.4 | 0.386 ± 0.1 | −18.9 ± 1.8 |
| F3 PG 0.5 | 84.7 ± 2.1 | 301.6 ± 10.1 | 0.281 ± 0.1 | −17.4 ± 1.9 |
| F3 PG 1 | 82.7 ± 2.4 | 375.5 ± 6.1 | 0.327 ± 0.1 | −20.4 ± 1.4 |
| F3 OA 0.5 | 89.5 ± 1.9 | 276.1 ± 5.6 | 0.265 ± 0.0 | −18.4 ± 1.05 |
| F3 OA 1 | 91.2 ± 2.1 | 297.03 ± 7.6 | 0.281 ± 0.1 | −24.5 ± 0.7 |
| Formulation Code | % In Vitro Cumulative Released after 7 h | Linear Regression Analysis Using Correlation Coefficient R2 According to | % Ex Vivo Cumulative Permeated after 7 h | |||
|---|---|---|---|---|---|---|
| Zero | First | Second | Higuchi | |||
| F3 | 58.17 ± 2.99 | 0.975 | 0.994 | 0.979 | 0.984 | 49.10 ± 2.08 |
| F3 PG 0.5 | 82.27 ± 2.04 | 0.940 | 0.996 | 0.936 | 0.993 | 58.27 ± 3.40 |
| F3 PG 1 | 84.57 ± 2.46 | 0.931 | 0.993 | 0.975 | 0.992 | 61.37 ± 3.29 |
| F3 OA 0.5 | 86.27 ± 4.07 | 0.877 | 0.987 | 0.979 | 0.982 | 65.17 ± 3.36 |
| F3 OA 1 | 90.97 ± 3.09 | 0.846 | 0.984 | 0.933 | 0.974 | 70.07 ± 3.06 |
| Drug suspension | 47.03 ± 2.99 | 0.979 | 0.994 | 0.993 | 0.970 | 29.50 ± 3.67 |
| Formulation Code | Flux (Jss) (µg/cm2 h−1) × 104 | Permeability Coefficient (P) (cm/h) × 10−6 | Partition Coefficient (KP) ×104 |
|---|---|---|---|
| F3 OA 1 | 50.27 ± 3.06 | 10.15 ± 3.06 | 283 ± 3.06 |
| F3 OA 1 gel | 36.79 ± 2.32 | 7.36 ± 2.32 | 155 ± 2.32 |
| Pharmacokinetic Parameters | Oral TCR Suspension | TCR-Loaded Gel (Pure Drug) | TCR-Loaded SPLs Gel (F3 OA 1 Gel) |
|---|---|---|---|
| t½ (h) | 5.70 ± 0.50 | 4.80 ± 0.68 | 9.62 ± 0.93 * |
| Tmax (h) | 1.50 ± 0.00 | 5.33 ± 0.58 | 4.00 ± 0.00 * |
| Cmax (ng/mL) | 103.56 ± 9.55 | 163.20 ± 6.72 | 248.56 ± 12.95 * |
| AUC0–7 (ng·h/mL) | 668.78 ± 26.26 | 1243.60 ± 121.56 | 2246.01 ± 125.06 * |
| AUC0–∞ (ng·h/mL) | 720.43 ± 35.28 | 1310.45 ± 154.02 | 2838.60 ± 227.00 * |
| MRT0–∞ (h) | 8.70 ± 0.73 | 9.01 ± 0.78 | 15.39 ± 0.79 * |
Publisher’s Note: MDPI stays neutral with regard to jurisdictional claims in published maps and institutional affiliations. |
© 2022 by the authors. Licensee MDPI, Basel, Switzerland. This article is an open access article distributed under the terms and conditions of the Creative Commons Attribution (CC BY) license (https://creativecommons.org/licenses/by/4.0/).
Share and Cite
Zaki, R.M.; Ibrahim, M.A.; Alshora, D.H.; El Ela, A.E.S.A. Formulation and Evaluation of Transdermal Gel Containing Tacrolimus-Loaded Spanlastics: In Vitro, Ex Vivo and In Vivo Studies. Polymers 2022, 14, 1528. https://doi.org/10.3390/polym14081528
Zaki RM, Ibrahim MA, Alshora DH, El Ela AESA. Formulation and Evaluation of Transdermal Gel Containing Tacrolimus-Loaded Spanlastics: In Vitro, Ex Vivo and In Vivo Studies. Polymers. 2022; 14(8):1528. https://doi.org/10.3390/polym14081528
Chicago/Turabian StyleZaki, Randa Mohammed, Mohamed A. Ibrahim, Doaa H. Alshora, and Amal El Sayeh Abou El Ela. 2022. "Formulation and Evaluation of Transdermal Gel Containing Tacrolimus-Loaded Spanlastics: In Vitro, Ex Vivo and In Vivo Studies" Polymers 14, no. 8: 1528. https://doi.org/10.3390/polym14081528
APA StyleZaki, R. M., Ibrahim, M. A., Alshora, D. H., & El Ela, A. E. S. A. (2022). Formulation and Evaluation of Transdermal Gel Containing Tacrolimus-Loaded Spanlastics: In Vitro, Ex Vivo and In Vivo Studies. Polymers, 14(8), 1528. https://doi.org/10.3390/polym14081528