
Research on Void Dynamics during In Situ Consolidation of CF/High-Performance Thermoplastic Composite

 , ,
, ,
Abstract
:1. Introduction
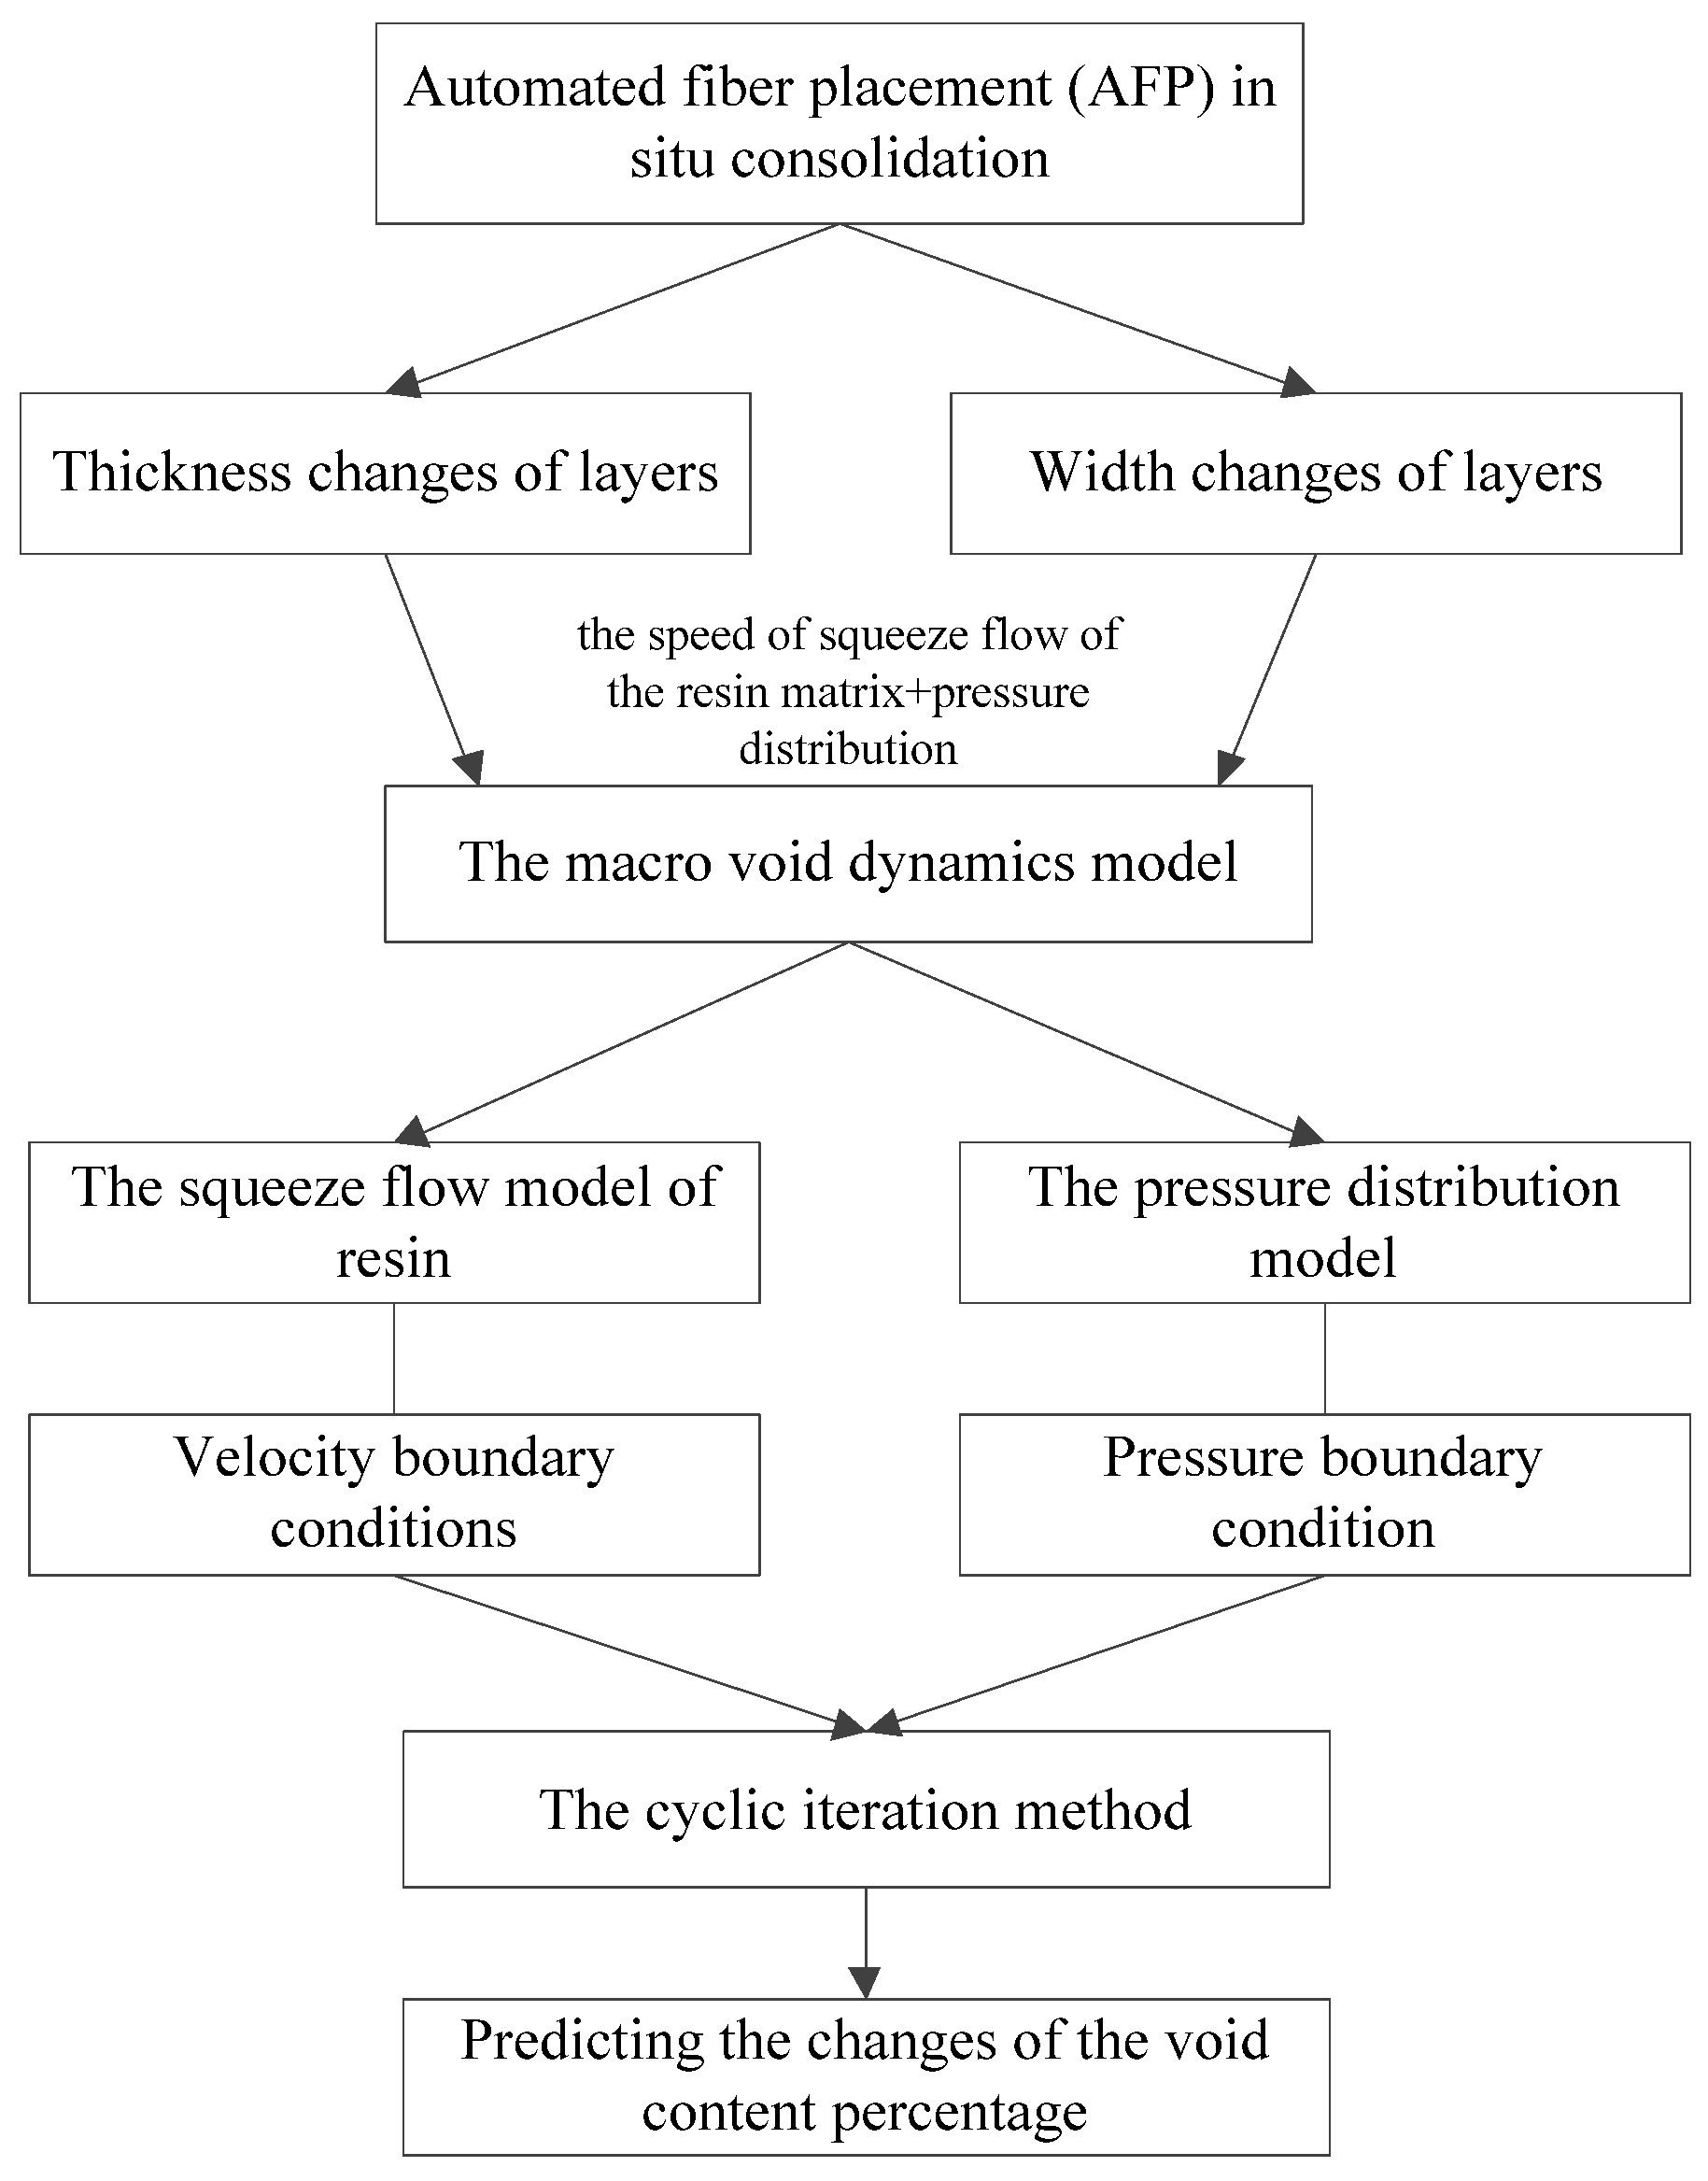
2. Void Dynamics Model
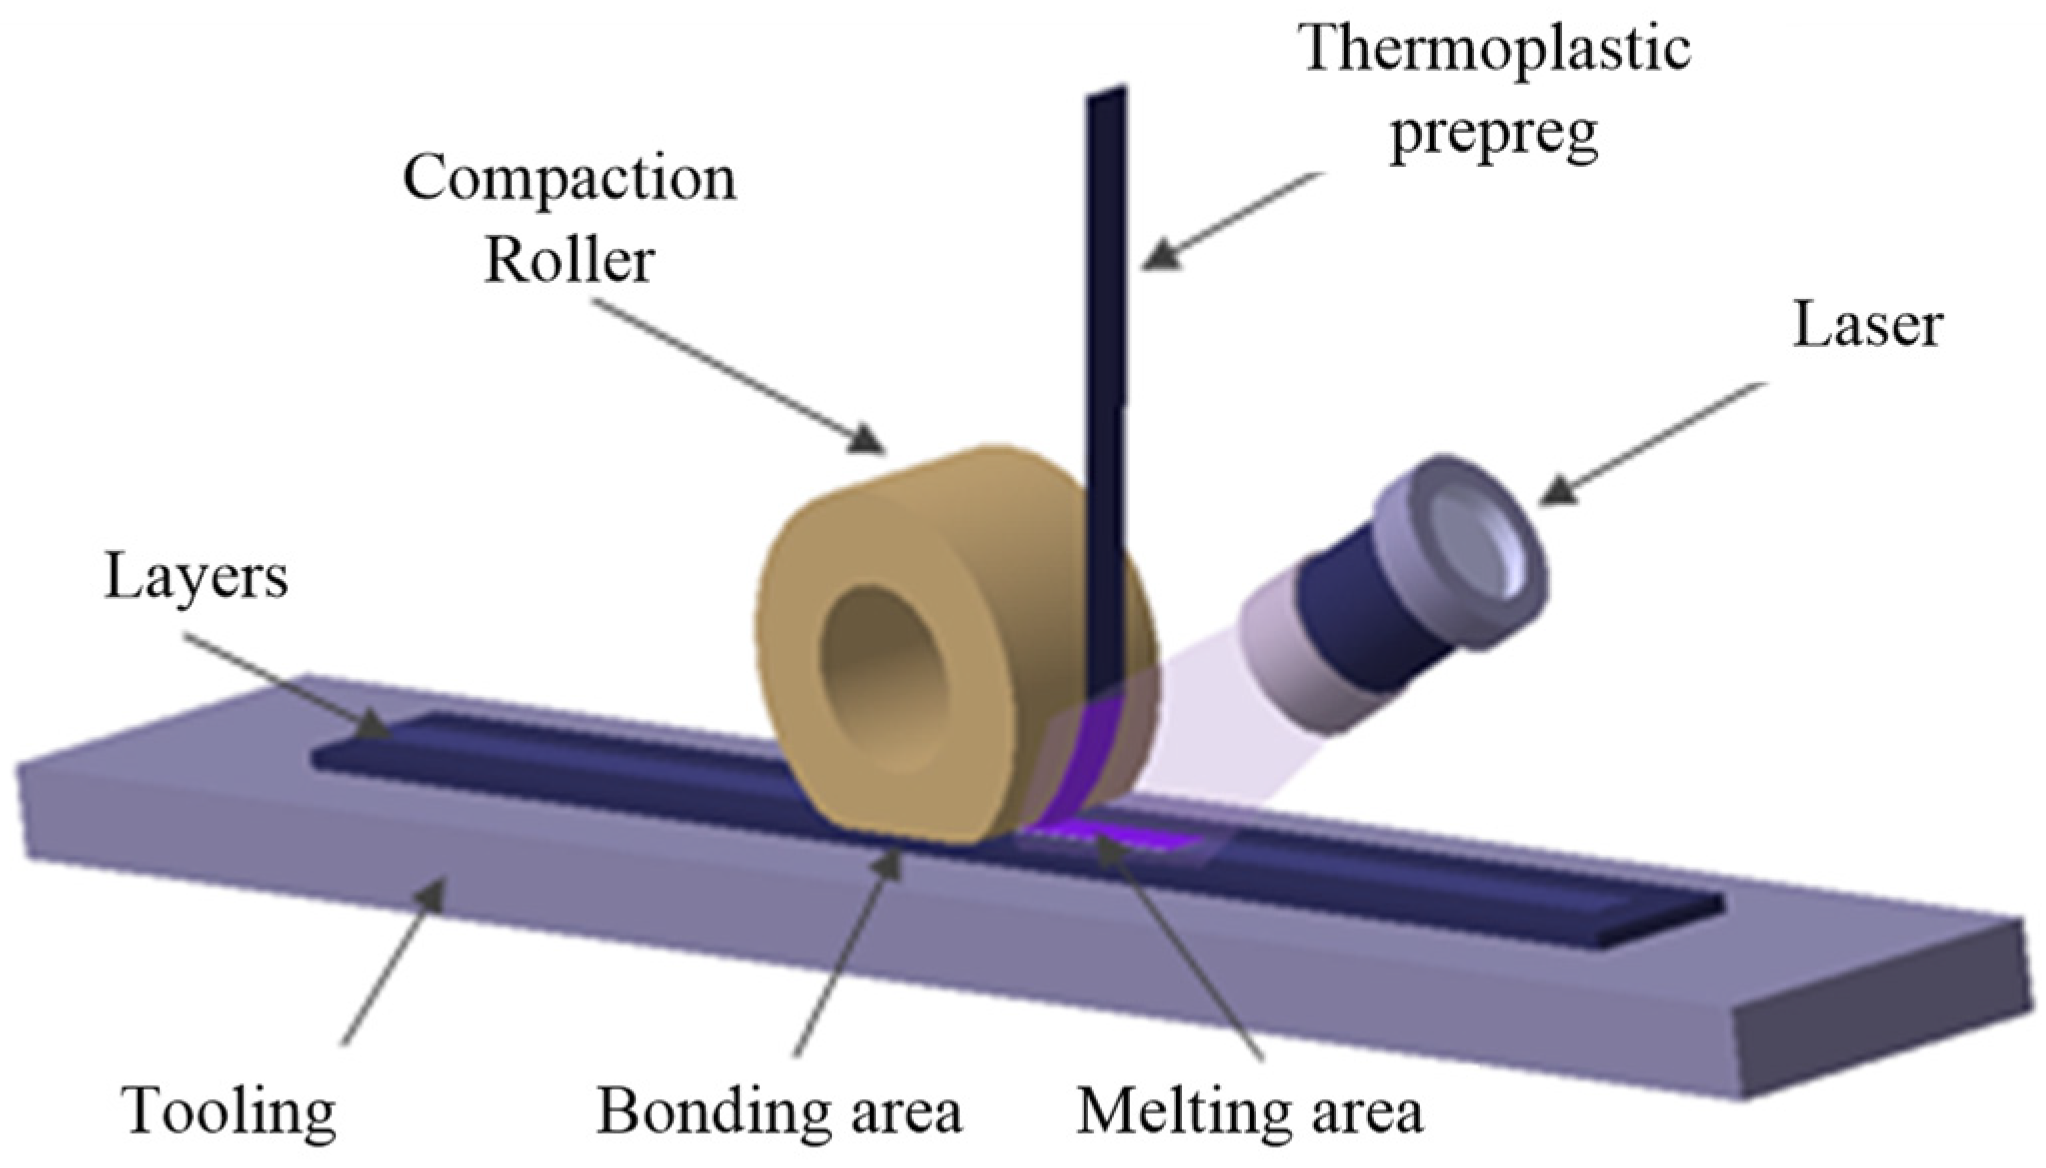
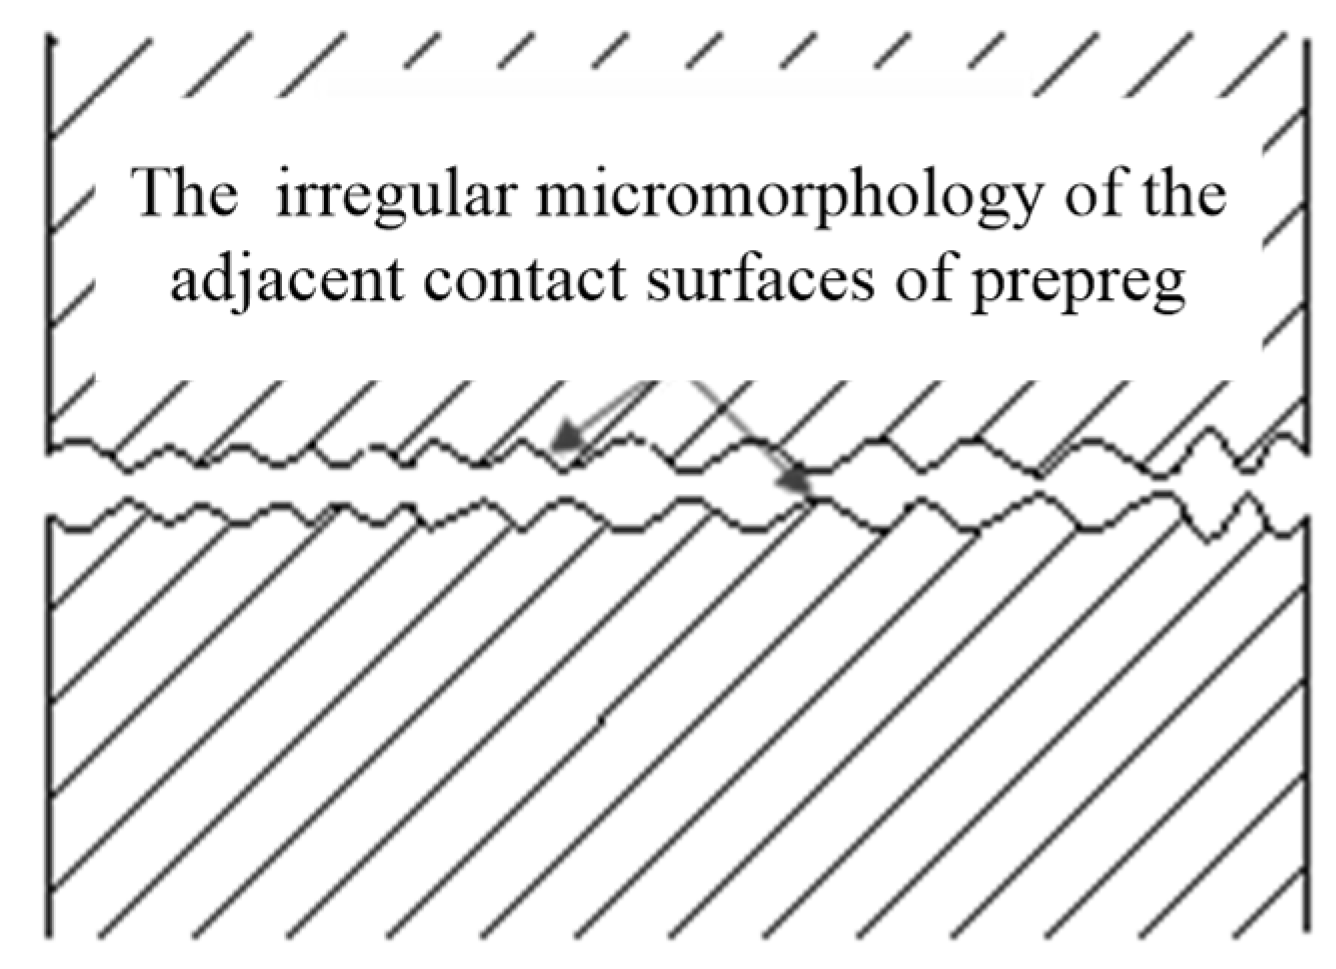
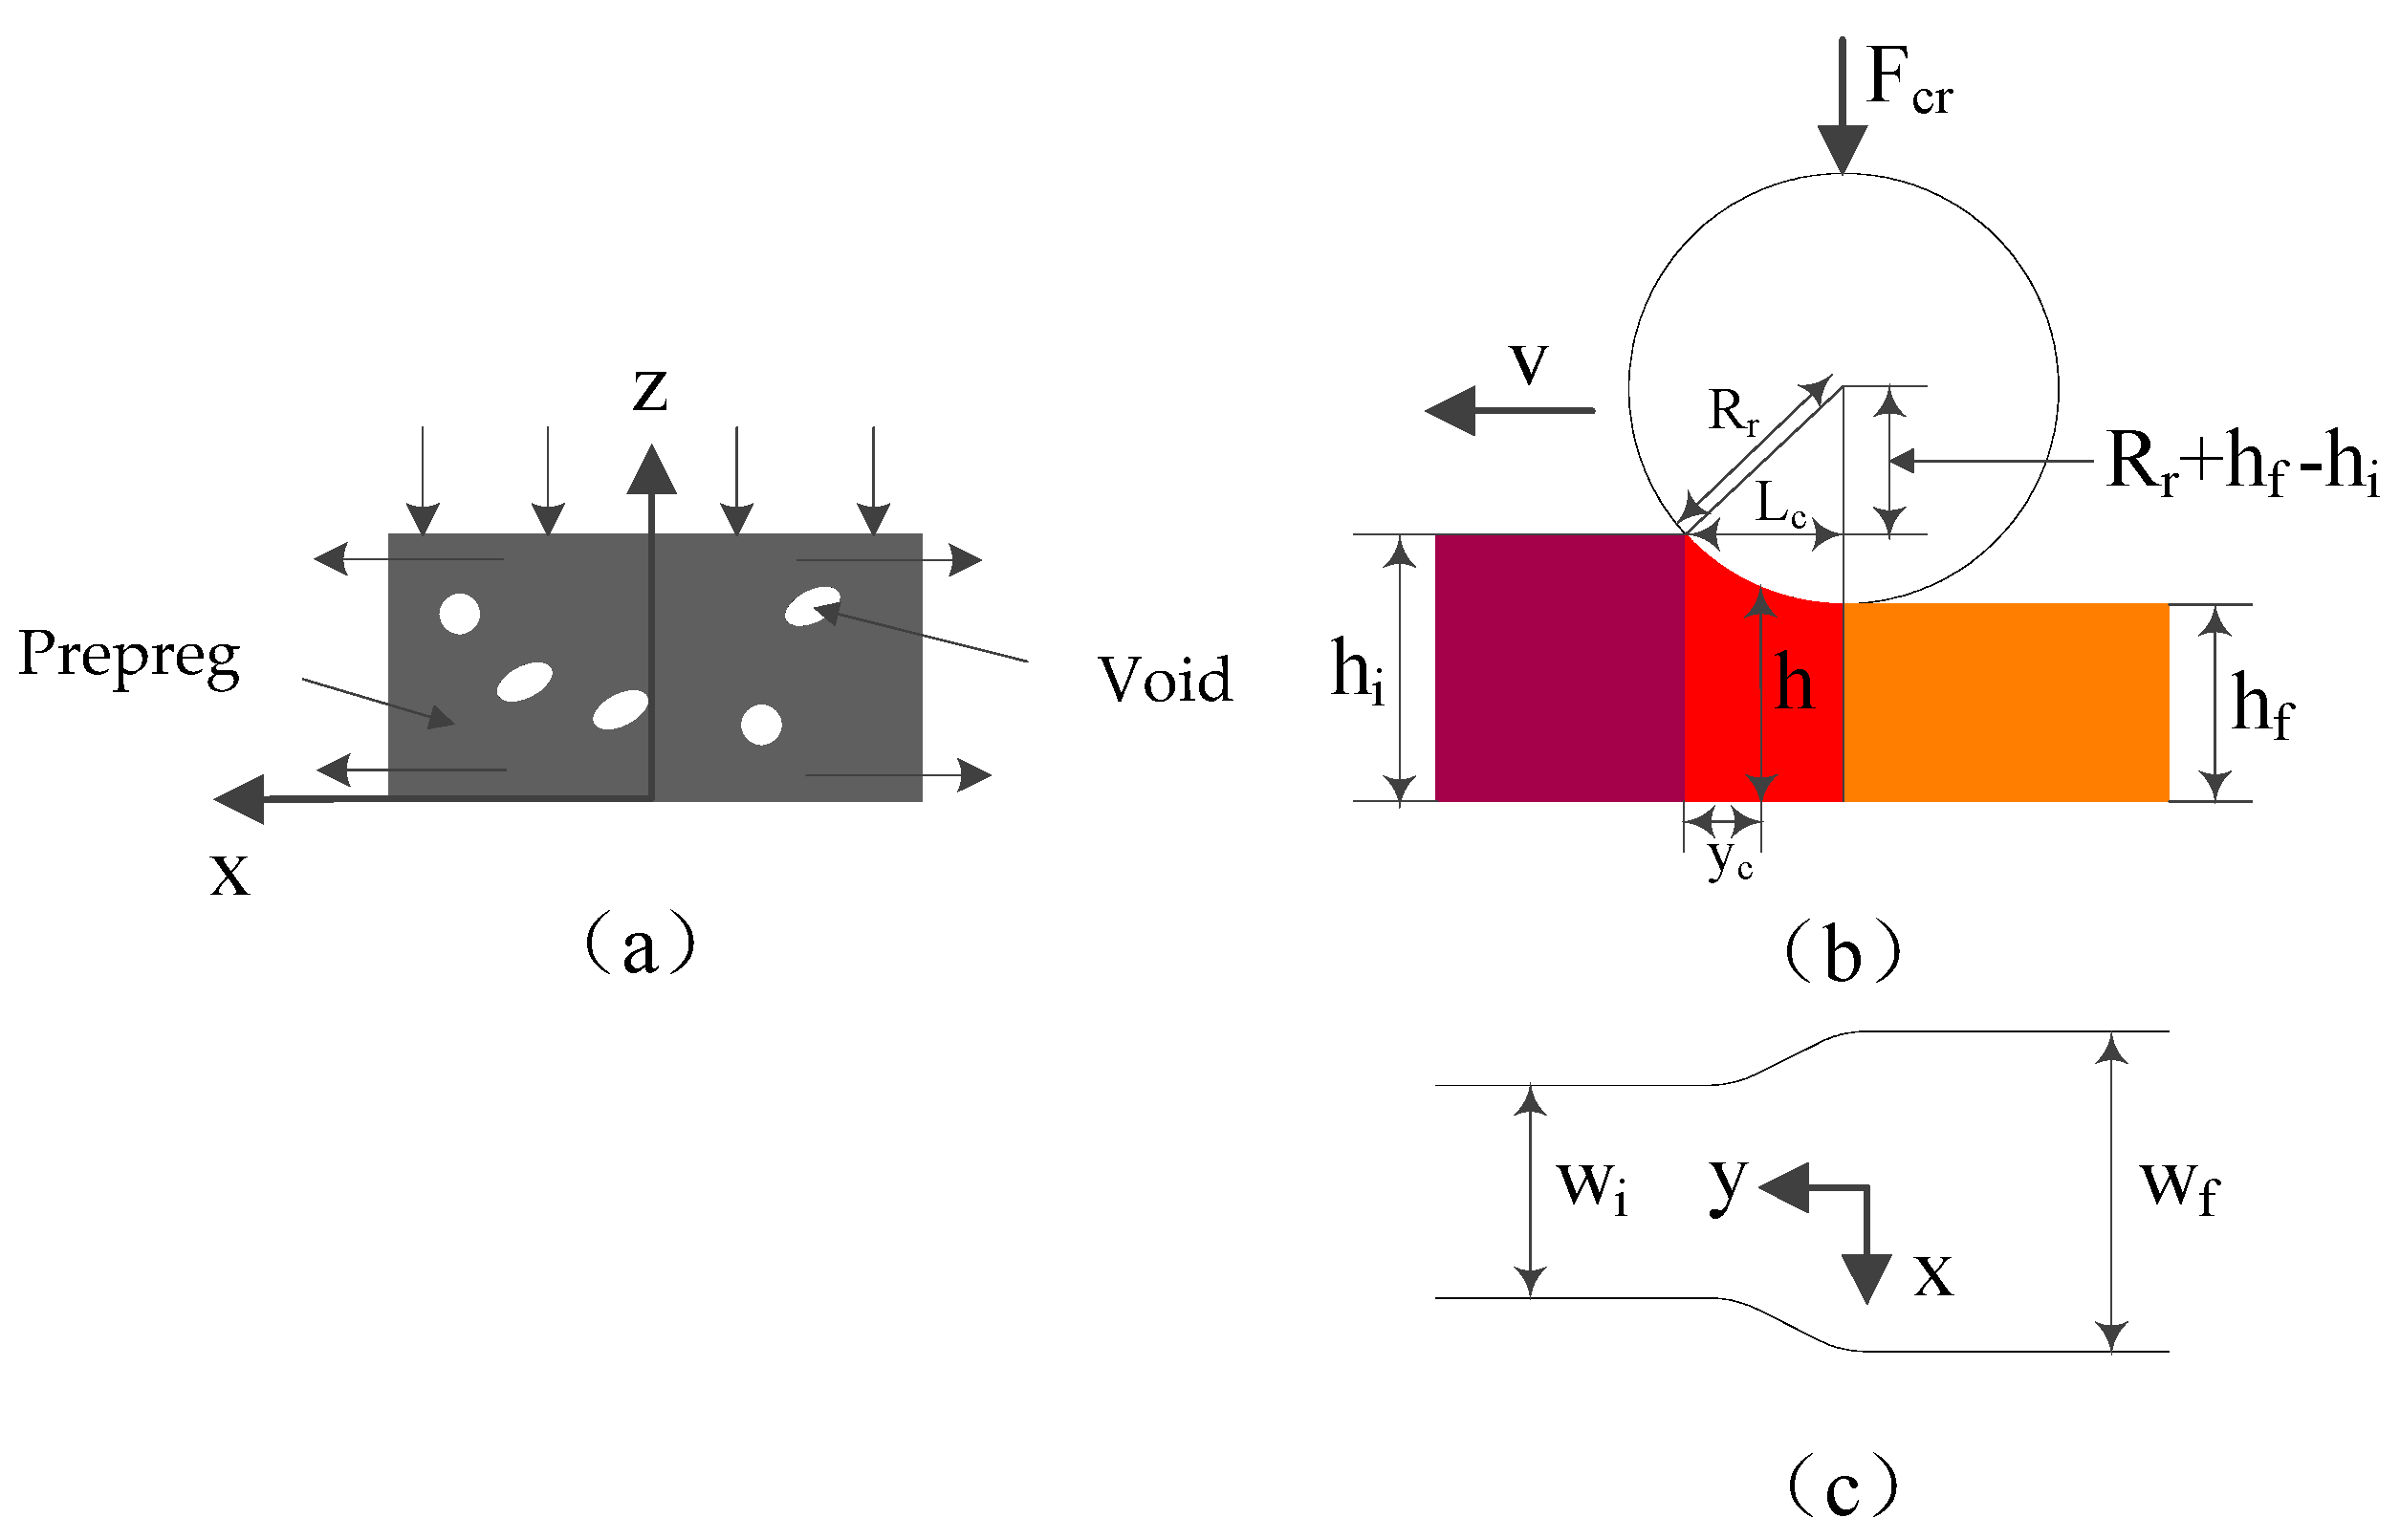
2.1. Void Formation Mechanisms
2.2. Void Dynamics Model
2.3. Boundary Conditions
2.3.1. Velocity Boundary Conditions
2.3.2. Pressure Boundary Condition
3. Materials and Methods
3.1. Material
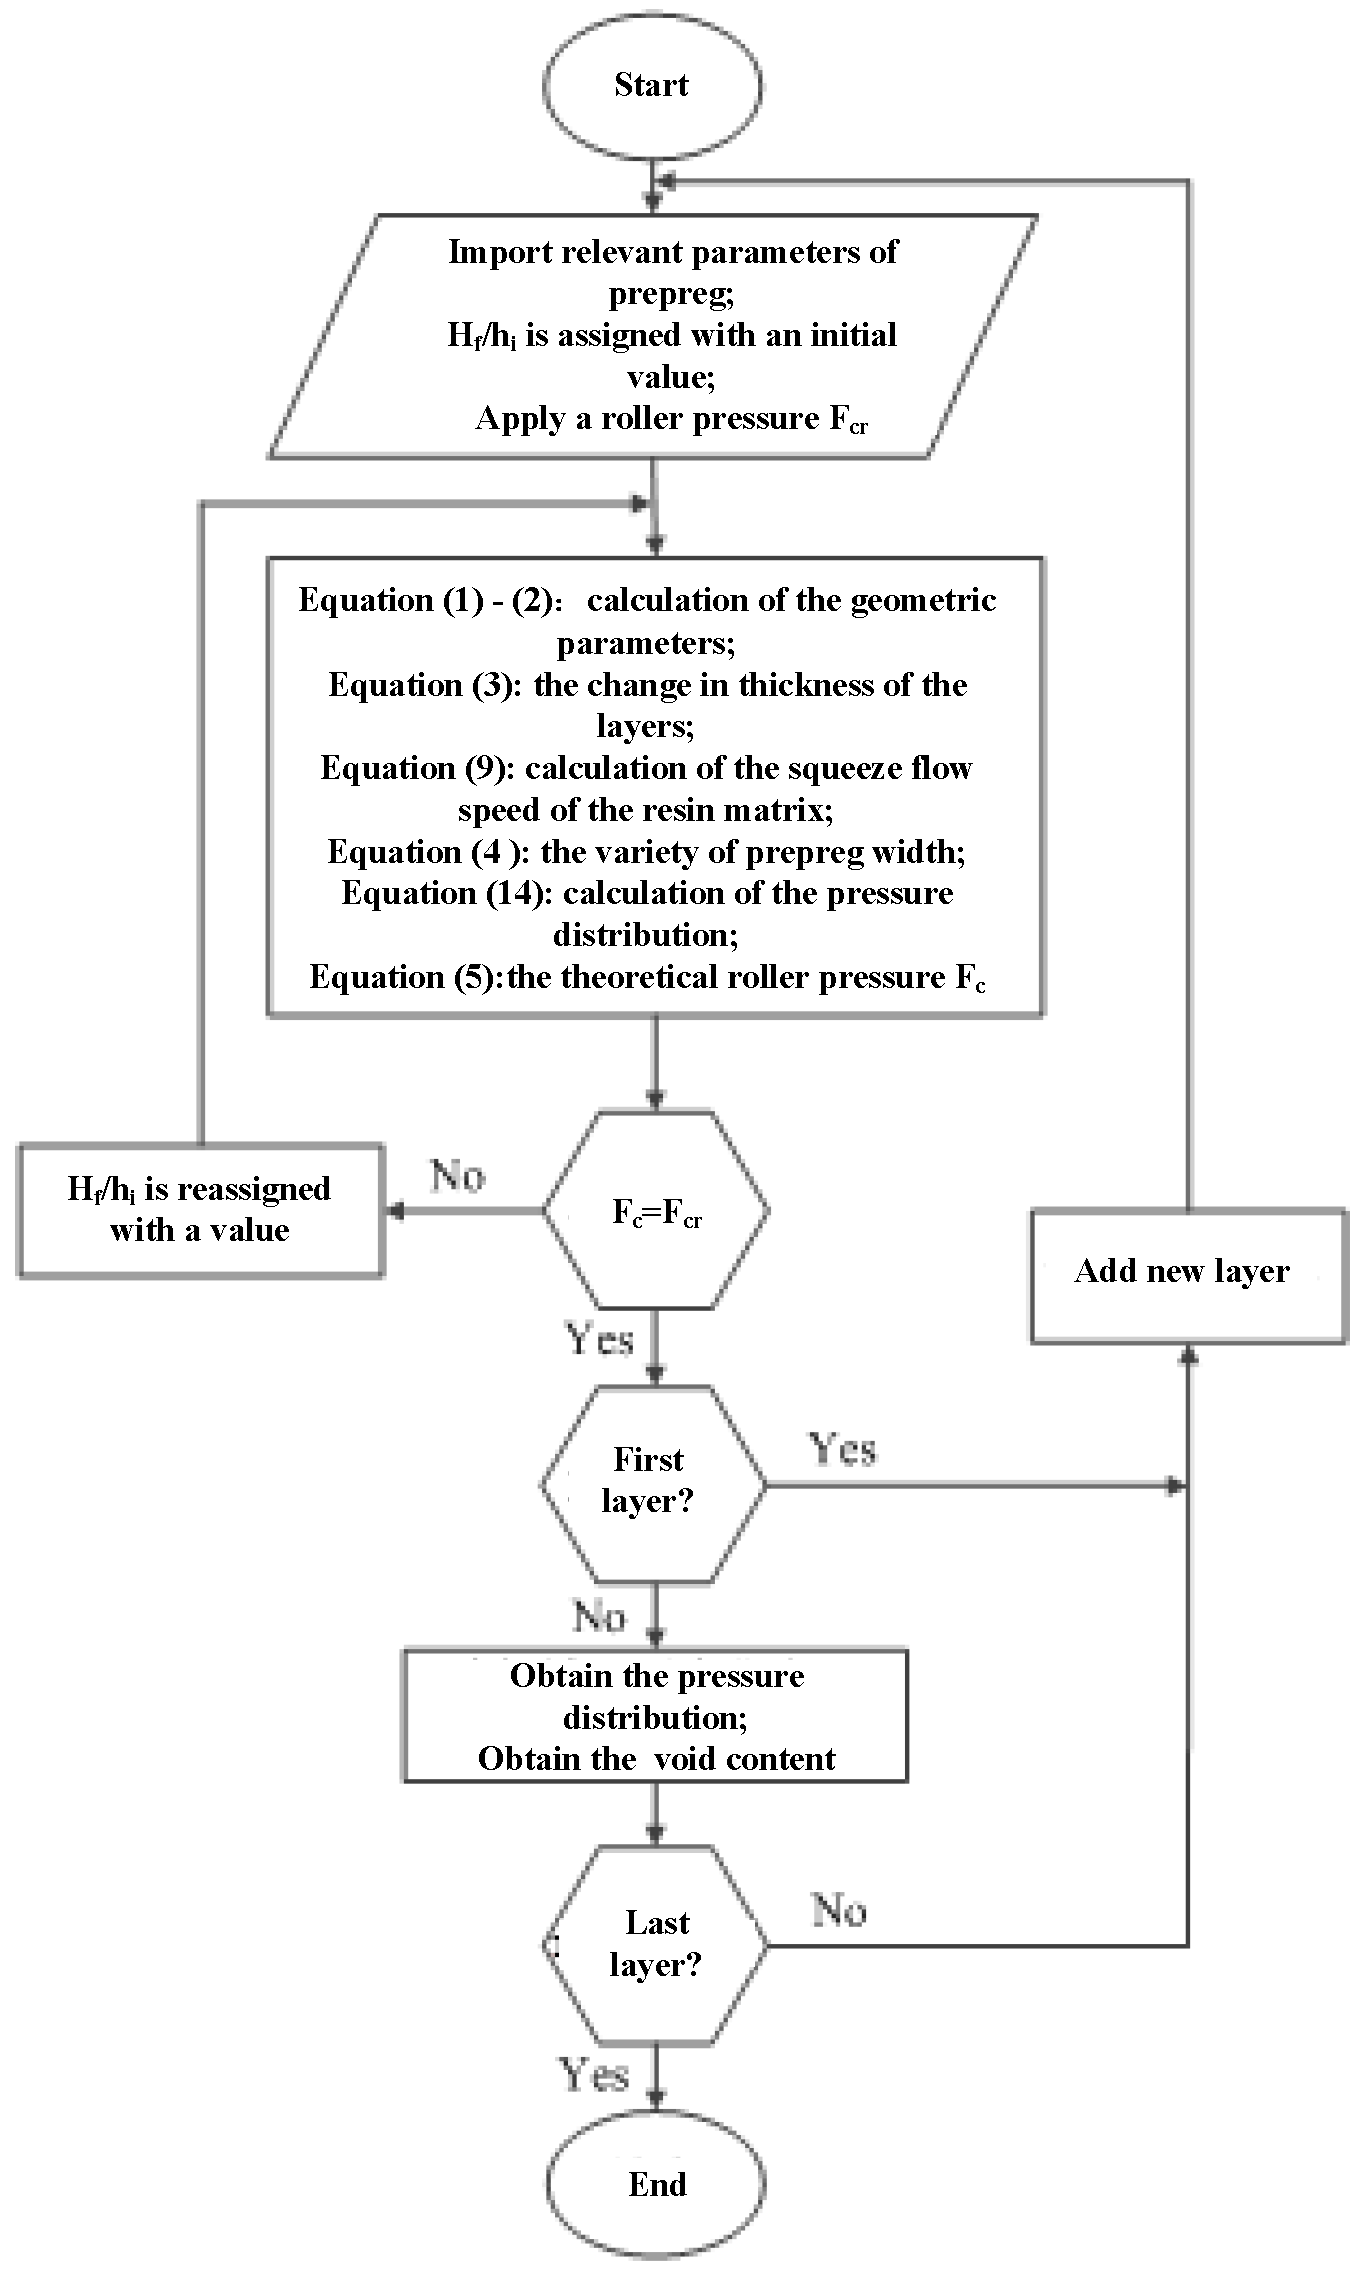
3.2. Model Prediction Methods
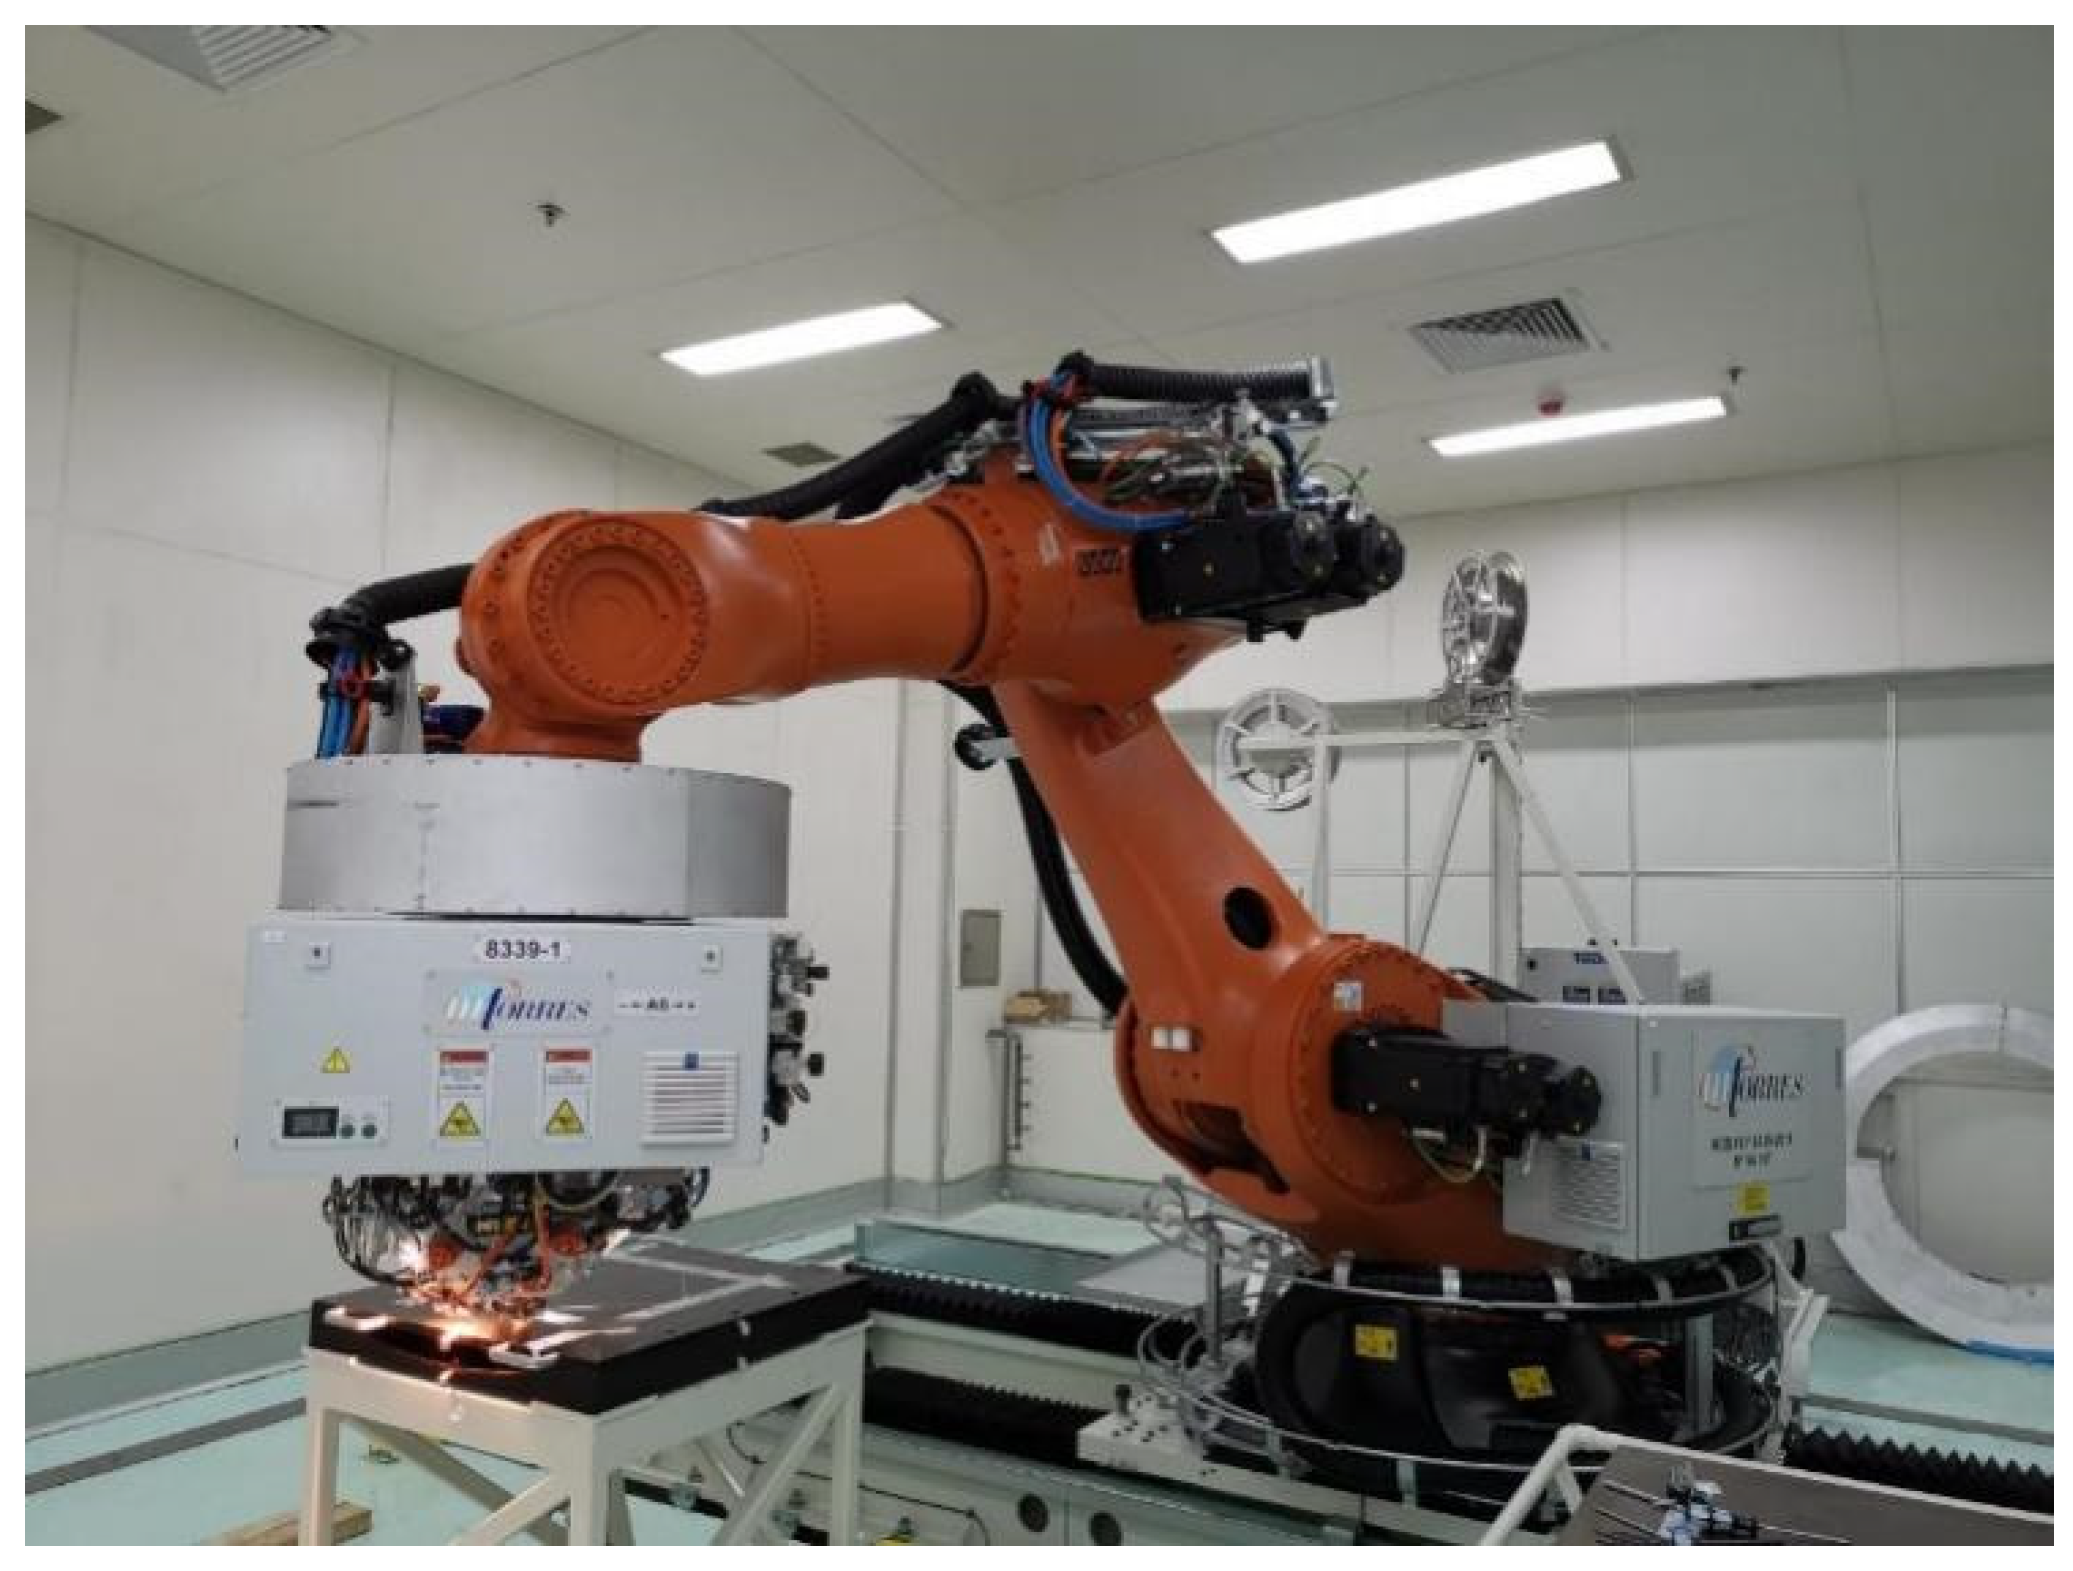
3.3. Experimental Section
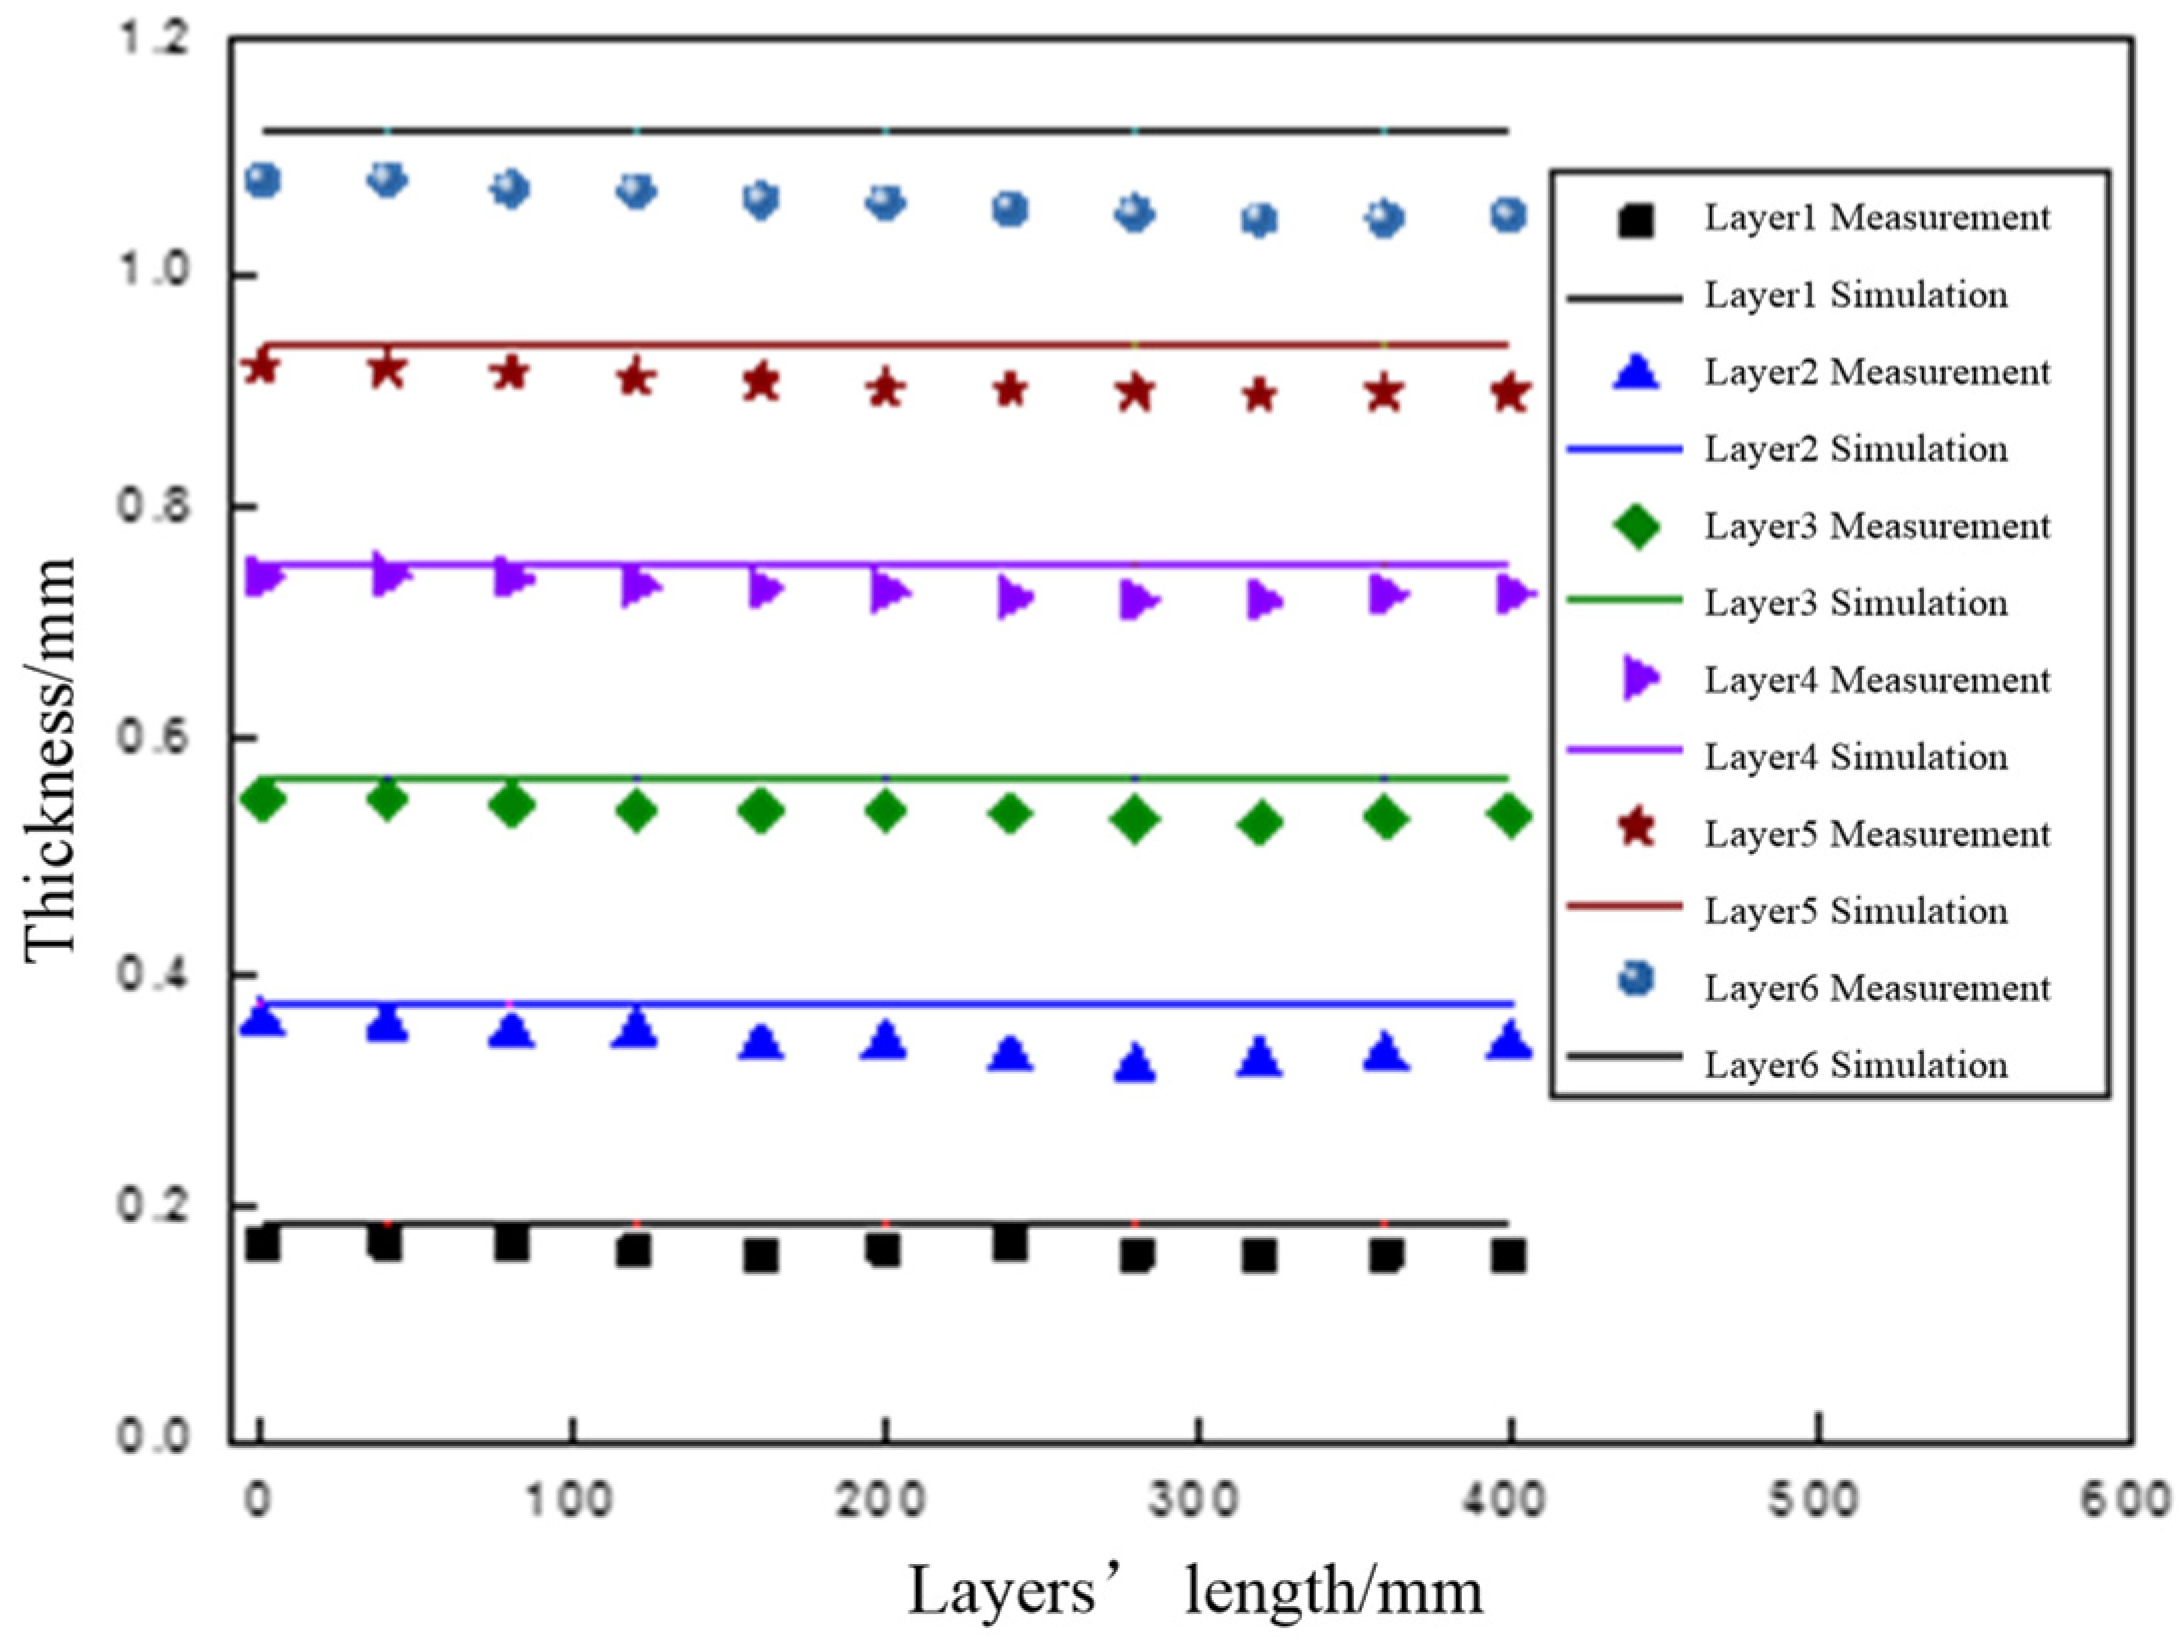
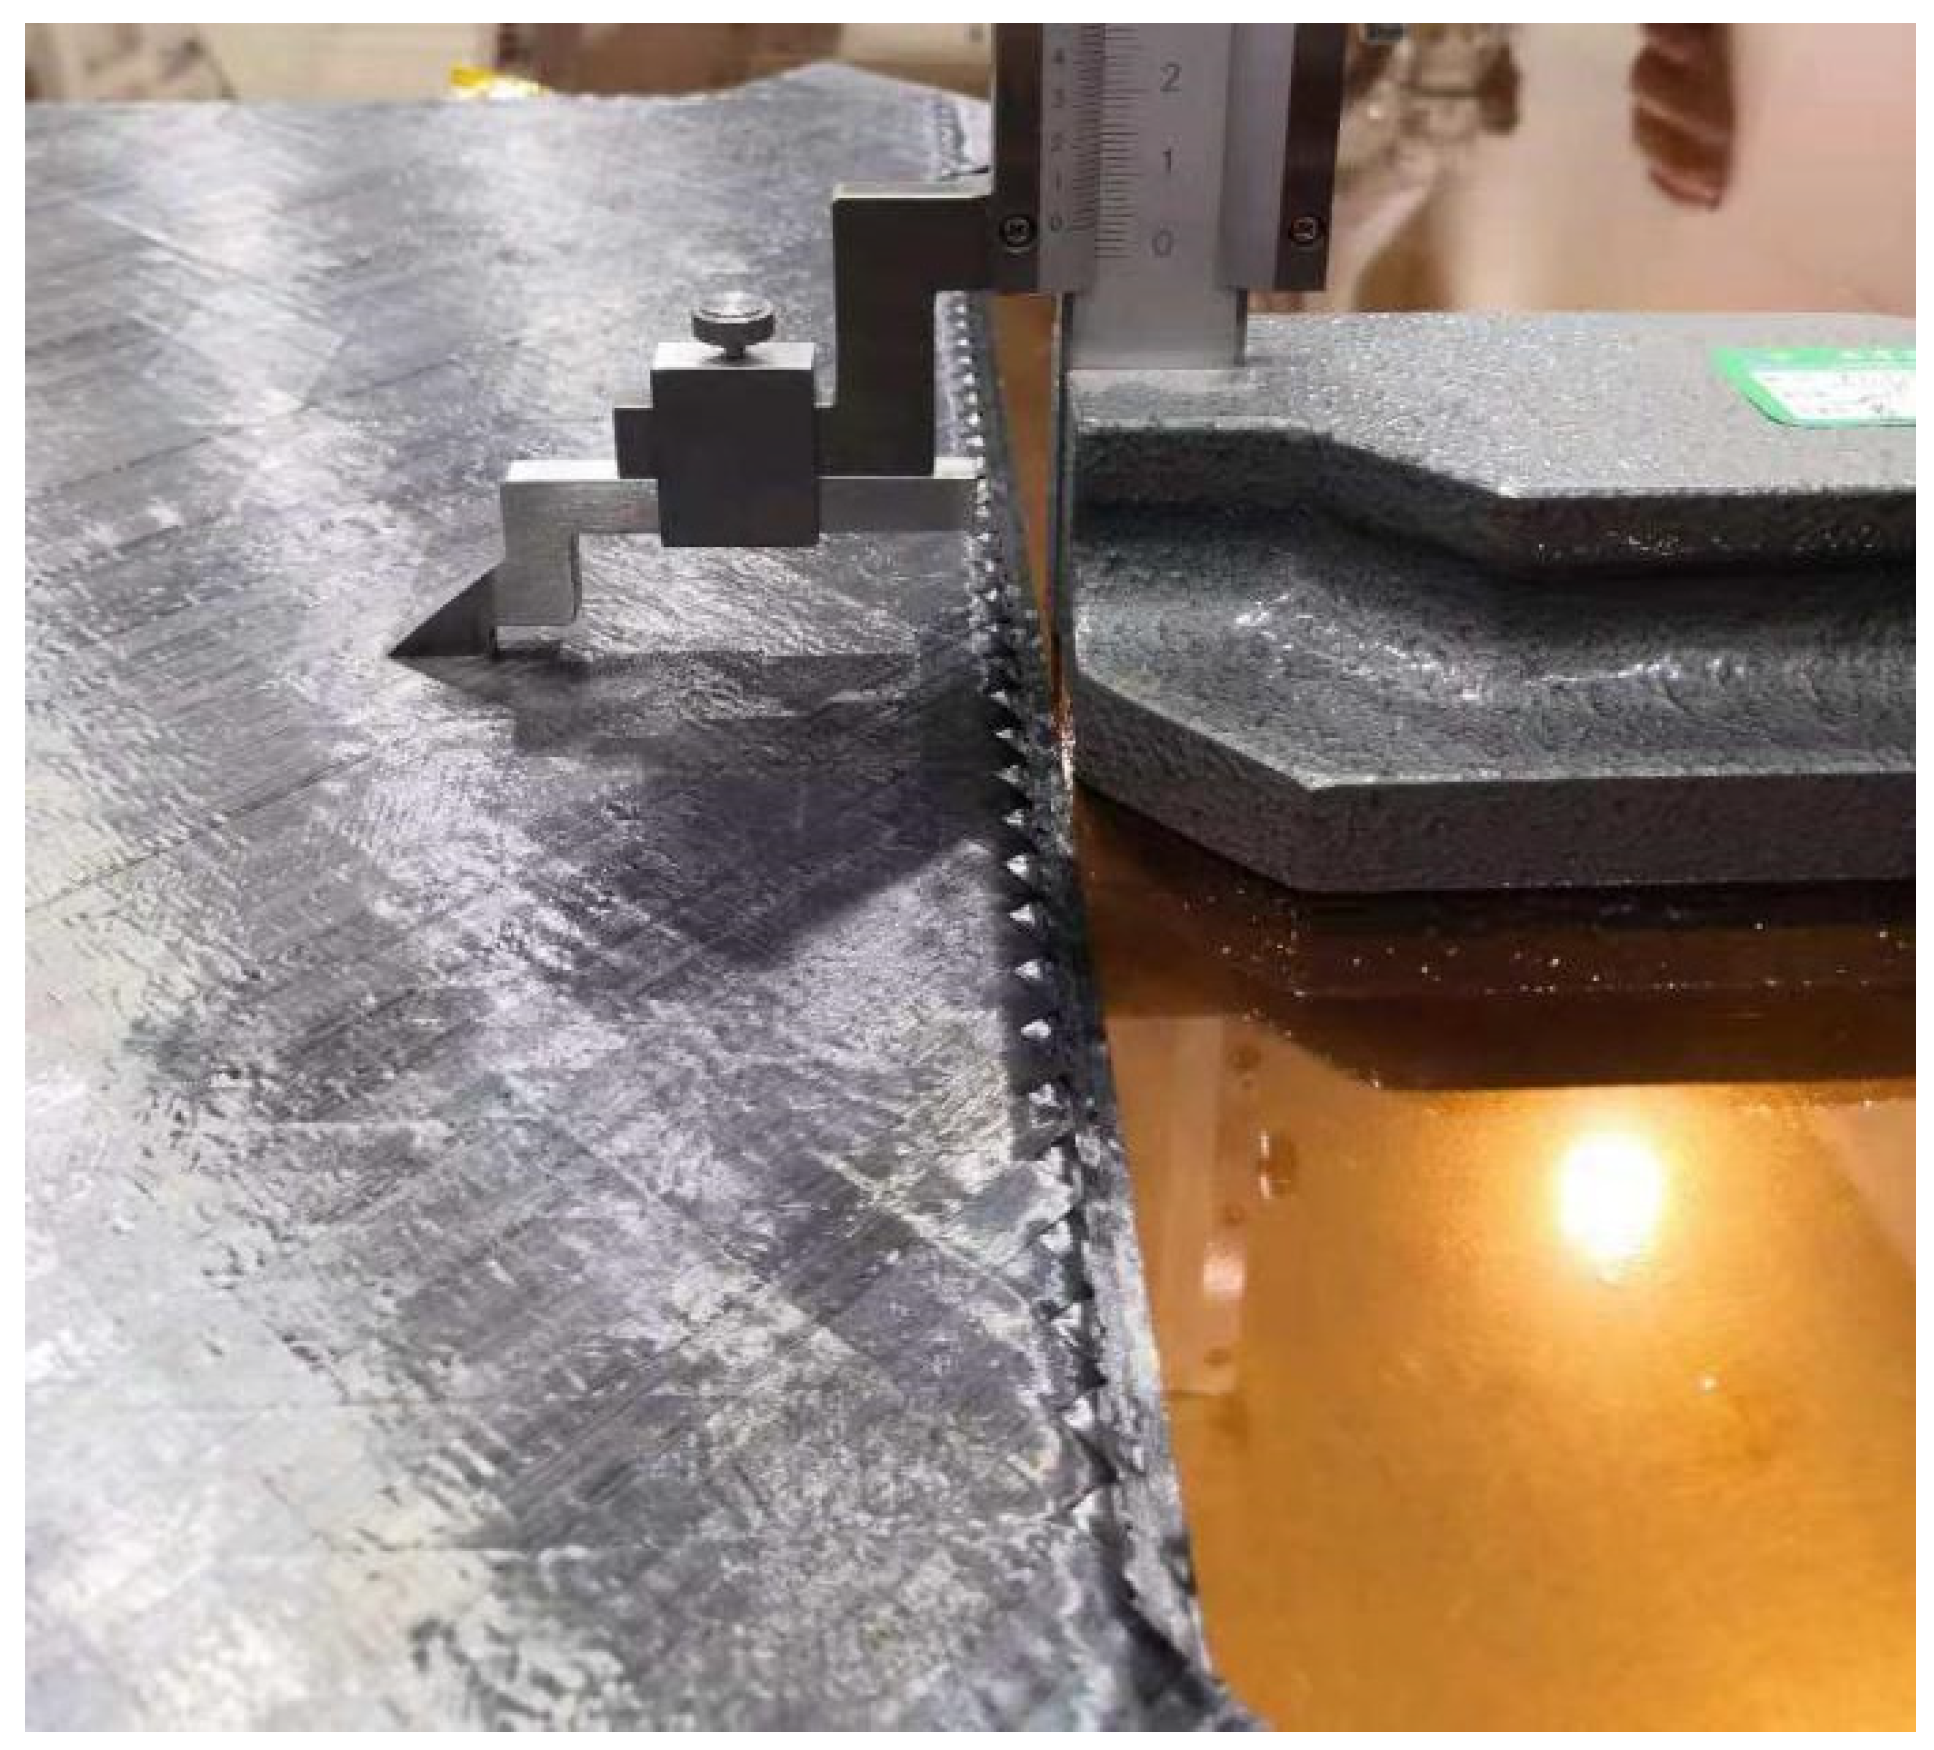
3.3.1. Thickness Measurement
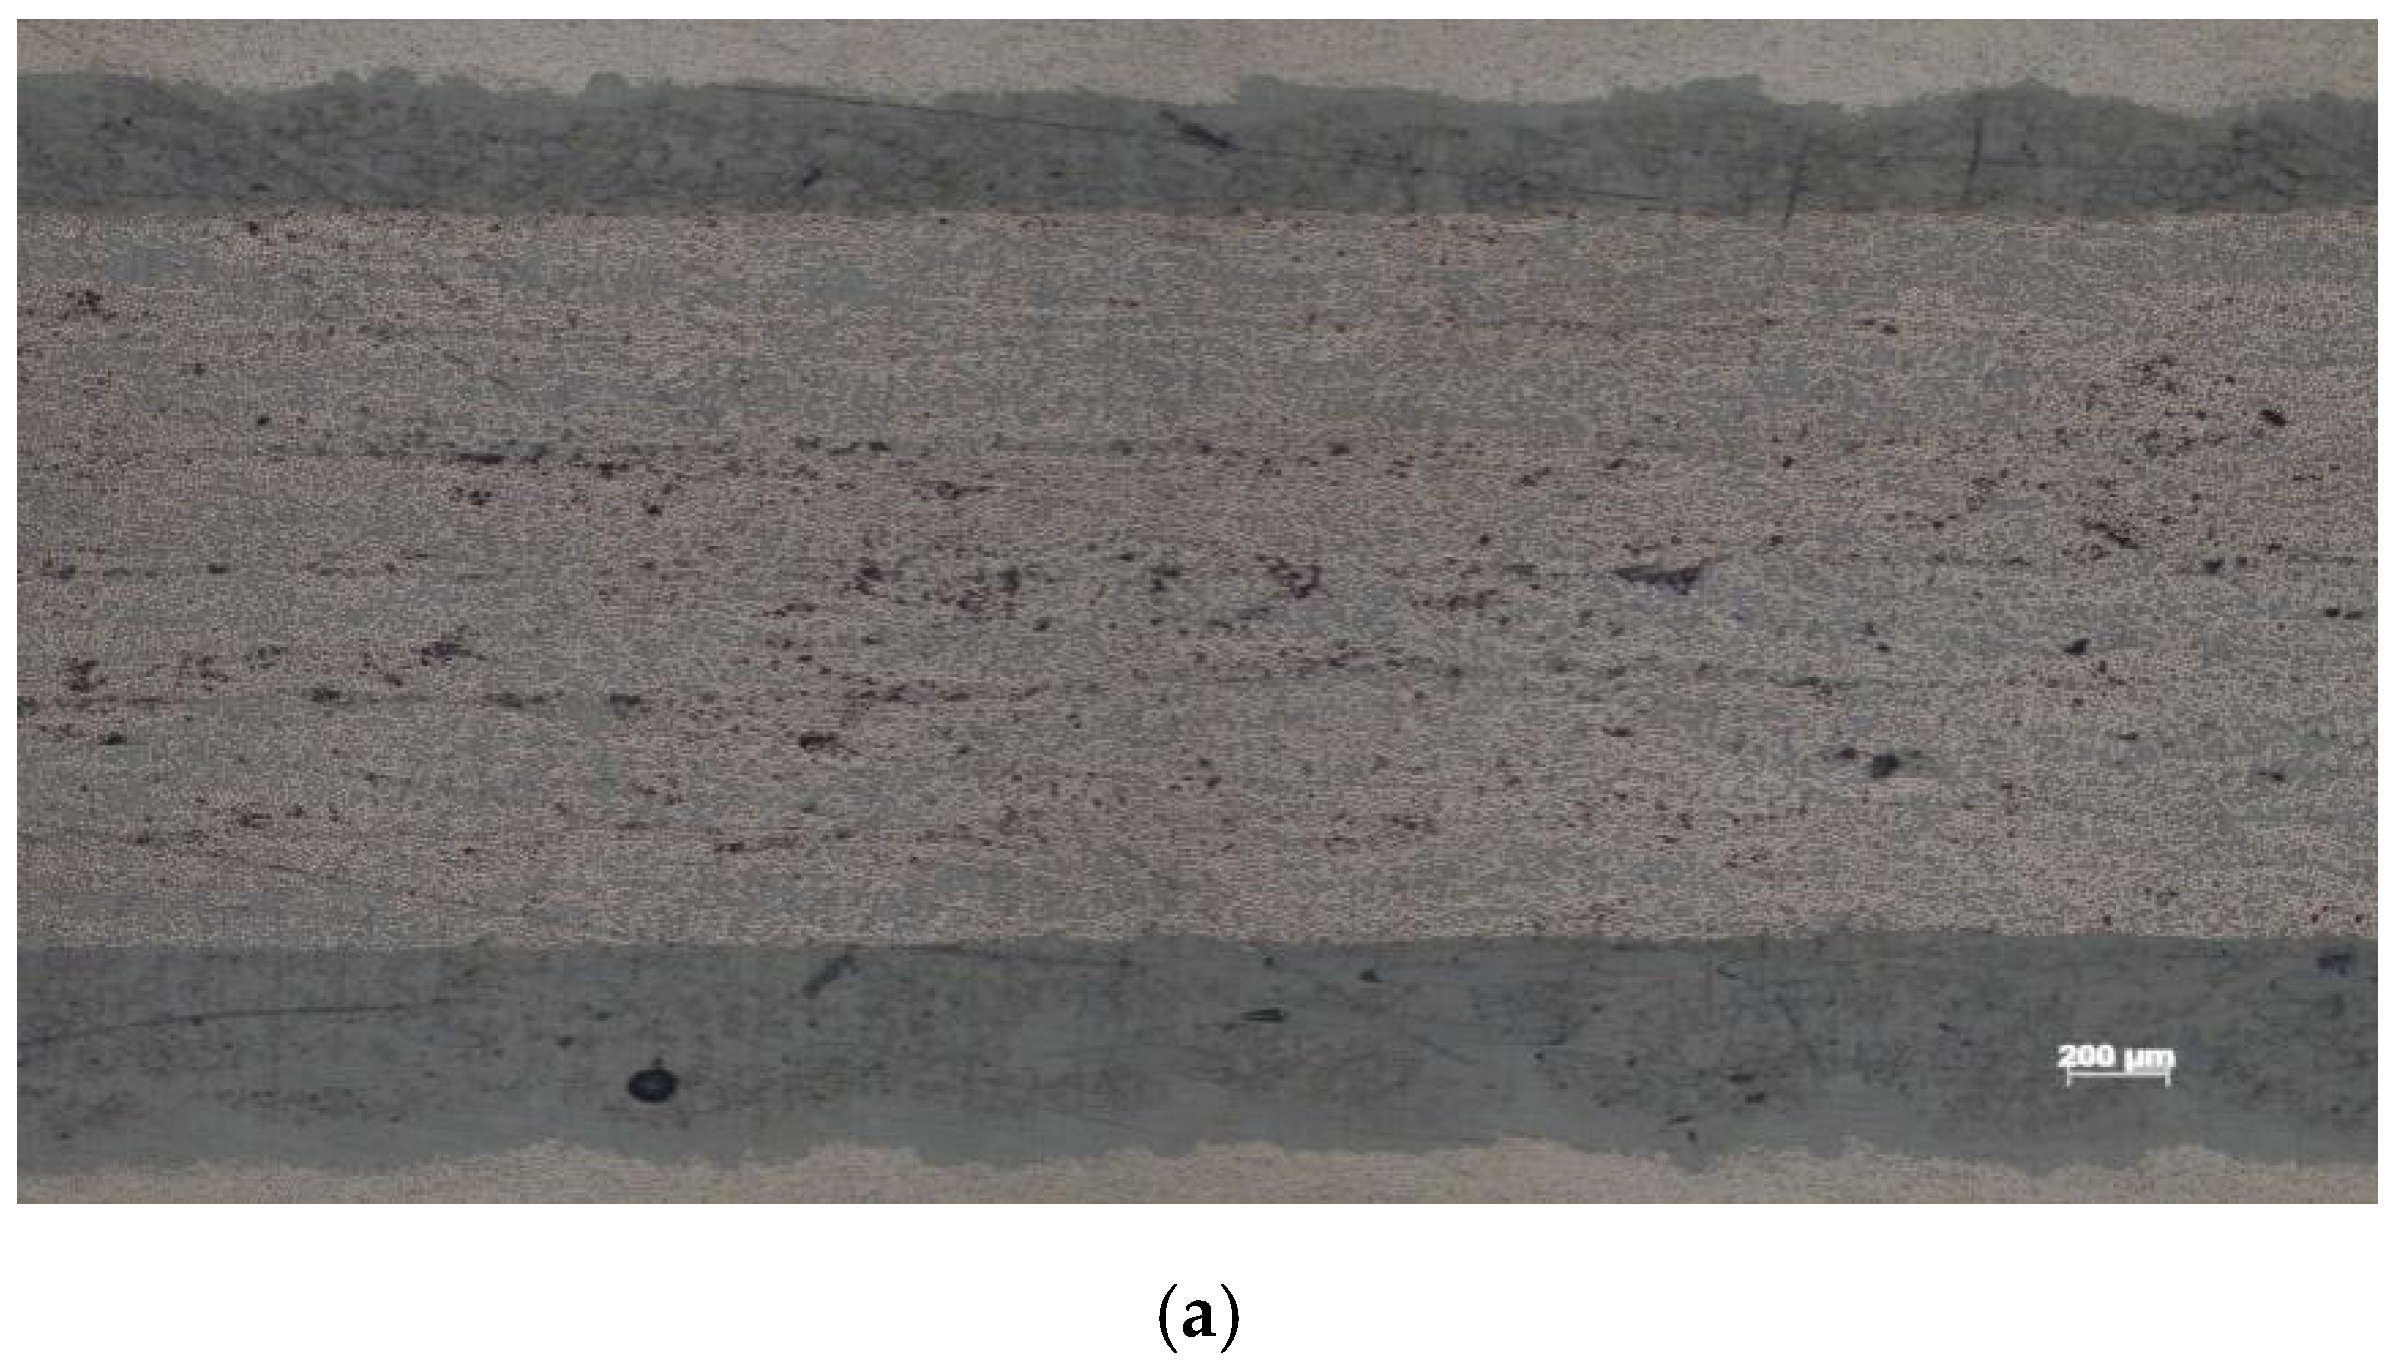
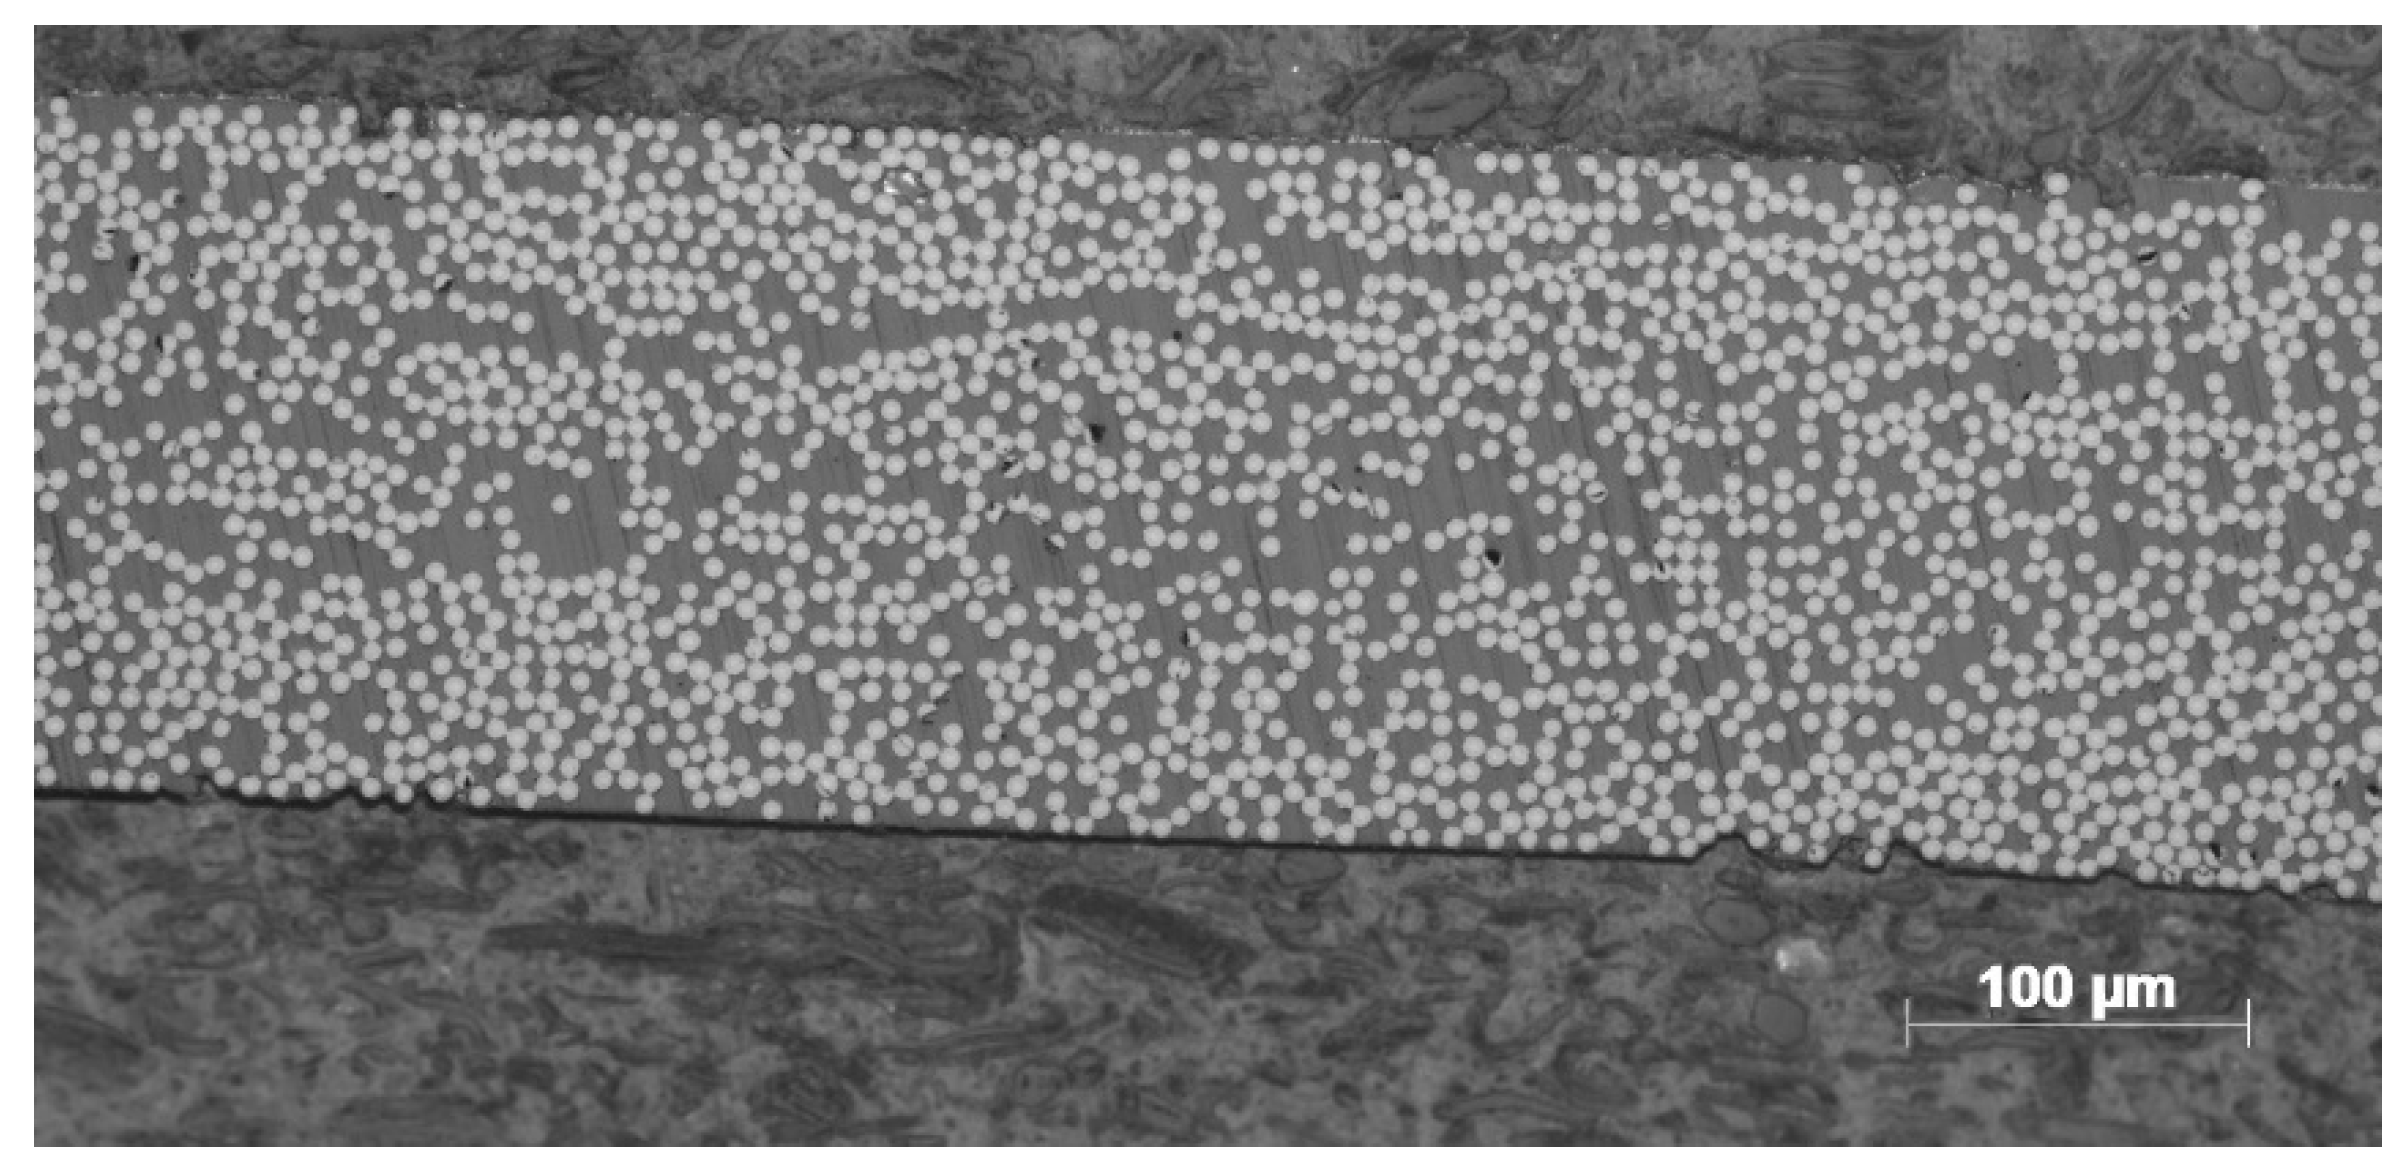
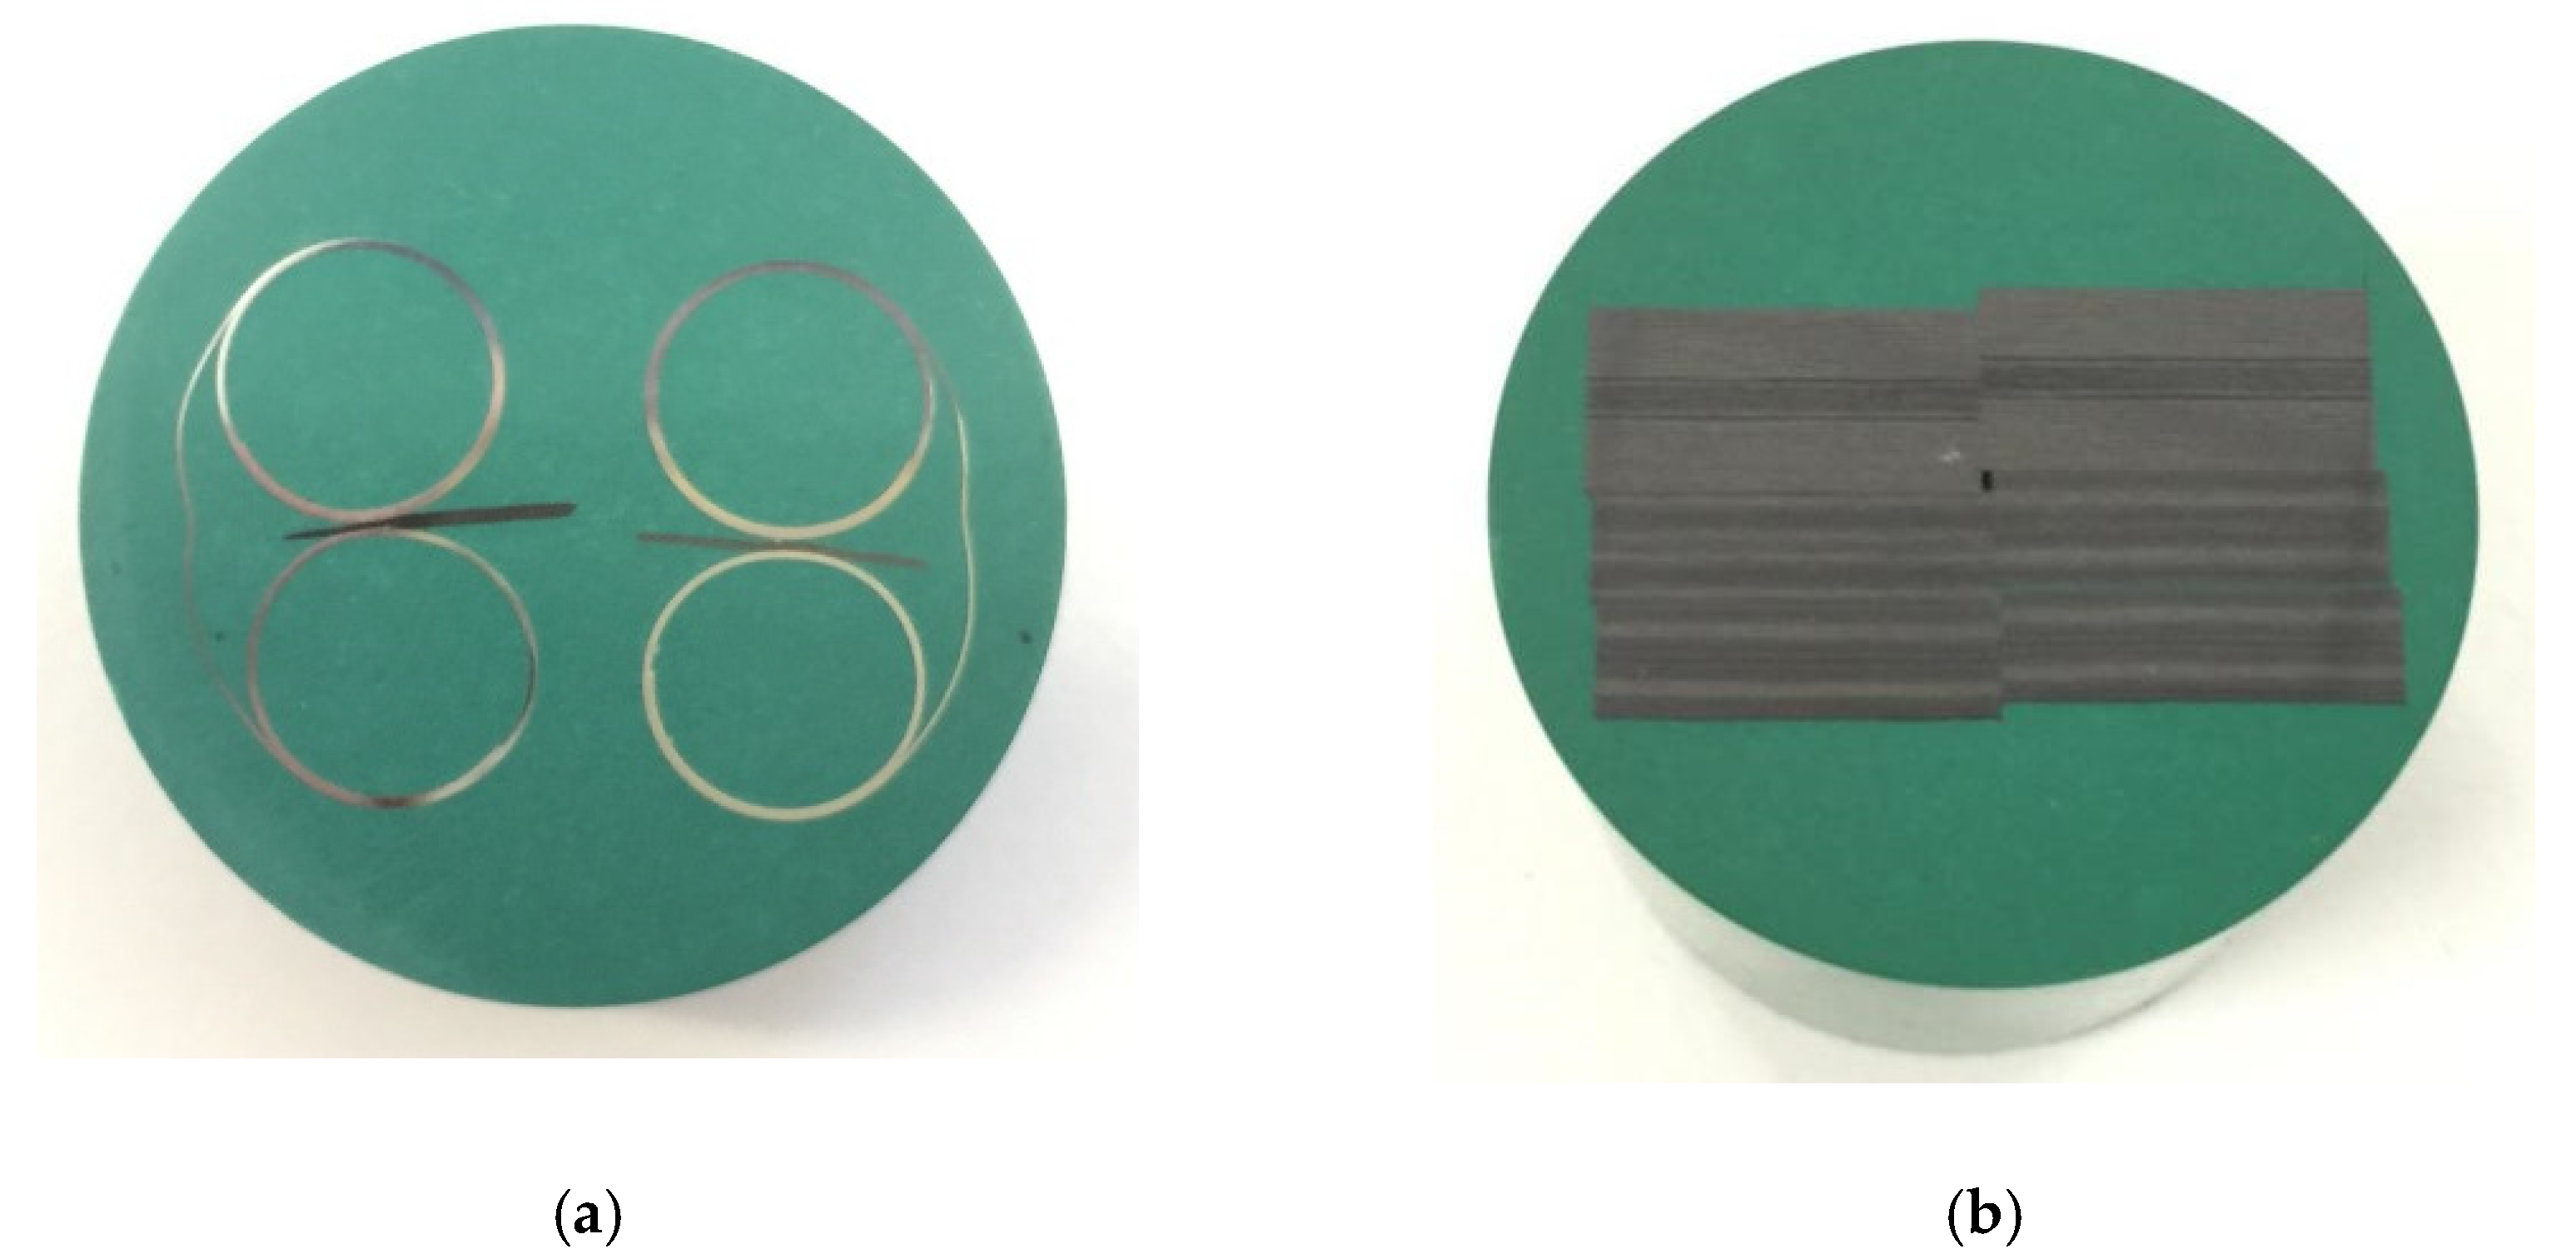
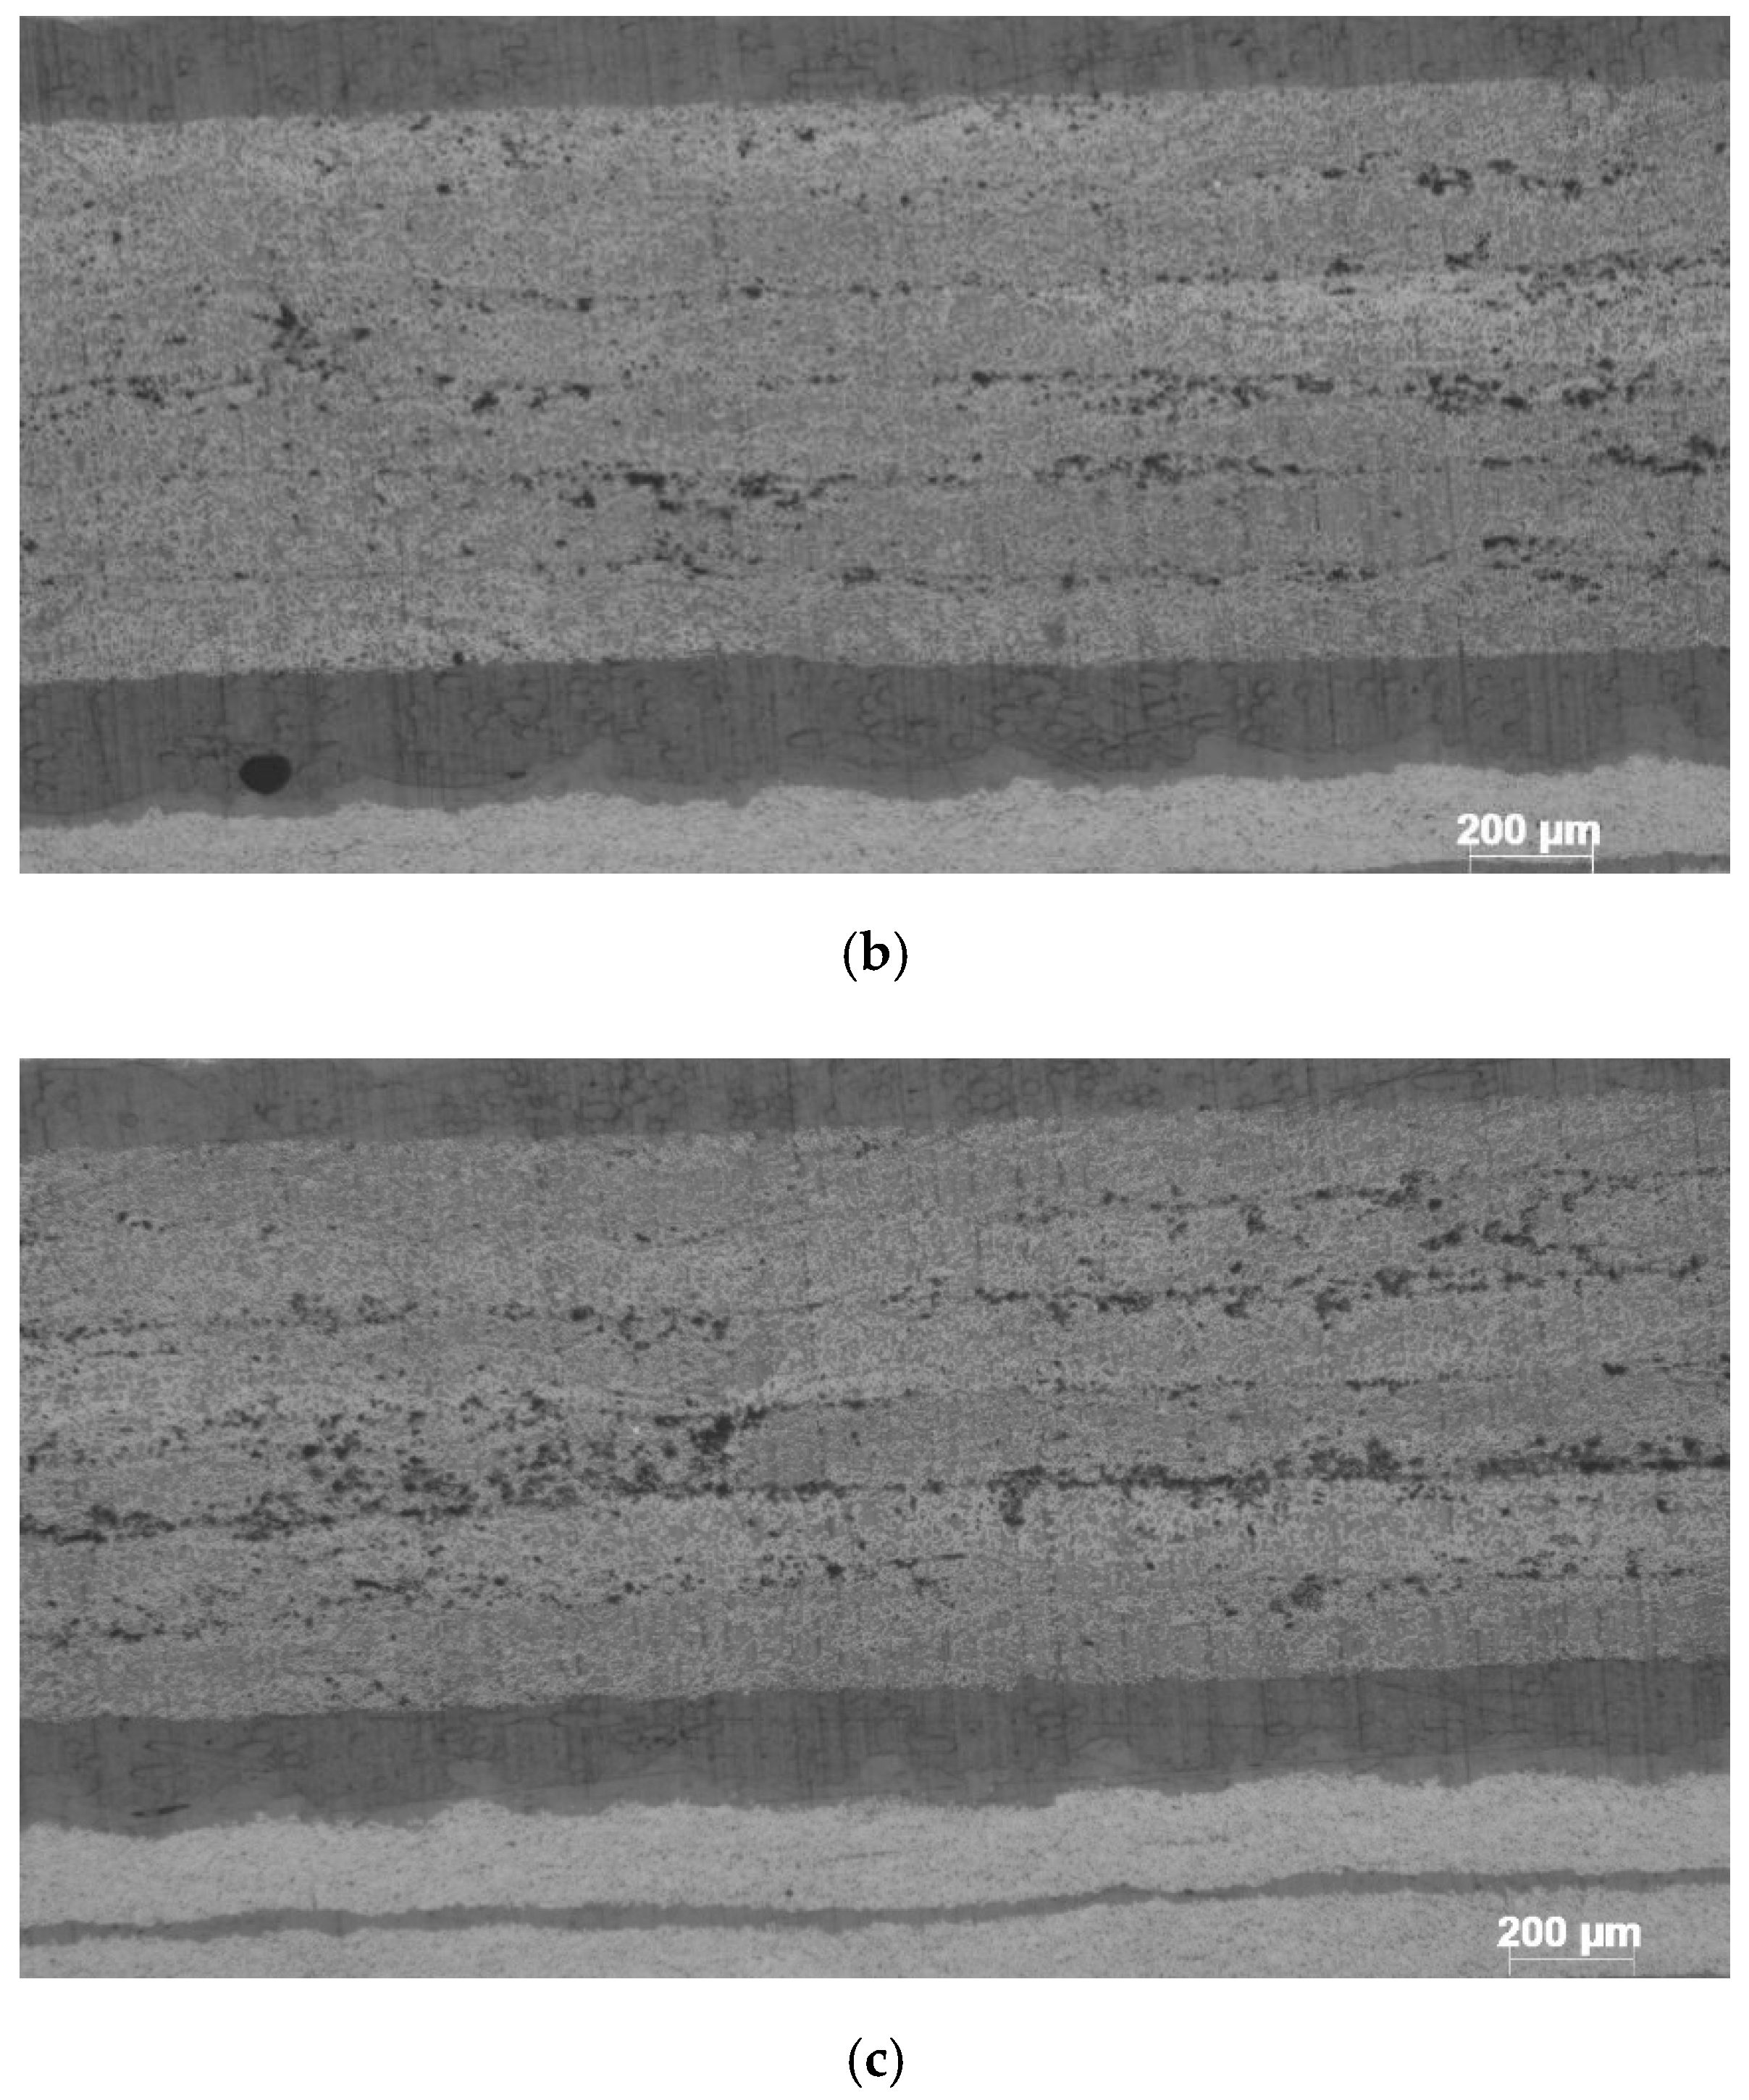
3.3.2. Metallographic Observation
4. Results and Discussion
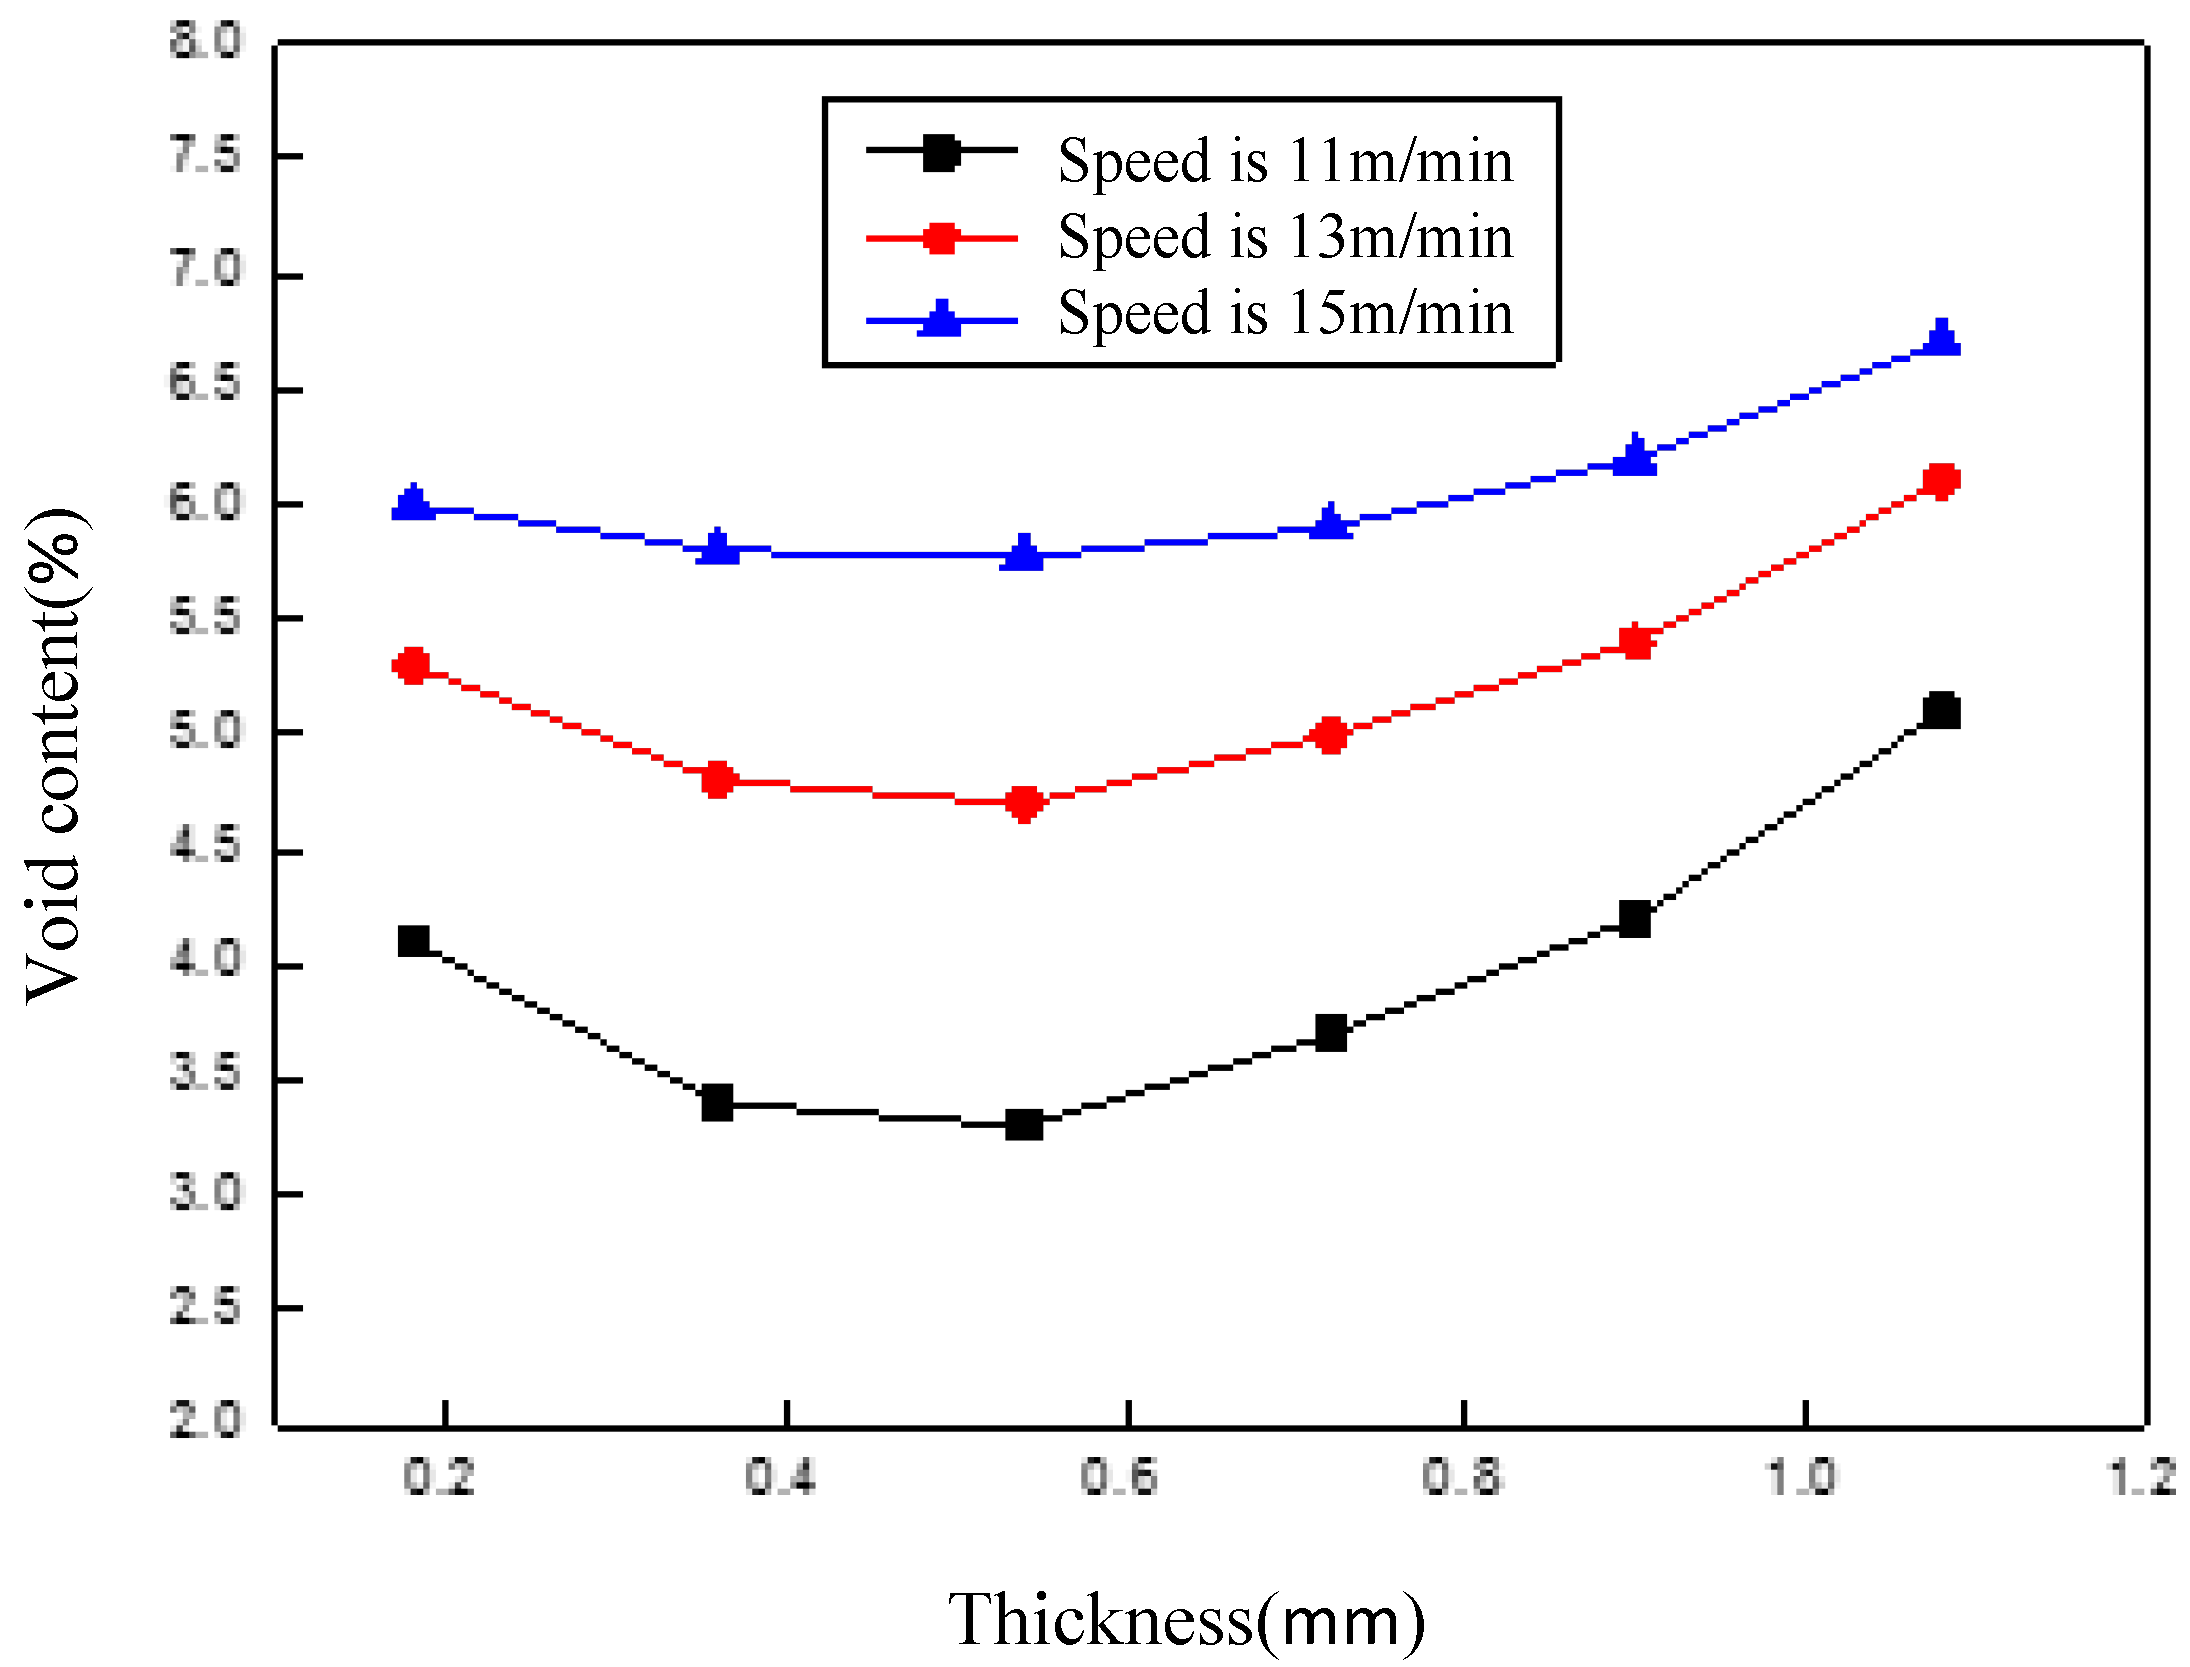
4.1. Model Prediction
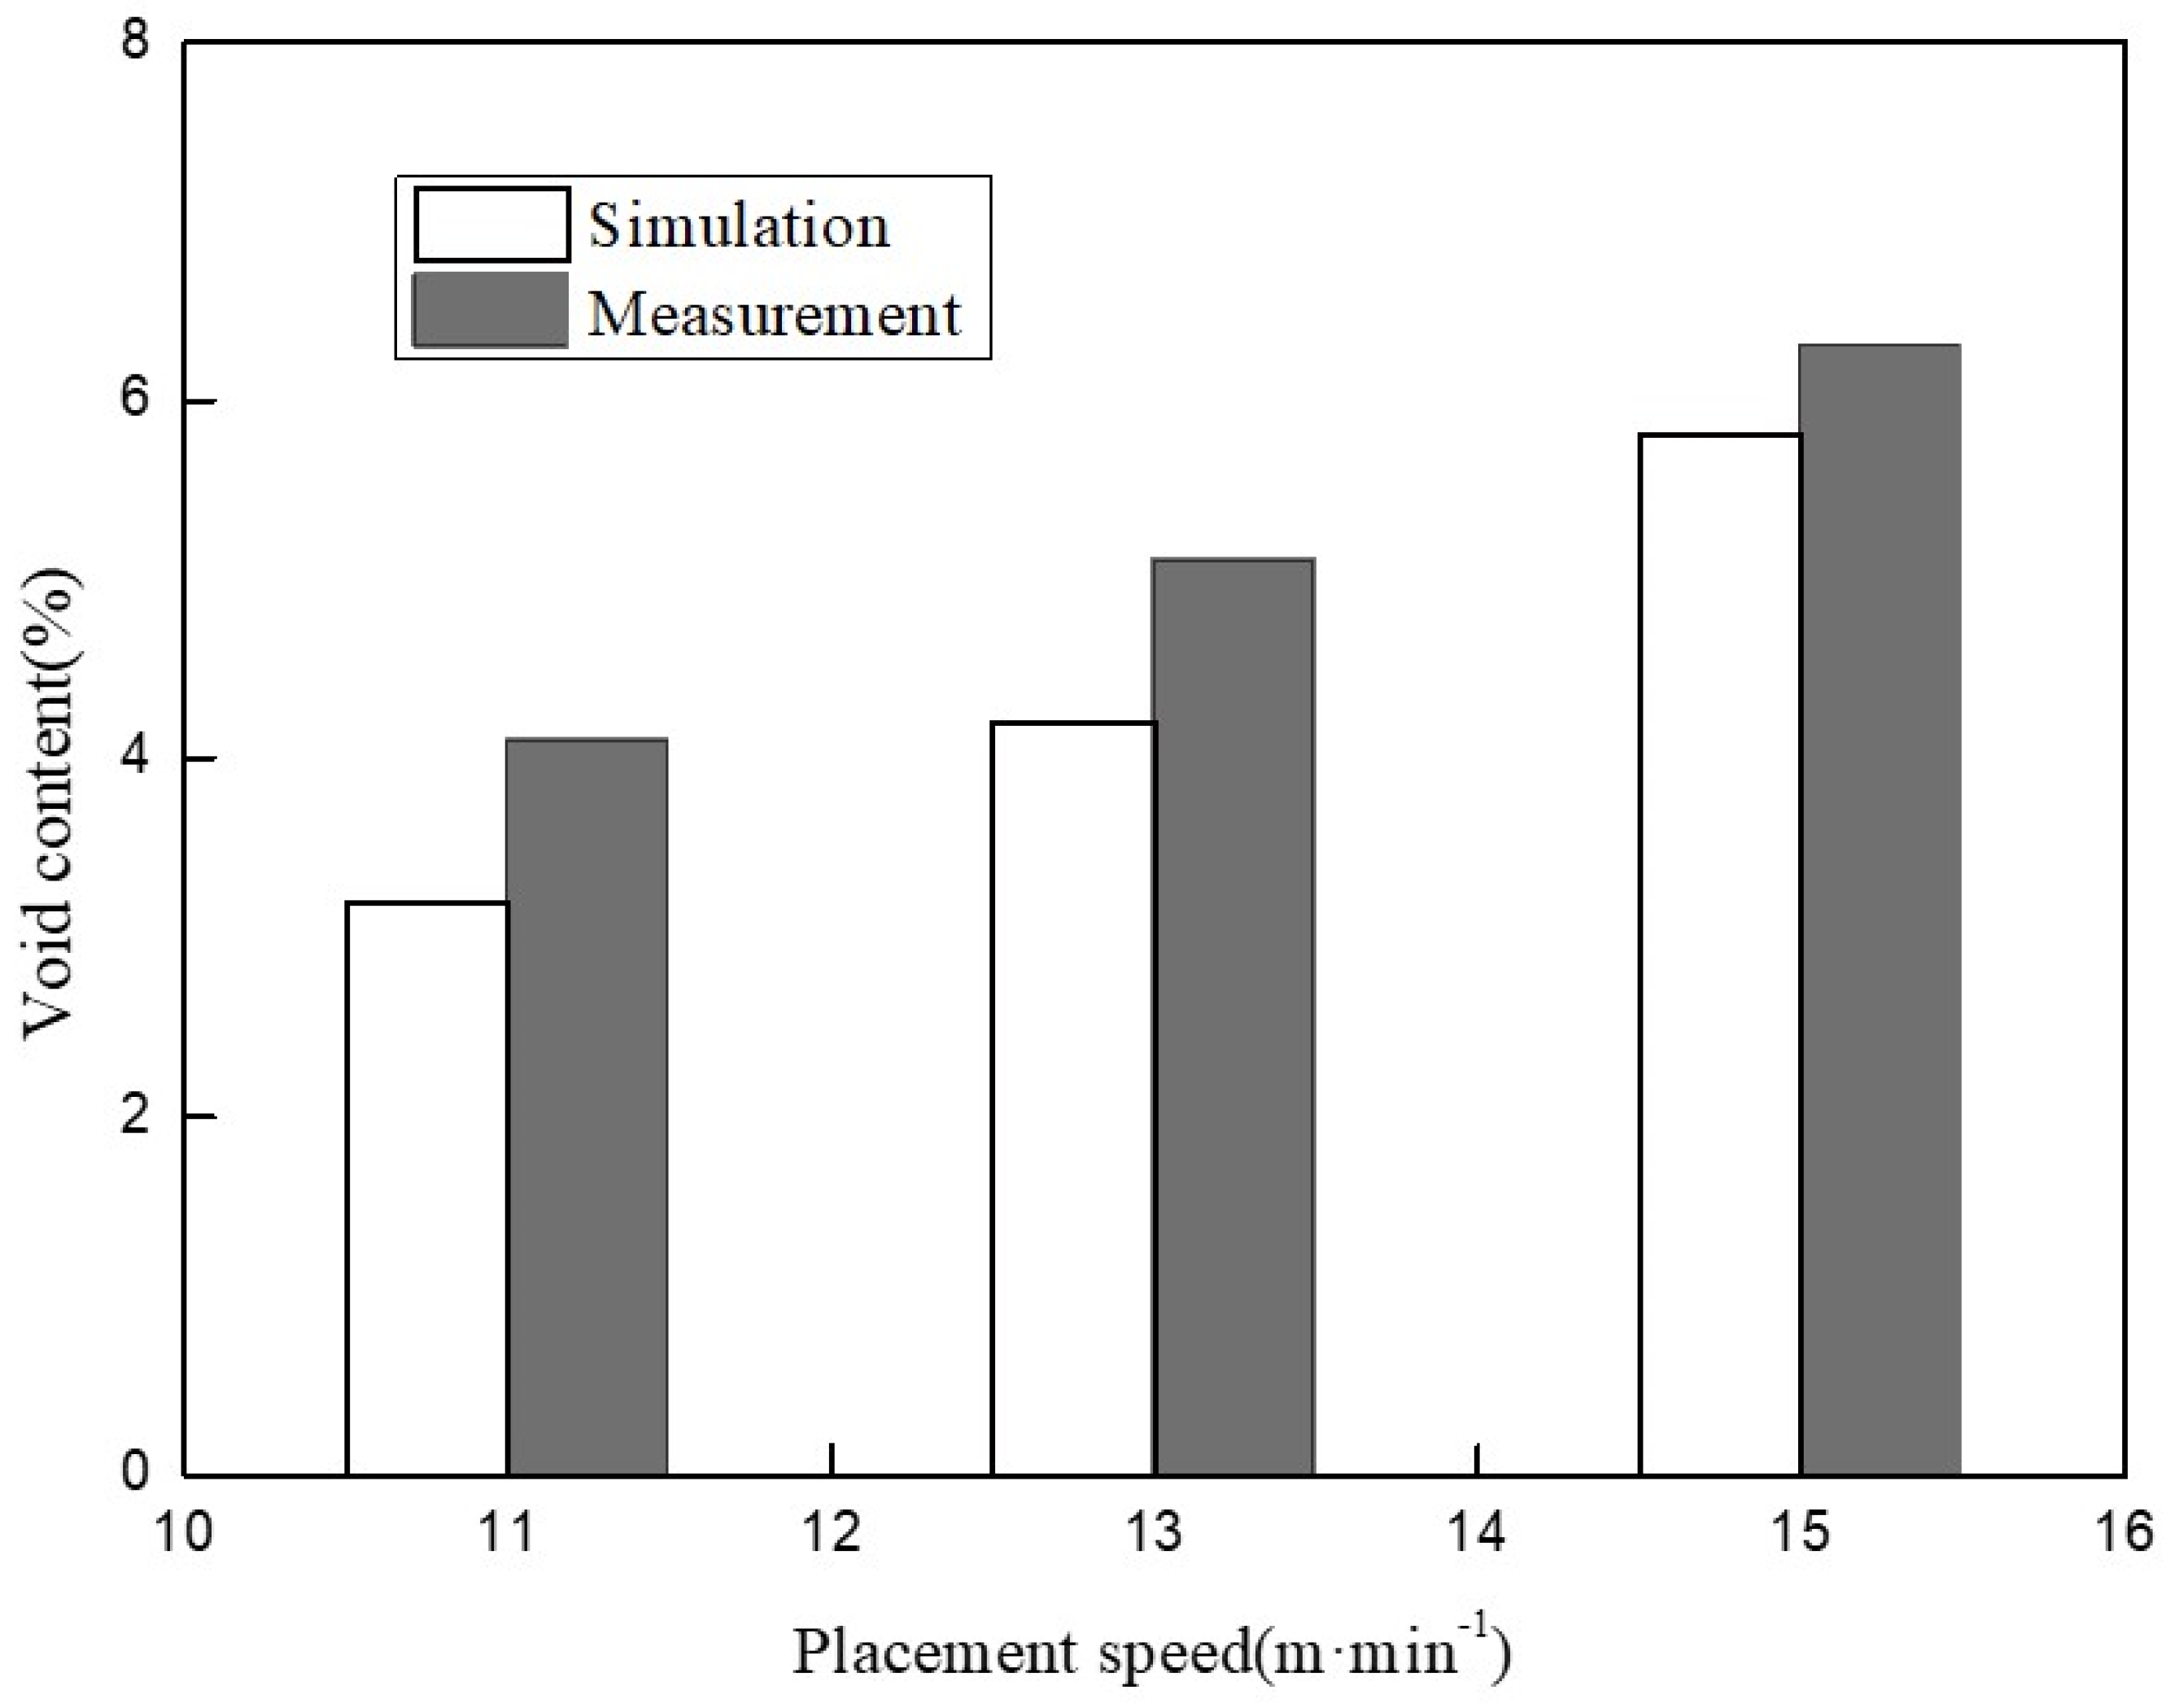
4.2. Experimental Verification
5. Conclusions
Author Contributions
Funding
Institutional Review Board Statement
Informed Consent Statement
Data Availability Statement
Conflicts of Interest
References
- Han, Z.; Sun, S.; Li, W.; Zhao, Y.; Shao, Z. Experimental Study of the Effect of Internal Defects on Stress Waves during Automated Fiber Placement. Polymers 2018, 10, 413. [Google Scholar] [CrossRef] [PubMed] [Green Version]
- Sun, S.; Han, Z.; Fu, H.; Jin, H.; Dhupia, J.S.; Wang, Y. Defect Characteristics and Online Detection Techniques During Manufacturing of FRPs Using Automated Fiber Placement: A Review. Polymers 2020, 12, 1337. [Google Scholar] [CrossRef] [PubMed]
- Sebaey, T.A.; Bouhrara, M.; O’Dowd, N. Fibre Alignment and Void Assessment in Thermoplastic Carbon Fibre Reinforced Polymers Manufactured by Automated Tape Placement. Polymers 2021, 13, 473. [Google Scholar] [CrossRef] [PubMed]
- Boon, Y.D.; Joshi, S.C.; Bhudolia, S.K. Review: Filament Winding and Automated Fiber Placement with In Situ Consolidation for Fiber Reinforced Thermoplastic. Polymer Composites. Polymers 2021, 13, 1951. [Google Scholar] [CrossRef] [PubMed]
- Xiao, R.; Shi, J.; Xiao, J. Study of Allowable Interlaminar Normal Stress Based on the Time–Temperature Equivalence Principle in Automated Fiber Placement Process. Polymers 2021, 13, 4180. [Google Scholar] [CrossRef]
- Comer, A.J.; Ray, D.; Obande, W.O.; Jones, D.; Lyons, J.; Rosca, I.; Higgins, R.M.O.; McCarthy, M.A. Mechanical characterisation of carbon fibre-PEEK manufactured by laser-assisted automated-tape-placement and autoclave. Compos. Part A Appl. Sci. Manuf. 2015, 69, 10–20. [Google Scholar] [CrossRef]
- Grouve, W.J.B.; Warnet, L.; Rietman, B.; Visser, R.; Akkerman, R. Optimization of the tape placement process parameters for carbon-PPS composites. Compos. Part A Appl. Sci. Manuf. 2013, 50, 44–53. [Google Scholar] [CrossRef]
- Negin, A.; Cedric, C.; John, G.; David, R.M.; Natalie, L.J. Transmission laser welding of amorphous and semi-crystalline poly-ether-ether-ketone for applications in the medical device industry. Mater. Des. 2010, 31, 4823–4830. [Google Scholar]
- Qureshi, Z.; Swait, T.; Scaife, R.; El-Dessouky, H. In situ consolidation of thermoplastic prepreg tape using automated tape placement technology: Potential and possibilities. Compos. Part B Eng. 2014, 66, 255–267. [Google Scholar] [CrossRef]
- Bhandari, S. Feasibility of Using 3D Printed Molds for Thermoforming Thermoplastic Composites. Master’s Thesis, The University of Maine, Orono, ME, USA, 2017. [Google Scholar]
- Ebrahim, O.; Ulf, G.B.G.P. Porosity analysis of carbon fibre-reinforced polymer laminates manufactured using automated fibre placement. J. Mater. Res. Technol. 2020, 54, 1217–1231. [Google Scholar]
- Eichenhofer, M.; Wong, J.C.H.; Ermanni, P. Exploiting cyclic softening in continuous lattice fabrication for the additive manufacturing of high performance fibre-reinforced thermoplastic composite materials. Compos. Sci. Technol. 2018, 164, 248–259. [Google Scholar] [CrossRef]
- Showaib, E.A.; Elsheikh, A.H. Effect of surface preparation on the strength of vibration welded butt joint made from PBT composite. Polymer Test. 2020, 83, 106319. [Google Scholar] [CrossRef]
- Elsheikh, A.H.; Elaziz, M.A.; Ramesh, B.; Egiza, M.; Al-Qaness, M.A. Modeling of drilling process of GFRP composite using a hybrid random vector functional link network/parasitism-predation algorithm. J. Mater. Res. Technol. 2021, 14, 298–311. [Google Scholar] [CrossRef]
- Kamal, A.; Ashmawy, M.S.S.; Algazzar, A.M.; Elsheikh, A.H. Fabrication techniques of polymeric nanocomposites: A comprehensive review. Proc. Inst. Mech. Eng. Part C Ournal Mech. Eng. Sci. 2021, 1, 1–19. [Google Scholar] [CrossRef]
- Stelea, L.; Filip, I.; Lisa, G.; Ichim, M.; Drobotă, D.; Sava, C.; Augustin, M. Characterisation of Hemp Fibres Reinforced Composites Using Thermoplastic Polymers as Matrices. Polymers 2022, 14, 481. [Google Scholar] [CrossRef]
- Zhi, Q.; Li, Y.; Shu, P.; Tan, X.; Tan, C.; Liu, Z. Double-Pulse UltrasonicWelding of Carbon-Fiber-Reinforced Polyamide 66 Composite. Polymers 2022, 14, 714. [Google Scholar] [CrossRef]
- Guessasma, S.; Abouzaid, K.; Belhabib, S.; Bassir, D.; Nouri, H. Interfacial Behaviour in Polymer Composites Processed Using Droplet-Based Additive Manufacturing. Polymers 2022, 14, 1013. [Google Scholar] [CrossRef]
- Dilimulati, A.; Duan, Y.-G.; Li, D.-C.; Lu, Z.L. Overview of In-situ Curing Manufacturing Technology for Resin Matrix Composites. J. Mater. Eng. 2011, 2011, 84–90. [Google Scholar]
- Lee, K.-S.; Shin, M.-S.; Lee, J.-Y.; Ryu, J.-J.; Shin, S.-W. Shear bond strength of composite resin to high performance polymer PEKK according to surface treatments and bonding materials. J. Adv. Prosthodont. 2017, 9, 350–357. [Google Scholar] [CrossRef] [Green Version]
- Rizzolo, R.H.; Walczyk, D.F. Ultrasonic consolidation of thermoplastic composite prepreg for automated fiber placement. J. Thermoplast. Compos. Mater. 2016, 29, 1480–1497. [Google Scholar] [CrossRef]
- Shadmehri, F.; Hoa, S.V.; Fortin-Simpson, J.; Ghayoor, H. Effect of in situ treatment on the quality of flat thermoplastic composite plates made by automated fiber placement (AFP). Adv. Manuf. Polym. Compos. Sci. 2018, 4, 41–47. [Google Scholar] [CrossRef] [Green Version]
- Dell’Anna, R.; Lionetto, F.; Montagna, F.; Maffezzoli, A. Lay-Up and Consolidation of a Composite Pipe by In Situ Ultrasonic Welding of a Thermoplastic Matrix Composite Tape. Materials 2018, 11, 786. [Google Scholar] [CrossRef] [PubMed] [Green Version]
- Patoua, J.; Bonnairea, R.; Luyckerb, E.D. Influence of consolidation process on voids and mechanical properties of powdered and commingled carbon/PPS laminates. Compos. Part A 2019, 117, 260–275. [Google Scholar] [CrossRef] [Green Version]
- Miao, Q.; Dai, Z.; Ma, G.; Niu, F.; Wu, D. Effect of consolidation force on interlaminar shear strength of CF/PEEK laminates manufactured by laser-assisted forming. Compos. Struct. 2021, 266, 113779. [Google Scholar] [CrossRef]
- Oromiehie, E.; Gain, A.K.; Donough, M.J. Fracture toughness assessment of CF-PEEK composites consolidated using hot gas torch assisted automated fibre placement. Compos. Struct. 2022, 279, 114762. [Google Scholar] [CrossRef]
- He, Q.H.; Wang, H.J.; Fu, K.K. 3D printed continuous CF/PA6 composites: Effect of microscopic voids on mechanical performance. Compos. Sci. Technol. 2020, 191, 108077. [Google Scholar] [CrossRef]
- Kumar, V.; Alweka, S.P.; Kunc, V. High-performance molded composites using additively manufactured preforms with controlled fiber and pore morphology. Addit. Manuf. 2021, 37, 101733. [Google Scholar] [CrossRef]
- Liu, Z.; Lei, Y.; Zhang, X. Effect Mechanism and Simulation of Voids on Hygrothermal Performances of Composites. Polymers 2022, 14, 901. [Google Scholar] [CrossRef]
- Clancy, J.G.; Peeters, D.; Oliveri, V.; Jones, D.; O’Higgins, R.M.; Weaver, P.M. A study of the influence of processing parameters on steering of carbon Fibre/PEEK tapes using laser-assited tape placement. Compos. Part B Eng. 2019, 163, 243–251. [Google Scholar] [CrossRef]
- Balasubramanyam, R.; Jones, R.S.; Wheeler, A.B. Modelling transverse flows of reinforced thermoplastic composite materials. Composites 1989, 20, 33–37. [Google Scholar] [CrossRef]
- Barnes, J.A.; Cogswell, F.N. Transverse flow processes in continuous fibre reinforced thermoplastic composites. Composites 1989, 20, 38–42. [Google Scholar] [CrossRef]
- Tierney, J.; Gillespie, J.W. Modelling of in situ strength development for thermoplastic composites tow placement process. J. Compos. Mater. 2006, 40, 1487–1506. [Google Scholar] [CrossRef]
- Khan, M.A.; Mitschang, P.; Schledjewski, R. Tracing the void content development and identifi cation of its effecting parameters during in situ consolidation of thermoplastic tape material. Polym. Polym. Compos. 2010, 18, 1–15. [Google Scholar]
- Song, Q.; Liu, W.; Liu, X.; Liu, K.; Yang, Y.; Chen, J. Interlaminar bonding strength for thermoplastic composite in an in-situ consolidation process. Acta Aeronaut. Astronaut. Sin. 2019, 40, 259–267. [Google Scholar]
- Barone, J.R.; Schmidt, W.F.; Liebner, C.F.E. Compounding and molding of polyethylene composites reinforced with keratin feather fiber. Compos. Sci. Technol. 2005, 65, 683–692. [Google Scholar] [CrossRef]
- Song, Q.; Liu, W.; Chen, J.; Liu, K.; Yang, Y. Temperature field for laser heating of carbon fiber reinforced polyphenyl sulphide matrix composite in an automated fiber placement process. Acta Mater. Compos. Sin. 2019, 36, 283–292. [Google Scholar]


| Parameters | Symbol | Value |
|---|---|---|
| Number of layers | 6 | |
| Compaction pressure, N | 500–1000 | |
| Density of prepreg, g·cm−3 | 1.62 |
| No. | Placement Speed (m·min−1) | Laser Power (kW) | Pressure (N) |
|---|---|---|---|
| 1 | 11 | 6 | 1000 |
| 2 | 13 | 6 | 1000 |
| 3 | 15 | 6 | 1000 |
Publisher’s Note: MDPI stays neutral with regard to jurisdictional claims in published maps and institutional affiliations. |
© 2022 by the authors. Licensee MDPI, Basel, Switzerland. This article is an open access article distributed under the terms and conditions of the Creative Commons Attribution (CC BY) license (https://creativecommons.org/licenses/by/4.0/).
Share and Cite
Song, Q.; Liu, W.; Chen, J.; Zhao, D.; Yi, C.; Liu, R.; Geng, Y.; Yang, Y.; Zheng, Y.; Yuan, Y. Research on Void Dynamics during In Situ Consolidation of CF/High-Performance Thermoplastic Composite. Polymers 2022, 14, 1401. https://doi.org/10.3390/polym14071401
Song Q, Liu W, Chen J, Zhao D, Yi C, Liu R, Geng Y, Yang Y, Zheng Y, Yuan Y. Research on Void Dynamics during In Situ Consolidation of CF/High-Performance Thermoplastic Composite. Polymers. 2022; 14(7):1401. https://doi.org/10.3390/polym14071401
Chicago/Turabian StyleSong, Qinghua, Weiping Liu, Jiping Chen, Dacheng Zhao, Cheng Yi, Ruili Liu, Yi Geng, Yang Yang, Yizhu Zheng, and Yuhui Yuan. 2022. "Research on Void Dynamics during In Situ Consolidation of CF/High-Performance Thermoplastic Composite" Polymers 14, no. 7: 1401. https://doi.org/10.3390/polym14071401
APA StyleSong, Q., Liu, W., Chen, J., Zhao, D., Yi, C., Liu, R., Geng, Y., Yang, Y., Zheng, Y., & Yuan, Y. (2022). Research on Void Dynamics during In Situ Consolidation of CF/High-Performance Thermoplastic Composite. Polymers, 14(7), 1401. https://doi.org/10.3390/polym14071401